40
Tropical Cyclone Tropical Cyclone Information Processing Information Processing System (TIPS) System (TIPS) Li Yuet Sim Hong Kong Observatory May 2009
| Date post: | 17-Jan-2016 |
| Category: |
Documents |
| Upload: | dorothy-maxwell |
| View: | 221 times |
| Download: | 0 times |
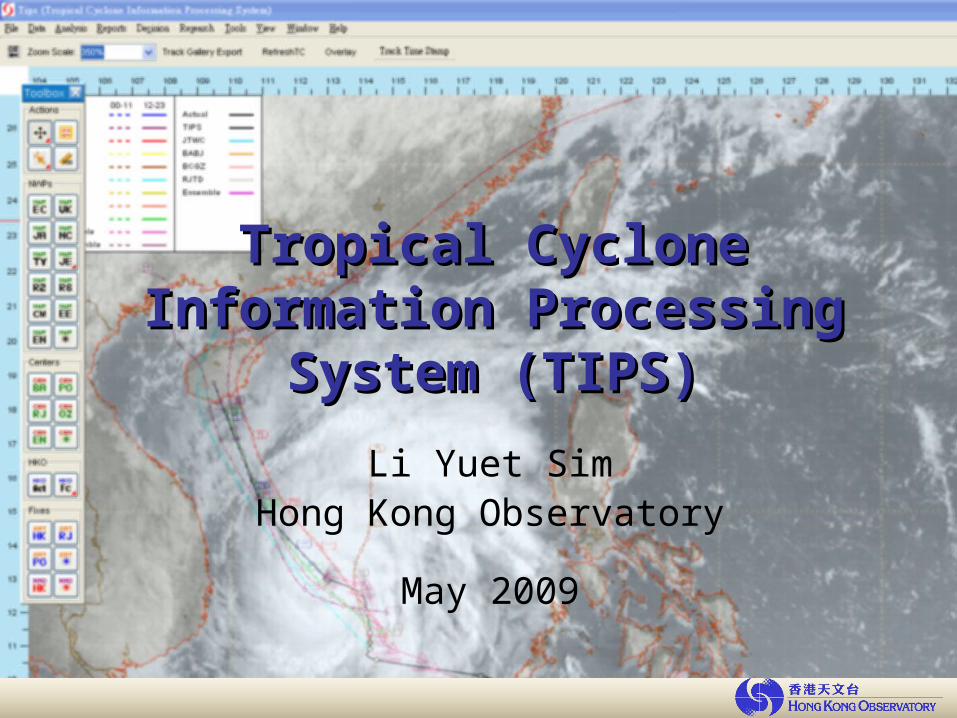
Tropical Cyclone Information Tropical Cyclone Information Processing System (TIPS)Processing System (TIPS)
Li Yuet SimHong Kong Observatory
May 2009
Major FunctionsMajor Functions
• Integrate all TC related information and data
• Assimilate TC track data for computation of an ensemble track for operational forecasting
• Compute key parameters for evaluating local impact to facilitate warning decisions
• Generate and dispatch forecast and warning products to the local public and other weather centres
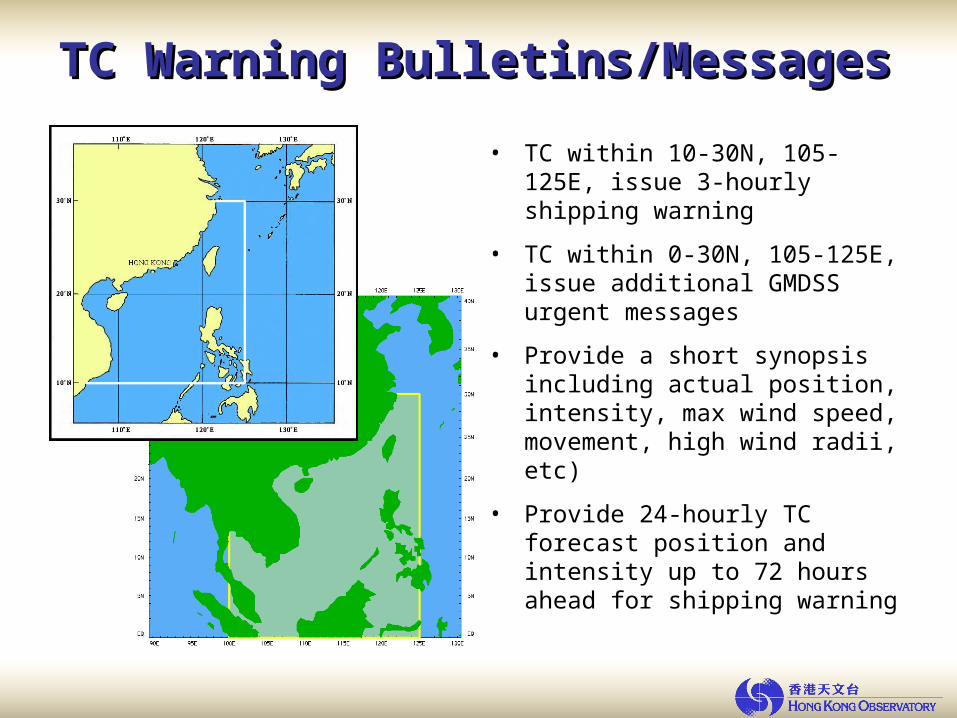
TC Warning Bulletins/MessagesTC Warning Bulletins/Messages
• TC within 10-30N, 105-125E, issue 3-hourly shipping warning
• TC within 0-30N, 105-125E, issue additional GMDSS urgent messages
• Provide a short synopsis including actual position, intensity, max wind speed, movement, high wind radii, etc)
• Provide 24-hourly TC forecast position and intensity up to 72 hours ahead for shipping warning

TROPICAL CYCLONE WARNING (sample 3-hrly shipping warning bulletin)
AT 142100 UTC, SEVERE TROPICAL STORM SINLAKU (0813) WITH CENTRAL PRESSURE 975 HECTOPASCALS WAS CENTRED WITHIN 60 NAUTICAL MILES OF TWO SIX POINT ZERO DEGREES NORTH (26.0 N) ONE TWO ONE POINT ZERO DEGREES EAST (121.0 E) AND IS FORECAST TO MOVE EAST-NORTHEAST AT ABOUT 6 KNOTS FOR THE NEXT 24 HOURS.
MAXIMUM WINDS NEAR THE CENTRE ARE ESTIMATED TO BE 60 KNOTS.
RADIUS OF OVER 33 KNOT WINDS 120 NAUTICAL MILES.RADIUS OF OVER 47 KNOT WINDS 30 NAUTICAL MILES.RADIUS OF OVER 2 METRE WAVES 210 NAUTICAL MILES.
FORECAST POSITION AND INTENSITY AT 152100 UTCTWO SEVEN POINT ONE DEGREES NORTH (27.1 N)ONE TWO THREE POINT TWO DEGREES EAST (123.2 E)MAXIMUM WINDS 60 KNOTS.
FORECAST POSITION AND INTENSITY AT 162100 UTCTWO EIGHT POINT THREE DEGREES NORTH (28.3 N)ONE TWO SIX POINT ZERO DEGREES EAST (126.0 E)MAXIMUM WINDS 50 KNOTS.
FORECAST POSITION AND INTENSITY AT 172100 UTCTWO NINE POINT THREE DEGREES NORTH (29.3 N)ONE TWO EIGHT POINT ONE DEGREES EAST (128.1 E)MAXIMUM WINDS 45 KNOTS.
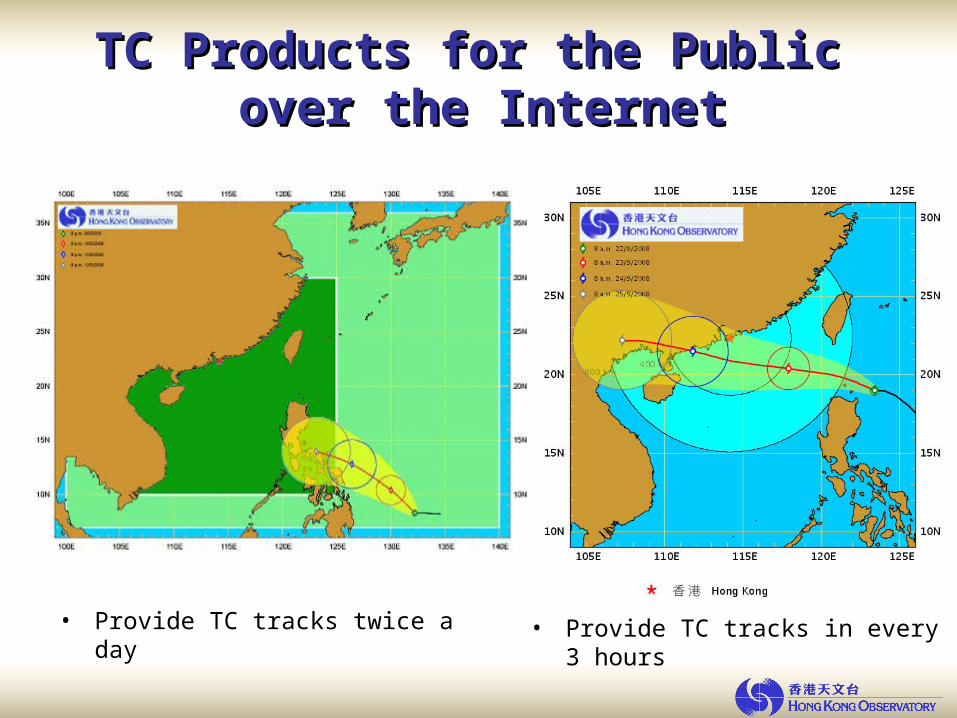
TC Products for the Public TC Products for the Public over the Internetover the Internet
• Provide TC tracks twice a day • Provide TC tracks in every 3 hours

System Design and Architecture System Design and Architecture of TIPSof TIPS
• Client-server architecture
• Programming language – Java

Data sourcesData sources
• Subjective forecast positions from HKO and other meteorological centres
• TC analysis data, such as satellite and radar fixes
• NWP model forecast positions (HKO, CMA, JMA, ECMWF, UKMO and NCEP)
• Satellite and radar images

Major Features of TIPSMajor Features of TIPS
1.TC Analysis
2.TC Forecasting
3.Decision Support
4.Data for downstream systems
5.Past TC Track Display
6.Handy Tools
7.Online Help
Major Features of TIPSMajor Features of TIPS
1.TC Analysis
2.TC Forecasting
3.Decision Support
4.Data for downstream systems
5.Past TC Track Display
6.Handy Tools
7.Online Help
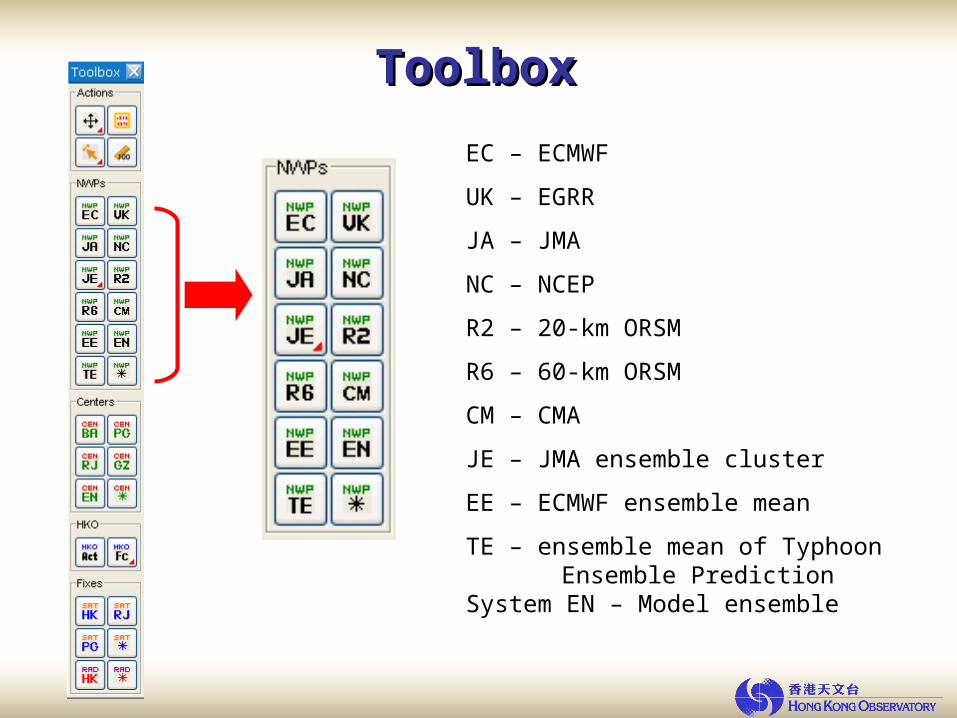
ToolboxToolbox
EC – ECMWF
UK – EGRR
JA – JMA
NC – NCEP
R2 – 20-km ORSM
R6 – 60-km ORSM
CM – CMA
JE – JMA ensemble cluster
EE – ECMWF ensemble mean
TE – ensemble mean of Typhoon Ensemble Prediction System
EN – Model ensemble
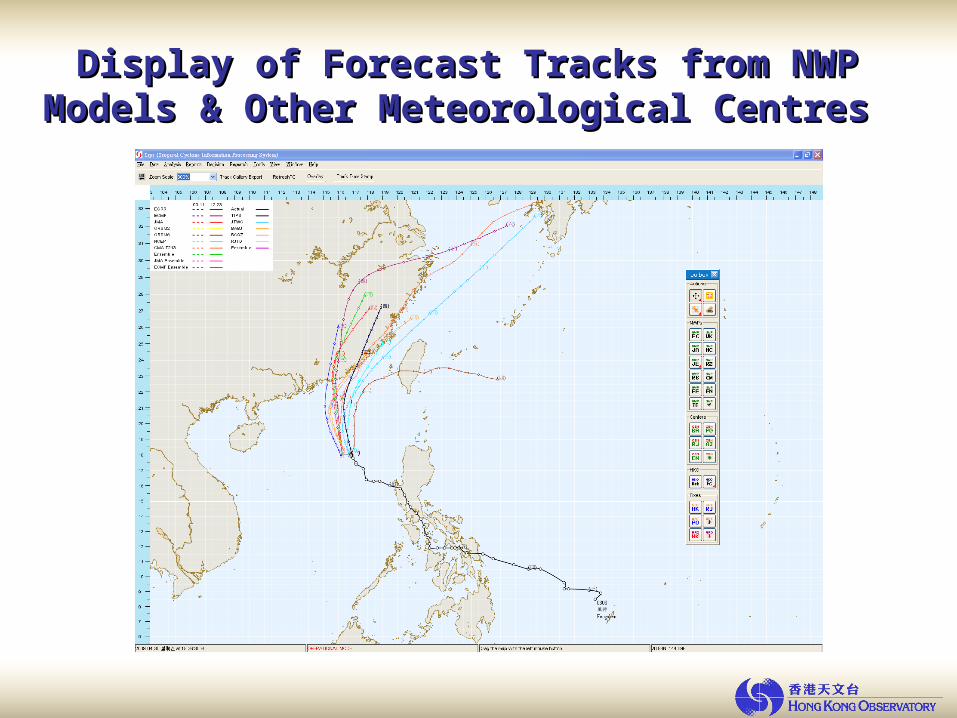
Display of Forecast Tracks from NWP Models & Display of Forecast Tracks from NWP Models & Other Meteorological Centres Other Meteorological Centres
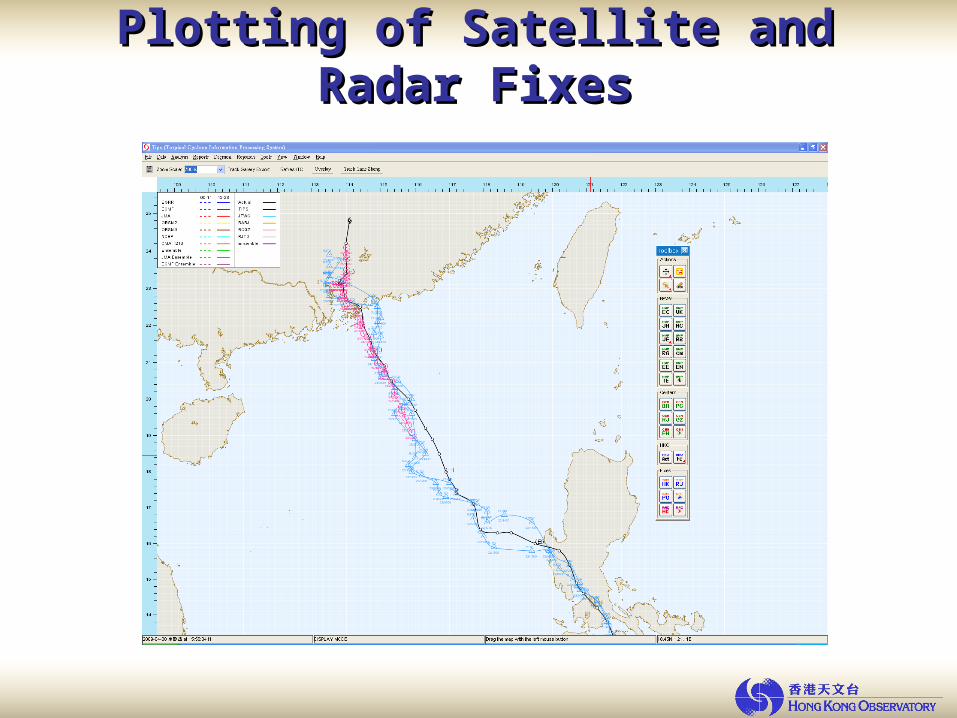
Plotting of Satellite and Radar FixesPlotting of Satellite and Radar Fixes

Overlaying of Satellite and Radar ImagesOverlaying of Satellite and Radar Images

Major Features of TIPSMajor Features of TIPS
1.TC Analysis
2.TC Forecasting
3.Decision Support
4.Data for downstream systems
5.Past TC Track Display
6.Handy Tools
7.Online Help
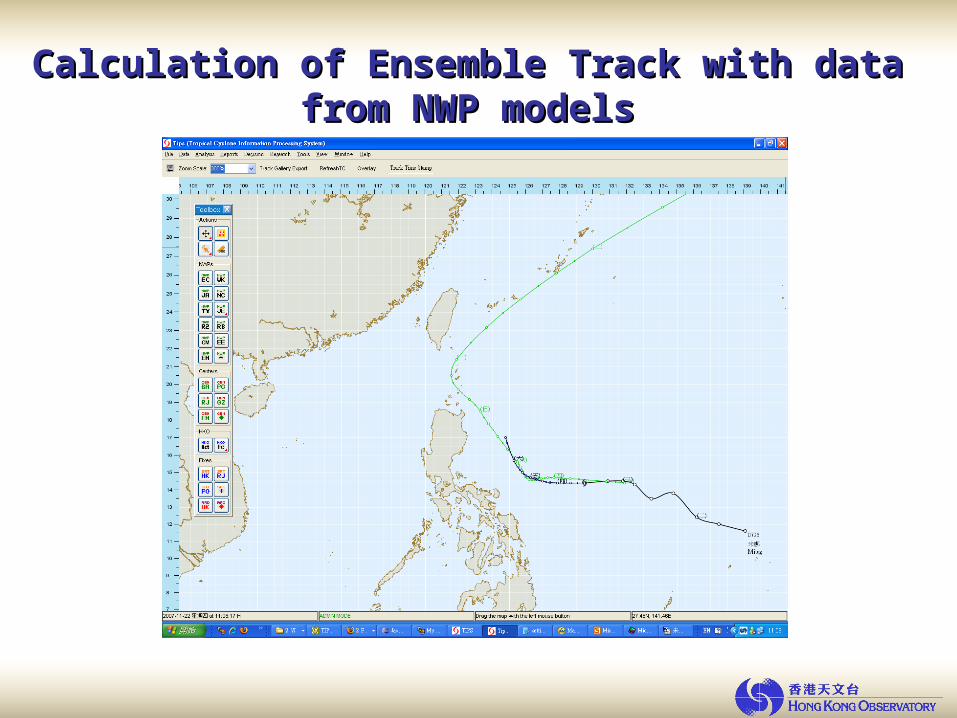
Calculation of Ensemble Track with data from Calculation of Ensemble Track with data from NWP modelsNWP models
Motion Vector Consensus
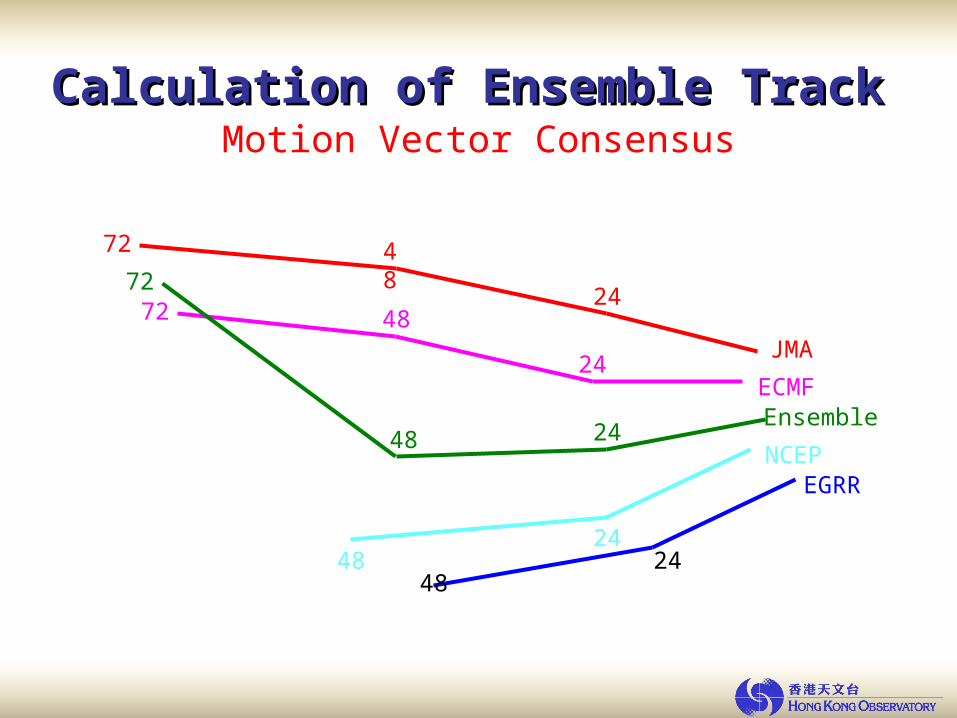
JMA
24
4872
ECMF24
4872
NCEP
2448
EGRR
2448
Ensemble2448
72
Calculation of Ensemble TrackCalculation of Ensemble Track

Motion Vector Consensus
JMA
24
4872
ECMF24
4872
NCEP
2448
EGRR
2448
Ensemble2448
Calculation of Ensemble TrackCalculation of Ensemble Track
72
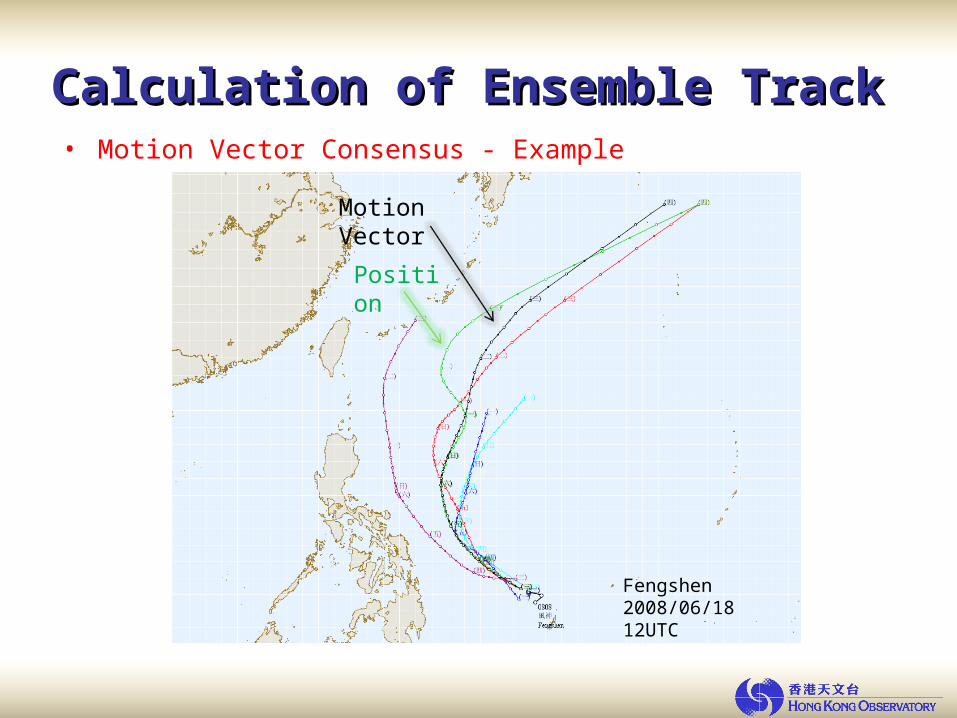
• Motion Vector Consensus - Example
Motion Vector
Position
Fengshen2008/06/18 12UTC
Calculation of Ensemble TrackCalculation of Ensemble Track
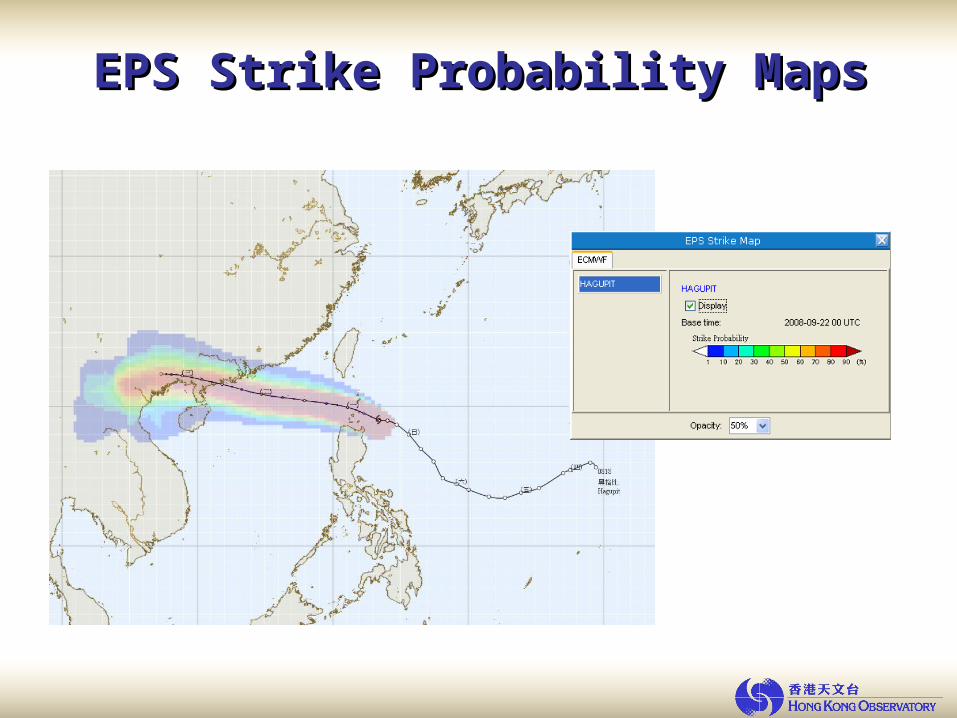
EPS Strike Probability MapsEPS Strike Probability Maps
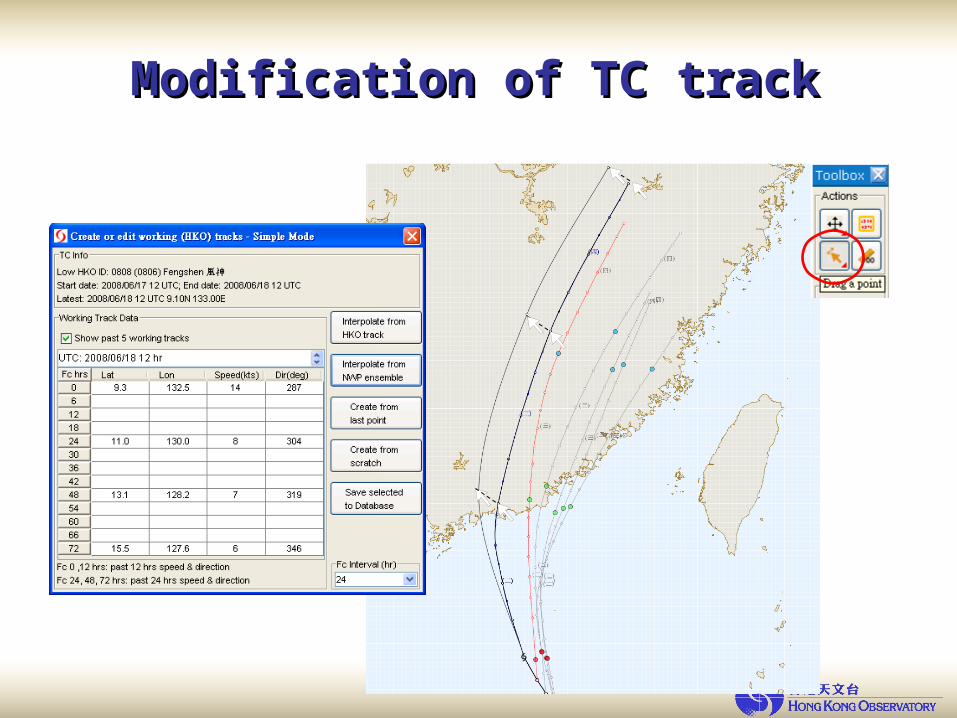
Modification of TC trackModification of TC track
Major Features of TIPSMajor Features of TIPS
1.TC Analysis
2.TC Forecasting
3.Decision Support
4.Data for downstream systems
5.Past TC Track Display
6.Handy Tools
7.Online Help

Decision SupportDecision SupportCritical information: distance and time of TC’s closest approach to HK, location and time of landfall, onset and cessation of strong and gale force winds, etc.
Probability contours of gale & strong winds
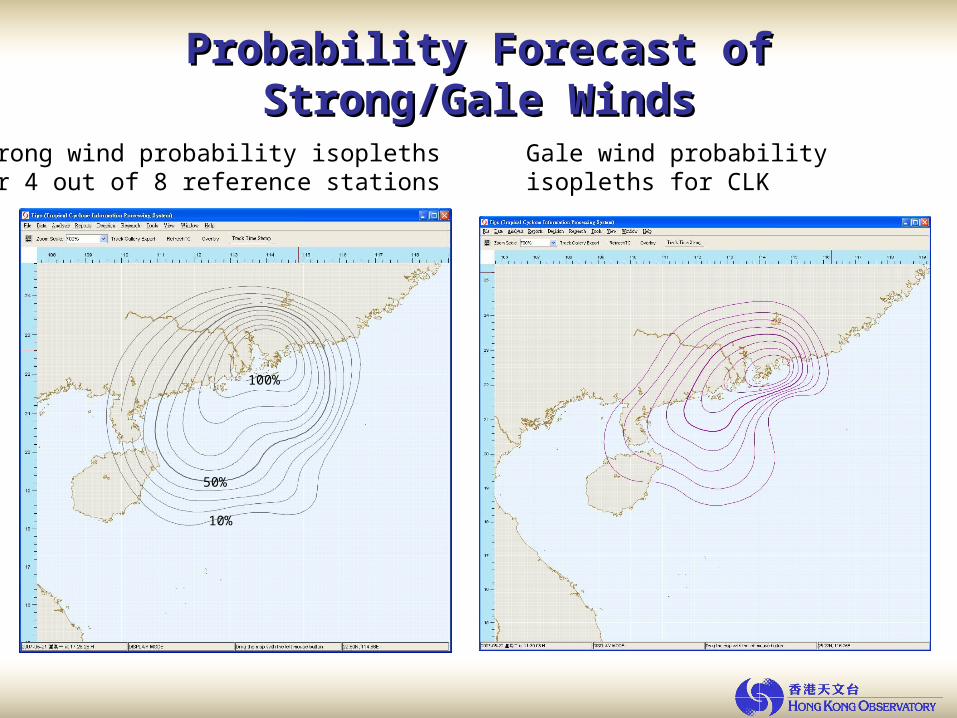
Probability Forecast of Strong/Gale WindsProbability Forecast of Strong/Gale Winds
Strong wind probability isopleths for 4 out of 8 reference stations
Gale wind probability isopleths for CLK
10%
100%
50%
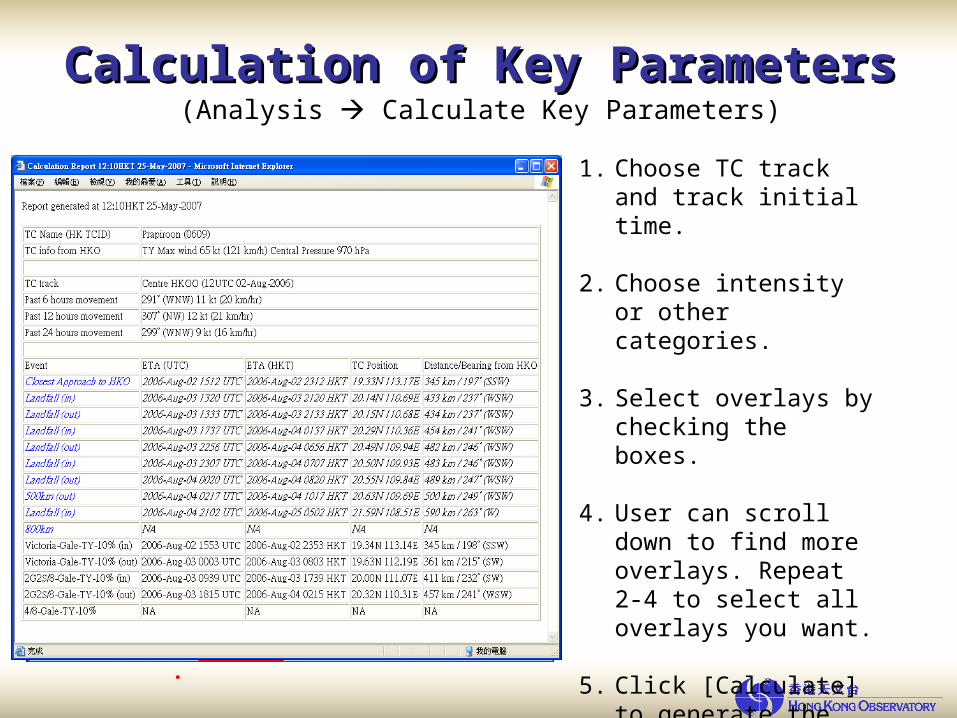
Calculation of Key ParametersCalculation of Key Parameters
1. Choose TC track and track initial time.
2. Choose intensity or other categories.
3. Select overlays by checking the boxes.
4. User can scroll down to find more overlays. Repeat 2-4 to select all overlays you want.
5. Click [Calculate] to generate the report
(Analysis Calculate Key Parameters)
1.
2.
3.
4.
5.
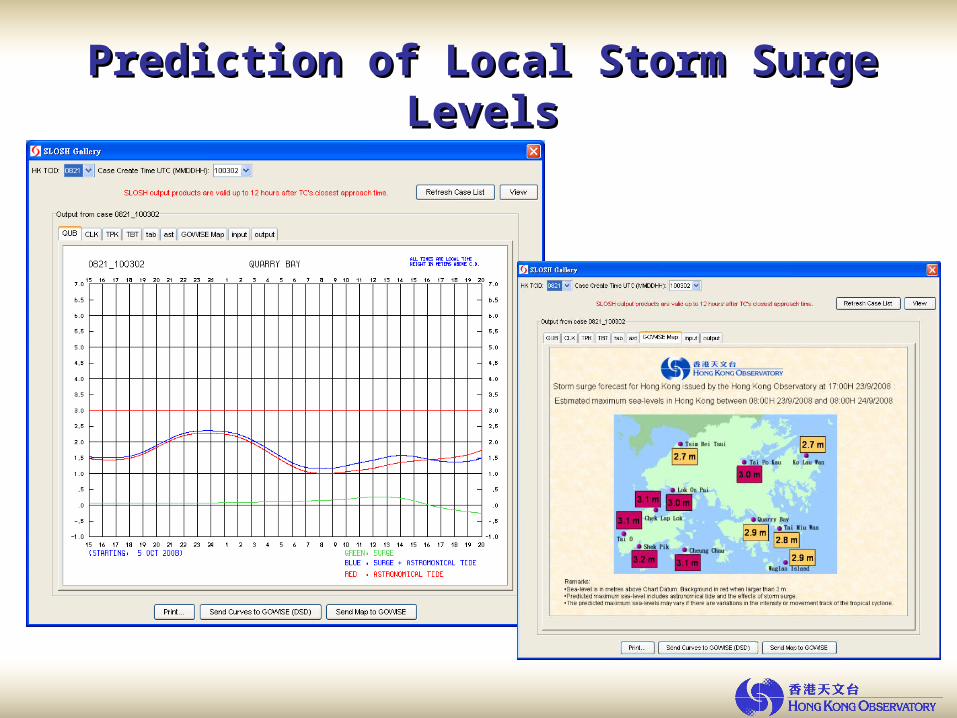
Prediction of Local Storm Surge LevelsPrediction of Local Storm Surge Levels
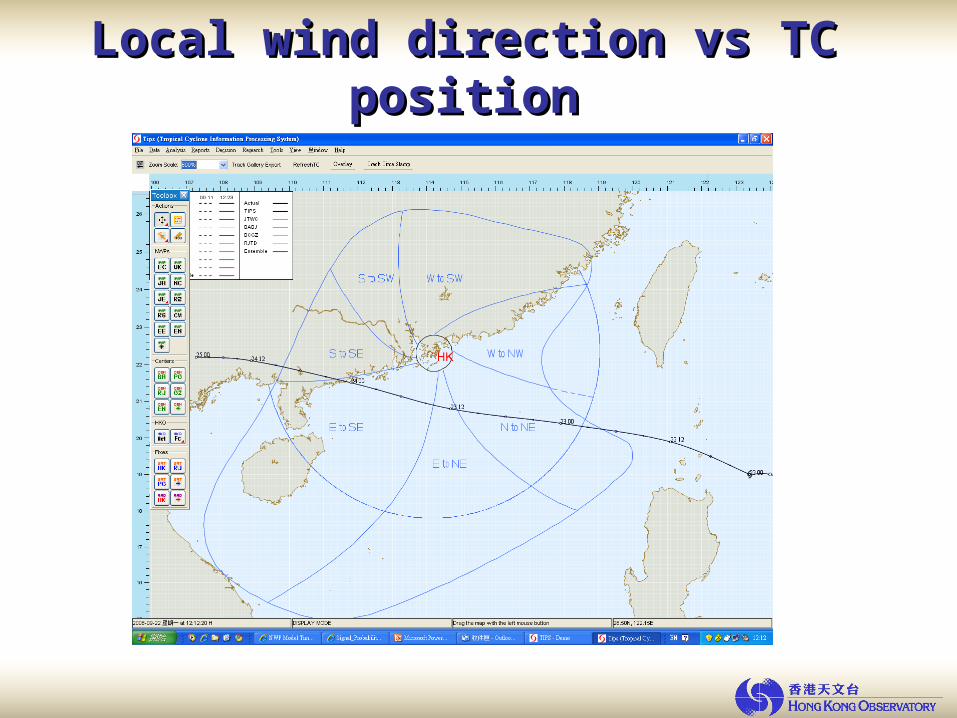
Local wind direction vs TC positionLocal wind direction vs TC position
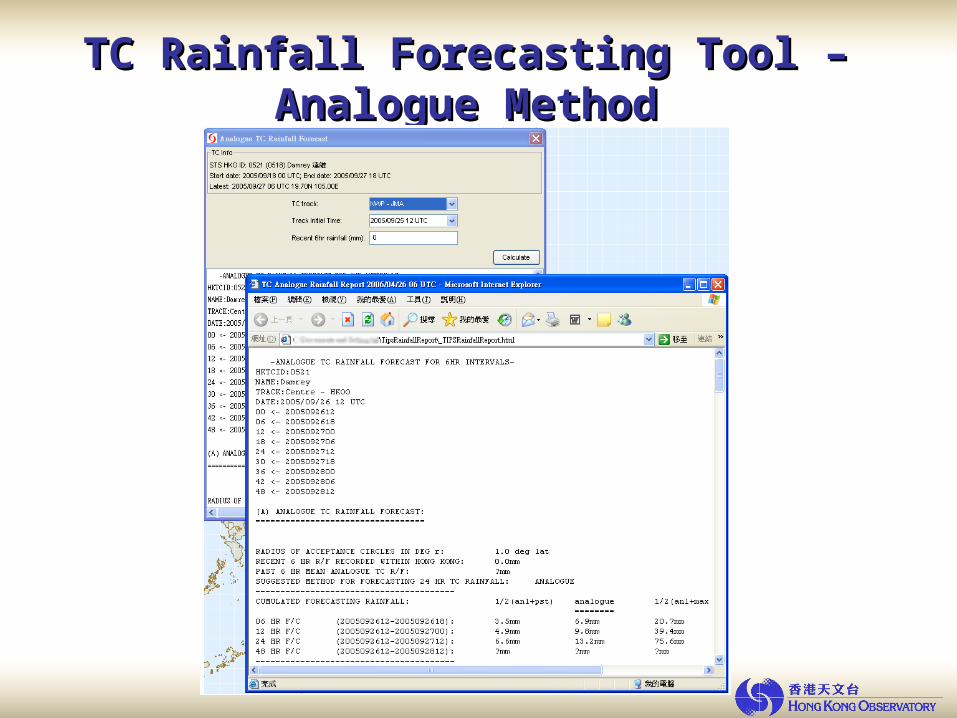
TC Rainfall Forecasting Tool – TC Rainfall Forecasting Tool – Analogue Method Analogue Method
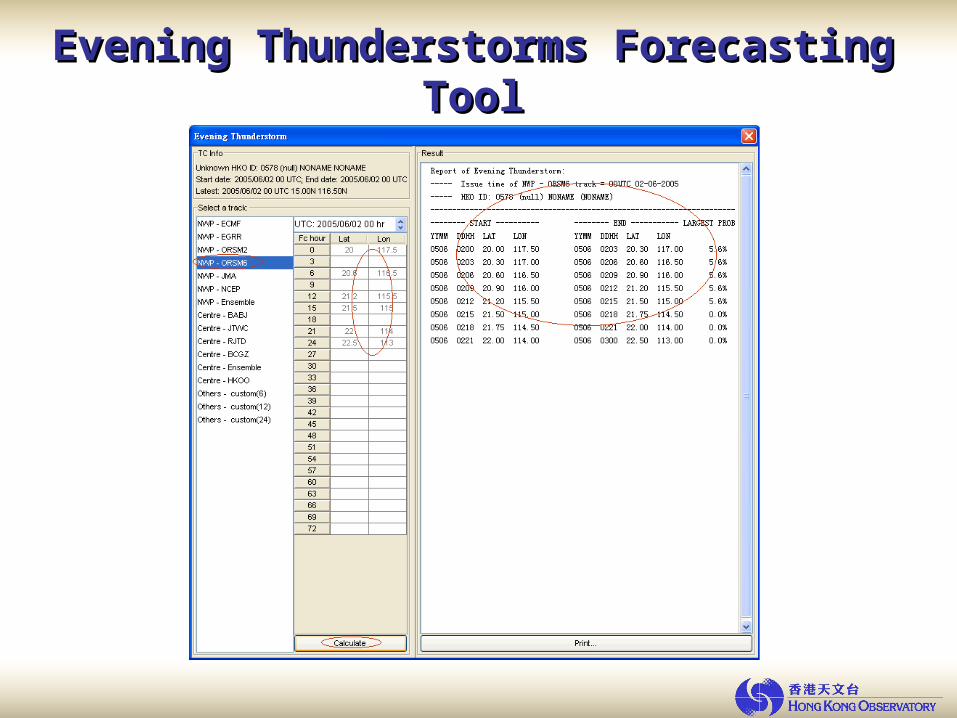
Evening Thunderstorms Forecasting ToolEvening Thunderstorms Forecasting Tool
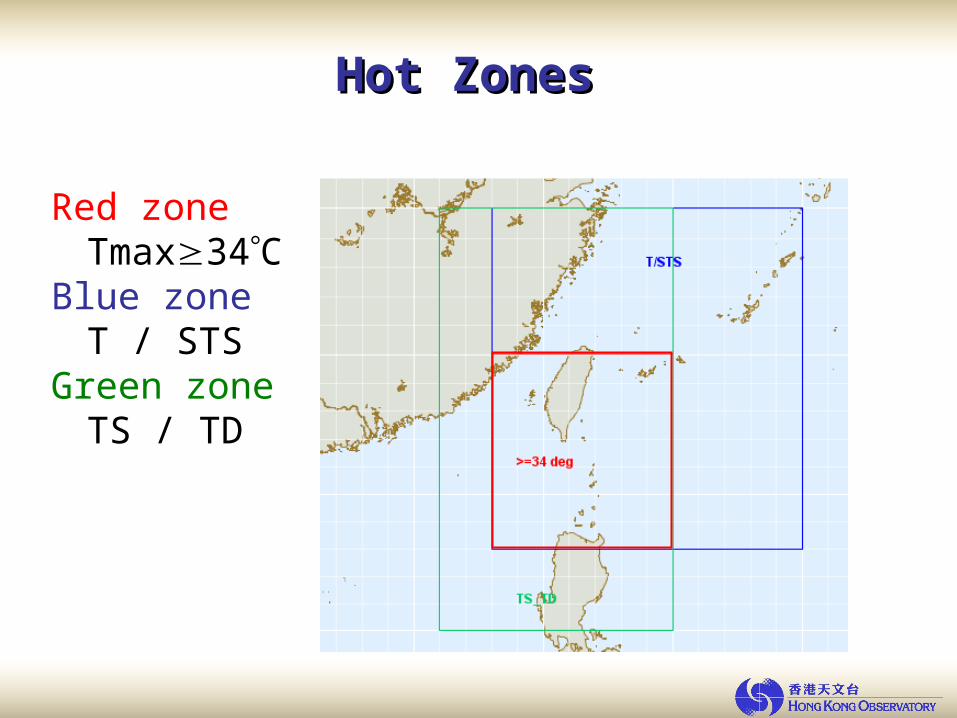
Hot ZonesHot Zones
Red zoneTmax34C
Blue zoneT / STS
Green zoneTS / TD
Major Features of TIPSMajor Features of TIPS
1.TC Analysis
2.TC Forecasting
3.Decision Support
4.Data for downstream systems
5.Past TC Track Display
6.Handy Tools
7.Online Help
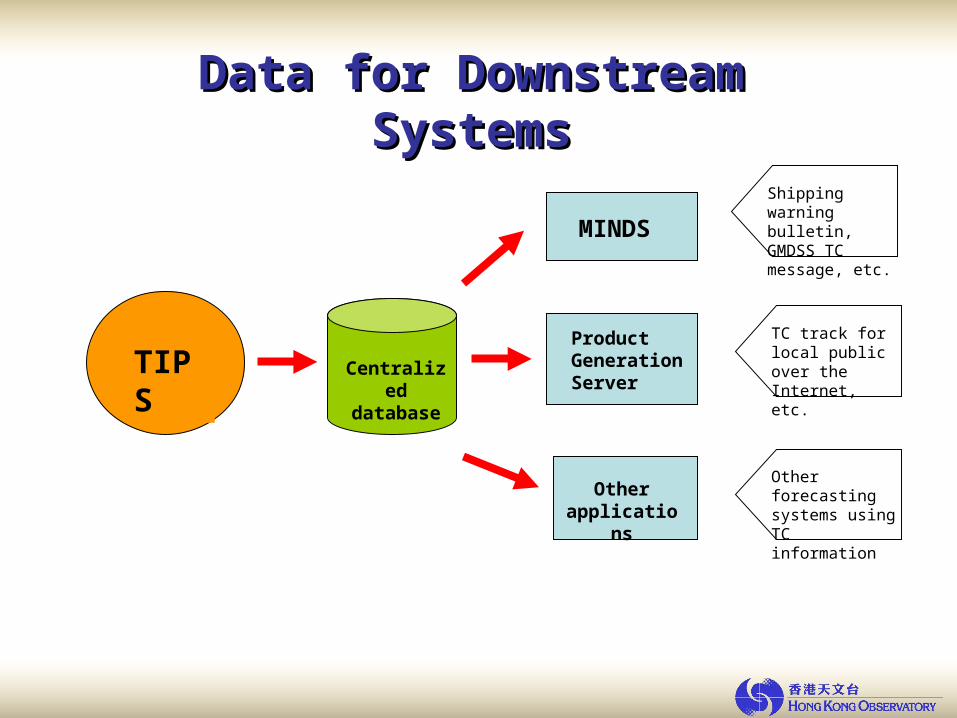
TIPS
Data for Downstream SystemsData for Downstream Systems
MINDS
Centralized database
Product Generation Server
Other applications
Shipping warning bulletin, GMDSS TC message, etc.
TC track for local public over the Internet, etc.
Other forecasting systems using TC information
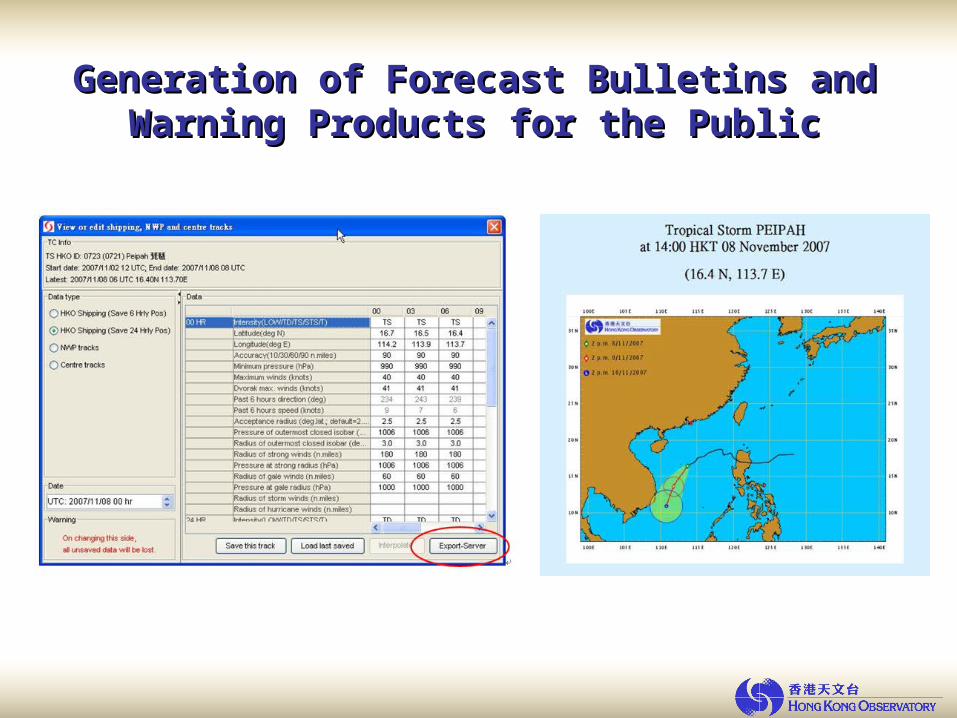
Generation of Forecast Bulletins and Warning Generation of Forecast Bulletins and Warning Products for the PublicProducts for the Public

Major Features of TIPSMajor Features of TIPS
1.TC Analysis
2.TC Forecasting
3.Decision Support
4.Data for downstream systems
5.Past TC Track Display
6.Handy Tools
7.Online Help
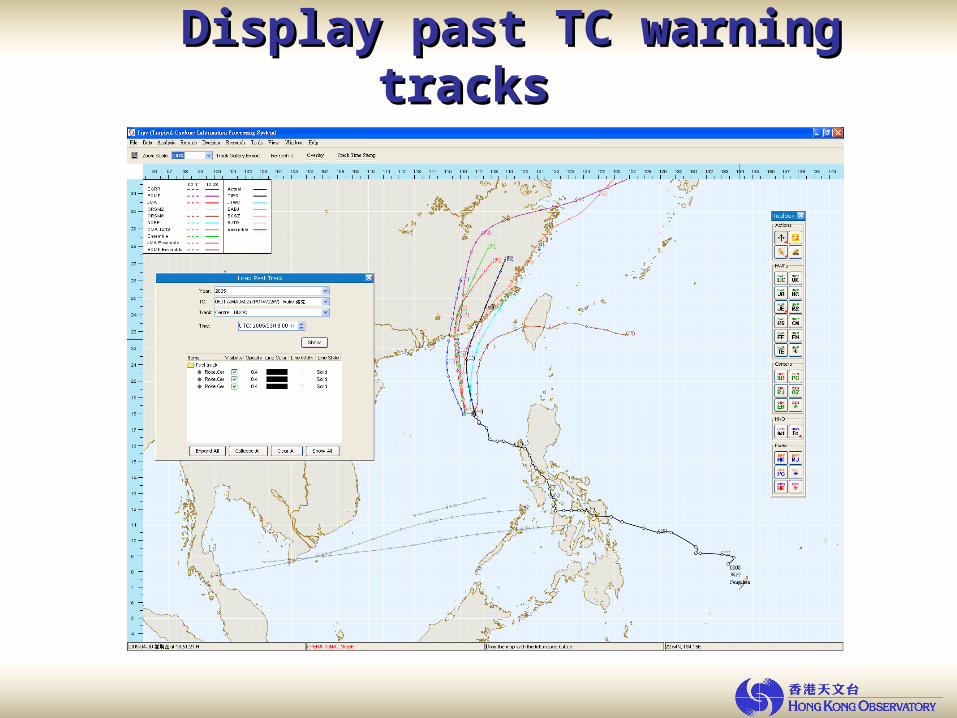
Display past TC warning tracksDisplay past TC warning tracks
Overlay Show Past Tracks
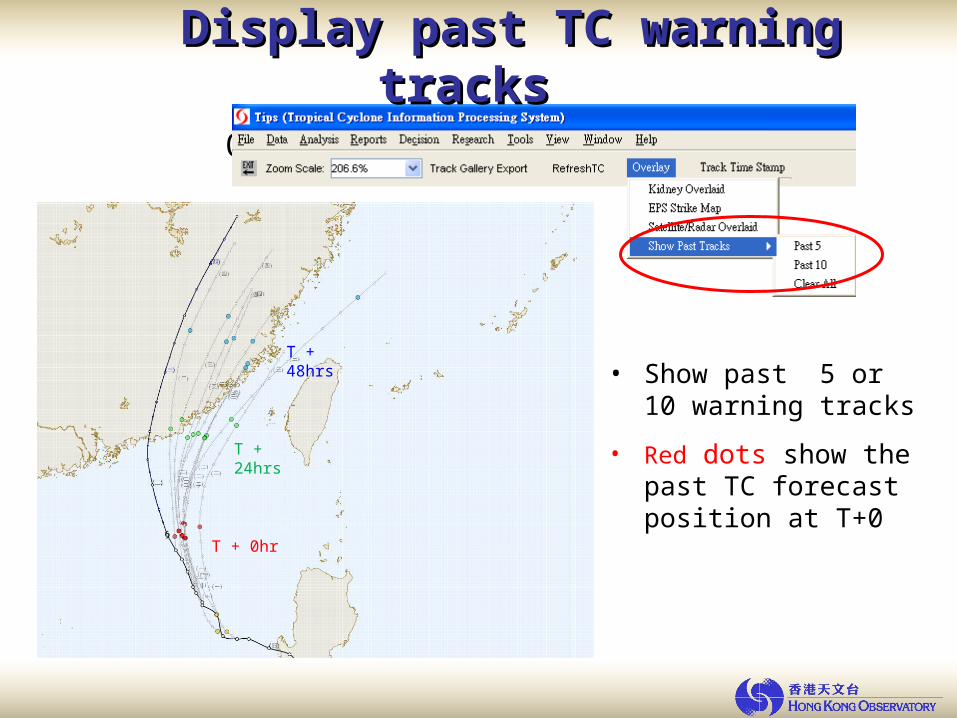
Display past TC warning tracksDisplay past TC warning tracks
• Show past 5 or 10 warning tracks
• Red dots show the past TC forecast position at T+0
T + 0hr
T + 24hrs
T + 48hrs
Major Features of TIPSMajor Features of TIPS
1.TC Analysis
2.TC Forecasting
3.Decision Support
4.Data for downstream systems
5.Past TC Track Display
6.Handy Tools
7.Online Help
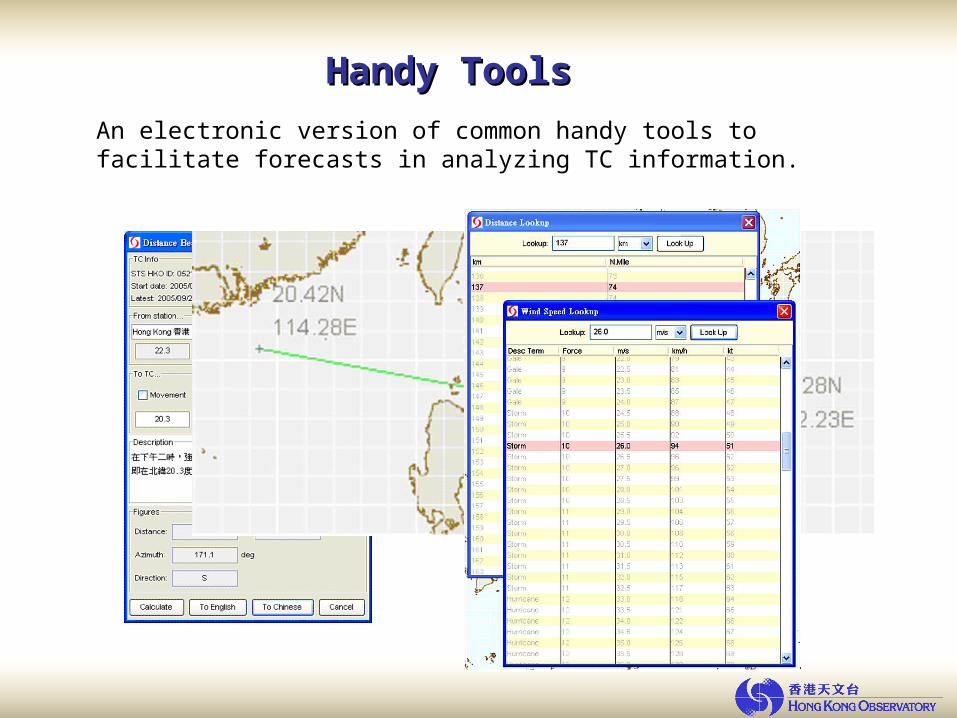
Handy ToolsHandy Tools
An electronic version of common handy tools to facilitate forecasts in analyzing TC information.
Major Features of TIPSMajor Features of TIPS
1.TC Analysis
2.TC Forecasting
3.Decision Support
4.Data for downstream systems
5.Past TC Track Display
6.Handy Tools
7.Online Help
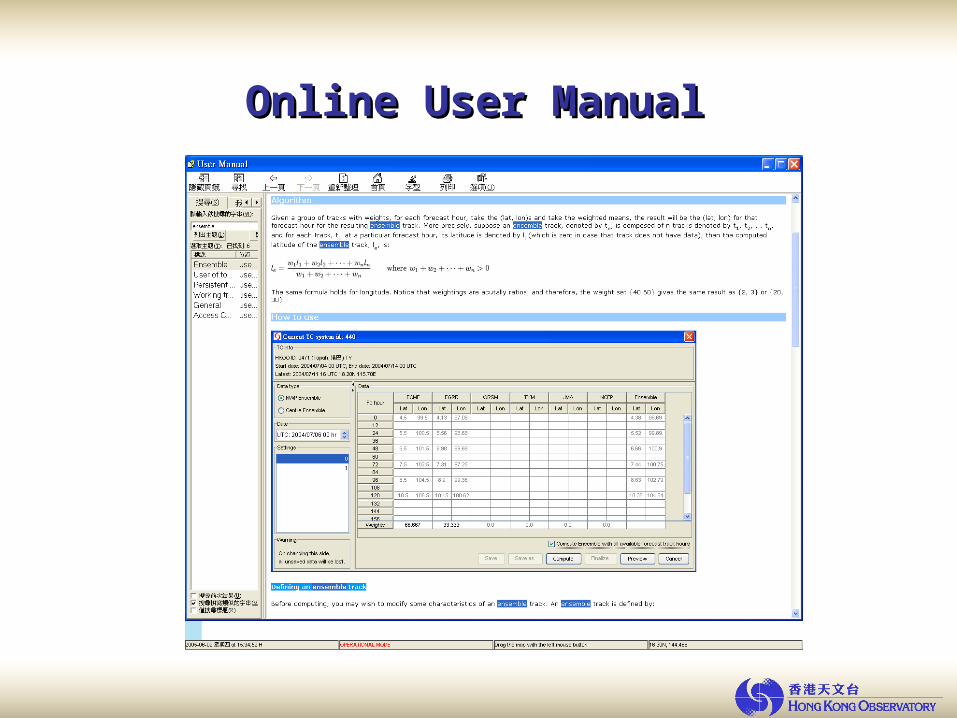
Online User ManualOnline User Manual

Thank You!Thank You!


![Cyclone Handbook, Section I. Cyclone FPGA Family Data Sheet1]EP1C12F256C8.pdf · Section I. Cyclone FPGA Family Data Sheet ... Cyclone Device Handbook, ... Vertical migration means](https://static.documents.pub/doc/80x56/5b3a24897f8b9a600a8f2cfc/cyclone-handbook-section-i-cyclone-fpga-family-data-sheet-1ep1c12f256c8pdf.jpg)

