1. TROPICAL METEOROLOGY OF CENTRAL AMERICA 1.1 General Introduction This Handbook describes the analysis and forecasting of both atmospheric and oceanic conditions important to air/sea operations over Central America and adjacent waters. Central America, as addressed in this handbook, includes the following seven na- tions, commencing with the nation located farthest west: Guatemala, Belize, El Salvador, Honduras, Nicaragua, Costa Rica and Panama (Figs. 1.1, 1.2). Central America, lying between 7°N and 19'N, has its weather primarily influenced by features carried by the low-level "easterlies"' for most of the year, yet it is susceptible to the penetration of cold fronts (shear lines or "Atemporalados" 2 ) during the Northern Hemisphere winter. While the time of the "rainy season" cannot be generalized for all of Central America, Portig (1976) depicts the rainy season for the North Pacific portion of Central America from about May through October, while it is a month later for the North Atlantic portion, i.e., from about June through November-despite appreciable rain in December. While the threat of tropical storms or hurricanes is small, it cannot be dismissed, since all of the countries 3 have experienced tropical cyclones, especially northeastern Honduras and Nicaragua, and Belize. 'Meteorological convention dictates that wind direction is the direction from which the wind is blowing i.e., easterly winds blow from the east (toward the west). 2 See Subsubsection 3.2.3. 'Panama and Costa Rica, minimally. 1-1
Transcript
1. TROPICAL METEOROLOGYOF CENTRAL AMERICA
1.1 General Introduction
This Handbook describes the analysis and forecasting of both atmospheric and oceanicconditions important to air/sea operations over Central America and adjacent waters.
Central America, as addressed in this handbook, includes the following seven na-tions, commencing with the nation located farthest west: Guatemala, Belize, El Salvador,Honduras, Nicaragua, Costa Rica and Panama (Figs. 1.1, 1.2).
Central America, lying between 7°N and 19'N, has its weather primarily influencedby features carried by the low-level "easterlies"' for most of the year, yet it is susceptibleto the penetration of cold fronts (shear lines or "Atemporalados" 2) during the NorthernHemisphere winter. While the time of the "rainy season" cannot be generalized for allof Central America, Portig (1976) depicts the rainy season for the North Pacific portionof Central America from about May through October, while it is a month later for theNorth Atlantic portion, i.e., from about June through November-despite appreciable rainin December.
While the threat of tropical storms or hurricanes is small, it cannot be dismissed, sinceall of the countries3 have experienced tropical cyclones, especially northeastern Hondurasand Nicaragua, and Belize.
'Meteorological convention dictates that wind direction is the direction from which the wind is blowingi.e., easterly winds blow from the east (toward the west).
2See Subsubsection 3.2.3.'Panama and Costa Rica, minimally.
1-1
1001 0 951 w go, H 8S, w s0o w 75' W 70, w 65W 50w W S5 wr5
Figure 1.1: Central America and Surrounding Region (NOCD, Asheville, 1985)
Figure 1.2: Topography (NOCD, Asheville, 1985)
1-2
35' N
3C' N
S' N
0' N
5, N
,a 2
30'
25"
20
10'
C•
. le 11, I 05,4
1.2 Regional Climatologies
1.2.1 Rainy Season and Dry Season Charts
While the appendices have extensive excerpts from more complete climatological references,the following sets of charts portray the features of the "rainy season" (August)4 and the"dry season" (February).
Figures 1.3 and 1.4, from Sadler et al. (1987)', depict the resultant surface winddirection and speed, for August and February, respectively. The migration of surfaceconvergence over the North Pacific Ocean, from near 10'N in August southward to near50 N in February, is obvious.
Figures 1.5 and 1.6, from Sadler and Wann (1984), depict the mean 200 mb (uppertropospheric) flow6 for August and February, respectively. In August, the mean posi-tion of the Tropical Upper Tropospheric Trough (TUTT) extends eastward from justnorth of Belize separating the subtropical ridge (in the northern Gulf of Mexico) and thesubequatorial ridge (extending from southern Guatemala through Nicaragua, eastward).The greater geopotential heights found in the subequatorial ridge correlate well with theenhanced convection associated with the more northerly August position of surfaceconvergence (called, by some, the Intertropical Convergence Zone (ITCZ)). However, themean 200 mb flow in February is southwesterly, increasing from an average 10 kt south ofPanama to 40 kt just north of Belize.
Figures 1.7 and 1.8 from Sadler et al. (1987) depict averaged sea-level pressure forAugust and February, despite the preference of streamline/isotach analysis over pressure(or contour) analysis in the tropics (see Appendix A). It is immediately obvious that thelowest average sea-level pressure (for this large (synoptic) scale) is found over Panama andCosta Rica in both the rainy and dry seasons.
4'These representative months have been rather arbitrarily selected. See Subsection 1.2.2 for furtherexplanation. While Portig (1976) divides Central America into 14 rainfall regimes, USAFETAC (1985)supports the selection of these months, but includes "transitional" months between the rainy and dry seasonsfor Nicaragua, as well as a secondary rainfall maximum for Panama in October.
5Only the last 80 years, 1900 - 1979, have been used from the Comprehensive Ocean-Atmosphere DataSet (COADS). COADS is a continuing cooperative effort to compile global ship observations (initially forthe period 1850 - 1979) between the National Oceanic and Atmospheric Administration (NOAA)-itsEnvironmental Research Laboratories, National Climatic Data Center (NCDC) and Cooperative Insti-tute for Research in Environmental Sciences (CIRES)-and the National Science Foundation's NationalCenter for Atmospheric Research (NCAR). Details of how the ship observations were collected, evaluatedand compiled are contained in Woodruff et al. (1987).
6The period of record is 1960 - 1973, consisting of 175,000 PIREP and RAWIN observations per month.
1-3
]DOW~ ONNHO
*~~4 0*3' 3>
'06 ~ ~ ~ ~ ~ I 29, 8. I *I . 2 28 ~ 9 ~ ? 8 ~ I I j;,.*
The resultant direction is depicted by streamlines and the resultant speed in m/see bydashed lines. (Data plots contain (1) upper numiber: monthly average wind speed and(2) lower number: number of observations within each 2' square-arrow shaft length isproportional to wind speed.)
1-5
2•
A s
J
0 . . . . .
,1'diFigure 1.5: Mean 200 mb Flow, August (Sadler and Wann, 1084)
Figure 1.5: Mean 200 mb Flow, August (Sadler and Warm, 1984)Streamlines (solid, with arrows indicating direction of flow) and isotachs (dashed) in knots
1-6
- / - -i
- j . .1I N .Lr i'�-.
- -
A��LH � - - a -_V. ... - - -
£0~~~~7 A: --- ý
Figure 1.6: Mean 200 mb Flow, February (Sadler and Wann, 1984)Streamlines (solid, with arrows indicating direction of flow) and isotachs (dashed) in knots
1-7
.
II
D
I1ow 10014W
F
II
I
F
41
1Ii.,
'¼'A
B A.,
,C 1
6.2 t•
l rI p131 I
a I I t~ SI
112 .,1 L
II.. 11 .2
J II I2"
11.5 ll [1 ,I l., II A
1 l, it5 t1.3 12 1 li I 1? I
, 12 Ill Ill I I I l 9 l," ' 1 1.;. 26
I 6 1 2 312.16 I. l? 1:6 I II
I1 112 h8l
It I,
Figure 1.7: Mean sea-level Pressure, August (Sadler et al., 1987)The isobars are labeled in millibars (or hectopascals (hPa)) with the leading 10 omitted.Selected one-half millibar intervals are shown as dashed lines.
1-8
N
I.
,$1t
(
9 .. .Lw
J
fill.
1 1
__1
I
I -I _ýý
[[n[i 9gw BOW 21]W
2 4 111
.5 I;.1 ? 17 [ I0 [WI. Itt. 8 [1 I'V I
I" t I I I
"130 129 "2.4 "' =2.9 I'5 11 1Ž21 "1.8 -2: e
i-- A.46
10.3~ ~~~~ II I'. [1 41 .. [t I~j 121 .,I' to
to[2 .. J J 4a S t@ 7 10 2 iS 3 10 1 3 10 d
Lt 71 [[ [J t. [1 4 , .. 10 110 1 0 I
['7~ ~~~~~ ~~~ .........[. O [.4 ~ 0. t) OS 1 I
406
- 3110.
S.>.
.5
Figure 1.8: Mean sea-level Pressure, February (Sadler et al., 1987)The isobars are labeled in millibars (or hectopascals (hPa)) with the leading 10 omitted.
Selected one half millibar intervals are shown as dashed lines.
1-9
Figures 1.9 and 1.10 (NOCD, Asheville, 1985) depict the mean scalar wind speed forAugust and February. Note that the sea-level pressure figures, (1.7 and 1.8), and thesefigures of mean surface wind speed are from different references. The strength of the windis greatest off the Caribbean coast of Columbia-a region known by oceanographers asthe "Columbian Basin". Recalling, again, that these are average winds, note the strengthof the trade winds in February, reaching into the North Pacific Ocean after crossing therelatively flat southern Nicaragua, as contrasted to the very light winds southwest of themountainous Costa Rica.
Figure 1.9: Mean Scalar Surface Wind Speed (kt), August (NOCD, Asheville, 1985)
1-10
13'
K ý 3
85 800 750
Figure 1.10: Mean Scalar Surface Wind Speed (kt), February (NOCD, Asheville, 1985)
1-11
201
C/
15:
.,7
10
90
Figures 1.11 and 1.12 (NOCD, Asheville, 1985) depict isopleths showing the percentagefrequencies of wave heights > 3 feet (solid lines) and > 8 feet (dashed lines) for Augustand February. In agreement with the wind speed depicted in Figs. 1.9 and 1.10, large waveheights are more often found over the Columbian Basin, regardless of season. While waveheights surrounding Central America are generally high more often on the Caribbean side(the windward side) in February, note that wave heights on the North Pacific Ocean sideare smaller in the lee of mountainous Costa Rica, but much larger west of Nicaragua.
20'
15"
90"
Figure 1.11: Wave-height Isopleths (Percent Frequency) August (NOCD, Asheville, 1985)Solid line - Wave height >3 feet; Dashed line - Wave height >8 feet.The wave height is the higher of sea or swell for observations containing both wave trains.Sea is defined as waves generated by local winds.
1-12
-- 7
20
151
K
77
B80
90 85' 80" 750
Figure 1.12: Wave height Isopleths (Percent Frequency) February (NOCD, Asheville, 1985)Solid line - Wave height >3 feet; Dashed line - Wave height >8 feet.The wave height is the higher of sea or swell for observations containing both wave trains.Sea is defined as waves generated by local winds.
1-13
to
Figures 1.13 and 1.14 (Sadler and Wann, 1984) depict the mean monthly cloudinessover Central America and the adjacent waters during the period 1965-1973. The analysiswas derived from operational nephanalyses 7 with isopleths labeled in "octas"' (eighths) oftotal cloud cover. There is no satisfactory "ground truth" monthly average cloud analysesto which this analysis can be compared. However, the patterns of cloudiness and thepositions of the maximum and minimum areas of cloudiness are essentially identical toother satellite derived analyses-although there is an average difference of about 1 octabetween different satellite analyses.
It is readily apparent that average monthly cloudiness over much of Central Americadecreases from -5/8 in August (the rainy season, Fig. 1.13) to -3/8 in February (the dryseason, Fig. 1.14).
Figures 1.15 and 1.16 (Sadler et al., 1987), depict the mean sea-surface temperature(SST) during the months of August and February. During August, monthly SST in thewaters surrounding Central America is generally between 280 C and 290 C. Again, note thatthe higher winds blowing from land toward the North Pacific Ocean, west of Nicaraguain February, lead to mixing of the upper layer of the ocean and to cooler temperatures(-260 C) than found in the North Pacific Ocean west of Costa Rica(r280 C) where windsare weaker.
7 Nephanalysis is a mapped analysis of the cloud distribution or "the analysis of a synoptic chart interms of the types and amount of clouds and precipitation" (Huschke, 1959).
'Sadler emphasized the spelling of these labels so as to differentiate them from the fraction of cloud coverin "oktas" used by the World Meteorological Organization for ground based estimates.
1-14
120W
120W 9OW 60W
Figure 1.13: Mean Monthly Cloudiness in Octas, August (Sadler and Wann, 1984)The average cloud cover is plotted for each 2.50 latitude-longitude square.
1-15
90• 60N
120W
120W 90W
Figure 1.14: Mean Monthly Cloudiness in Octas, February (Sadler and WVann, 1984)The average cloud cover is plotted for each 2.50 latitude-longitude square.
Figure 1.15: Mean Sea-Surface Temperature, August (Sadler et al., 1987)The isotherms are labeled in degrees Celsius. Where needed, one-half degree intervals areshown as dashed lines.
Figure 1.16: Mean Sea-Surface Temperature, February (Sadler et al., 1987)The isotherms are labeled in degrees Celsius. Where needed, one-half degree intervals areshown as dashed lines.
1-18
4ION
30N
2094
ON
50
Finally, to assist mid-latitude meteorologists to adapt to the tropical setting ofCentral America, a mean sounding will be presented. While the International CivilAviation Organization (ICAO) sounding9 with sea-level temperature of 150C, as well as500 mb height of 5574 m and temperature of -21.2oC, is so commonly used in extratropicalapplications, the mean atmosphere of Central America is obviously much warmer (andmuch more moist) with typically higher heights for constant pressure surfaces.
Jordan (1958) prepared a mean sounding from ten years of data from three stations:Miami, Florida; San Juan, Puerto Rico; and Swan Island". The annual sounding is consid-ered less useful and will not be presented since it provides a rather nonexistent soundingbetween the rainy and dry seasons.
Table 1.1 depicts the mean pressure, height, temperature and specific humidity ofthe four months"', July through October, typical of the rainy season. To avoid theeffects of daytime radiation, Jordan averaged only night time soundings-0300 GMT,as obtained operationally during the 1946-1955 period. Figure 1.17 presents a plot ofthis mean tropical sounding for the four summer months. Unlike the so familiar ICAO(or "U. S. Standard Atmosphere") extratropical mean sounding, there is a dewpoint tem-perature sounding, available from the specific humidity data provided in Table 1.1.
91dentical with the U. S. Standard Atmosphere up to a height of 32 km.1 0Swan Island is located at 17"N, 84 0 W in the western Caribbean Sea, -100 miles north of eastern
Honduras (see Fig. 1.21)."Defined by Jordan to be the "hurricane season".
1-19
Table 1.1: Mean Tropical Atmosphere (West Indies) during Rainy Season (Jordan, 1958)
Figure 1.17: Mean Tropical Atmosphere (West Indies) during Rainy Season (Jordan, 1958)The temperature (heavy solid line) and dewpoint temperature (heavy dashed line) areplotted on a "Skew T, Log P" thermodynamic diagram, with isobars (thin solid horizontallines), "skewed" isotherms (thin solid lines) sloping from lower left to upper right, dryadiabats (thin solid lines) sloping from lower right to upper left, pseudoadiabats (thindashed lines) sloping from lower right to upper left, and mixing ratio lines (thin dashedlines) sloping from lower left to upper right.
1-21
1.2.2 General Climatology (Portig, 1976)
The following outline contains summary statements gleaned from Portig (1976) concerningthe various climatological elements for Central America. (The reader is cautioned thatthese summaries do not refer to the figures (from other sources) presented in the previoussubsubsection.)
Wind
Because wind is among the climatological elements most affected by local influences in thenear Equatorial portion of Central America, one cannot use the geostrophic or gradientapproximation for the wind. Using earlier data based primarily on ship observations (yet,not so complete as COADS), Portig (1976).states that mean streamlines from Septem-ber (rainy season) and December (dry season) have the greatest month-to-month mutualdeviations (see Fig. 1.18 below)' 2 . While the more northerly direction of the Decemberwinds is obvious, he notes that "in no month is there any (average) southerly componentof the wind over the open Caribbean Sea".
80 70 80
20
Figure 1.18: Mean Streamlines. Over the North Pacific coast of Central*America two wind regimes alternate in September (Portig, 1976)
"12The dashed lines from the north-northwest over the western Caribbean Sea indicate the presence of"northers", intermittently present with the north-northeasterly tradewinds during December. Northers aredefined as "...strong, cold winds...associated with the southward movement of a cold anticyclone." (Huschke,1959). However, other sources document northers reaching Panama.
1-22
1
Although hurricanes do occur in the region, they affect individual stations so seldomthat their presence is not evident in wind statistics compiled over many years.
Not only do inland stations have a high percentage of calms, but there are periods (ofhours) during which the wind speed is zero. Balloon records have revealed layers, severalthousand meters thick, having no horizontal motion.
Stations have distinct diurnal variations, with the expected higher wind speeds in theafternoon and early evening. Stations with extensive land mass behind them, such asalong the North Pacific coast, experience "sea breeze fronts". However, local orographiceffects, "northers" and trade winds have their particular months (as well as time of day)of dominance.
Barometric Pressure
Relative maxima in mean pressure are found in December (or January) and in July. Moreimportantly, the atmospheric pressure displays the familiar double wave every day, withminima near 0400L'3 and 1600L, and maxima near 1000L and 2200L. At San Salvador,the magnitude of this twice daily pressure variation is as large as 4.2 nib in March.
Cloudiness
Central America is often under a canopy of cirrus (often tenuous), and even well-experiencedobservers often have difficulty in locating the edges of thin cirrus. However, tropical cloudsshow a high correlation with geographic features, such that not only mountain ranges butalso coastlines are often identified in satellite imagery. The largest annual range of cloudi-ness over ocean areas (i.e., dlearer in February/March, cloudier in September) is observedin the North Pacific Ocean, off the coast of Central America. Maximum cloud cover is alsofound along the east coast of Central America, from Belize to Panama.
Sunshine
Mean monthly sunshine, in percentage of the possible, shows a tendency for stations tohave their sunshine extremes out of phase and a month or so earlier than rainfall extremes.That is, minimum sunshine occurs one month before the rainfall maximum, and maximumsunshine occurs one month before the rainfall minimum.
Temperature
Since Central America is tropical and primarily maritime, temperature changes are small.Portig (1976) found that the hourly temperature variations from observations in a wellventilated shelter depend mostly on dloud cover.
1L= Local Time
1-23
In most of Central America (except for the Caribbean coasts of Honduras and northernNicaragua), the monsoon temperature variation dominates with the highest temperaturesjust before the onset of the summer rains. On land, the average temperature of the warmestmonth (at sea level) is less than 290C, except at some island locations on the Pacific sideof Central America where the mean April temperature rises to 310C (e.g., in Amapala, aHonduran island in the Gulf of Fonseca' 4). Conversely, at sea level the average temperatureof the coldest month is 190C. The annual temperature range for most of Honduras is morethan 40C, dropping to less than 40C at the coast, and to about 1.5CC at the Panama Canal.(The temperature range of stations at higher elevations is generally of the same magnitudeas for nearby lowlands.)
Cold winter air invasions from North America affect the absolute temperature minima.While lowland temperatures almost never drop below 150C southeast of a line runningfrom Puerto Rico to Costa Rica, the lowland temperatures in Central America northwestof this line reach an absolute minima of approximately 7rC. Such low temperatures usuallyoccur due to the combined effects of cold air intrusion and nocturnal cooling. The highestmountains of Guatemala and Cost'a Rica have experienced below freezing air temperatures.
The diurnal temperature range exceeds the annual temperature range, although thediurnal range is reduced by the nearness to sea. Also, the dry season has a larger dailytemperature variation than the rainy season, in general.
Moisture
Most Central American climatological summaries do not include dewpoint temperatures;however, Appendix B contains average monthly relative humidity, vapor pressure anddewpoint temperature for selected stations. Although the strong influence of nearby oceansand warm temperatures dictates relatively high moisture for Central America, it is notedthat moisture can drop to sufficiently low values where hygrometers become inaccurate.
Rainfall
Portig (1976) states that "the most important meteorological element in the tropics is therainfall". Although Central America is practically always under the influence of maritimeair masses, seasonal variation of precipitation are surprisingly high (see Fig. 1.19). Whilemuch of the variation can be attributed to orographic effects, significant differences in thetiming of the rainfall seasons exists over short distances.
Areas of lesser rainfall (less than 100 cm (-40 in) include regions of elevated plainsof central Guatemala, Honduras and northwestern Nicaragua, plus very small parts of theNorth Pacific coast west of the Gulf of Fonseca and southwest of Panama City.
"14See Subsection 1.3 for geographical locations within respective countries.
1-24
20
5',
20s
Figure 1.19: Mean annual rainfall (cm) in Central America (Portig, 1976). Numbers(1 through 24) locate the following stations: 1-Belize City, 2-Flores, 3-Santa Teresa,4-San Andr6s Osuna, 5-Guatemala City, 6-San Jos06, G., 7-Texis Junction, 8-Cutuco,9-Tegucigalpa, 10-Managua, 11-San Jos6, C. R., 12-Villa Mills, 13-Panama City, 14-Col6n,15-Puerto Armuelles, 16-Caracol, 17-Guabito, 18-San Juan del Norte, 19-Bluefields,20-Guanaja, 21-La Ceiba, 22-Puerto Cort6s, 23-Sepacuite, 24-Zacapa.
In contrast, areas of excessive rainfall are found in the mountains of Guatemala andthe mountains connecting Costa Rica and Panama. The tops of lesser mountains and theslopes of the higher mountains receive large rainfall totals, while crests above 2,500 mreceive less than half that falling on the slopes.
The other areas receiving excessive rains include the Caribbean coast near southernBelize to Puerto Barrios, Guatemala, the Caribbean coast of Nicaragua at and south ofBluefields, the Caribbean coast of Panama near the Gulf of Los Mosquitos, the southeastcorner of Panama, and the southern coast of Costa Rica.
While most of the rain-bearing disturbances come from the Caribbean, leading tolarger rainfall on the Caribbean side, the reader must keep in mind that diurnal sea breezesprovide their rainfall production ashore on the North Pacific Ocean side as well, with windsfrom the south or west. Drier areas, such as west of the Gulf of Fonseca, are believed to bepartly caused by katabatic winds'5 . Also, the drier eastern side of the Peninsula of Azuero,Panama may be shielded from disturbances of North Pacific origin by the mountain rangeon the western half of the peninsula.
15Winds blowing down an incline, the opposite of anabatic wind (Huschke, 1959).
1-25
With only a couple of exceptions, all of Central America has two rainfall maxima, with
generally higher totals on the Caribbean Sea side. The main dry season occurs in winter
or early spring and is much more intense (drier) on the North Pacific Ocean side of Central
America.
With the drier winter and spring, the North Pacific Ocean side has appreciable accu-
mulation from June through October, yet with a relative minimum during the two summer
months of July and August. This relative minimum is locally labeled the "varanillo" (little
summer). While all months have a diurnal rainfall maximum between sunset and mid-
night, June and September have an additional rainfall accumulation' 6 in the early afternoon
(1200L-1600L). Thus the North Pacific side maxima are in June and September.
Again, while the Caribbean side has a not-so-dry late winter (as does the North Pacific
Ocean side), the general pattern of its maxima consists of a summer maximum near June
or July and another relative maximum in December.
Thunderstorms
While thunderstorms are a common occurrence in Central America, the two regions of
maximum thunderstorm activity are (1) the Gulf of Fonseca (116 storm days17 per year on
Amapala) and (2) the center of the Canal Zone (196 storm days at Madden Dam). The
minima are 37 at Chimax, in central Guatemala and a questionable three at Belize City.
Visibility
Portig (1976) reports that fog practically never occurs at sea and at coastal stations, but
that inland stations occasionally have shallow fog in the morning that is rapidly dissipated
by the sun. (However, one of the authors observed heavy coastal morning fog during
a winter (dry season) approach to the Caribbean side of the Panama Canal in February
1963.)The dry season has many days with haze, providing a real hazard for aircraft. However,
above the haze, the trade wind inversion provides unlimited visibility. Furthermore, the
Pacific side of Central America has the "best" and the "worst" visibilities, i.e., the Pacific
side has a larger variation in visibility, than the Caribbean side.
Overall Weather
In winter and spring, i.e., the dry season, the steadily blowing trades produce generally
fine weather. Of course, the incursions of cold air from North America (or the Gulf of
Mexico) interrupt this fine weather, with less effect equatorward of Nicaragua. (GOES
imagery, examined during 1988, verified these statements.)
"6From Portig(1976) data which is predominantly from San Salvador."7While Portiq (1976) does not define storn day, Huschke (1959) defines a thunderstorm day as
"...an observational day during which thunder is heard at the station. Precipitation need not occur".
1-26
Most of the winter rain for northern Honduras comes from the long-lasting rain anddrizzle accompanying cold fronts reaching the mountains. Again these cold fronts tendto be dry on the Pacific Ocean side because of the foehn's effect. The cold north windis called norte, norther, or tehuentepeco. While it can become destructively strong, itis often welcomed during the monotonous dry season. As mentioned earlier, the lowesttemperatures occur when the wind subsides and cooling by nocturnal radiation follows.
While the first norther of the seasons tends to bring a distinct weather change, subse-quent incursions become less potent. Accordingly, Portig (1976) states that it is difficultto determine the exact number of northers per season. Estimates run from 30 40 per yearor less.
Chapel (1927), who has defined northers by wind rather than through weather patterns,studied the average conditions of six northers reaching Colon, Panama, noting that thewind nearly doubled in strength on the day of arrival, with a pressure rise only on theday of arrival, but with increased rainfall amounts for three days after arrival. While norain may fall when a cold front passes, heavy downpours can occur where the front finallystalls. Such heavy rainfalls can be found on the Caribbean coastal area of southeasternNicaragua.
However, the rainy season has more synoptically driven events than does the dry sea-son. In the rainy season, they are manifest as hurricanes, tropical depressions, waves inthe easterlies or even displaced fragments of the Intertropical Convergence Zone (ITCZ).Rainfall from hurricanes is considered beneficial in many areas, but hurricanes are notresponsible for the rainfall maximum in the fall. Portig (1976) reports that "tropical lowsor depressions occur at varying intensities all over region, and occasionally in the dry sea-son"; moreover, personal communication'9 in 1986 revealed that development of a tropicaldepression near the Canal in December 1985 required immediate measures to control thewater level of the Canal, before the depression moved slowly toward the northwest.
Local developments
Portig (1976) defines the "temporal" as a longlasting rain, with no, or little, electricalactivity. While categorizing them as "local" is debatable, they are typical of two areas:the north coast of Honduras (caused by invasions of cold air from the north during thewinter (dry season) and the Pacific Ocean coast of all of Central America. While continuedresearch is needed, the temporals along the Pacific Ocean coast may often be tropicaldepressions moving slowly westward. Portig (1976) suggests that they may transformfrom "temporal"-lows into hurricanes, and vice versa. While the Pacific temporal may havehurricane-like spiral bands, its winds are generally light and moderate, without lightningand thunder, but its rainfall, covering a relatively large area, can cause water damage.
"lFoehn A warm, dry wind on the lee side of a mountain range, the warmth and dryness of the air beingdue to adiabatic compression upon descending the mountain slopes (Huschke, 1959).
19Conversation between Joe Corelli, Hydrologist of the Panama Canal Commission and one of the authors.
1-27
Portig (1976) further reports that "it is not possible to clearly distinguish between thetemporals and temporal-like situations ('tiempo atemporalado' as the man on the streetsays), but a fair estimate calls for one or two temporals a year for each location on theNorth Pacific coast of Central America". The greatest probability is in September orOctober, with a secondary maximum in June.
As a local phenomena, the sea breeze may be strong enough at times to overcome thelarge-scale wind regime, blowing from the west in a typical trade wind area. For example,in western Panama, it can reach 30 km inland.
Squalls are frequent, and over water thunderstorms frequently generate waterspouts.Tornadoes are less frequent than waterspouts, and hail is rare, even in locations experj-encing many thunderstorms. Hail has fallen on the Pacific Ocean side of Guatemala andin Panama, and snow falls on elevations above 3400 m in Guatemala (Portig, 1976).
1-28
1.3 National Climatologies
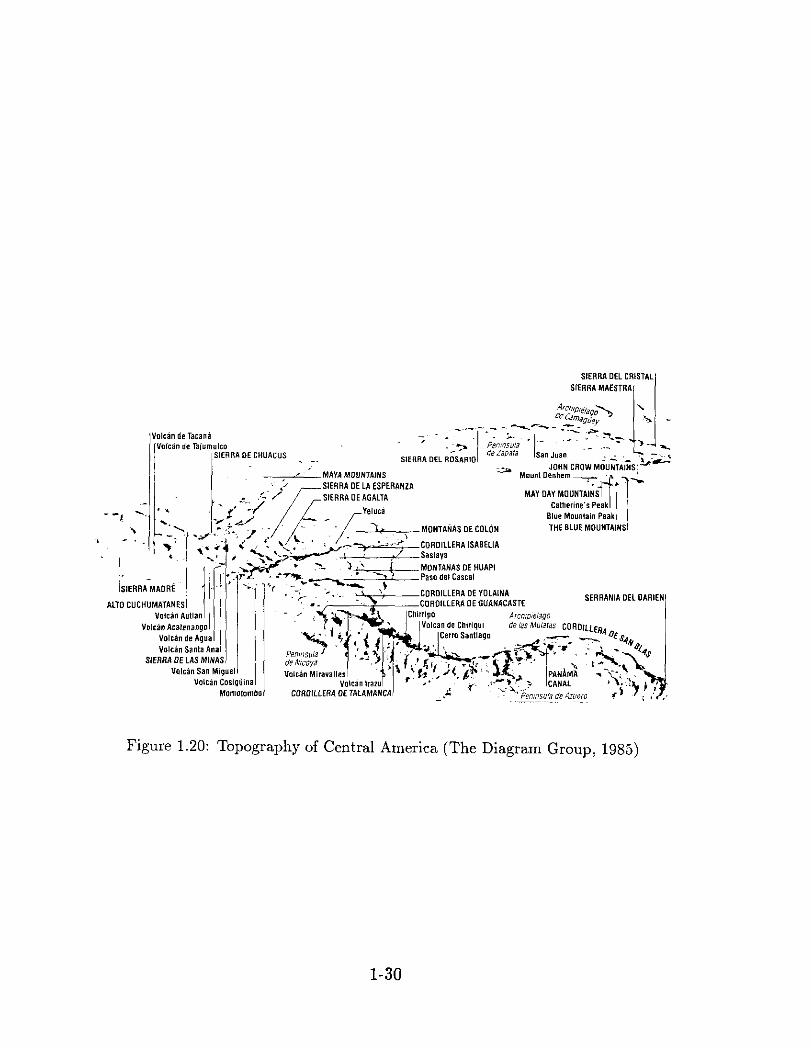
Following closer examination of Central America and its topography, this section willdiscuss the climate and terrain of each country. On the following two pages, Fig. 1.20(The Diagram Group, 1985) with its shading, and Spanish names for mountain ranges andvolcanoes, provides a better perspective of terrain elevation, while Fig. 1.21 (The Diagram
Group, 1985) with its larger scale (compared to Fig. 1.1) displays the national boundariesof the seven countries more clearly.
1-29
Volcan de TacanalVolcan de Taiuniunco
-MAYA MOUNTAINSSIERRA BE LA ESPERASIERRA OE AGALTA
Yeuc
S-IERRA
ALTO CUCH
I'
Vulcan San Miguel
SIERRA DEL CRISTALSIERRA MAESTRA
SIERRA DEL ROSARIJ de pt ISan Juan :• -X .
=. JOHN CROW MOO NTAINS1 •
ANZASMAY DAY MOUNRSIN
Catherine's Peak IBlue Mountain Peak I
MONTANAS DE COLON THE BLUE MOUNTAINSJ
. CORDILLERA ISABELLA/ Saslaya
N MONTANAS DE HUAPIPaso del Cascal
-. "" CORDILLERA DE YOLAINA SERRANIA DEL DARIENCORDILLERA DE GUANACASTE
"f -.' " ^M Chirripd Arcbwpte3,go' " olcan de Chiriqui del asM alatas COROlLLE'•_•"' • "J '• I Cerro Santiago F ,.S•g 4o.£
el4"14
An Miravalli a '>cnIaz AA
ROILLERA DE AAMN ,PANAMA
Figure 1.20: Topography of Central America (The Diagram Group, 1985)
While having the most people of any nation in Central America, Guatemala is the third
largest nation, equivalent to the size of Tennessee. In addition to bordering Mexico onthe north and west, its Pacific coastline is located to the southwest. On its eastern border(starting from the north) is Belize, followed by a short Caribbean coastline, and then finallyHonduras and El Salvador.
As depicted in Fig. 1.22, Guatemala has a rather narrow Caribbean coast to the east,but a fairly extensive Pacific Ocean coast to the south. While lagoons and sand bars extendthe length of the gently curving Pacific coast, just inland are fertile coastal lowlands forabout 25 miles. The coastal Pacific lowlands then give way to the highlands of the southern
and central region, while the north is occupied by the plains of Pet6n.Approximately two-thirds of the country is occupied by highlands with the main moun-
tain range being a southeast extension of Mexico's Sierra Madre, paralleling the coast only
about 40 miles inland. With many high volcanic peaks, some active, the inland highlandsextend from 3500 - 8000 feet in elevation. Very near the western border and at 13,845feet, the Tajumulco Volcano is the highest peak in Central America. But between volcanic
peaks lie volcanic rich basins.Guatemala's longest river, the Motagua, lies just north of the main mountain range and
flows eastward to the Gulf of Honduras and the Caribbean Sea. From another valley, notfar to the north, the Polochic River runs parallel to the Motagua, flowing into Guatemala'slargest lake, Izabal, before reaching Amatique Bay in the Gulf of Honduras. While thesparsely populated limestone plains of Pet6n comprise most of northern Guatemala, therelatively low Maya Mountains extend into southern Belize. A narrow, fertile coastal plainexists along the short Caribbean coast (The Diagram Group, 1985).
Climate
General The cooling effects of both coasts and highlands provide a variety of climates within
Guatemala. The coasts are hot and humid, about 80'F (27 0 C) throughout the year. Inlandhighlands are cooler; for example, at Guatemala City, at nearly 5000 feet above sea level,the average annual temperature is 64.4 0 F (18'C). The months of December and Januaryare coolest.
The rainy season lasts from May to November-October, if you use Guatemala Cityrainfall, (not shown). While the Caribbean-facing slopes get rain almost all year, the Pacificcoast receives heavy summer rain, but stays dry during the winter. Annual rainfall varies
from 80 inches in the highlands to about half that amount in parts of eastern Guatemala(The Diagram Group, 1985).
1-32
192-W IgWw- * TouristCentres
National Parks
Transpoctatlon r- - -
Main Roads
-- Railways
+.- Main and Internationat Airports
4 Main, ports P
opsala~tlon of floajo J -. -~towns aind ~lot..I~
7N. 0,00 inhabitants
25.0 W00<0000
I
Carmelita I
MEXICO
//°
AS
Okms 50
OmnJes 20 40
600
60
so 1
80 100
Figure 1.22: Guatemala (The Diagram Group, 1985)
1-33
Rainy Season: May - October. The rainy season is characterized by mostly cloudyskies 20 , with warm to hot temperatures, and frequent rain showers and thunderstorms. Atnight, the temperatures below about 3000 feet and at coastal locations fall to the mid toupper 70's (0 F), then rises to the upper 80's or lower 90's during the afternoon. However,the upper plateau which includes Guatemala City, is cooler with lows near 55 60'F andhighs 70-80'F. Rainfall, which is moderate on the interior plateau, increases to very heavyon seaward-facing mountain slopes and lower elevations. While most rain falls as briefshowers, the "temporal" can bring low ceilings and visibilities, as well as continuous rain,for periods from 12 hours to 6 days.
Thunderstorm days occur in the lowlands at a frequency of 8 14 per month, with aconsiderably higher frequency on exposed mountain slopes. While the interior plateau hasonly 2 8 thunderstorm days per month (see monthly totals below), both the lowlands andinterior plateau have a thunderstorm maximum in the midafternoon, with a secondarythunderstorm maximum found at coastal stations between midnight and sunrise. Thethunderstorms may be accompanied by strong gusty winds and severe lightning. SeeSection 5 and Appendix C for tracks of tropical cyclones affecting Guatemala.
Flying weather: Poor to fair flying weather may be expected during the rainy seasondue to heavy cloud cover, rain and thunderstorms. Cloud-enshrouded mountain slopesnaturally present a hazard to aircraft operations. See Appendix B for specific statistics atHuehuetenango and Puerto Barrios.
Terminal weather: Guatemala City/La Aurora Airport. While the terminal weather isfair to good, early morning fog may frequently restrict flying activity. Ceiling less than300 feet and/or visibility less than 1 mile2" occurs only 1 3 percent of the time, andthunderstorms are most frequent from mid-afternoon to early evening. Crosswinds greaterthan 15 knots and occur less than 1 percent of the time (USAFETAC, 1985).
Monthly temperature, precipitation, thunderstorms & twilight (USAFETAC, 1985):GUATEMALA CITY MAY JUN JUL AUG SEP OCTTEMPERATURE (0F)
Dry Season: November April. Contrasted to the rainy season, the dry season is char-acterized by only partly cloudy skies, and warm to hot temperatures. Precipitation is in-frequent except in the northern lowlands and on the Caribbean slopes of mountains. Whilethese two locations record minimum precipitation amounts during this season, they do notexperience the very dry conditions that occur in the interior and on the Pacific mountainslopes. Morning fog occurs frequently in the interior highlands and valleys. While tem-peratures in the lowlands range from 65 75°F in the morning to 80-90'F in the afternoon,the interior highlands warm from morning lows of 35-40'F to highs of 65 70'F. Above7000 feet elevation, subfreezing temperatures are not uncommon. Precipitation occursonly 0-3 days per month on the Pacific mountain slopes and in the interior highlands.Snowfall is infrequent, confined to the highest mountain peaks; and thunderstorms areuncommon in the dry season. However, on the Caribbean mountain slopes and northernlowlands, rainfall occurs 3-20 days per month, with the greatest amount of rainfall occur-ring on the mountain slopes; nonetheless, thunderstorms are still infrequent. Not only maymid-latitude cold fronts penetrate as far south as Guatemala (if not further) with theirassociated strong, gusty northerly winds and one or two days of cloudy skies and rain, buttropical cyclones are still a possibility on the Caribbean coast during November.
Flying weather: Generally good except in the Caribbean lowlands and on mountainslopes. The weather begins to deteriorate along the North Pacific coast in February, andby April the ceiling/visibility is less than 5000/6 as often as 90 percent of the time; however,elsewhere less than 5000/6 occurs only 20 40 percent of the time. On the plateau due tofog near sunrise, 1500/3 occurs as often as 60 percent of the time, while 500/1 occurs asoften as 15 percent (see Appendix B for Huehuetanango and Puerto Barrios data).
Terminal weather: Guatemala City/La Aurora Airport. Generally good, except thatceiling/visibility less than 300/1 occurs as often as 12 percent of the the time, likely aroundsunrise (early morning fog). Thunderstorms are infrequent, and as in the rainy season,occurrence of crosswinds greater than 15 knots is less than 1 percent (USAFETAC, 1985).
Monthly temperature, precipitation, thunderstorms & twilight (USAFETAC, 1985):GUATEMALA CITY NOV DEC JAN FEB MAR APRTEMPERATURE (°F)Absolute maximum 86 84 86 89 92 91Mean maximum 73 74 75 77 80 82Mean minimum 55 54 53 53 56 58Absolute minimum 45 41 42 41 45 47
MEAN PRECIPITATION (INCHES) 0.8 0.4 0.1 * 0.3 0.7MEAN NUMBER OF DAYS
CIVIL TWILIGHT (15th of month)First light (local standard time) 0540 0556 0608 0604 0549 0527Last light (local standard time) 1753 1759 1815 1828 1834 1838
(NOTE: * = less than 0.05 inch or 0.5 day, as appropriate)
1-35
1.3.2 Belize
Land
Belize, lying in the southeastern portion of the Yucatan Peninsula, has Mexico on itsnorthern border, Guatemala on its western border as well as on its very narrow southernborder, while it has the Caribbean Sea (actually the Gulf of Honduras) along its entireeastern boundary. While its neighbor Guatemala is the most populated, Belize has thesmallest population of the seven Central American nations. However, it is the secondsmallest nation-only El Salvador is smaller-having an area just smaller than the stateof New Hampshire.
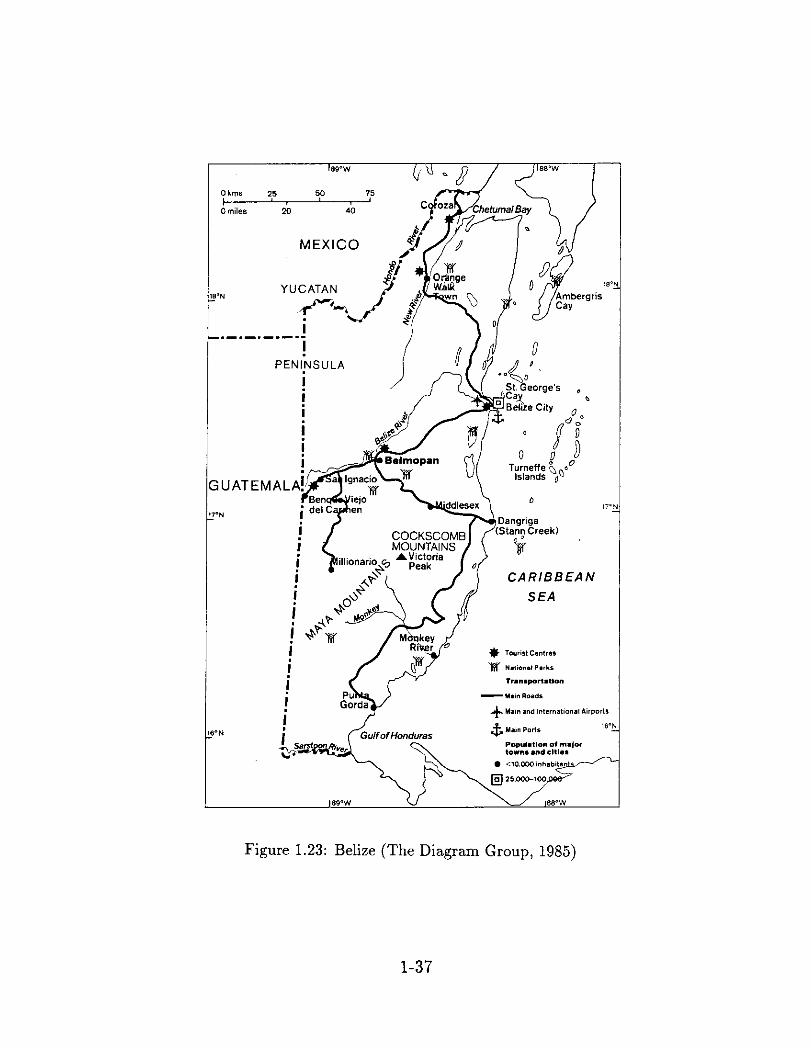
As depicted in Fig. 1.23, Belize has a much larger north-south dimension (174 miles)than east-west dimension (68 miles at its widest). It can be divided into three regions:the northern lowlands, southern uplands and the coast. Most of the northern lowlands areswampy, lying less than 200 feet above sea level. In the southern uplands are found thehills and valleys of both the Maya Mountains, and its northeast extension, the CockscombMountains. Considerably lower than Guatemala's Tajumulco, Belize's highest mountainis Victoria Peak at 3681 feet. The rivers, all running eastward and draining into theCaribbean Sea are: Hondo (forming the northern border with Mexico), New, Belize,Monkey, Sarstoon (forming most of Belize's southern border, with Guatemala) and oth-ers. Inland from its low and swampy coast, lie numerous lagoons. In addition to manysmall, low islands (cays), the world's second-largest barrier reef lies 10 40 miles offshore(The Diagram Group, 1985).
Climate
General Belize's climate is subtropical, with onshore trade winds. While the mean tem-perature at Belize City on the coast ranges from 740 in December to 85' in July, inlanddays are hotter and nights are cooler. Annual rainfall ranges from 50 inches in the flatternorthern lowlands to 170 inches in the more mountainous south. While hurricanes cansweep westward over Belize from the Caribbean Sea, droughts are possible (The DiagramGroup, 1985).
1-36
25 50 75
0
CARIBBEAN
SEA
Tourist Ce. ntres'II'National Par ks
Transportation
Main Roads
± Main and International Airports
4 Main PortsPoputlarIon of majortowns and .itieS
Figure 1.23: Belize (The Diagram Group, 1985)
1-37
0 kms
0 miles 20 40
MEXICO
YUCATAN
PENINSULA
UATEMA
I
II
III,I
The climate of Belize will not be divided into a rainy season and a dry season as is donewith the other countries. However, while the climate is treated as an annual one which ishot, humid and cloudy, rainfall is generally moderate to heavy from May through January(with the monthly maximum in October at Belize City; see next page), with a reductionof cloudiness and rainfall during February and March.
More specifically, rainfall is extremely heavy from only June through September in thesouthern one-quarter of the country. While mean cloudiness is 55 70 percent from Aprilthrough January, it is slightly less than 50 percent in February and March.
As noted below, for Belize City, mean maximum temperatures are in the upper 80's (0 F)during the summer and lower 80's during the winter, while mean minimum temperaturesare in the 70's from March through October and in the 60's from November throughFebruary.
Again, as noted below, the thunderstorm frequency is greatest from June throughSeptember. While thunderstorms are quite uncommon in northern Belize, their frequencyincreases southward. Additionally, they occur during the morning along the coast, butduring the afternoon inland. Mean surface winds are northeast to east, 8 15 kt. Beingthe country farthest north, Belize frequently experiences a day or two of rain and strongnortherly winds ushered in by mid-latitude cold fronts, from November through March.
Affected by tropical storms and hurricanes from May through November, the monthlyprobability of having at least one tropical storm and/or hurricane strike Belize ranges from5 to 20 percent with the greatest probability in September (see Section 5).
Flying weather: Fair to good, although flying weather may be restricted by early morn-ing fog, heavy rainfall or thunderstorms. The percentage frequency of ceiling/visibilityless than 5000/6 ranges from 25 50 percent, while 1500/3 ranges from 10-20 percent (seeAppendix B for specific ceiling/visibility statistics for Belize City).
Terminal weather: Belize City. Hot and humid, with moderate to heavy rainfall. Meanrelative humidities lie between 75 and 90 percent. While rainfall is expected 4-18 days permonth, the heaviest rainfall accumulation is from June through January. Ceiling/ visibilityis less than 300/1 about 1 percent of the time, mostly during early morning hours. Visibilityis restricted primarily by rain, haze/smoke and early morning fog. Runway crosswinds aregreater than 15 kt during 1-3 percent of the time (USAFETAC, 1985)
CIVIL TWILIGHT (15th of month)First light (local standard time)Last light (local standard time)
(NOTE: * = less than 0.5 day)
7.6 7.3 9.5 12.4 9.8 7.2
182
164
185
151
0503 0513 0519 05241855 1842 1817 1753
1-39
95887663
96887661
97897560
95867358
95846952
93826846
13
05351740
140
05521745
vthunderstorms & twilight (USAFETAC, 1985):Sr F
1.3.3 Honduras
Land
Honduras occupies the upper portion of the "knee" of Central America. As Central Amer-ica's second-largest nation (only Nicaragua is larger), Honduras is a little larger thanthe state of Tennessee. While Guatemala and El Salvador form its western border, andNicaragua its long southeastern boundary, Honduras has a short stretch of Pacific coast-line in the south, compared with a long northern Caribbean coast. Its small Pacific coastborders the Gulf of Fonseca, while the extensive Caribbean coast includes the Gulf ofHonduras in the west (see Fig. 1.24).
With its wedge shape, Honduras is about 400 miles from west to east, but only about180 miles from south to north. Honduras, although nearly two-thirds occupied by uplandsand mountains, has no active volcanoes as do its neighbors, but its highest peak is Cerrode las Minas (9,347 feet) in the west. Mountain ranges approach the northern coastat an angle, with one range continuing submerged out to sea and reappearing as theIslas de la Bahia (Bay Islands) chain. While much of the northern coast is rimmed by alowland of rich clay and loam soils, the Caratasca Lagoon, a swampy lowlands, occupiesthe northeast corner, along the Mosquito Coast22 . Rivers flowing north, including the Uliain the northwest, form fertile valleys. To the south, the Gulf of Fonseca, which contains anarchipelago of nearly 300 tiny islands, is surrounded by a narrow lowland (The DiagramGroup, 1985).
Climate
General While the coastal lowlands are hot and humid, the upland interior is cooler andmuch drier. Although average temperatures in the highlands at 7000 feet are only in thehigh 50's (0F), they reach the mid 80's on the coast. Tegucigalpa, the capital, has anannual temperature range of only 1lF. While the northeast is the wettest region of thecountry, where onshore winds are associated with up to 110 inches of rain per year, someinland valleys receive only 40 inches (The Diagram Group, 1985).
2 2 A strip along the Caribbean Sea (including both northeastern Honduras and the entire east coast ofNicaragua) named for its Miskito Indians.
1-40
NICARAGUA
Ok.w 5.0 1IOU ý
Figure 1.24: Honduras (The Diagram Group, 1985)
1-41
RWIýw.t
+- si•,i
Rainy Season: May - October. During this season, the weather is characterizedby mostly cloudy skies and hot temperatures, with frequent rain showers and thunder-storms. Surprisingly, however, along the north coast on the Gulf of Honduras some stationsrecord the minimal precipitation at this time of year. While precipitation amounts on theCaribbean coast are often very heavy, only moderate amounts are expected in the interior.Mean monthly cloudiness varies between 50 and 85 percent. Depending upon elevation,mean minimum temperatures vary between the 60's and the upper 70's (0 F). Note thatthe data given below are for Tegucigalpa (3,304 feet). Maximum monthly temperaturesrange from the upper 80's to the lower 90's, with particularly hot low lying Pacific coaststations. Thunderstorms occur with greater frequency at coastal stations. Surface windsare normally northerly or northeasterly at 6-10 kt. See Section 5 for details concerningtropical storms or hurricanes that primarily affect the Caribbean coastal areas.
Flying weather: Usually good, except in the vicinity of thunderstorms. Ceiling/visibilityless than 5000/6 occurs 25-45 percent of the time, while less than 1500/3 occurs 5-10 per-cent, and less than 500/1 occurs 1-6 percent. Icing and turbulence are not expected exceptnear rain showers and thunderstorms; however, early morning fog can be a problem atmountain stations (see Appendix B for ceiling/visibility statistics at several coastal andinland cities).
Terminal weather: Tegucigalpa. Generally good. Ceiling/visibility less than 300/1rarely occurs; yet fog forms on 14-22 mornings per month, but rarely restricts visibilitybelow 3 miles. As indicated below, thunderstorms occur on 6-12 days per month, normallyduring early evening. Occurrence of crosswinds greater than 15 kt is 1-3 percent, normallyduring late afternoon and early evening (USAFETAC, 1985).
Monthly temperature, precipitation, thunderstorms & twilight (USAFETAC, 1985):TEGUCIGALPA MAY JUN JUL AUG SEP OCTTEMPERATURE ('F)Absolute maximum 94 90 89 91 90 88Mean maximum 85 82 81 83 83 80Mean minimum 64 65 64 63 63 63Absolute minimum 49 56 55 54 55 52
MEAN PRECIPITATION (INCHES) 5.7 6.3 3.5 3.9 7.2 5.4MEAN NUMBER OF DAYSPrecipitation 11 17 15 14 19 16Thunderstorms 9 12 7 7 11 6
CIVIL TWILIGHT (15th of month)First light (local standard time) 0459 0457 0505 0513 0516 0518Last light (local standard time) 1831 1841 1844 1833 1812 1751
1-42
Dry Season: November - April. The weather during this season is characterized bypartly cloudy skies and infrequent rainfall, yet warm to hot temperatures. However, inthe eastern part of the country near the Caribbean Sea the rainy season does not enduntil December, and moreover, the north coast, on the Gulf of Honduras, receives itsmaximum rainfall at this time. Rain occurs 5-20 days per month along the northerncoast, but generally less than 5 days per month in the interior (see Tegucigalpa databelow) and on the Pacific coast. Mean monthly cloudiness in the interior is about 55-75percent, and 30-50 percent on the Pacific coast, where offshore winds dominate. Whileminimum temperatures range from 55 to 75 (0F), maximum temperatures range from 70to 85 (0F). Along the narrow Pacific coast, extremely high temperatures (over 100°F)occur daily. Thunderstorms occur 2-6 days per month in November and December (less inTegucigalpa, see below), but less frequently in later months. Mean surface winds are northto northeast at 8-15 kt (i.e., stronger than in the rainy season). Extratropical cold frontsoccasionally reach the north coast causing one to two days of rain and strong northerlywinds.
Flying weather: Usually good. Ceiling/visibility less than 5000 feet and/or 6 milesoccurs 15-45 percent, while less than 1500/3 occurs 1-5 percent, and less than 500/1rarely occurs. Along the north coast, aircraft icing can occur above the freezing level instratified cloudiness (see Appendix B for ceiling/visibility statistics at several cities).
Terminal weather: Tegucigalpa. Good. Ceiling/visibility less than 300/1 seldom occurs;morning fog is common, but it seldom restricts visibility significantly. While precipitationoccurs 2-9 days per month, thunderstorms are rare except in April (see below). Occurrenceof crosswinds greater than 15 kt is 2-5 percent (USAFETAC, 1985).
Monthly temperature, precipitation, thunderstorms & twilight (USAFETAC, 1985):TEGUCIGALPA NOV DEC JAN FEB MAR APRTEMPERATURE (F)
CIVIL TWILIGHT (15th of month)First light (local standard time) 0527 0542 0554 0551 0535 0514Last light (local standard time) 1740 1746 1803 1816 1821 1824
(NOTE: * = less than 0.5 day)
1-43
1.3.4 El Salvador
Land
While El Salvador is the most densely populated, it is the smallest nation in CentralAmerica-about the size of the state of Massachusetts.
As indicated in Fig. 1.25, El Salvador, unlike the other six Central American nations,has no Caribbean coast. With Guatemala to the west and Honduras to the north andeast, El Salvador has the Pacific Ocean coast as its entire southern border. Note, however,that only the Gulf of Fonseca separates its southeastern corner from the western tip ofNicaragua.
The shape of El Salvador is roughly rectangular, 160 miles from west to east, and 60miles from north to south. Although not immediately evident, El Salvador can be dividedinto four regions, running roughly the length of the country. The four regions are, fromsouth to north, the Pacific lowlands, the southern mountains, the plateau and the northernmountains.
While only 12 percent of E] Salvador consists of coastal lowlands and bills, lagoonsform part of the southeast coastline. Another third of the nation is formed by the southernmountain chain, at the western end of which is Santa Ana, with a peak at 7,812 feet. Eventhe nation's largest lake, Llopango, lies in an extinct volcanic crater. While some of itsmore than 20 volcanoes are active, with the commensurate expectation of earthquakes,volcanic ash and lava provide the nation's richest soils. The plateau, at an elevationaveraging 2000 feet and comprising more than two-thirds of the country, is drained bythe deep valleys of the Rivers Lempa and San Miguel in the eastern half of El Salvador.Finally, the northern mountains cover about 15 percent of the nation; here El Salvador'shighest peak, Cerro El Pital (8,956 feet), is located (The Diagram Group, 1985).
Climate
General The nation's temperature varies with altitude. While the coast is hot and humid,the high inland regions are cooler. The capital San Salvador, at 2,290 feet, has an annualaverage temperature of only 73°F, with a small range of 5.4°F. While the hottest monthsare April and May, the coolest months are December through February. The country'sannual rainfall is 72 inches; however, the higher mountains receive more and the valleysless than this average (The Diagram Group, 1985).
1-44
Oks 25 50 75 100
Onjiles Ic 20 30 40 50 60
Figure 1.25: El Salvador (The Diagram Group, 1985)
1-45
Rainy season: May - October. Heavy rainfall is expected in warm and cloudy weather,with an occasional tropical storm or hurricane. Cloudy skies dominate with: clear skies,1-3 percent; partly cloudy, 15-35 percent; cloudy, 50-70 percent; and overcast, 10-20percent of the time. Rain is expected 10-25 days per month, usually associated withthunderstorms. However, gusty surface winds in excess of 16 kt are expected less than1 percent of the time, with gale force winds (33 kt) rare. The monthly probability oftropical cyclones and/or hurricanes affecting El Salvador increases from 15 percent in Maythrough July to 30 percent in August through October (see Section 5).
Flying weather: Fair to Poor. The percentage frequencies of ceiling/visibility are : lessthan 5000 feet and/or 6 miles, 10-25 percent; less than 1500/3, 5-10 percent; and lessthan 500/1, 1-2 percent. Not only are thunderstorms and rain very heavy at times, butheavy rain showers and early morning fog can restrict flying conditions. (See Appendix Bfor ceiling/visibility statistics at Acajutla and San Salvador.)
Terminal weather: San Salvador. The weather is warm and cloudy, with numerousthunderstorms and heavy rain showers, leading to ceiling/visibility less than 300/1 for 1-2percent of the time. Runway crosswinds in excess of 15 kt are expected only about I percentof the time. Gusty surface winds in excess of 16 kt are expected less than 1 percent, withgale force winds a rarity. Visibility is obstructed 5-10 percent due primarily to haze/smokeand early morning fog; however, during May visibility is obstructed 30 percent of the timedue to haze/smoke, dust and early morning fog (USAFETAC, 1985).
Monthly temperature, precipitation, thunderstorms & twilight (USAFETAC, 1985):SAN SALVADOR MAY JUN JUL AUG SEP OCTTEMPERATURE ('F)
CIVIL TWILIGHT (15th of month)First light (local standard time) 0507 0505 0513 0521 0524 0526Last light (local standard time) 1838 1848 1851 1840 1819 1759
1-46
Dry season: November - April. The weather is hot and dry (see data below), withclear to partly cloudy skies. Partly cloudy skies dominate with: clear skies, 10-35 percent;partly cloudy, 45-50 percent; cloudy 20-40 percent; and overcast, 1-5 percent of the time.Rain occurs only 1-5 days per month, and is usually associated with a thunderstorm.Visibility is obstructed 5-15 percent of the time during November through March, but thispercentage increases to 40 percent in April, with the primary restrictions to visibility beinghaze/smoke and dust. While gusty surface winds in excess of 16 kt are expected 5 percentof the time, gale force winds are rare. Tropical cyclones and/or hurricanes are rare duringthis period (see Section 5).
Flying weather: Generally good. The percentage frequencies of ceiling/visibility are:less than 5000 feet and/or 6 miles, 5-10 percent, November through March and 25 per-cent in April; less than 1500/3 miles, 1-2 percent; and less than 500/1, rare. However,early morning fog can restrict flying activities in the highlands (see Appendix B for ceil-ing/visibility statistics at Acajutla and San Salvador).
Terminal weather: San Salvador, El Salvador. The weather is hot and dry with ceil-ing/visibility less than 300/1 a rarity. Precipitation is expected 1-5 days per month (seedata below), usually associated with a thunderstorm. Primary restrictions to visibilityare haze/smoke and dust, leading to obstruction to visibility 5-10 percent from Novemberthrough February, 15 percent in March, and increasing to 40 percent in April; however,visibility rarely goes below 3 miles. While gusty runway crosswinds in excess of 15 kt areexpected about 1-2 percent of the time, gusty surface winds in excess of 16 kt are expected5 percent of the time, but gale force winds are rare (USAFETAC, 1985).
Monthly temperature, precipitation, thunderstorms & twilight (USAFETAC, 1985):SAN SALVADOR NOV DEC JAN FEB MAR APRTEMPERATURE (*F)
CIVIL TWILIGHT (15th of month)First light (local standard time) 0534 0549 0601 0558 0543 0522Last light (local standard time) 1748 1755 1811 1823 1828 1831
1-47
1.3.5 Nicaragua
Land
Nicaragua is the largest nation of Central America-a little larger than the state of New
York. With the Caribbean Sea to its east and the Pacific Ocean to its west, Nicaraguaoccupies a "mid" position within Central America (see Fig. 1.26). Only two countries haveborders with Nicaragua, Honduras along the long boundary to the north, and Costa Ricato the south.
The shape of Nicaragua somewhat resembles a triangle formed by the Honduran border,the Caribbean coast, and finally a line produced by the Pacific coast and the Costa Ricanborder. The country's highest mountain Pico Mogot6n (6,913 feet) lies in the northwestnear the Honduran border. From the Honduran border southward there are three separatemountain chains ("cordilleras") in the center of the country: Cordillera Isabella runningnearly parallel to the Honduran border, next Cordillera De Darien running east-west, andfinally Sierra De Amerique (also known as Cordillera Chontalefia) lying to the northeastof Lake Nicaragua. There are many rivers, with River Coco forming much of Nicaragua's
border with Honduras, while the San Juan, likewise, forms much of the southern borderwith Costa Rica.
To the east of these central mountain chains lies Nicaragua's Mosquito coast, one
of the broadest Caribbean lowlands in Central America. This coast extends approxi-mately 336 miles, including deltas, sandbars and lagoons, with offshore reefs23 and islands""cayoa"l).
Lake Nicaragua, Central America's largest lake, lies southwest of the mountain chains.
This lake and smaller Lake Managua, lie parallel to the Pacific coast but inland of about40 volcanoes (some active) which also form a line parallel to the Pacific coastline. ThePacific coast of Nicaragua extends from the Gulf of Fonseca to the Salinas Bay. Volcanic
ash here, as well as in the central valleys, has produced fertile soil (The Diagram Group,1985).
Climate
General The lowlands are hot and humid. On the Pacific coast, average annual temperatureis 81FF, on the Caribbean coast, 79°F; however, mountains, in the northern portion of thecountry, have lower temperatures, i.e., about 64°F.
With 150 inches of rainfall per year, the Caribbean side of Nicaragua has one of the high-est rainfalls in Central America. However, with the prevailing winds (primarily kainbatic)
blowing from the northeast, the Pacific side of Nicaragua receives only about half thatamount with a more marked dry season from January through April (The Diagram Group,1985).
23For further oceanographic details, see Section 4.
1-48
Tr..ýr~~
HONDURAS
4, Ma.n Ports
* < 10.0003 mnhablt*iit_•°N($3 o,oooo-2,sooo
[]25,O1000-10O(
.4l Em ..
CInsOt-LERA DE DARIEN
CARIBBEAN
12'
SEA
PACIFIC
OCEAN
40 w0
San Juaidel S.r
SO
Figure 1.26: Nicaragua (The Diagram Group, 1985)
1-49
h,
0 kms
o miles 20
-- R.'hý
Rainy season: June - October
These months are characterized by frequent precipitation and heavy cloudiness. Night-time temperatures are quite warm, then climb from the low 70's (0 F) in the early morn-ing to the 80's or low 90's by afternoon. Mean sky cover, primarily in the form of lowclouds, ranges from 70 to 80 percent. Precipitation, which is smaller in the interior, ismost frequent along the Caribbean lowlands where the monthly average is 10-26 inches.Precipitation can be expected 17-30 days per month, and thunderstorms are frequentlyaccompanied by strong, gusty winds and violent lightning. Visibilities are generally good,except along the coast. Fog, heavy rain showers, haze and/or smoke restrict coastal regionvisibilities to less than 6 miles, 10-20 days per month. Winds, averaging less than 15 kt,are usually calm during the night and then increase during the day, with 55 kt possibleduring severe thunderstorms. The average monthly probability of a tropical storm and/orhurricane affecting Nicaragua ranges from 15 to 25 percent (see Section 5).
Monthly temperature, precipitation, thunderstorms & twilight (USAFETAC, 1985):MANAGUA JUN JUL AUG SEP OCTTEMPERATURE (0F)
Flying weather: Fair to good. The heavy rainfall along the Caribbean coast, such asat Blueflelds (see totals on previous page), produces ceiling/visibility less than 5000 feetand/or 6 miles for 1-15 percent of the time, with less than 1500/3, 1-3 percent. Whileheavy rain showers and thunderstorms are frequent throughout the country, they are es-pecially prevalent along the coast. Tops of thunderstorms often reach 60,000 feet, somebeing reported as high as 80,000 feet. Severe turbulence is expected with these storms,plus mountain-wave turbulence presents a hazard to flying west of the mountain ridges,i.e., "downwind" of the ridges (see Appendix B for ceiling/visibility statistics for Bluefields,Chinadega, Managua and Puerto Cabezas).
Terminal weather: Good. At Managua, the percentage frequency of ceiling/visibilityless than 300/1 is 0-1 percent; at Blueflelds it is 1-2 percent. While mean winds are lessthan 10 kt during the evening, winds axe 15 kt in the afternoon, with even stronger windsassociated with thunderstorms, tropical storms and/or hurricanes. Heavy rain showers,fog, smoke and/or haze provide the primary restrictions to visibility (USAFETAC, 1985).
Transitional months: November - December
November and December are the transitional months between the rainy and dry sea-sons. The hot temperatures and cloudy skies continue; however, there is a general declinein precipitation (particularly notice Managua's rainfall on the following page). Whilemorning temperatures (high 60's (0F)) are slightly cooler than the rainy season, the after-noons still warm to the low 90's. Mean sky cover (20-40 percent) is lower in the inlandportion of Nicaragua, but the coastal regions remain near 70 percent. Likewise, the meanprecipitation is much less inland than on the coast (compare Managua and Bluefields),with the mean monthly rainfall ranging from 2-20 inches over the country. Thunderstormdays reduce to only 4-6 per month. Fog, smoke and/or haze reduce visibilities to lessthan 2.5 miles approximately 1 day per month. Usually occurring in the afternoon, windsgreater than 16 kt are expected 1-2 days per month. While the probability of at least onetropical storm and/or hurricane affecting Nicaragua is 10 percent in November, tropicalcyclones in December are rare (see Section 5).
Flying weather: Fair to good. Despite the larger rainfall at Blueflelds, the percentagefrequency that ceiling/visibility is less than 5000 feet and/or 6 miles is approximately 5 per-cent, but at Managua, ceiling/visibility less than 5000/6 is about 15 percent. Expectationof ceiling/visibility less than 1500/3 is 1 percent at both stations. Turbulence is anticipatedin thunderstorms; additionally, low-level clear air turbulence is sometimes present on hot,sunny days (see Appendix B for ceiling/visibility statistics for several cities).
Terminal weather:Managua (Las Mercedes), Nicaragua. Warm and cloudy conditions prevail, with light rainstorms and occasionally gusty surface winds. Skies are clear only 5 percent of the time;partly cloudy to cloudy skies dominate 70-80 percent, with overcast, 10-25 percent. Visi-bility is generally good, as early morning fog occurs less than one day per month. Rain isexpected seven days in November, but its frequency decreases to only two days in December(see data below). While gusty winds are expected 2 5 percent of the time, gale force windsare rare and ceiling/visibility less than 300/1 has not been observed.Bluefields, Nicaragua. Cloudy and rainy, with clear skies a rarity. Skies are partly cloudyto cloudy 75-80 percent; overcast, 20-25 percent. Although rainfall is expected 22 daysper month (see data below), the ceiling/visibility rarely goes below 300/1. While gustysurface winds are expected 2-5 percent of the time, gale force winds are a rarity(USAFETAC, 1985).
Absolute maximum 92 91Mean maximum 88 87Mean minimum 71 70Absolute minimum 64 59
MEAN PRECIPITATION (INCHES) 1.2 0.3MEAN NUMBER OF DAYSPrecipitation 7 2Thunderstorms 1 *
BLUEFIELDSTEMPERATURE (°F)
Absolute maximum 93 93Mean maximum 86 85Mean minimum 70 69Absolute minimum 62 62
MEAN PRECIPITATION (INCHES) 15.3 15.7MEAN NUMBER OF DAYS
Precipitation 22 22Thunderstorms 1 *
CIVIL TWILIGHT (15th of month)MANAGUA (LAS MERCEDES)First light (local standard time) 0520 0534Last light (local standard time) 1839 1745
(* = less than 0.5 day)
1-52
Dry season: January - April
Distinguished by a marked decline in rainfall (especially note the small precipitationfor Managua, below), this season is characterized by hot days, cooler nights and partlycloudy skies. Of course, the Caribbean coast remains an exception where cloudiness andrain persist throughout the year (see the precipitation totals for Bluefields, below). Tem-peratures range from near 70°F at night to the low 90's during the afternoon, although theafternoon temperatures at Bluefields are not quite so high. Mean sky cover is lower on thePacific coast and inland (40-50 percent), but, it is near 70 percent along the CaribbeanJcoast. Whereas much of the country experiences only 0.5 inch to 2.0 inches of rainfall,totals reach a maximum near 10 inches along the Caribbean coast, with rain occurring asoften as 23 days of the month. Visibility is generally good, decreasing to 2.5 miles onlyone-three days per month, although visibility is restricted by haze/smoke near industrialcenters. While wind speeds average 10-12 kt, gusty surface winds generally occur as oftenas six days per month. (See Section 5 for hurricane data.)
Monthly temperature, precipitation, thunderstorms & twilight (USAFETAC, 1985):MANAGUA JAN FEB MAR APRTEMPERATURE ('F)
MEAN PRECIPITATION (INCHES)MEAN NUMBER OF DAYSPrecipitationThunderstorms
(* - less than 0.05 inch)
20
05471802
90856960
10.5
220
20
05451813
10
05311817
20
05111818
90 91 9385 87 8869 71 7261 62 62
5.1 3.2 2.9
150
120
110
1-53
Flying weather: Fair to good. Blueflelds on the Caribbean coast experiences ceil-ing/visibility less than 5000 feet and/or 6 miles, 1-3 percent of the time; and less than1500/3, less than 1 percent of the time. In the west, Managua experiences ceiling/visibilityless than 5000/6, 10-15 percent; and less than 2000/2.5, approximately 1 percent of thetime (see Appendix B for ceiling/visibility statistics at several cities).
Terminal weather:Managua (Las Mercedes), Nicaragua. Warm and cloudy with gusty surface winds and littleprecipitation. Skies are clear 10-15 percent of the time, with rain expected only 1-2 daysper month (see data on preceding page). The visibility is restricted by haze and/or smoke45-50 percent, but rarely goes below 6 miles. While gusty surface winds generally exist5-10 percent of the time, gale force winds are experienced less than 1 percent of the time.Ceiling/visibility less than 300/1 is a rarity.Blueflelds, Nicaragua. Cloudy and rainy. Partly cloudy to cloudy skies (85-90 percent)dominate, with overcast skies 10-15 percent of the time and clear skies a rarity. Meanmonthly rainfall, totally 10.5 inches (22 rainfall days) in January, decreases to 2.9 inches(11 rainfall days) in April (see data on preceding the page). Gusty surface winds areexpected 2-5 percent of the time; however, gale force winds are rare. Visibility is restrictedby haze/smoke 25-30 percent of the time, but it rarely goes below 6 miles. While, earlymorning fog forms occasionally, it dissipates rapidly after sunrise (USAFETAC, 1985).
Transitional month: May
May is the transition month between the dry and rainy seasons. Rainfall and cloudinessboth increase in all parts of Nicaragua. Cloudy skies dominate with: clear 1-5 percent,partly cloudy 20-25 percent, cloudy 40-60 percent and overcast 15-35 percent of thetime. While rain occurs on 10-17 days, thunderstorms occur only 2-4 days, dependingon location. As expected, skies are cloudiest and rainfall heaviest on the Caribbean sideof mountains. While winds in excess of 16 kt are expected approximately 5 percent ofthe time, gale force winds are rare. The monthly probability of a tropical storm and/orhurricane affecting Nicaragua, being near zero during the dry season, increases to 5 percent(see Section 5).
Flying weather: Fa.ir to good. At Managua, ceiling/visibility is less than 5000 feetand/or 6 miles, 30 percent of the time; less than 1500/3, approximately 1 percent; andless than 500/1, near zero. Heavy rainfall and cloudiness may restrict flying, particularlyon the eastern side of the mountains. Additionally, mountain-wave turbulence is possibleover and near mountains (see Appendix B for ceiling/visibility statistics for several cities).
Terminal weather: Generally good. While ceiling/visibility is less than 300/1, approx-imately 1-2 percent of the time; rain is, nonetheless, frequent and heavy at times. Fogis expected only 1 percent of the time, primarily during the early morning hours. AtManagua, the visibility is restricted 60 percent of the time by haze and/or smoke. Whilegusty winds greater than 16 kt are expected 5 percent of the time, gale force winds are ararity (USAFETAC, 1985).
CIVIL TWILIGHT (15th of month)MANAGUA (LAS MERCEDES)
First light (local standard time)Last light (local standard time)
3.1
102
94877467
13.6
170
04581824
1-55
1.3.6 Costa Rica
Land
Costa Rica, Central America's fifth-largest nation, is slightly larger than Vermont andNew Hampshire combined. Long and narrow, it has a mountainous spine running fromNicaragua in the north to Panama in the southeast (see Fig. 1.27). Its long irregular Pacificcoastline measures 631 miles compared with a much shorter and more straight Caribbeanshore of only 132 miles.
While the swampy Caribbean coastal plain forms 30 percent of Costa Rica, the moun-tainous spine consists of three mountain ranges (cordilleras), from the northwest to thesoutheast: Guanacaste, Central and Talamanca. It's highest mountain peak Chirrip6(12,529 feet) is found in the southeastern portion of the country in the Talamanca range.Within these ranges, the mountains are flanked by fertile tablelands. The soil has beenmade rich by volcanic ash, such as that which fell from the eruption of Iraz6 (in centralCosta Rica, see Fig. 1.27) in 1963-1964.
On the irregular, low Pacific coast are found both the hilly Nicoya and Osa peninsulas.While the River El Coco (also known as the Rio Grande) flows from central Costa Ricawestward into the Gulf of Nicoya, the country's largest river is the navigable San Juan,shared in part by Nicaragua, which flows into the Caribbean Sea (The Diagram Group,1985).
Climate
General Typical of Central America, Costa Rica has hot, humid coasts, but cooler uplands.Average temperatures range from above 800F near the coast, 69°F in the capital San Jos6,at 3,800 feet, to only 59 0F near 7,500 feet. The "temperate" or "cold" zones start at about1,000 feet, but are lower on the Pacific than on Caribbean slopes.
Not only on the Caribbean coast, but also on the southern Pacific coast, rainfall totalsover 126 inches per year. In particular, on the Caribbean side, northeast winds can pro-vide 300 days with rain-the orographically produced cloudiness on the east side of themountain ranges is frequently evident on satellite imagery (The Diagram Group, 1985).
1-56
NICARAGUA
CARIBBEAN SEA
CA I
Dominicai
9 $1' NatlonaJ Parks
Trunsportatlon
SMarin Roads
4..Malt and Interrats o~ad Aitports
t Man Ports
0Oms[es
PACIFICOCEAN
AMA
50
20
IC4Cr I
40 60
ISO
Ill80 iCC
Figure 1.27: Costa Rica (The Diagram Group, 1985)
1-57
Rainy season: May - November. This is the rainy season with moderate to heavy rain,cloudy skies and warm temperatures. Mean rainfall averages 10 to even 26 inches permonth at some locations. While thunderstorms are expected on 5-10 days per month;skies are clear less than 5 percent of the time; partly cloudy to cloudy, 40-55 percent;and overcast, 50-60 percent. Weather generally improves in November, as the dry seasonapproaches (see Section 5 for the rather unlikely possibility of tropical storm or hurricanethreat).
Flying weather: Poor to fair due to rainfall and cloudiness. Ceiling/visibility is lessthan 5000 feet and/or 6 miles between 10 to 25 percent of the time; less than 1500/3, 5to 10 percent of the time. Thunderstorms are numerous, as noted below (see Appendix Bfor ceiling/visibility statistics for Liberia, Puerto Lim6n, Puntarenas and San Jos6).
Terminal weather: San Jos4/El Coco International, Costa Rica. The weather is warm,cloudy, windy and rainy. While the skies are: clear, less than 5 percent of the time; partlycloudy, 10-20 percent; cloudy, 25-30 percent; and overcast, 40-60 percent, the frequencythat the ceiling/visibility is less than 300/1 is only 2 percent. Whereas winds greater than16 kt are present 5-25 percent of the time, their maximum frequency is realized in July,with their minimum in September-October. Nevertheless, gale force winds are expectedless than 1 percent of the time (USAFETAC, 1985).
MEAN PRECIPITATION (INCHES) 9.3 9.6 7.6 7.4 12.4 14.0 4.8MEAN NUMBER OF DAYSPrecipitation 18 21 23 23 26 26 15Thunderstorms 7 5 5 5 8 6 1
CIVIL TWILIGHT (15th of month)First light (local standard time) 0453 0453 0500 0506 0505 0504 0509Last light (local standard time) 1812 1821 1824 1816 1758 1741 1733
1-58
1-59
Dry season: December - April. The weather, dry and windy in the mountains and west-ern Costa Rica in accordance with the season's name, is, nonetheless, cloudy with mod-erate to heavy rainfall on the Caribbean or eastern side of the mountains. Although
rainfall averages 1 inch or less in the mountains and Pacific coast regions, it remainshigh on the eastern side, 5-22 inches. Thunderstorm occurrence varies from 1-3 days permonth (see data below). While occasional outbreaks of cold air from North America pro-
vide below-normal temperatures and fresh breezes, normal temperatures average in themid 60's to low 70's (°F) during the morning hours and then reach the mid 80's to low 90'sin the afternoon. High winds can be expected in mountainous regions during all months;moreover, isolated mountain locations may be slightly cooler than mentioned earlier.
Flying weather: Generally good. Although the mountains and western Costa Ricagenerally have clear to partly cloudy skies, flying may be restricted in eastern CostaRica in clouds and moderate to heavy rain showers. At San Jos6/E1 Coco International,ceiling/visibility is less than 5000 feet and/or 6 miles approximately 5 percent of the time,while ceiling/visibility less than 1500/3 is approximately I percent of the time (see Ap-pendix B for ceiling/visibility statistics at several cities).
Terminal weather: San Jos6/El Coco International, Costa Rica. While warm and windyconditions exist with clear to partly cloudy skies 45-75 percent of the time, cloudinessincreases in April with the approach of the rainy season. Rainfall is expected only 1-2 days per month during the driest months, January through March (see data below). Fogis rare, but visibility is occasionally restricted by haze and/or smoke. The ceiling/visibilityis less than 300/1 less than 1 percent of the time. Note that winds greater than 16 kt occur50-65 percent of the time; gale force winds, 5-10 percent of the time. Runway crosswindsgreater than 15 kt occur 15--20 percent of the time (USAFETAC, 1985).
Monthly temperature, precipitation, thunderstorms & twilight (USAFETAC, 1985):SAN JOS9•/EL COCO DEC JAN FEB MAR APR
TEMPERATURE (°F)Absolute maximum 87 87 88 91 89Mean maximum 75 75 76 79 79Mean minimum 58 58 58 59 62Absolute minimum 49 49 51 50 53
MEAN PRECIPITATION (INCHES) 1.3 0.2 0.6 0.6 1.7MEAN NUMBER OF DAYS
Precipitation 7 1 2 2 6Thunderstorms 0 * * 1 3
CIVIL TWILIGHT (15th of month)First light (local standard time) 0522 0535 0535 0523 0505Last light (local standard time) 1741 1757 1807 1808 1808
(* = less than 0.5 day)
1.3.7 Panama
Land
Panama is the fourth largest and southernmost of the nations of Central America. It isbordered on the west by Costa Rica and on the east by Colombia, with the Caribbean Seaand North Pacific Ocean forming its northern and southern shores, respectively. WhilePanama is the most narrow country of Central America, its coastline is the longest ofany of the seven nations. At its most narrow width Panama is only 31 miles across (seeFig. 1.28); however, its Pacific coastline extends for 760 miles, and its Caribbean coastlineis 470 miles long.
Low mountain ranges run the length of the country, reaching the greater heights in thewest, including the country's highest peak, the volcano Chiriqu, with an elevation of 11,411feet. The mountain range shown as Serranfa de Tabasara (see Fig. 1.28) is also knownas Cordillera Central. While three-fifths of Panama is mountainous, between parallelmountain ranges lie fertile valleys and plains, in addition to the low-lying, sometimesswampy, coastal strips. Located in the eastern half of the country are the chief rivers: theChagres, near the canal; the Chepo; and the Tuira, with its source in Colombia. Its onlylarge lake, Gatfn, is man-made.
Obvious from Fig. 1.28, its Pacific coast is much indented, with the Azuero Peninsulaforming the western side of the Gulf of Panama. While the country's southeastern coastis on the Gulf of Panama in the Pacific Ocean, much of the northwestern coastline is onthe Mosquito Gulf in the Caribbean Sea. The eastern side of the Gulf of Panama containsthe Pearl Island archipelago, while its largest island, Coiba, lies in the Pacific Ocean tothe west of the Azuero Peninsula.
The Panama Canal cuts across24 the center of Panama, from northwest to southeast(The Diagram Group, 1985).
"24Geography students are often surprised to learn that the Pacific entrance to the Panama Canal is eastof the Caribbean (or Atlantic) entrance to the canal.
1-60
Climate
General The climate of Panama is generally tropical and rainy. While lowland tempera-tures average over 80 0F, uplands axe cooler at 660 F or less. Along the Caribbean coastand in the high mountains, more than 120 inches of rain falls per year; however, parts ofthe Pacific coast around the Gulf of Panama have less than 60 inches per year. Panama isconsidered to be outside the "hurricane belt" (The Diagram Group, 1985).
CARIBBEAN SEA ____
COSTA C,,slobýi CORDILLE,
o , c M A Vi•
t, Chr,-u1lA I.Ct
"00ý NI DEPcc-S10
*- SP,,CIFC S.,CI
S" "SE•R rV • 'SAR ,.And R.. A ...n..p.,oo~ " SLN
% Remt~l5 Sjose
,•.••.•,. ACIFC F, O EANIs"'D
+-Dc
-cc,�
\COLOMBIA
Figure 1.28: Panama (The Diagram Group, 1985)
1-61
1-- -1!IIIIiI
Summer: June - August. During this season25 , the Intertropical Convergence Zone(ITCZ) passes to the north of Panama. The passage of the ITCZ is marked by an in-crease in precipitation, but there is a decrease as the ITCZ moves farther north. Thetypical weather in Panama consists of cloudy skies, high humidity, very warm tempera-tures and frequent afternoon showers and thunderstorms. Maximum temperatures are near90'F along the coasts and 70*F-800 F in the mountains; whereas, minima are generally inthe low 70's near the coast and mid 50's in the mountains. Mean cloudiness is a relativelarge 70-95 percent, and the average relative humidity is near 85 percent. Precipitation islikely 15-25 days per month, with thunderstorms 10-15 days per month. Gale force windsare a rarity.
Flying weather: While ceiling/visibility less than 5000 feet and/or 6 miles occurs only10-30 percent of the time along the southern coast, ceiling/visibility less than 5000/6 occurs40-65 percent of the time along the northern coast and over the mountain ranges. Similarly,ceiling/visibility less than 1500/3 occurs 2-12 percent of the time along the southern coast,but 15-35 percent along the northern coast or mountain ranges. Finally, ceiling/visibilityless than 500/1 occurs 1-2 percent along the southern coast, yet 2-10 percent along thenorthern coast and mountain ranges. Expect late afternoon thunderstorms to affect anylate afternoon flying operations; however, conditions normally improve at night. (SeeAppendix B for ceiling/visibility statistics for Fort Sherman, Howard Air Force Base andRio Hato.)
Terminal weather:Panama City/Torrijos International. While ceiling/visibility less than 300/1 occurs only1-5 percent of the time, the most likely time is in the afternoon. Thunderstorms (about17 or 18 days per month, see data on following page) provide the greatest problem (US-AFETAC, 1985).
25Unlike the other six countries of Central America, with their rainy season and dry season, the proximityand effects of the Intertropical Convergence Zone (ITCZ) dictate the use of the more classical four seasonsfor Panama.
1-62
Monthly temperature, precipitation, thunderstorms & twilightPANAMA CITY/TORRIJOS INTERNATIONAL JUN JULTEMPERATURE ('F)
CIVIL TWILIGHT (15th of month)First light (local standard time)Last light (local standard time)
CHANGUINOLA INTERNATIONAL *
TEMPERATURE ('F)Absolute maximumMean maximumMean minimumAbsolute minimum
95877569
95887469
(USAFETAC, 1985):AUG
97867468
7.9 7.6 7.5
2117
05371901
93897369
MEAN PRECIPITATION (INCHES)MEAN NUMBER OF DAYS
PrecipitationThunderstorms
(*Changuinola is near the northwest
Caribbean coast, just east of Guabito.)
2117
05441905
93887368
2218
05491905
93887369
7.9 11.3 9.3
1813
2117
1817
1-63
Autumn: September - November. The autumn marks the return southward of theITCZ. The table on the next page indicates a secondary precipitation maximum in Oc-tober for Panama City, but in November for Changuinola. This season generally has themost precipitation, highest mean relative humidity and lowest wind speed. Maximumtemperatures are in the mid to high 8O's (0 F) along the coast, but only in the 700F-800 Frange in the mountains. Both relative humidity averages (87 percent) and mean cloudcover (70 to 95 percent) are high. While precipitation occurs on 22-27 days per month,thunderstorms can be expected 10-20 days per month. Gale force winds remain extremelyrare.
Flying weather: Ceiling/visibility below 5000 feet and/or 6 miles occurs 5-25 percent ofthe time along the Pacific coast, but 15-40 percent along the Caribbean coast and on thecontinental divide. Less than 1500/3 occurs 3-10 percent of the time along the Pacific coast,however, 1-25 percent along the Caribbean coast and on the continental divide. Whileceiling/visibility less than 500/1 occurs less than 1 percent along the southern coast, 500/1occurs about 3 percent along the northern coast and on the continental divide. Afternoonshowers and thunderstorms produce low ceilings that may restrict flight operations. (SeeAppendix B for ceiling/visibility statistics for several stations.)
Terminal weather:Panama City/Torrijos International. While ceiling/visibility less than 300/1 occurs only1-4 percent of the time, thunderstorms are numerous during this season occurring anaverage of 18 days in October (see data on the following page) (USAFETAG, 1985).
Absolute maximum 95 95Mean maximum 85 85Mean minimum 75 74Absolute minimum 69 69
MEAN PRECIPITATION (INCHES) 7.5 11.6MEAN NUMBER OF DAYS
Precipitation 23 24Thunderstorms 15 18
CIVIL TWILIGHT (15th of month)First light (local standard time) 0547 0545Last light (local standard time) 1839 1823
CHANGUINOLA INTERNATIONAL *
TEMPERATURE (0F)Absolute maximumMean maximumMean minimumAbsolute minimum
MEAN PRECIPITATION (INCHES)MEAN NUMBER OF DAYS
PrecipitationThunderstorms
94897358
5.1
1415
94897259
5.5
1613
(USAFETAC, 1985):NOV
94857466
10.2
2210
05491817
93897158
10.1
189
(*Changuinola is near the northwestCaribbean coast, just east of Guabito.)
1-65
Winter: December - February. Winter (although such a seasonal title does not seemappropriate to mid-latitude dwellers) in Panama is the start of the dry season-moreevident at Panama City than at Changuinola (see precipitation totals, on the followingpage). During this season, skies are partly cloudy, and temperatures remain high withwindy conditions. The ITCZ moves far to the south of Panama, permitting the northeastwinds to dominate (see Fig. 1.4). Maximum temperatures are in the high 80's (OF) alongthe coasts, and near 70°F in the central mountains. Minimum temperatures lie in thelow 70's (0F) along the coast, but in the range 46°F to 59°F in the central mountains.While mean cloudiness in 50-70 percent, higher values are found along the northern coast(note the greater rainfall at Changuinola, on the following page) and in the mountains.Relative humidity values range from 50-90 percent, also highest in December and alongthe northern coast. Precipitation occurs mainly from afternoon and evening showers andthunderstorms: 5-15 days per month along the southern coast; and 10-25 days per monthin the mountains and along the northern coast. However, thunderstorms are at a minimumaveraging 0-5 days per month. While winds 17 kt or greater occur 5-20 percent of thetime in January and February, gale force winds are rare, occurring only 2 percent of thetime.
Flying weather: Fair to good. Ceiling/visibility below 5000 feet and/or 6 miles occurs 2-12 percent of the time on the southern coast, but 10-30 percent over the continental divideand the northern coast. Similarly, ceiling/visibility less 1500/3 occurs about 1 percent ofthe time over the southern coast, yet 5-15 percent over the mountains and northern coast.Ceiling/visibility less than 500/1 rarely occurs. The least favorable flying weather occursin the late afternoon due to shower activity (see Appendix B for ceiling/visibility statisticsat several stations).
Terminal weather:Panama City/Torrijos International. Good. Ceiling/visibility less than 500/1 occurs lessthan 1 percent of the time, with the worst flying conditions in late afternoon. Thunder-storm frequency, highest in December, is much smaller in January and February(USAFETAC, 1985).
1-66
Monthly temperature, precipitation, thunderstorms & twilightPANAMA CITY/TORRIJOS INTERNATIONAL DEC JANTEMPERATURE (0F)
(#Changuinola is near the northwestCaribbean coast, just east of Guabito.)(* - less than 0.5 day)
06161840
96877065
06161849
91877165
13.4 9.3 6.2
212
17 140
1-67
Spring: March - May. As the ITCZ begins its return northward, spring marks theend of Panama's dry season. However, rainfall doesn't increase dramatically until May,especially in Panama City (see data on next page). Additionally, most locations have theirminimum rainfall during the month of March (which in this particular seasonal groupingcomes a month after the "dry" season). Compared with the winter values, mean cloudinessincreases to 45-90 percent, with higher values in the mountains. While daily maximumtemperatures are in the mid to high 80's (0F) along the coast, the maximum temperatureaverages in the 70'F - 79°F range in the mountains. Average minimum temperaturesalong the coast are in the mid 70's (°F), with 46°F - 60'F in the mountains. Averagerelative humidity is 75-80 percent. Precipitation gradually increases, especially noticeableat Panama City where the average of four precipitation days per month during Marchincreases to 22 in May (see data on the following page). Thunderstorms also increaseat Panama City, from one per month in March to 15 in May. Gale force winds, althoughslightly more frequent on the southwest coast, have an average frequency of only 1 percent.
Flying weather: Fair to good. Ceiling/visibility less than 5000 feet and/or 6 milesoccurs 5-15 percent of the time along the southern coast, yet 15-40 percent along thenorthern coast and in the mountains. Similarly, ceiling/visibility less than 1500/3 occursonly 1-5 percent along the southern coast, compared to 10-20 percent along the northerncoast and continental divide. Although ceiling/visibility less than 500/1 averages less than1 percent, diurnal showers and thunderstorms lead to deteriorating conditions in the lateafternoon and evening (see Appendix B for ceiling/visibility statistics for several stations).
Terminal weather:Panama City/Torrijos International. Good. While ceiling/visibility less than 300/1 occursonly 1-2 percent of the time, the worst conditions occur in the morning near inland lakesand bays, and in the afternoon in the mountains. Thunderstorm frequency triples in Maycompared with March and April (USAFETAC, 1985).
1-68
Monthly temperature, precipitation, thunderstorms & twilight (USAFETAC, 1985):PANAMA CITY/TORRIJOS INTERNATIONAL MAR APR MAYTEMPERATURE ('F)
Absolute maximum 97 94 96Mean maximum 90 90 88Mean minimum 74 74 75Absolute minimum 63 64 69
MEAN PRECIPITATION (INCHES) 0.3 2.7 8.8MEAN NUMBER OF DAYS
Precipitation 4 9 22Thunderstorms 1 4 15
CIVIL TWILIGHT (15th of month)First light (local standard time) 0604 0548 0537Last light (local standard time) 1850 1849 1901
CHANGUINOLA INTERNATIONAL #TEMPERATURE ('F)
Absolute maximum 92 93 94Mean maximum 88 88 89Mean minimum 71 72 73Absolute minimum 66 68 64
MEAN PRECIPITATION (INCHES) 5.7 7.2 8.4MEAN NUMBER OF DAYS
Precipitation 10 12 12Thunderstorms * 2 10
(#Changuinola is near the northwestCaribbean coast, just east of Guabito.)(* = less than 0.5 day)