32
Troubleshooting Activated Sludge Processes PNCWA - Southeast Idaho Operators Section Pocatello, ID | February 11, 2016| Jim Goodley, P.E .

Troubleshooting Activated Sludge Processes
PNCWA - Southeast Idaho Operators Section Pocatello, ID | February 11, 2016| Jim Goodley, P.E.
Outline
• Process Types & Kinetics
• Influent Monitoring
• Process Monitoring & Control
• Nitrification

Intensive Sampling?
Process Flow Regimes
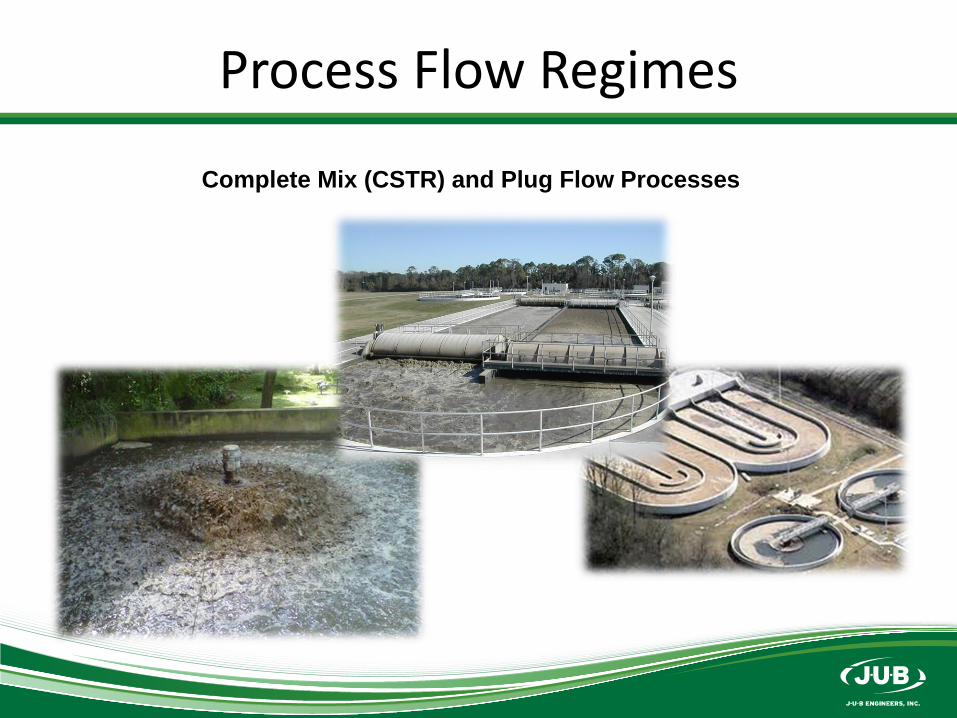
Complete Mix (CSTR) and Plug Flow Processes
Complete Mix (aka CSTR)
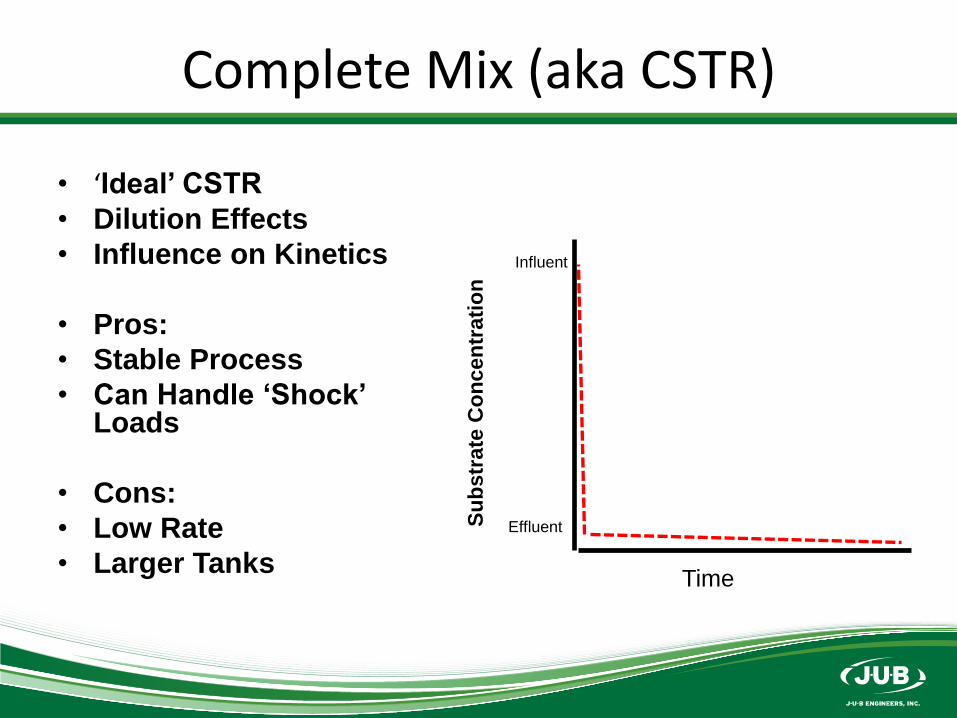
• ‘Ideal’ CSTR
• Dilution Effects
• Influence on Kinetics
• Pros:
• Stable Process
• Can Handle ‘Shock’ Loads
• Cons:
• Low Rate
• Larger Tanks Time
Su
bstr
ate
Co
ncen
trati
on
Influent
Effluent
Growth Kinetics
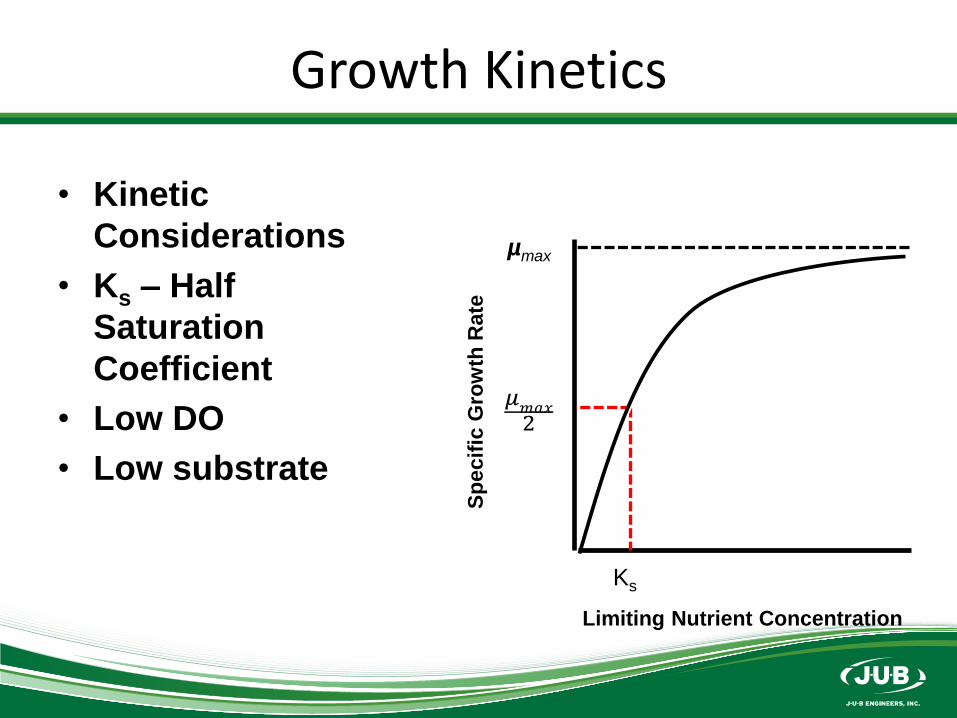
• Kinetic
Considerations
• Ks – Half
Saturation
Coefficient
• Low DO
• Low substrate
Ks
𝜇𝑚𝑎𝑥2
µmax
Limiting Nutrient Concentration
Sp
ecif
ic G
row
th R
ate
Growth Kinetics
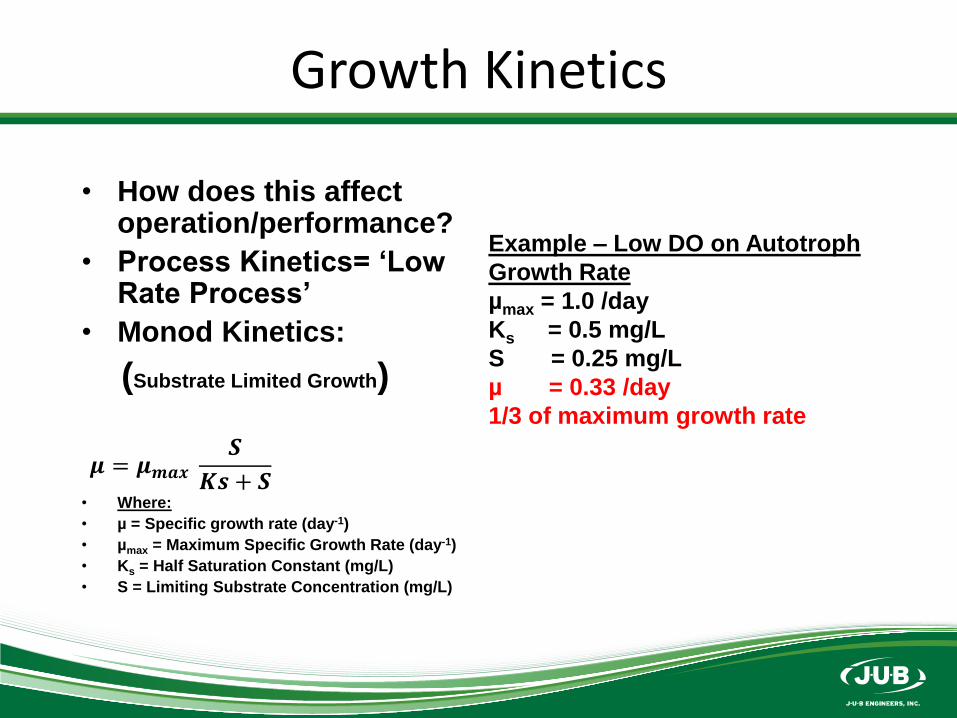
• How does this affect operation/performance?
• Process Kinetics= ‘Low Rate Process’
• Monod Kinetics:
(Substrate Limited Growth)
• Where:
• µ = Specific growth rate (day-1)
• µmax = Maximum Specific Growth Rate (day-1)
• Ks = Half Saturation Constant (mg/L)
• S = Limiting Substrate Concentration (mg/L)
𝝁 = 𝝁𝒎𝒂𝒙𝑺
𝑲𝒔 + 𝑺
Example – Low DO on Autotroph
Growth Rate
µmax = 1.0 /day
Ks = 0.5 mg/L
S = 0.25 mg/L
µ = 0.33 /day
1/3 of maximum growth rate
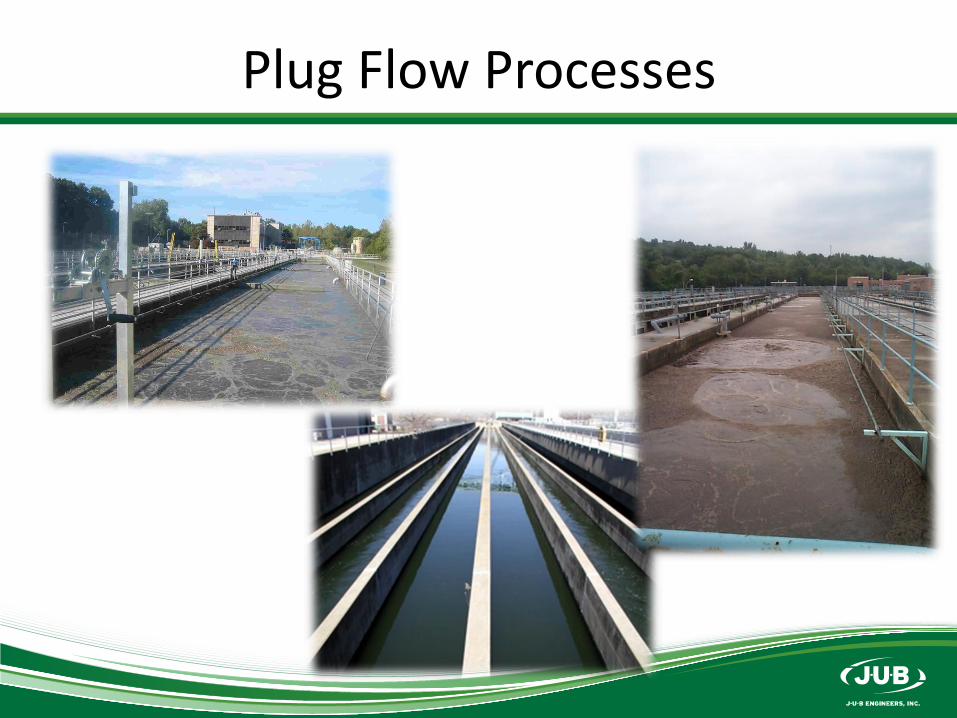
Plug Flow Processes
Plug Flow Processes
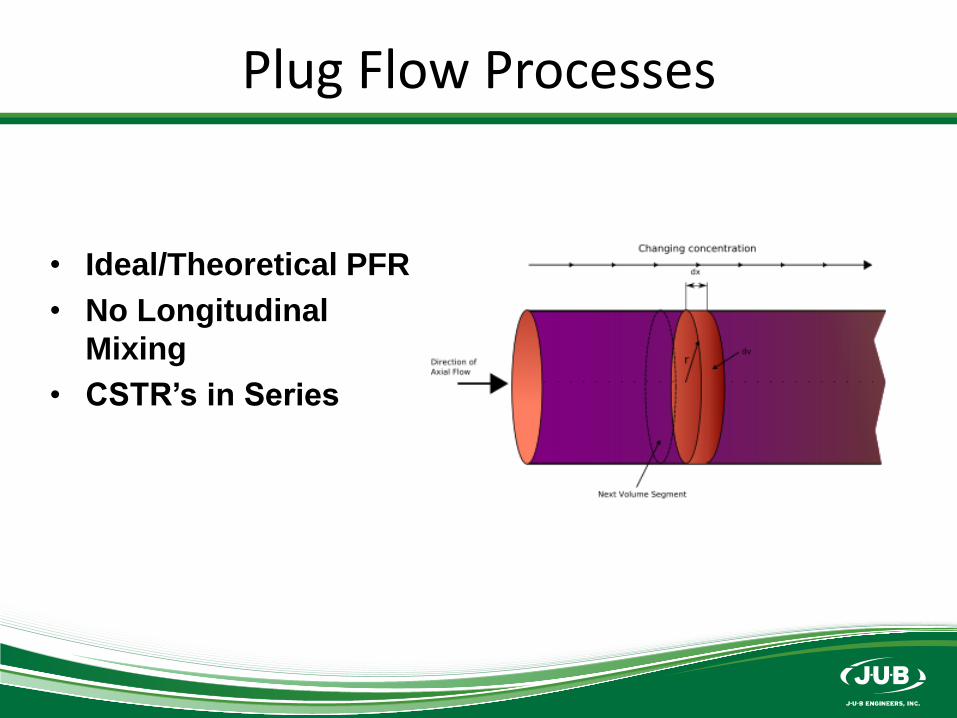
• Ideal/Theoretical PFR
• No Longitudinal
Mixing
• CSTR’s in Series
Plug Flow Processes
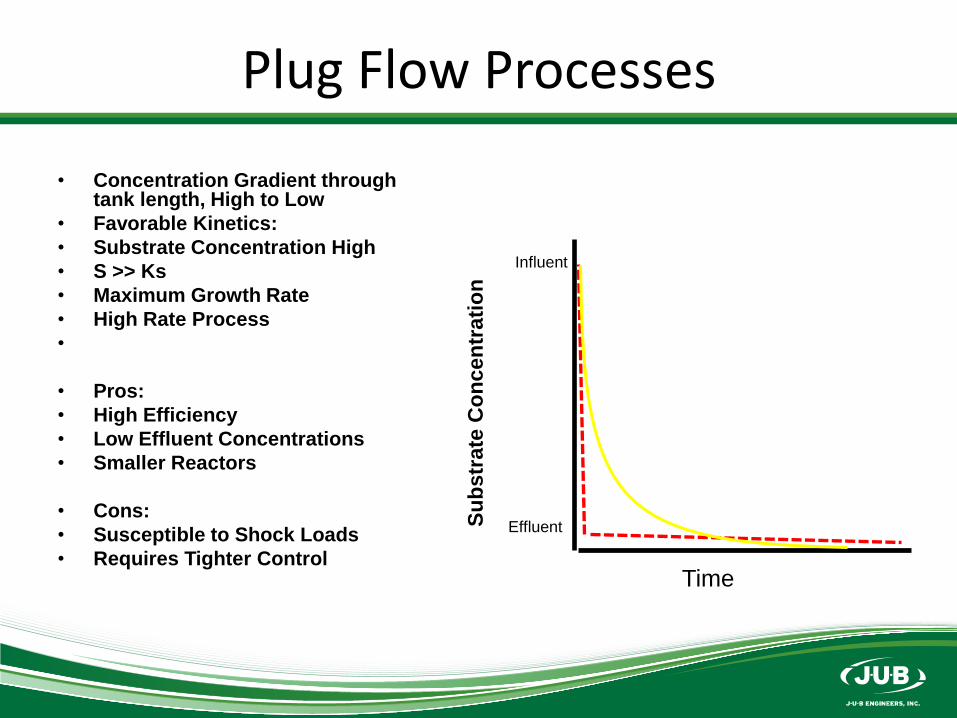
• Concentration Gradient through tank length, High to Low
• Favorable Kinetics:
• Substrate Concentration High
• S >> Ks
• Maximum Growth Rate
• High Rate Process
•
• Pros:
• High Efficiency
• Low Effluent Concentrations
• Smaller Reactors
• Cons:
• Susceptible to Shock Loads
• Requires Tighter ControlTime
Su
bstr
ate
Co
ncen
trati
on
Influent
Effluent

Influent Monitoring
Influent changes are often the cause of operational issues.
Influent Monitoring
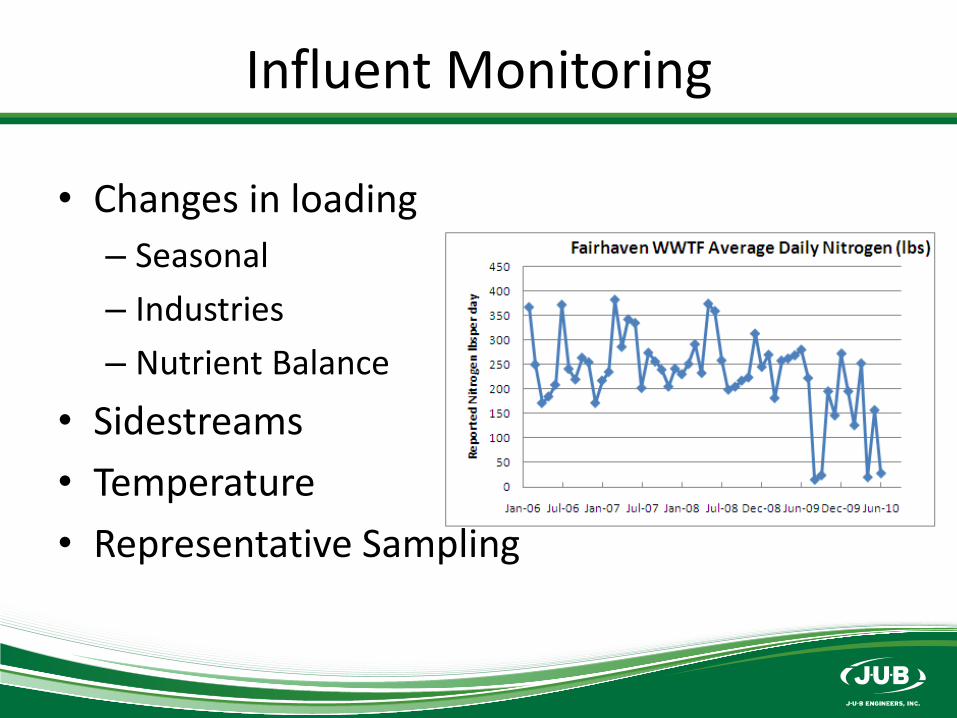
• Changes in loading
– Seasonal
– Industries
– Nutrient Balance
• Sidestreams
• Temperature
• Representative Sampling
Influent Monitoring
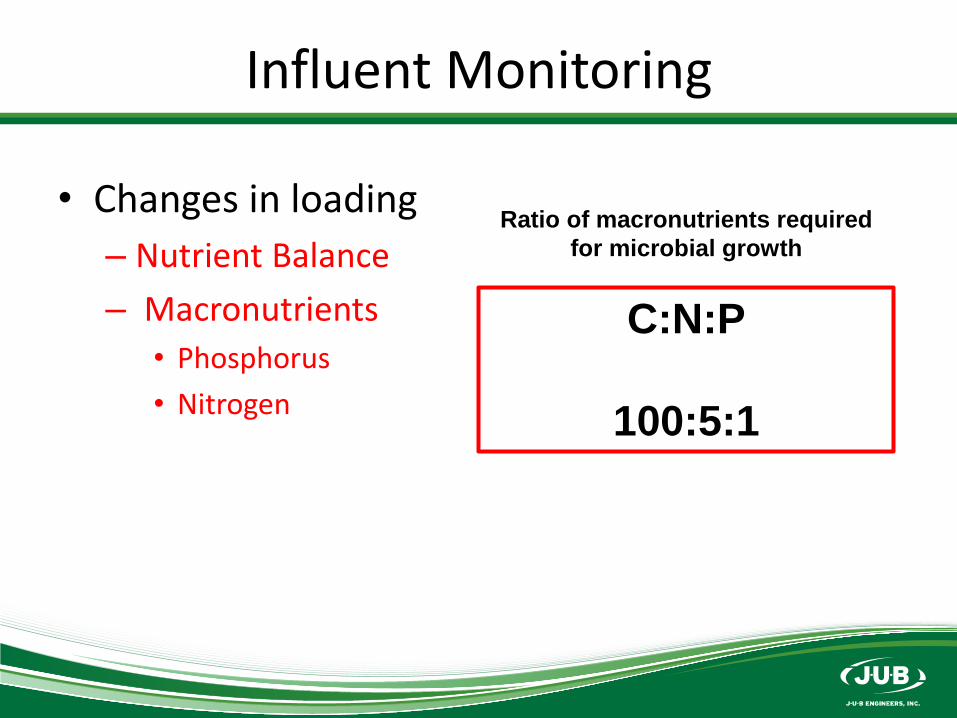
• Changes in loading
– Nutrient Balance
– Macronutrients
• Phosphorus
• Nitrogen
C:N:P
100:5:1
Ratio of macronutrients required
for microbial growth
Influent Monitoring
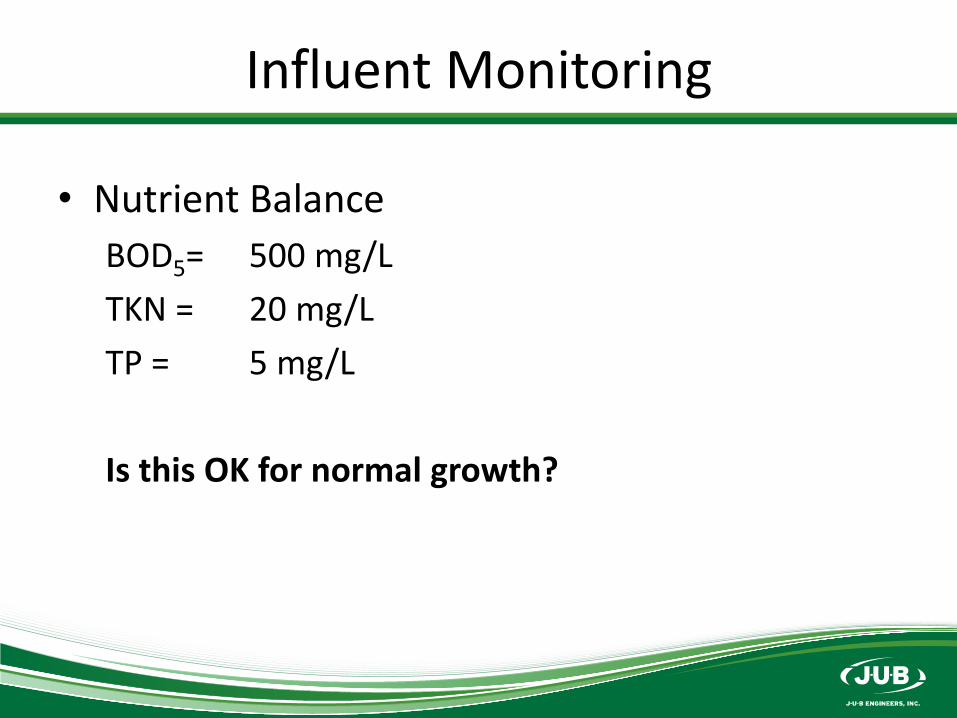
• Nutrient Balance
BOD5= 500 mg/L
TKN = 20 mg/L
TP = 5 mg/L
Is this OK for normal growth?
Influent Monitoring
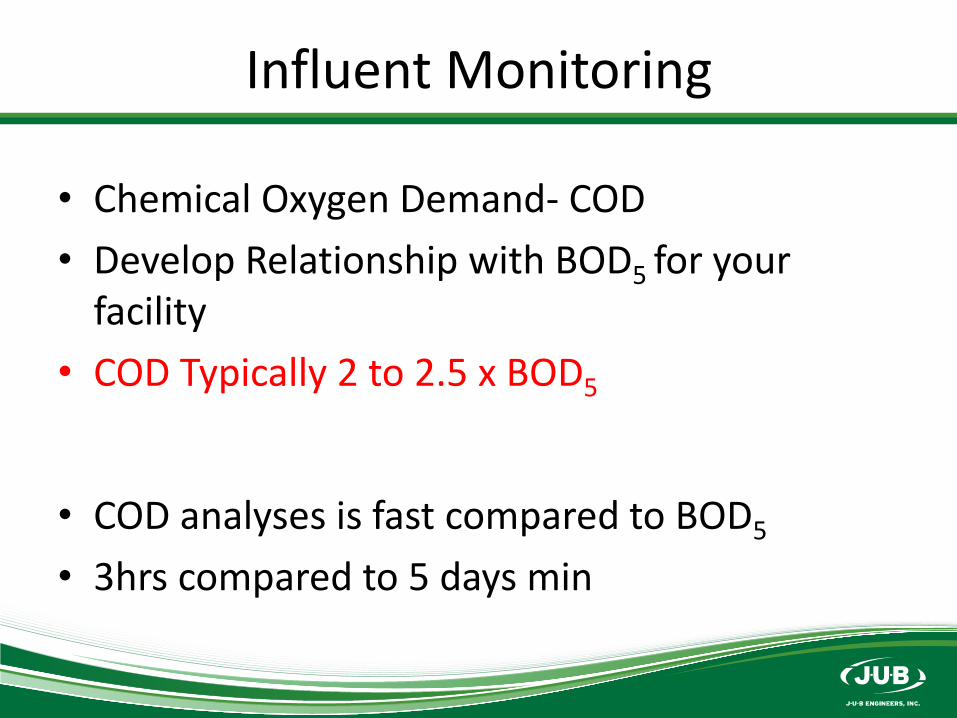
• Chemical Oxygen Demand- COD
• Develop Relationship with BOD5 for your facility
• COD Typically 2 to 2.5 x BOD5
• COD analyses is fast compared to BOD5
• 3hrs compared to 5 days min
Influent Monitoring
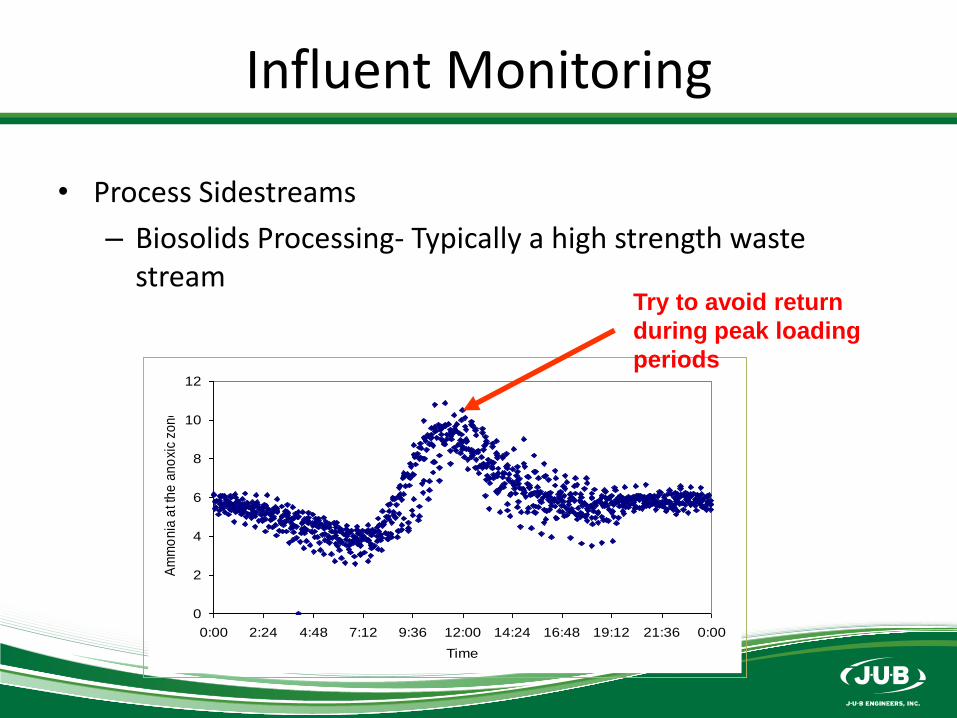
• Process Sidestreams
– Biosolids Processing- Typically a high strength waste stream
0
2
4
6
8
10
12
0:00 2:24 4:48 7:12 9:36 12:00 14:24 16:48 19:12 21:36 0:00
Time
Am
mo
nia
at t
he
an
oxi
c zo
ne
Try to avoid return
during peak loading
periods
Influent Monitoring
• Temperature Changes
Microrganisms are highly sensitive to temperature
Daily Influent Temperature Readings Recommended
Spring & Fall Foaming Events
High Runoff Events- Snowmelt
Industrial Dischargers
Process Monitoring & Control
• Dissolved Oxygen
• F:M
• SVI
Process Monitoring & Control
• Dissolved Oxygen
– Aerobic heterotrophs (BOD5 removal) and autotrophs (nitrification) require oxygen to respire
– Rule of thumb 2.0 mg/L
– Lower concentrations can cause low DO Bulking
• Competition for limited oxygen-Filaments vs Rotifers
• Filaments will outcompete
Process Monitoring & Control
• Dissolved Oxygen
– In Plug Flow Processes monitor DO residual along length of aeration tank- create DO profile.
– Focus at head of tank where demand is highest
– Not true for CSTR process- DO should be nearly the same at all points in tank
– Monitor during peak loading periods
Process Monitoring & Control
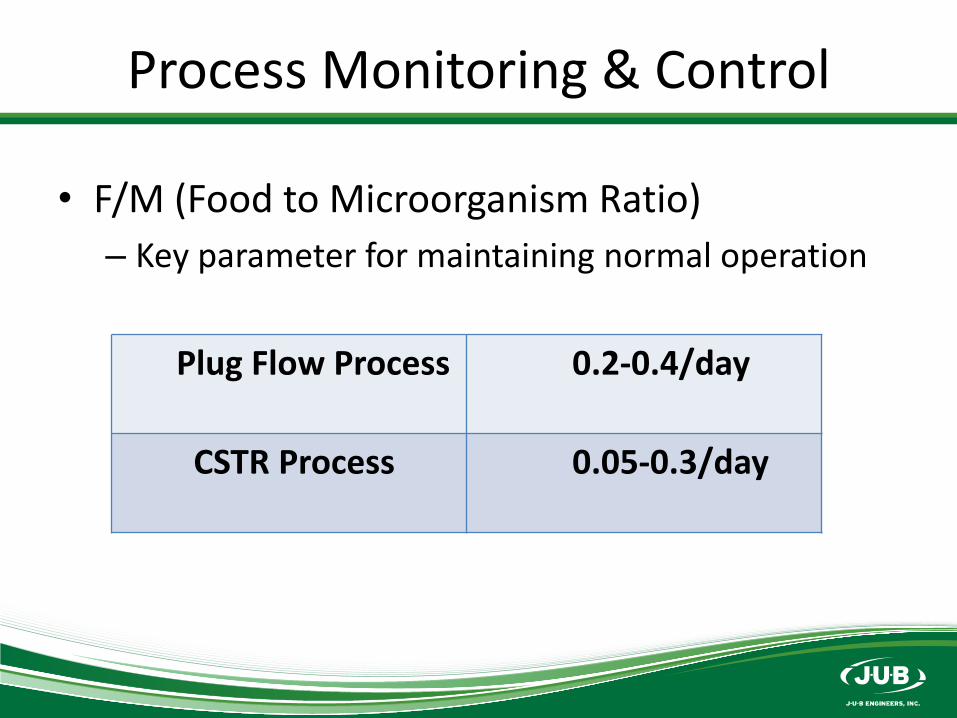
• F/M (Food to Microorganism Ratio)
– Key parameter for maintaining normal operation
Plug Flow Process 0.2-0.4/day
CSTR Process 0.05-0.3/day
Process Monitoring & Control
• F/M (Food to Microorganism Ratio)
– Low F/M is common- Why?
– Engineers are conservative
• Facility designed for future conditions
• Designed to handle peak conditions
• Tends to be oversized for normal conditions
Process Monitoring & Control
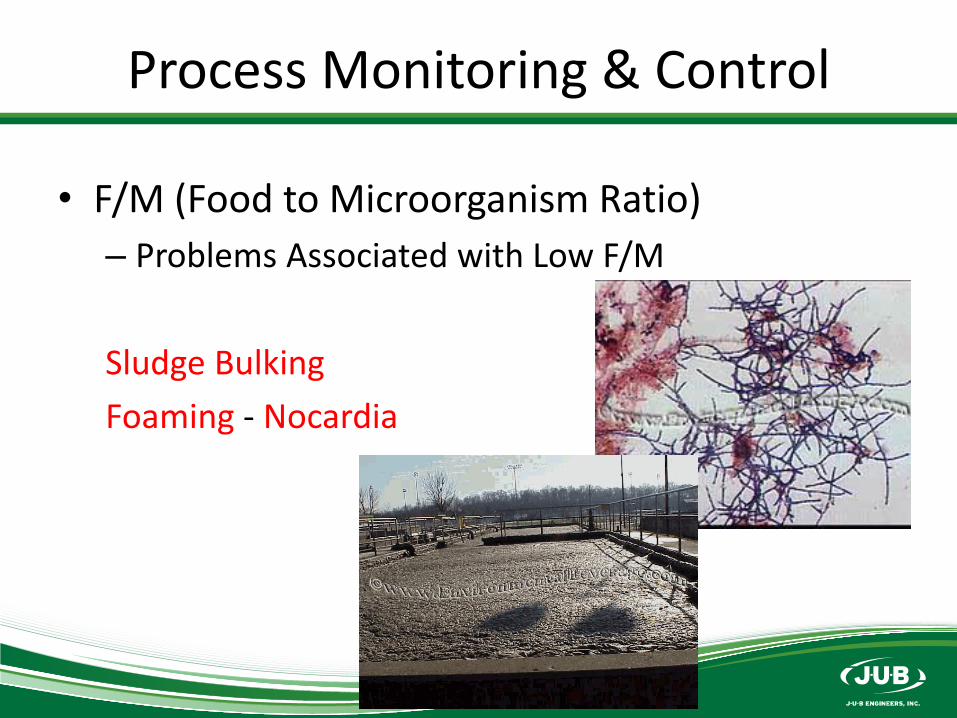
• F/M (Food to Microorganism Ratio)
– Problems Associated with Low F/M
Sludge Bulking
Foaming - Nocardia
Process Monitoring & Control
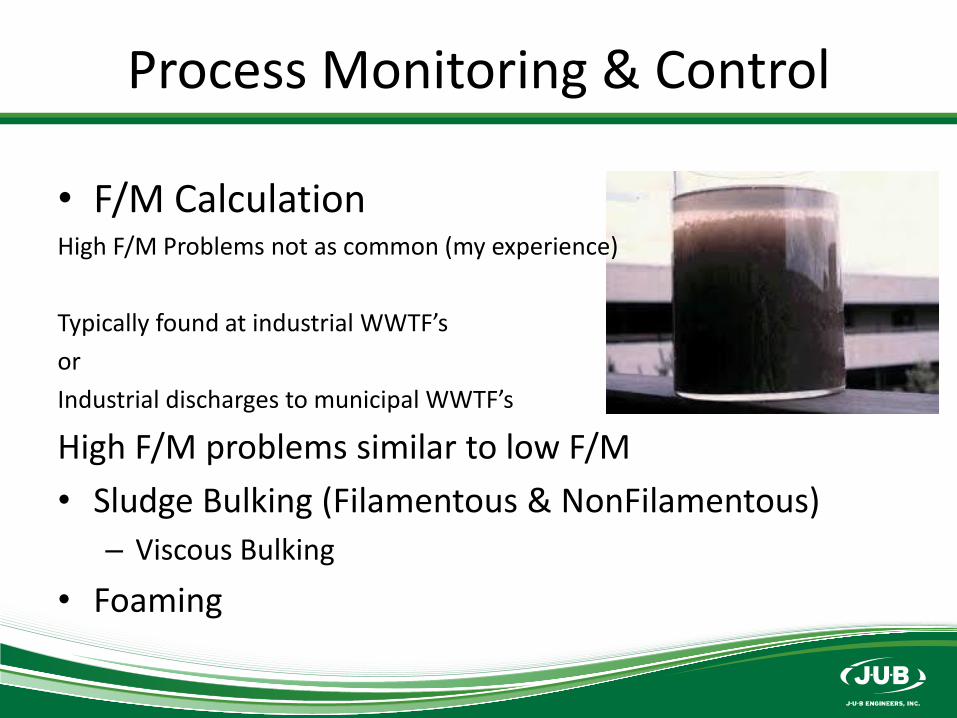
• F/M CalculationHigh F/M Problems not as common (my experience)
Typically found at industrial WWTF’s
or
Industrial discharges to municipal WWTF’s
High F/M problems similar to low F/M
• Sludge Bulking (Filamentous & NonFilamentous)
– Viscous Bulking
• Foaming
Process Monitoring & Control
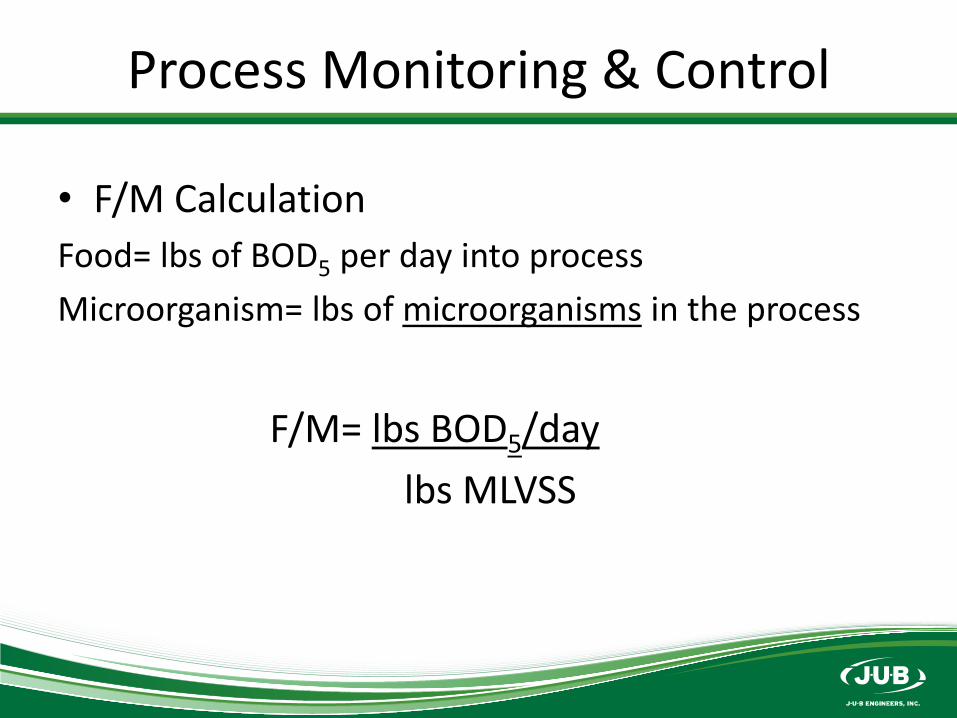
• F/M Calculation
Food= lbs of BOD5 per day into process
Microorganism= lbs of microorganisms in the process
F/M= lbs BOD5/day
lbs MLVSS
Process Control
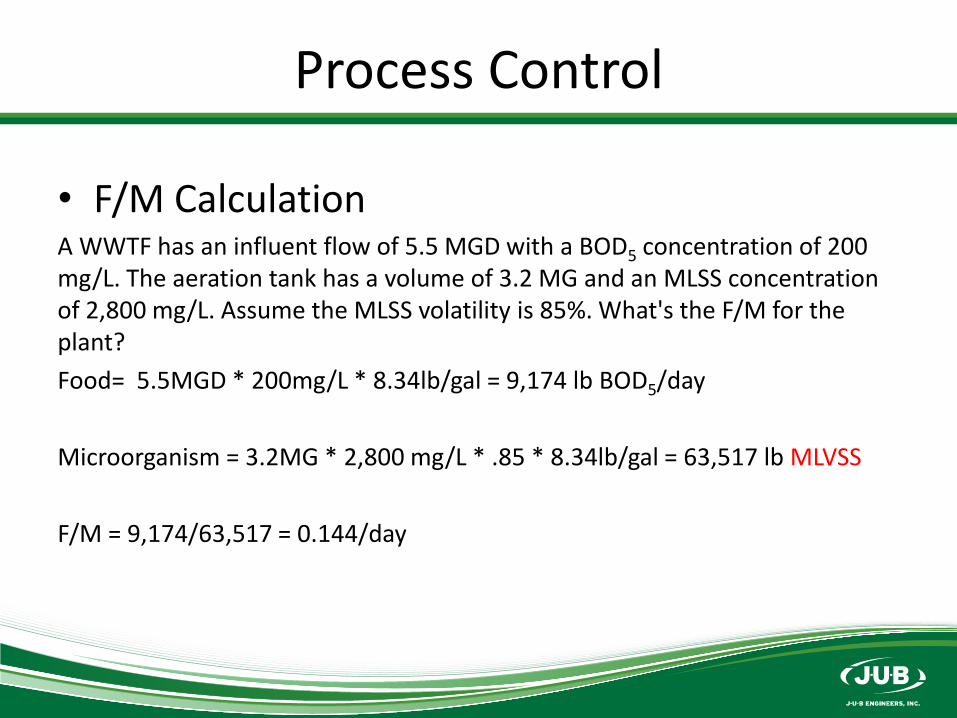
• F/M CalculationA WWTF has an influent flow of 5.5 MGD with a BOD5 concentration of 200 mg/L. The aeration tank has a volume of 3.2 MG and an MLSS concentration of 2,800 mg/L. Assume the MLSS volatility is 85%. What's the F/M for the plant?
Food= 5.5MGD * 200mg/L * 8.34lb/gal = 9,174 lb BOD5/day
Microorganism = 3.2MG * 2,800 mg/L * .85 * 8.34lb/gal = 63,517 lb MLVSS
F/M = 9,174/63,517 = 0.144/day
Process Monitoring & Control
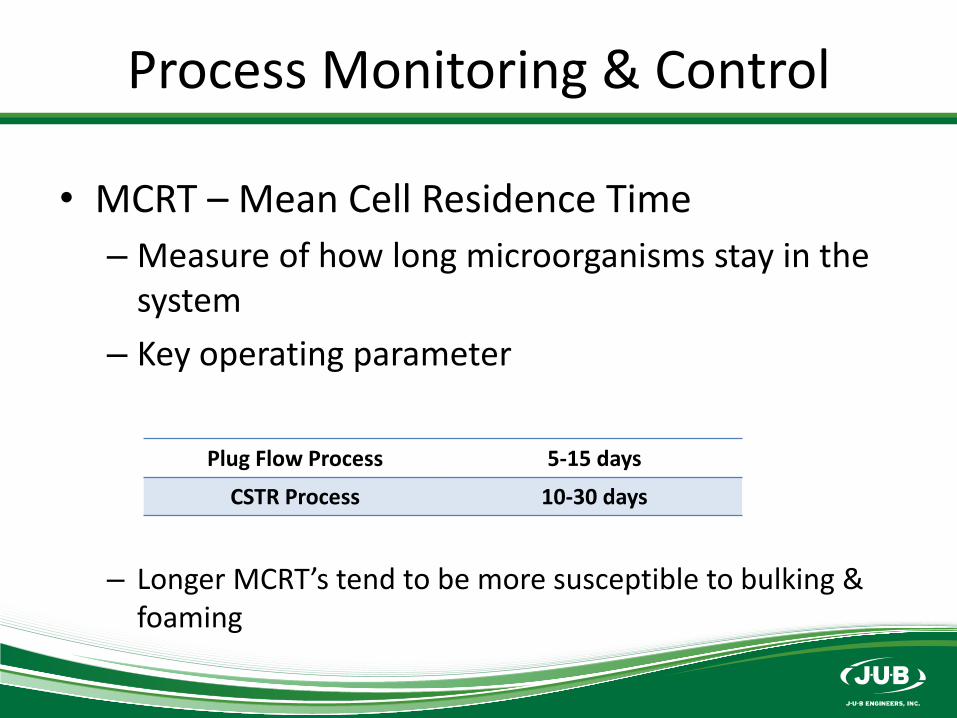
• MCRT – Mean Cell Residence Time
– Measure of how long microorganisms stay in the system
– Key operating parameter
– Longer MCRT’s tend to be more susceptible to bulking & foaming
Plug Flow Process 5-15 days
CSTR Process 10-30 days
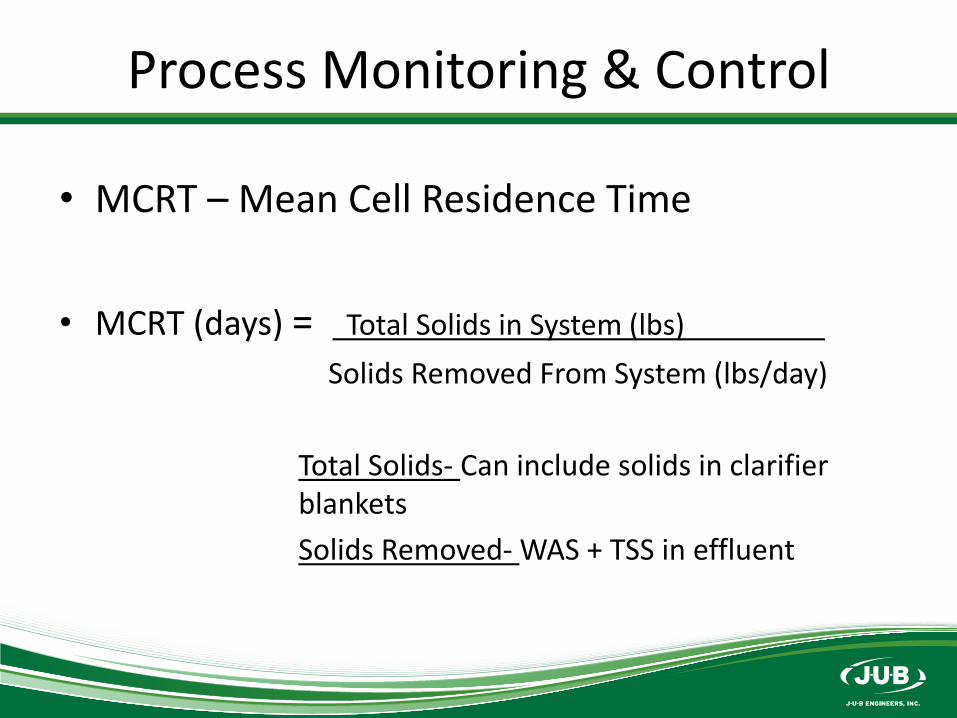
Process Monitoring & Control
• MCRT – Mean Cell Residence Time
• MCRT (days) = Total Solids in System (lbs)
Solids Removed From System (lbs/day)
Total Solids- Can include solids in clarifier blankets
Solids Removed- WAS + TSS in effluent
Process Monitoring
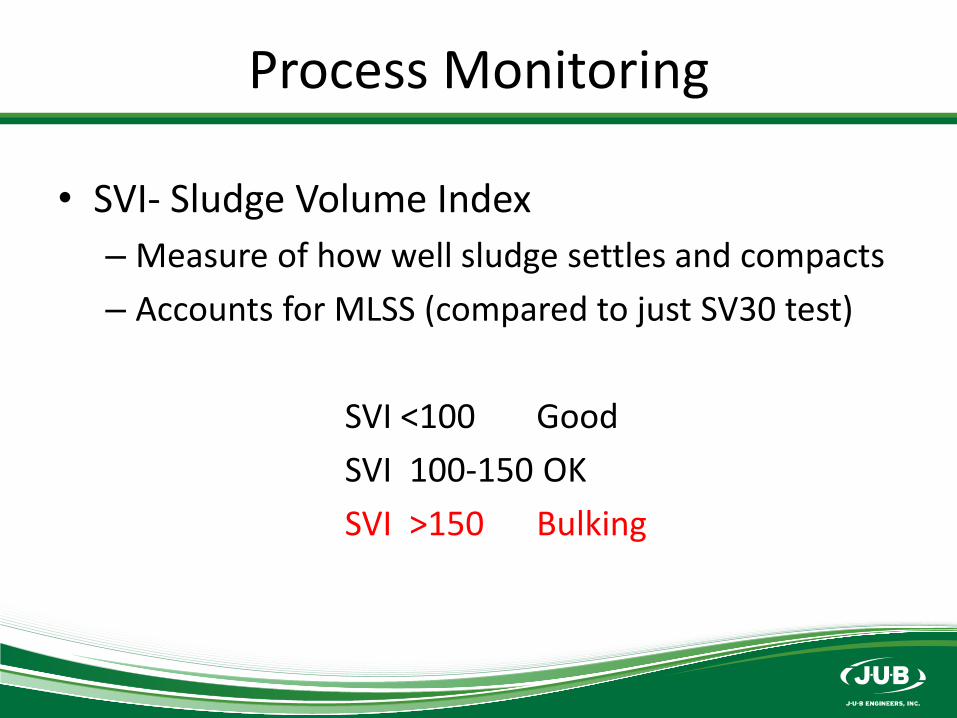
• SVI- Sludge Volume Index
– Measure of how well sludge settles and compacts
– Accounts for MLSS (compared to just SV30 test)
SVI <100 Good
SVI 100-150 OK
SVI >150 Bulking
Process Monitoring
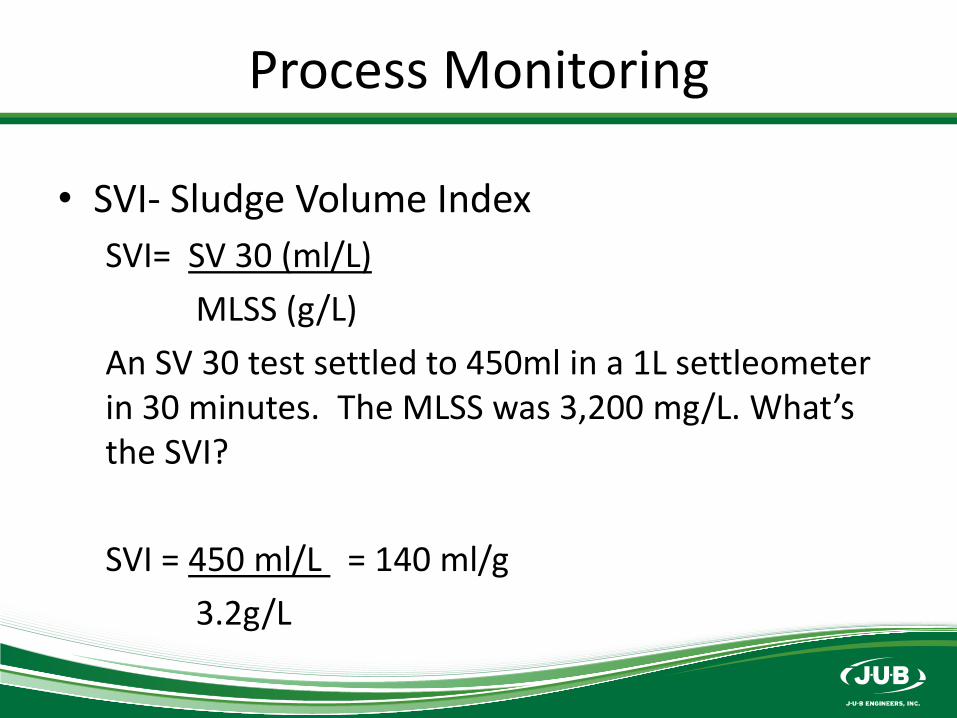
• SVI- Sludge Volume Index
SVI= SV 30 (ml/L)
MLSS (g/L)
An SV 30 test settled to 450ml in a 1L settleometer in 30 minutes. The MLSS was 3,200 mg/L. What’s the SVI?
SVI = 450 ml/L = 140 ml/g
3.2g/L
Process Control
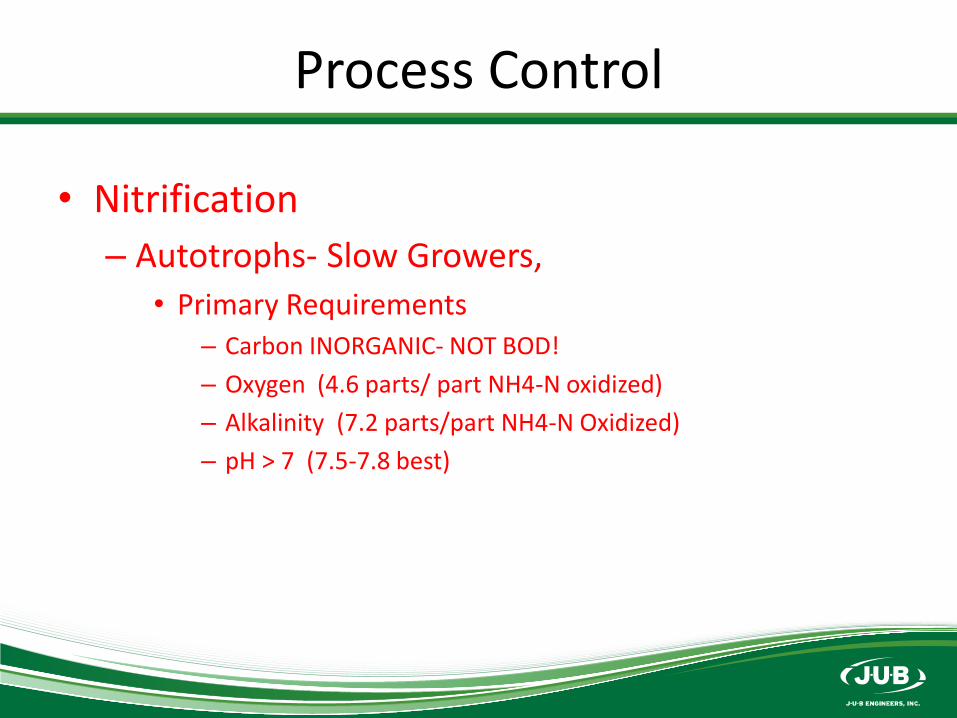
• Nitrification
– Autotrophs- Slow Growers,
• Primary Requirements– Carbon INORGANIC- NOT BOD!
– Oxygen (4.6 parts/ part NH4-N oxidized)
– Alkalinity (7.2 parts/part NH4-N Oxidized)
– pH > 7 (7.5-7.8 best)

Questions?


