TRUANCY INTERVENTION: A STUDY OF DALLAS INDEPENDENT SCHOOL DISTRICT PARTICIPANTS IN THE DALLAS CHALLENGE TRUANCY AND CLASS C ENFORCEMENT CENTER James John Fairchild Jr., B.S. Thesis Prepared for the Degree of MASTER OF SCIENCE UNIVERSITY OF NORTH TEXAS August 2005 APPROVED: Tory Caeti, Major Professor Eric Fritsch, Committee Member Peggy Tobolowsky, Committee Member Robert W. Taylor, Chair of the Department of Criminal Justice David W. Hartman, Dean of the School of Community Service Sandra L. Terrell, Dean of the Robert B. Toulouse School of Graduate Studies
Transcript
TRUANCY INTERVENTION: A STUDY OF DALLAS INDEPENDENT SCHOOL
DISTRICT PARTICIPANTS IN THE DALLAS CHALLENGE TRUANCY AND CLASS C
ENFORCEMENT CENTER
James John Fairchild Jr., B.S.
Thesis Prepared for the Degree of
MASTER OF SCIENCE
UNIVERSITY OF NORTH TEXAS
August 2005
APPROVED: Tory Caeti, Major Professor Eric Fritsch, Committee Member Peggy Tobolowsky, Committee Member Robert W. Taylor, Chair of the Department of
Criminal Justice David W. Hartman, Dean of the School of
Community Service Sandra L. Terrell, Dean of the Robert B.
Toulouse School of Graduate Studies
Fairchild, James John, Jr. Truancy Intervention: A Study of Dallas Independent
School District Participants in the Dallas Challenge Truancy and Class C Enforcement
Center. Master of Science (Criminal Justice), August 2005, 96 pp., 77 tables,
references, 50 titles.
This research examines agency data for participants in a truancy intervention
program. Previous literature provides mostly descriptive information and fails to
examine the effects of truancy intervention efforts. The analysis provides a profile of
truant participants referred to the program and factors that correlate to successful
completion of the program requirements. The results will be applicable to the study
program as evaluation research and will be generalized for application to other truancy
programs. Directions for future truancy research will be suggested based on the need
to continue to evaluate truancy reduction efforts
ii
TABLE OF CONTENTS
Page LIST OF TABLES AND GRAPHS .................................................................................iv Chapters
1. INTRODUCTION ..................................................................................... 1 Risk and Protective Factors for Juvenile Delinquency Truancy as a Risk Factor for Juvenile Delinquency Overview of the Dallas Challenge Truancy and Class C Enforcement Center Program Overview of Remaining Chapters
2. LITERATURE REVIEW ......................................................................... 11
Truancy: What Is It? Truants: Who Are They? Truancy Prevention: What Is Being Done? Common Themes in Truancy Prevention Truancy: What Does It Cost?
Participant Overview School Related Variables Family Related Variables Personal Related Variables Profile of a Truant Juvenile Comparison of Successful and Unsuccessful Completion Groups
JKleister
Underline
JKleister
Underline
JKleister
Underline
JKleister
Underline
JKleister
iii
Crosstabulation and Means Comparison Results for Demographic and Truancy Center Related Variables Crosstabulation Results for School Related Variables Crosstabulation and Means Comparison Results for Family Related Variables Crosstabulation and Means Comparison Results for Personal Related Variables Summary of Variables That Indicate a Change in Successful Completion of Truancy Center Program Requirements
5. CONCLUSIONS AND DISCUSSION..................................................... 82
Limitations Associated with Research Conclusions Implications of Analysis Results Generalization of Results to the Truancy Center and Beyond Future Research in Truancy Prevention and Intervention
Page Table 1 – Variables Included in Analysis....................................................................... 29 Graph 1 – Completion of Truancy Center Requirements by Sex .................................. 33 Graph 2 – Gender of Participants by Age...................................................................... 34 Graph 3 – Gender of Participants by Age and Ethnicity ................................................ 34 Graph 4 – Grade Level at Intake ................................................................................... 35 Graph 5 – Number of Grades Failed ............................................................................. 36 Table 2 – Parent Has Been Called to School for Juvenile’s Behavior ........................... 37 Table 3 – Parental Estimation of Juvenile # of Absences.............................................. 37 Table 4 – Juvenile Has Been Suspended/Expelled....................................................... 37 Table 5 – Juvenile has a Learning Disability ................................................................. 38 Table 6 – Juvenile is in Special Education Classes ...................................................... 38 Table 7 – Juvenile with Learning Disability in Special Education Classes..................... 39 Table 8 – Parent/Guardian That Juvenile Lives With .................................................... 39 Table 9 – Is Parent/Guardian Married ........................................................................... 39 Table 10 – Parent Employed......................................................................................... 40 Table 11 – Spouse Employed ....................................................................................... 40 Table 12 – Family has Medical Insurance ..................................................................... 40 Table 13 – Family Member with Criminal Involvement/Arrest ....................................... 40 Table 14 - # of Children in the Household ..................................................................... 41 Table 15 – Age Eligible Children Enrolled in School ..................................................... 41 Table 16 – Previously in Counseling/Treatment............................................................ 42
iv
Table 17 – Previous Dallas Challenge Referral............................................................. 42 Table 18 – Juvenile Reported Any Abuse ..................................................................... 42 Table 19 – Juvenile Reported Emotional Abuse ........................................................... 42 Table 20 – Juvenile Reported Physical Abuse .............................................................. 43 Table 21 – Juvenile Reported Sexual Abuse ................................................................ 43 Table 22 – Juvenile is Currently Employed ................................................................... 43 Table 23 – Juvenile Has Been Fired From a Job .......................................................... 43 Table 24 – Juvenile Has Use Nicotine........................................................................... 44 Table 25 – Juvenile Has Use Alcohol............................................................................ 44 Table 26 – Juvenile Has Used Marijuana...................................................................... 44 Table 27 – Juvenile Has Used Hard Drugs ................................................................... 45 Table 28 – Parental Knowledge of Alcohol Use ............................................................ 45 Table 29 – Parental Knowledge of Drug Use ................................................................ 45 Table 30 – Parental Knowledge of Marijuana Use ........................................................ 45 Table 31 – Parental Knowledge of Hard Drug Use ....................................................... 46 Table 32 – Parental Knowledge of Juvenile Involvement in Drug Sales ....................... 46 Table 33 – Exclusion from Logistic Regression for Missing Responses........................ 49 Table 34 – Variables Included in Regression and Significance..................................... 49 Table 35 – Regression Model Predicted Outcome for Successful/Unsuccessful
Completion............................................................................................................. 50 Table 36 - Completion Status and Sex Crosstabulation ................................................ 51 Table 37 - Completion Status and Ethnicity of Juvenile Crosstabulation....................... 52 Table 38 – Completion Status by Sex and Ethnicity Crosstabulation............................ 52 Table 39 – Comparison of Mean Age by Completion Status......................................... 54
v
Table 40 - Completion Status and Previous Dallas Challenge Referral Crosstabulation
............................................................................................................................... 54 Table 41 - Completion Status and Parental Estimation of Absences Crosstabulation .. 55 Table 42 – Completion Status and Juvenile Suspended/Expelled Crosstabulation ...... 57 Table 43 – Completion Status and Parent Has Been Called to School Crosstabulation57 Table 44 – Completion Status by Parent Called and Juvenile Suspended/Expelled
Crosstabulation ...................................................................................................... 58 Table 45 - Completion Status and Juvenile Has a Learning Disability Crosstabulation 58 Table 46 - Completion Status and Juvenile is in Special Education Classes
Crosstabulation ...................................................................................................... 59 Table 47 - Completion Status and Number of Grades Failed Crosstabulation .............. 59 Table 48 - Completion Status and Juvenile Involvement in Extra-Curricular Activities
Crosstabulation ...................................................................................................... 60 Table 49 - Completion Status and Parent/Guardian Marital Status Crosstabulation ..... 61 Table 50 - Completion Status and Family Member That Juvenile Lives with
Crosstabulation ...................................................................................................... 62 Table 51 - Completion Status and Parent Employment Crosstabulation....................... 63 Table 52 - Completion Status and Parent Spouse Employment Crosstabulation.......... 64 Table 53 – Comparison of Number of Children in Home by Completion Status............ 64 Table 54 – Completion Status and Age Eligible Children Enrolled in School
Crosstabulation ...................................................................................................... 65 Table 55 - Completion Status and Medical Insurance Crosstabulation ......................... 65 Table 56 - Completion Status and Family Member with Criminal Involvement/Arrest
Crosstabulation ...................................................................................................... 66 Table 57 - Completion Status and Juvenile Nicotine Use Crosstabulation.................... 67 Table 58 - Completion Status and Juvenile Alcohol Use Crosstabulation..................... 67
vi
Table 59 - Completion Status and Juvenile Marijuana Use Crosstabulation ................. 68 Table 60 – Completion Status and Juvenile Hard Drug Use Crosstabulation ............... 68 Table 61 – Comparison of Age of First Use by Completion Status ............................... 69 Table 62 – Completion Status and Parental Knowledge of Alcohol Use Crosstabulation
............................................................................................................................... 70 Table 63 – Completion Status and Parental Knowledge of Marijuana Use
Crosstabulation ...................................................................................................... 70 Table 64 – Completion Status and Parental Knowledge of Hard Drug Use
Crosstabulation ...................................................................................................... 71 Table 65 – Completion Status and Parental Knowledge of Involvement in Drug Sales
Crosstabulation ...................................................................................................... 72 Table 66 – Completion Status and Juvenile Reported Abuse Crosstabulation ............. 72 Table 67 – Completion Status and Juvenile Reported Emotional Abuse Crosstabulation
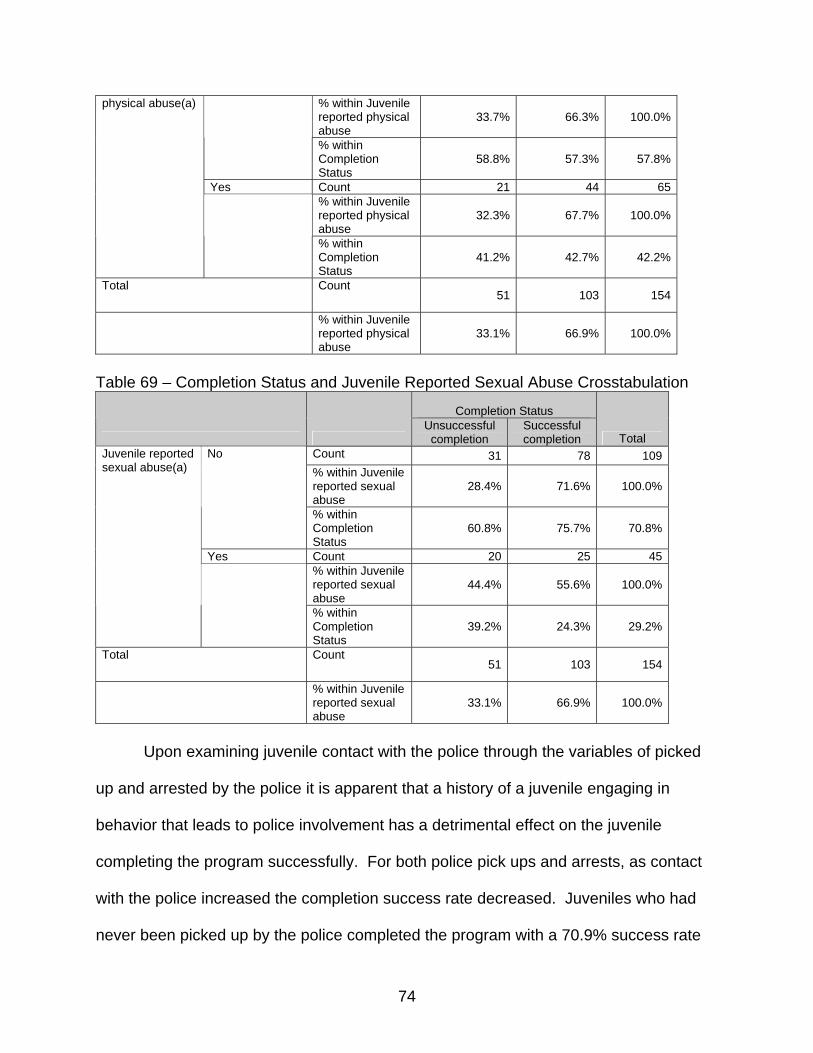
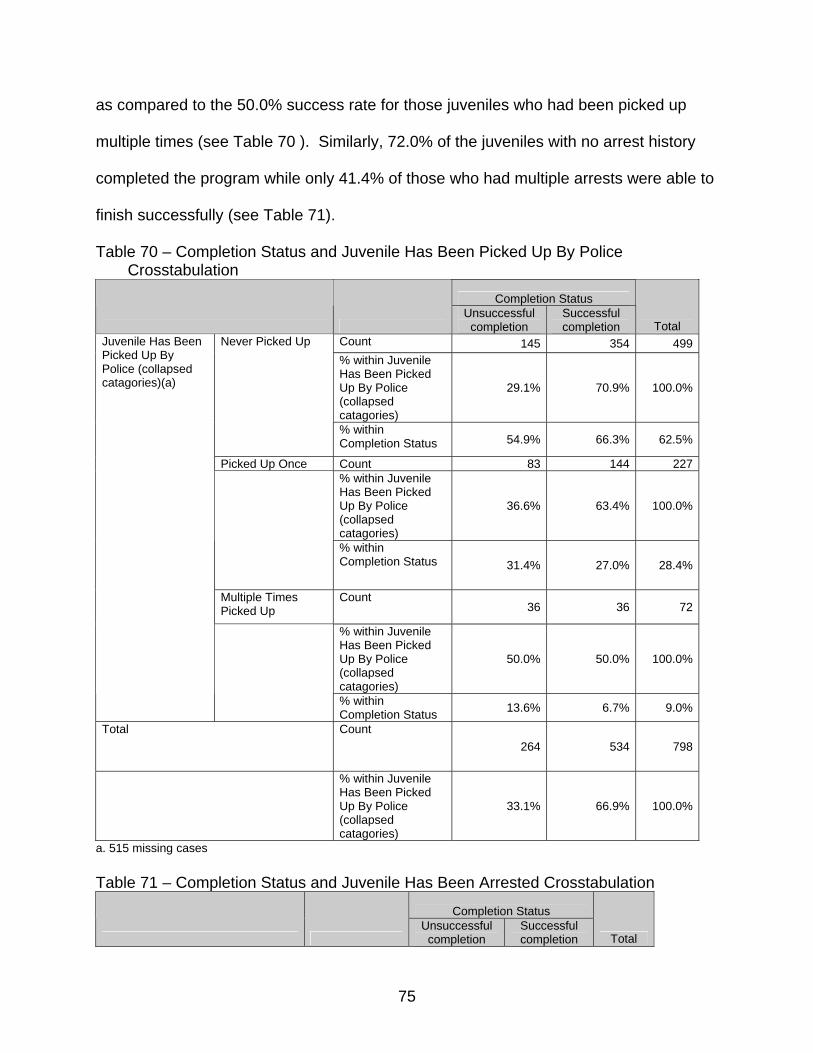
............................................................................................................................... 73 Table 68 – Completion Status and Juvenile Reported Physical Abuse Crosstabulation73 Table 69 – Completion Status and Juvenile Reported Sexual Abuse Crosstabulation . 74 Table 70 – Completion Status and Juvenile Has Been Picked Up By Police
Crosstabulation ...................................................................................................... 75 Table 71 – Completion Status and Juvenile Has Been Arrested Crosstabulation ......... 75 Table 72 – Completion Status and Parent Reported Gang Involvement Crosstabulation
............................................................................................................................... 76 Table 73 – Completion Status and Juvenile is Employed Crosstabulation.................... 77 Table 74 – Completion Status and Juvenile Has Been Fired From a Job Crosstabulation
............................................................................................................................... 78 Table 75 – Completion Status and Juvenile Counseling/Treatment Crosstabulation .... 78 Table 76 - Variables Values Which Produced Significant Difference from Baseline
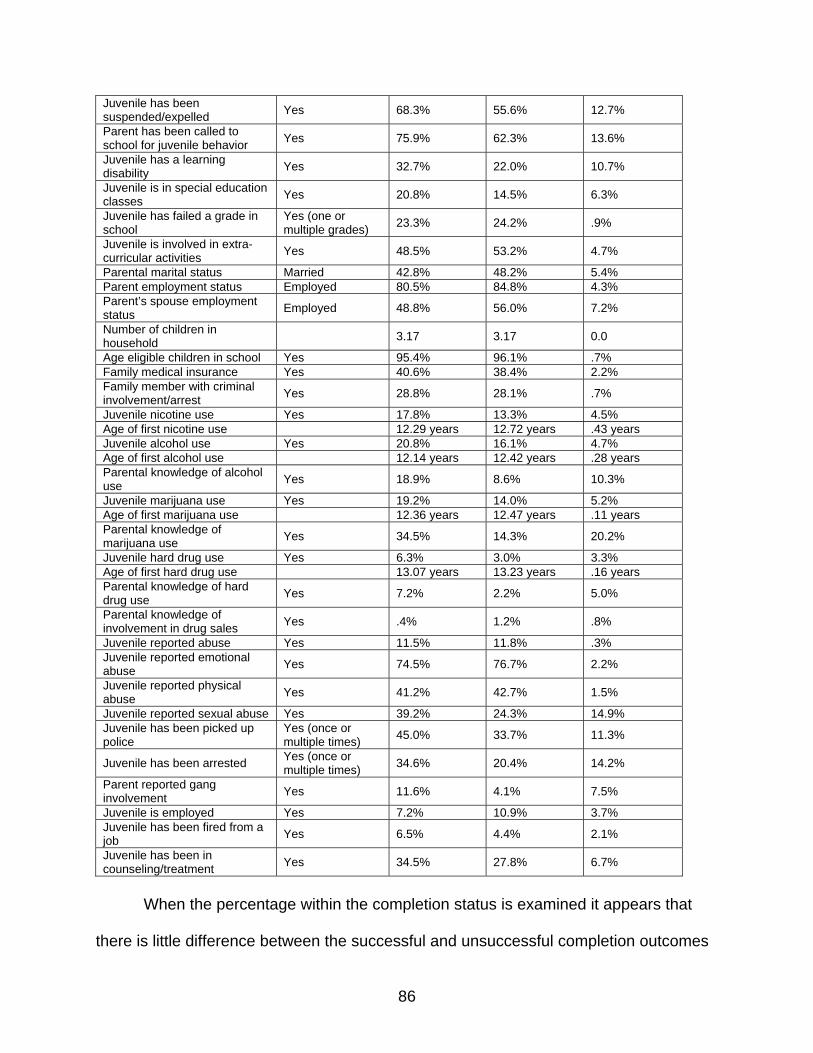
Table 77 – Comparison of Percentages within Completion Status to Illustrate Effect on Program Completion .............................................................................................. 85
viii
CHAPTER 1 INTRODUCTION
With the ever-growing concern about crime in our society, researchers and
practitioners are continuously seeking options to reduce and prevent crime before it
occurs. The fact that juveniles (individuals under age 18) make up only 19% of the
population while accounting for 29% of criminal arrests (Cottle, Lee, and Heilbrun 2001)
has caused a great deal of attention to be placed on efforts being made in the juvenile
justice field. The juvenile justice system in this nation has made a commitment to deal
with the problem of juvenile crime and delinquency. This includes not only handling
those juveniles who commit crime and delinquent acts but also reducing the juvenile
crime rate and making efforts to prevent juveniles from ever committing crime or
becoming involved in the juvenile justice system. Reduction and prevention programs,
in general, are designed to address juvenile delinquency problems in the best possible
manner and to produce the most promising results.
Many recent efforts within the juvenile justice system have sought to determine
characteristics which place juveniles at risk for committing crime and to incorporate
services into programs that can address these risk factors. By identifying these factors
in the early development of the juvenile, researchers and program administrators hope
that intervention and education can reduce the likelihood that a juvenile will commit
crime (Hawkins, Herrenkohl, Farrington, Brewer, Catalano, Harachi and Cothern 2000).
Along this same line of reason, similar services can be provided to juveniles with a
history of minor delinquency and status offenses in the effort to prevent escalation to
more serious crimes. The provision of services to status offenders has become an
increasingly popular alternative to formal juvenile justice system processing in order to
1
avoid negative interaction with the system that could push juveniles toward crime and
limit their offenses to those that are less serious in nature.
The Dallas Challenge Truancy and Class C Enforcement Center is one such
program which addresses truant behavior as a risk factor and seeks to eliminate the
likelihood of future criminality through social service intervention and education. The
program is an alternative to court processing, for those juveniles who have exhibited the
early stages of delinquent behavior, which attempts to alter the behavior and refocus
the participants on their education. Prior to examining the Dallas Challenge program
and its specifics, it is important to understand the concept of risk factors and the place
truancy fits into predicting future criminality.
Risk and protective factors for juvenile delinquency
The concept of risk factors as a predictor of criminal behavior has become a
popular area of exploration within juvenile justice research. Identifying those factors in a
juvenile’s life that contribute to delinquency and the amount of predictive value they
have in leading to crime is a valuable tool in addressing juvenile crime. Conversely,
determining those protective factors that reduce a juvenile’s chance of committing crime
is equally important for juvenile justice practitioners. By recognizing the factors, both
protective and risk, that play a role in predicting criminality, programs can provide more
effective services to juveniles. In numerous studies, researchers have identified both
risk factors that increase and protective factors that decrease the probability of
delinquency (see Bilchik 1995; Brown, Schulenberg, Bachman, O’Malley and Johnston
2001; Carr and Vandiver 2001; Cottle et al 2001; Elliot 1998; Ellis and Sowers 2001;
2
Hallfors, Vevea, Iritani, Cho, Khatapoush and Saxe 2002; Hawkins et al 2000;
Herrenkohl, Maguin, Hill, Hawkins, Abbott and Catalano 2000; Holmes, Slaughter and
to reduced chances of graduation, lower earning potential, increased chances of welfare
dependency, and unemployment; all of which cost both the juvenile and the community
at large (Hibbett, Fogelman and Manor 1990). The problems related to non-completion
of high school place the individual at a considerable disadvantage considering that it
has been established that the earning potential for a high school dropout is far below
(approximately 75% for both males and females) his/her counterpart that earned a high
school diploma or equivalency (Heilbrunn 2003; National Center for Education Statistics
2003).
If a juvenile does not have the means to provide for themself due to squandered
educational opportunities, the community often times must bear the cost of supporting
an individual who has wasted the opportunity to become a self-sufficient member of
society. The cost of supporting these individuals falls back on society as a whole in the
form of government programs and actions that are supported by tax revenue, including:
welfare, food stamps, unemployment, Medicare and Medicaid, and Social Security and
SSI. The most costly of expenditures which are related to failure to complete high
school involve criminal justice expenses related to jail, prison and court costs. All
together, it is estimated that a high school dropout will require in excess of $200,000 in
public support expenditures over the course of a lifetime versus a high school graduate
(Heilbrunn 2003; Heilbrunn and Seeley 2003). With truancy being an indicator for high
school completion, it seems appropriate to direct resources toward reducing its
occurrence.
21
A community also suffers from truancy in the form of victimization at the hands of
those juveniles who would be in school who decide to expand their delinquent behavior
beyond non-attendance. Truancy has been related to high incidence of daytime
burglary and vandalism (Gonzales, Richards, and Seeley 2002). Some truancy
prevention programs have been found to reduce daytime crimes such as theft and
burglary that are committed by juveniles (DeKalb 1999; Fritsch et al 1999; Garry 1996;
Manual 1996). By reducing truancy, it stands to reason that the money lost because of
daytime crime committed by truants would concurrently be reduced.
There have also been cost-benefit analysis studies for truancy programs that
show the amount spent on providing truancy prevention services are far less than the
amount that would be spent on incarcerating that juvenile in juvenile custody (Garry
1996; Heilbrunn 2003; Heilbrunn and Seeley 2003). By dedicating the effort and
expense into truancy prevention early enough, it is possible to avoid greater
expenditures in the future when those juveniles escalate their criminal activities beyond
mere status offenses which would require more costly disposition for their actions.
The available truancy literature leaves a great deal of room for expansion. That
literature which is available addresses the main issues of truancy and truancy
prevention, but provides little quality evaluation research of programs that are currently
running. The information that is provided by most of the literature is cursory, at best,
and does not fully explain the phenomenon of truancy. That research which does
include evaluation of truancy prevention/reduction programs does not thoroughly
examine whether the programs effectively achieve the goal of reducing truancy. There
22
has been no research to date which examines the ability of a program to reduce future
delinquent/criminal activity or increase the likelihood of a juvenile completing high
school. This lack of depth in the available research is somewhat understandable
considering the relative infancy of the subject as a focus of research in the juvenile
justice field, but it is an important next step in truancy related research.
This research project will address gaps that exist in previous truancy research by
creating a profile of a truant based on those juveniles who are referred for services to
Dallas Challenge. It will also examine the differences in the characteristics of those
juveniles who completed the Dallas Challenge program versus those who did not.
23
CHAPTER 3 METHODOLOGY
The major problem with previous truancy research is that it has failed to give a
detailed picture of the individuals who commit the offense or programs that have been
found to reduce truancy. Most of the available information on truants and truancy
prevention programs is broad and non-specific in nature. This research project will
address this issue by evaluating the participants who were referred to the Dallas
Challenge Truancy and Class C Enforcement Center. Any child between the age of 10
and 17 in Dallas County, Texas who has been filed as truant, was found to be in
contempt of court related to the truancy charges and is not otherwise active in the
juvenile justice system can be referred for services. The primary objectives of the
Truancy Center are to: (1) cease the truant behavior in the juvenile and (2) reintegrate
the juvenile into school so that he/she may ultimately complete high school or a GED
equivalency program. The purpose of this study is to examine the characteristics of the
juveniles referred to the Truancy Center and whether specific characteristics of the
participants correlate with the successful completion of the program. This study will
answer the following research questions:
• What characteristics profile the typical juvenile who is referred to Dallas
Challenge for chronic truancy?
• What characteristics are correlated with successful or non-successful
completion of the Dallas Challenge program?
24
Population to be Studied
This research will involve a study of the population of juveniles from Dallas
Independent School District schools who have been referred to the Dallas Challenge
Truancy and Class C Enforcement Center since the program’s inception in 1996
through December 31, 2000. Since its opening in 1996, the Truancy Center has
received 5,605 referrals to the program (as of 6/12/2002, when the data was collected
from Dallas Challenge). This research will only examine a sample of 1,313 DISD
students who either successfully or unsuccessfully completed the Truancy Center
program.
Some of the population that is referred to the Truancy Center does not receive
services based on their circumstances within the juvenile justice system. Referred
juveniles are denied services for the following reasons: the juvenile commits a new
delinquency offense while enrolled in the program for less than 20 days, the juvenile is
already active in the juvenile justice department, or the Truancy Center has no
jurisdiction or probable cause for the offense. Any of these conditions can eliminate the
referred juvenile from being eligible for services. Because these juveniles were not
eligible to receive services from the Truancy Center they will not be included in the
analysis.
Data Collection
The data to be used for analysis in this study will be provided to the researcher
by the Dallas Challenge Truancy and Class C Enforcement Center. The Truancy
Center’s Associate Executive Director of Truancy Services, Shelton Stogner, brought
25
this research project to the University of North Texas Criminal Justice Department and
has a vested interest in the completion of the study. Therefore, Mr. Stogner has made
the necessary data and support from the Truancy Center staff available to the
researcher in this project.
The data provided to the researcher by the Truancy Center consists of the
information that was gathered from its participants and that which was collected by the
staff members about the participant’s progress in the program. The Truancy Center has
completed a detailed intake process for each juvenile referred to the program. The
intake instrument collected basic demographic, offense, family history, drug use, abuse
and other criminal information provided by both the juvenile and a parent or guardian.
Each juvenile and his/her parent/guardian was led through this process by one of the
program case managers, who in turn entered the collected data into the database
developed to maintain the records of all Truancy Center participants. The potential for
reliability and validity issues arising from the nature of self reported data from the
juvenile and his/her parent or guardian about potentially criminal behavior must be
acknowledged.
Both the juvenile participant and his/her parent or guardian were asked to
provide information about the child and household during each intake process. The
nature of self reported data in criminal justice settings such as this is cause for concern.
Issues of reliability that arise from self reported data from the juvenile and
parent/guardian include: memory recall problems of the child’s behavior, information
about absences from school, drug and alcohol use and the age when it first occurred,
and if the juvenile had previous arrests or interactions with police. These were all issues
26
addressed during the intake process that required both the juvenile and parent/guardian
to recall the juvenile’s past. Additionally, reluctance to report illegal or delinquent
behavior, such as alcohol or drug use, or potentially embarrassing information, such as
criminal behavior within the family, causes validity problems with the information
collected from the participant and the parent/guardian. Outright refusal to respond to
questions leaving blanks within each case file is yet another issue arising from the self
reported data supplied to researcher from the Truancy Center. These are recognized
problems associated with most self reported data in criminal justice research; but, for
this research project, the information collected from the Truancy Center participants and
their parent/guardian is the only source available and it was unable to be verified or
cross-checked for its reliability or validity.
The potential for error from data entry transcription mistakes also creates an
internal validity problem with the data. There were 23 case managers and additional
administrative/clerical staff who performed data entry for referred juveniles during the
time in question for this research project, all of which had the opportunity to enter
information incorrectly into the database. This combined with open text fields and a lack
of standardized responses within the database for many of the fields opens the door for
human error to affect the quality and integrity of the data collected by the Truancy
Center by allowing a wide variance of responses to be entered for any particular
variable (I.E. – open fields allowed for race description to be entered as white,
Caucasian, or Anglo).
The researcher was provided with the data collected on each referred juvenile in
the database form in which it was maintained in by the Truancy Center. This data was
27
converted into spreadsheet form so that it could be cleaned and formatted into a
useable form within a statistical analysis program. For those variables where it was
possible, text string variables were converted into numerical variables and assigned
values so that the data could be analyzed. The researcher analyzed the data for
spelling errors and variations and replaced those fields with the correct information
when it was clear what was intended to be entered by the Dallas Challenge staff.
These efforts were made to address the internal validity problems that were created by
human error during data entry.
The data provided to the researcher was manipulated for the purpose of this
research in other ways so that it might be useable to answer the specific research
questions. The Truancy Center, for its operational purposes, has more than one
outcome associated with unsuccessful completion of the programs requirements. For
the purpose of this research, the disposition of the juvenile upon failure to complete the
program requirements was not important so it was excluded. Therefore, the closing
category variable was recoded to a new variable which included only successful and
unsuccessful completion, and the unsuccessful variations were eliminated from
consideration.
Additionally, the Truancy Center collects self reported drug use information from
the juvenile during the intake assessment. For the purpose of simplification of that
information, the reported use of hard drugs such as inhalants, cocaine, crack, crank,
amphetamines, barbiturates, hallucinogens, tranquilizers, and heroin were all combined
into one variable called “hard drug use”. The reported information on the age of first
28
use by the juvenile regarding all of the above mentioned hard drugs was combined into
a variable called “hard drug age”.
As mentioned previously, data was collected from the parent or guardian who
picked up the juvenile at the Truancy Center upon referral from court. This data was not
originally entered into the agency database with the juvenile’s information. The
researcher obtained the files for the DISD participants from the Truancy Center and was
able to pull the parent reported information from these files with the help of UNT
Criminal Justice department student assistants. This information was coupled with the
participant data already provided to the researcher to be included in the analysis.
Variables to be Examined
In order to address the research questions previously stated, the following
variables (see Table 1) from each Truancy Center participant included in the sample
population will be examined.
Table 1 – Variables Included in Analysis
Variable Name SPSS
Variable Code
Variable Description Variable Coding
Client ID number CID Agency assigned ID Numerical value Closing Category ID Number Clos_Cat Closing Category 2 = Successful
3 = Unsuccessful, filed 4 = Unsuccessful, Failed/Not Filed 5 = Unsuccessful & 21 day Delinquency 6 = Neutral 9 = Never Opened - Active 10 = Never Opened - No Jurisdiction
Victim of Abuse Abuse Juvenile reported being a victim of any abuse
0 = No; 1 = Yes
Emotional Abuse Emo_Abus Juvenile reported being a victim of emotional abuse
0 = No; 1 = Yes
Physical Abuse Phy_Abus Juvenile reported being a victim of physical abuse
0 = No; 1 = Yes
Sexual abuse Sex_Abus Juvenile reported being a victim of sexual abuse
0 = No; 1 = Yes
Have you used alcohol? Alc_Use Juvenile’s alcohol use 0 = No; 1 = Yes Age alcohol was first used? Alc_Age Age of first alcohol use Numerical value Have you used nicotine? Nic_Use Juvenile’s nicotine use 0 = No; 1 = Yes Age nicotine was first used? Nic_Age Age of first alcohol use Numerical value Have you used marijuana? Mar_Use Juvenile’s marijuana use 0 = No; 1 = Yes Age marijuana was first used? Mar_Age Age of first alcohol use Numerical value Have you used hard drugs? Hard_Use Juvenile’s hard drug use 0 = No; 1 = Yes Age hard drugs were first used?
Hard_Age Age of first hard drug use Numerical value
Parent/Guardian self reported information
Employed Employed Is the respondent employed
No = 0 Yes = 1
Spouse Employed Spouse_E Is the respondent’s spouse employed
No = 0 Yes = 1
Family has Medical Insurance Medical Does the parent/guardian have medical insurance
No = 0 Yes = 1
Picked up Picked_U # of times child has been picked up by police
Numeric value
Picked up (collapsed categories)
Pickup2 Juvenile has been picked up by police (collapsed categories)
Never picked up = 0 Picked up once = 1 Multiple times picked up = 2
Child Arrested Child_Ar # of times child has been arrested by police
Numeric value
Child Arrested (collapsed categories)
Arrest2 Juvenile has been arrested (collapsed categories)
Never arrested = 0 Arrested once = 1 Multiple arrests = 2
Family Criminal Involvement/Arrest
Crim_Fam Has an immediate family member been involved in criminal activity or been arrested
No = 0 Yes = 1
Counseling/Treatment Counseli Has the juvenile participated in counseling or treatment previously
No = 0 Yes = 1
Gang Related Activity Gang_Rel Parental knowledge of No = 0
30
juvenile involvement in gang related activity
Yes = 1
Married Married Is the parent/guardian married
No = 0 Yes = 1
# of children Num_Kid # of children in household Numeric value Child in School Kid_Schl Are age eligible children
enrolled in school No = 0 Yes = 1
# of absences Absences Parental estimation of juvenile’s school absences
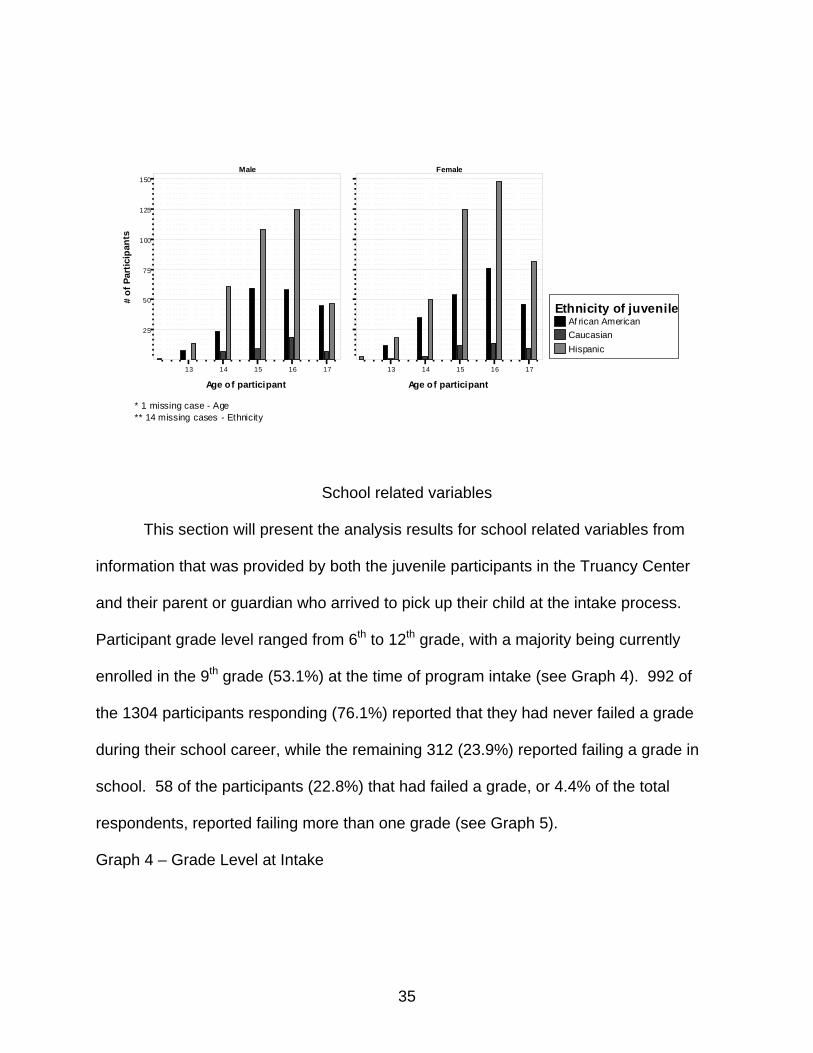
This section will present the analysis results for school related variables from
information that was provided by both the juvenile participants in the Truancy Center
and their parent or guardian who arrived to pick up their child at the intake process.
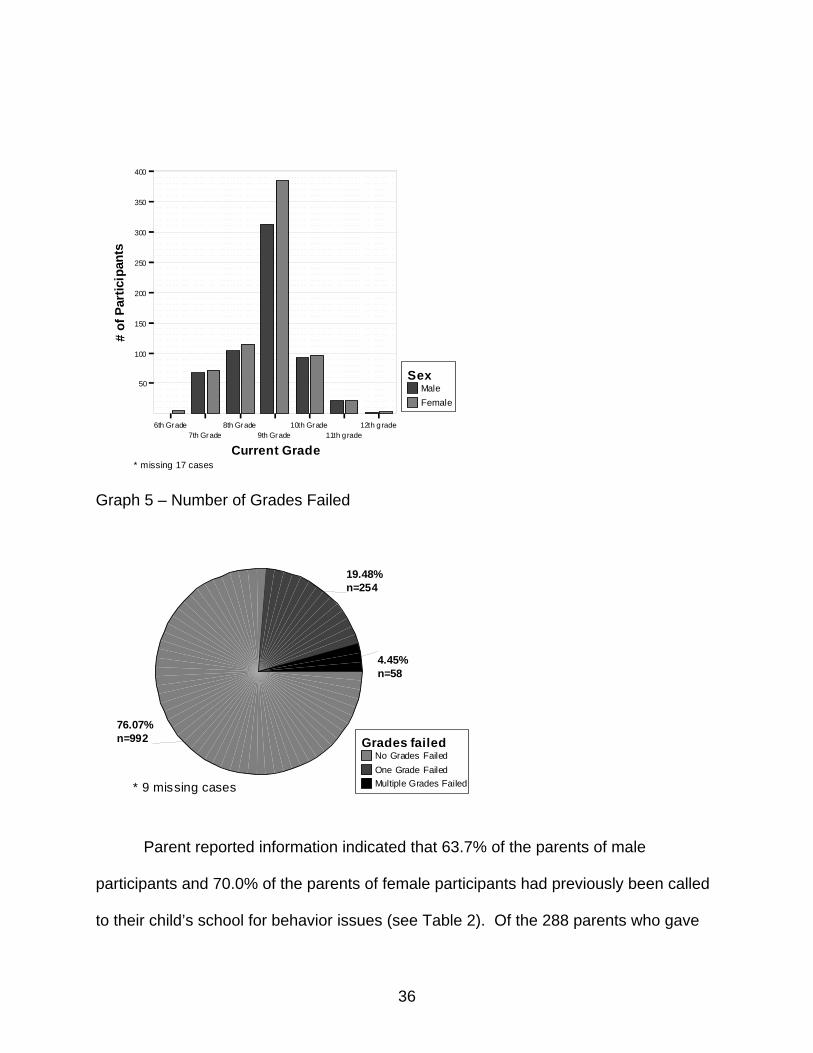
Participant grade level ranged from 6th to 12th grade, with a majority being currently
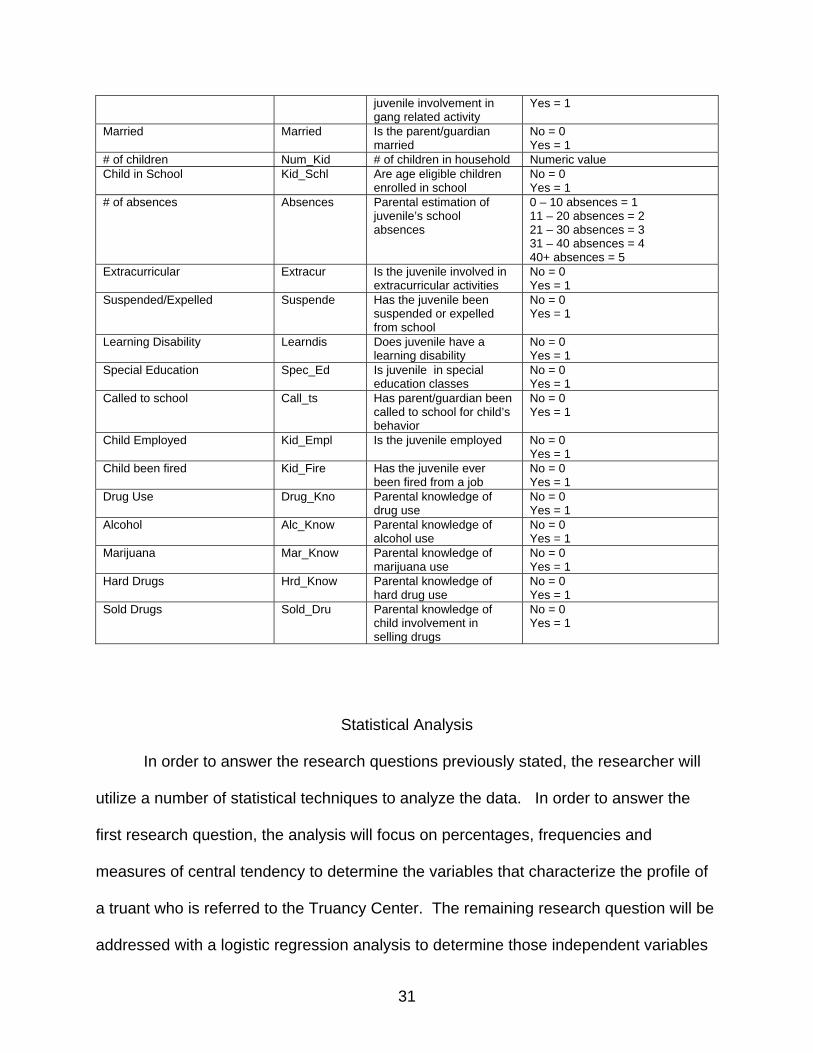
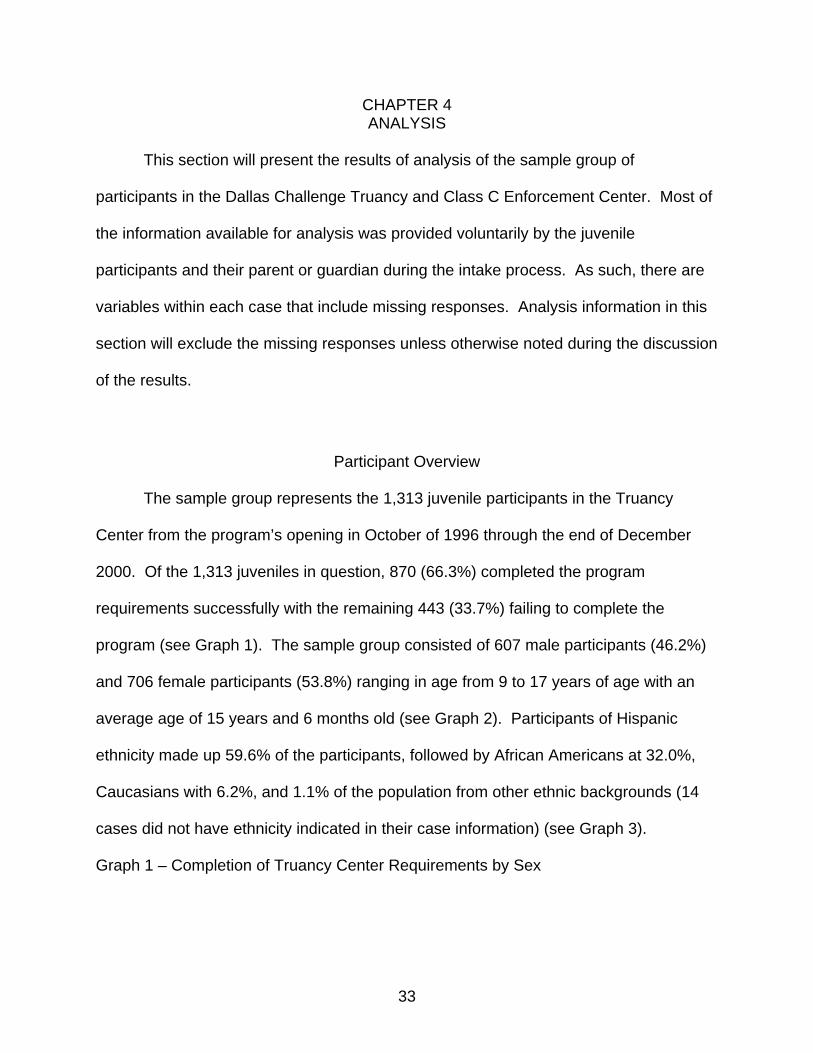
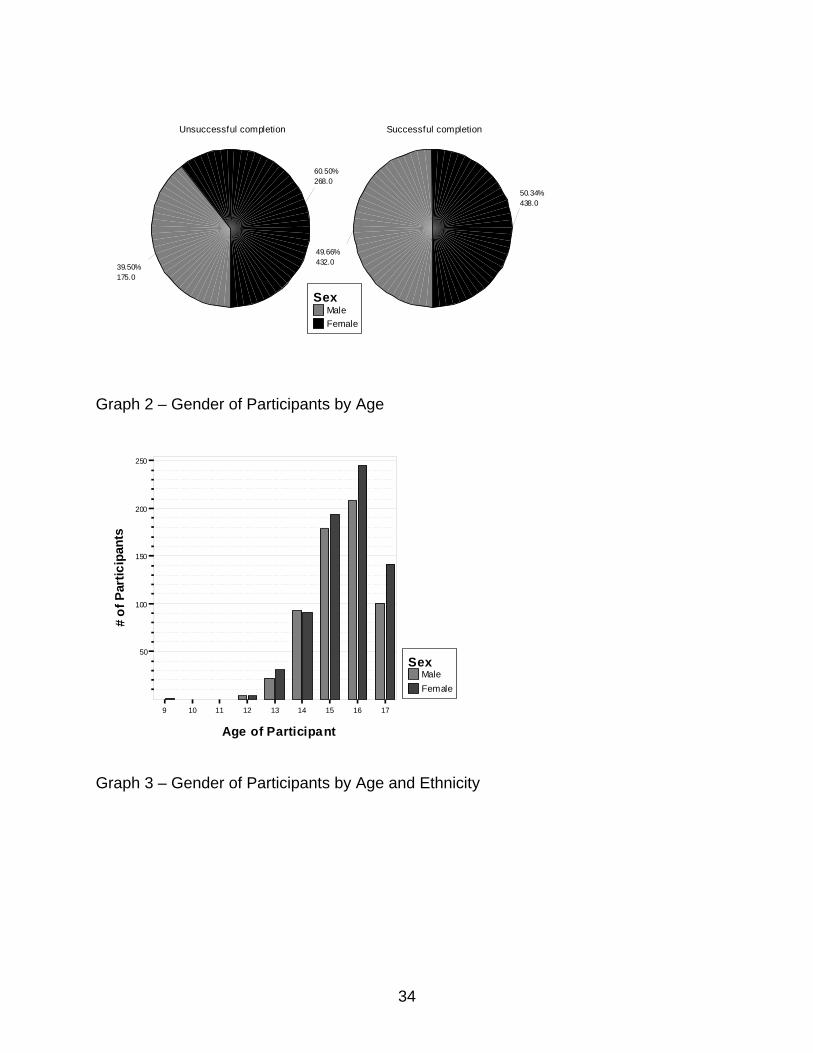
enrolled in the 9th grade (53.1%) at the time of program intake (see Graph 4). 992 of
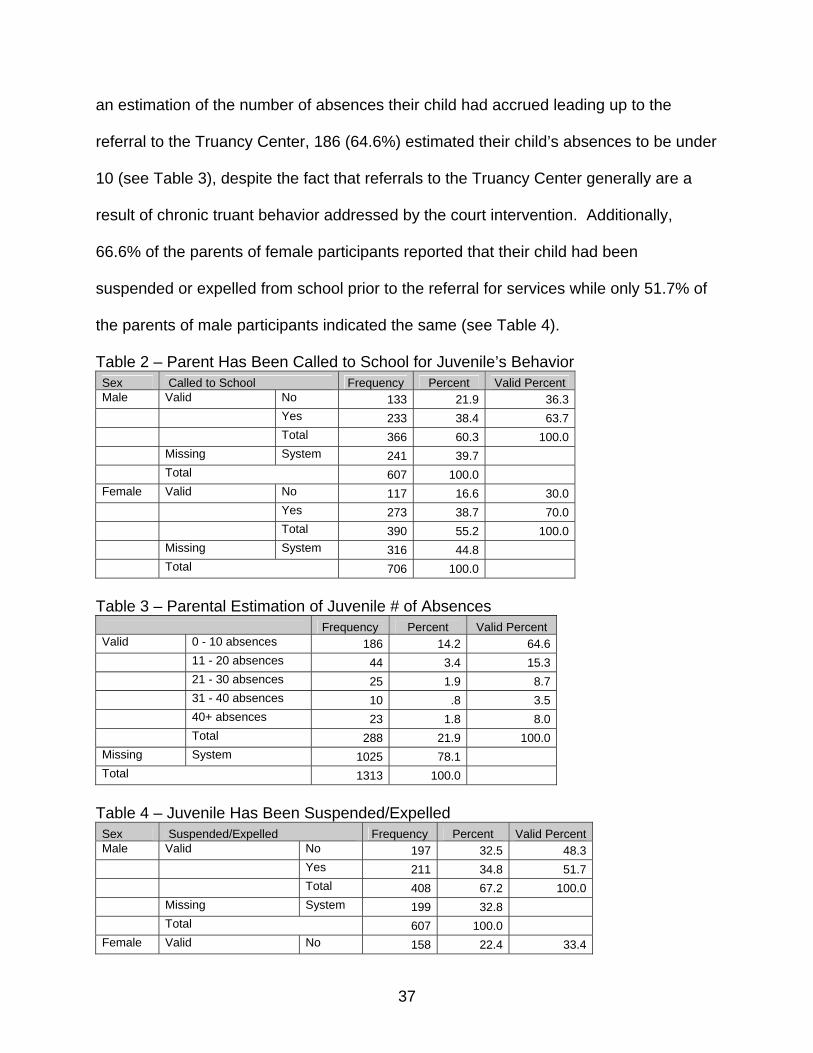
the 1304 participants responding (76.1%) reported that they had never failed a grade
during their school career, while the remaining 312 (23.9%) reported failing a grade in
school. 58 of the participants (22.8%) that had failed a grade, or 4.4% of the total
respondents, reported failing more than one grade (see Graph 5).
Graph 4 – Grade Level at Intake
35
MaleFemale
Sex
* missing 17 cases
6th Grade7th Grade
8th Grade9th Grade
10th Grade11th grade
12th grade
Current Grade
50
100
150
200
250
300
350
400
# of
Par
ticip
ants
Graph 5 – Number of Grades Failed
No Grades FailedOne Grade FailedMultiple Grades Failed
Grades failed
* 9 missing cases
76.07%n=992
19.48%n=254
4.45%n=58
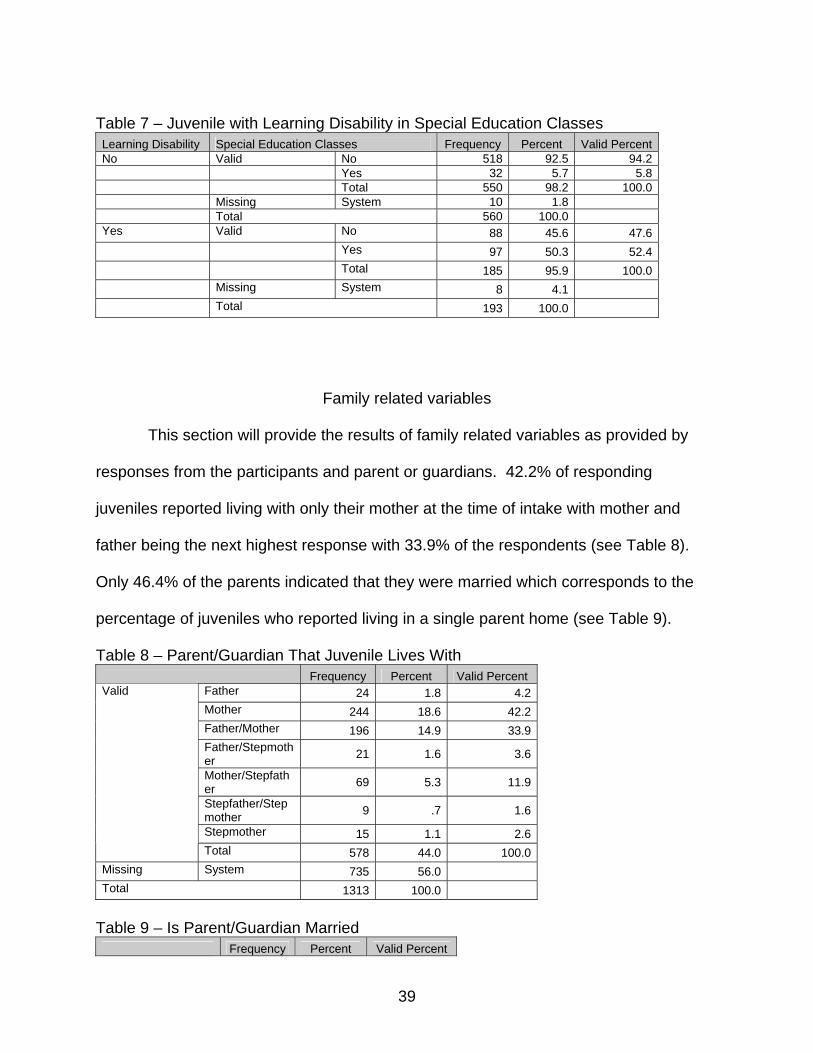
Parent reported information indicated that 63.7% of the parents of male
participants and 70.0% of the parents of female participants had previously been called
to their child’s school for behavior issues (see Table 2). Of the 288 parents who gave
36
an estimation of the number of absences their child had accrued leading up to the
referral to the Truancy Center, 186 (64.6%) estimated their child’s absences to be under
10 (see Table 3), despite the fact that referrals to the Truancy Center generally are a
result of chronic truant behavior addressed by the court intervention. Additionally,
66.6% of the parents of female participants reported that their child had been
suspended or expelled from school prior to the referral for services while only 51.7% of
the parents of male participants indicated the same (see Table 4).
Table 2 – Parent Has Been Called to School for Juvenile’s Behavior Sex Called to School Frequency Percent Valid Percent Male Valid No 133 21.9 36.3 Yes 233 38.4 63.7 Total 366 60.3 100.0 Missing System 241 39.7 Total 607 100.0 Female Valid No 117 16.6 30.0 Yes 273 38.7 70.0 Total 390 55.2 100.0 Missing System 316 44.8 Total 706 100.0
Table 3 – Parental Estimation of Juvenile # of Absences Frequency Percent Valid Percent Valid 0 - 10 absences 186 14.2 64.6 11 - 20 absences 44 3.4 15.3 21 - 30 absences 25 1.9 8.7 31 - 40 absences 10 .8 3.5 40+ absences 23 1.8 8.0 Total 288 21.9 100.0Missing System 1025 78.1 Total 1313 100.0
Table 4 – Juvenile Has Been Suspended/Expelled Sex Suspended/Expelled Frequency Percent Valid Percent Male Valid No 197 32.5 48.3 Yes 211 34.8 51.7 Total 408 67.2 100.0 Missing System 199 32.8 Total 607 100.0 Female Valid No 158 22.4 33.4
37
Yes 315 44.6 66.6 Total 473 67.0 100.0 Missing System 233 33.0 Total 706 100.0
The Truancy Center also collected information from the parents of participants
regarding their child’s special needs as a student and their involvement in school
activities. 30.8% of female participants had a learning disability and 20.5% were in
special education classes in school, according to their parents. For males, only 20.2%
were reported to have a learning disability with 12.2% being in special education (see
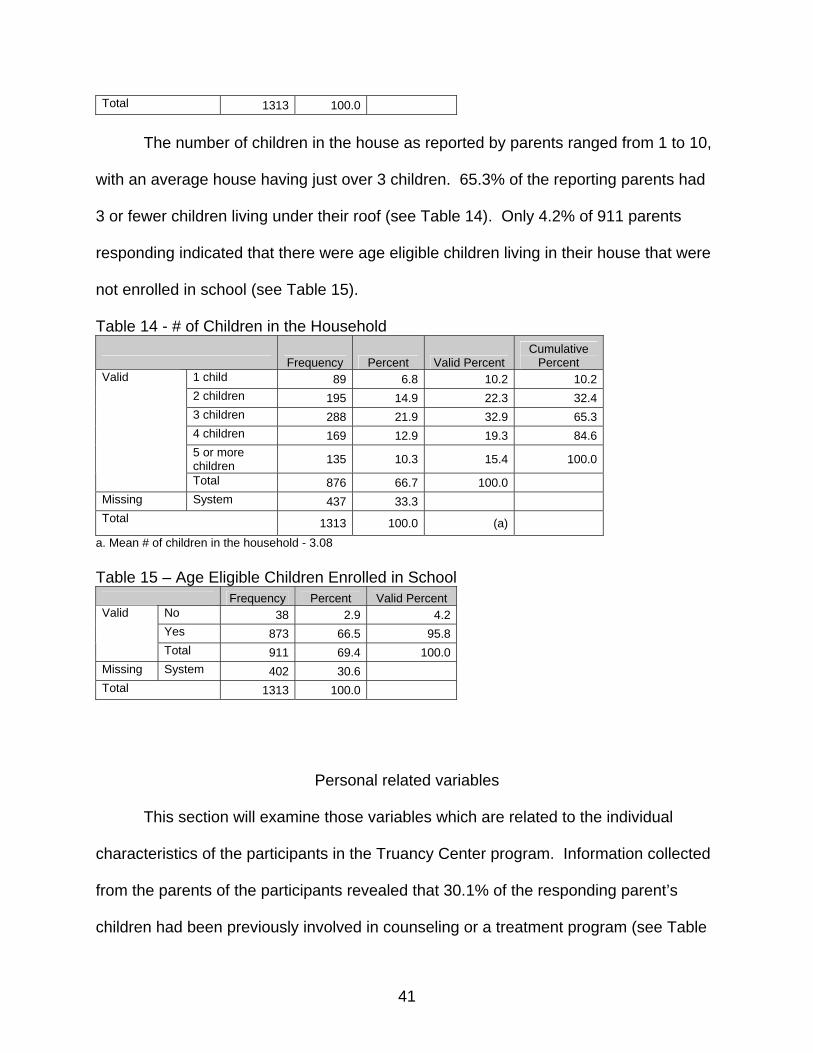
Tables 5, 6). Of the 185 combined male and female participants who reported having a
learning disability, only 52.4% were in special education classes (8 cases missing
special education response) (see Table 7).
Table 5 – Juvenile has a Learning Disability Sex Learning Disability Frequency Percent Valid Percent Male Valid No 293 48.3 79.8 Yes 74 12.2 20.2 Total 367 60.5 100.0 Missing System 240 39.5 Total 607 100.0 Female Valid No 267 37.8 69.2 Yes 119 16.9 30.8 Total 386 54.7 100.0 Missing System 320 45.3 Total 706 100.0
Table 6 – Juvenile is in Special Education Classes Sex Special Education Classes Frequency Percent Valid Percent Male Valid No 366 60.3 87.8 Yes 51 8.4 12.2 Total 417 68.7 100.0 Missing System 190 31.3 Total 607 100.0 Female Valid No 373 52.8 79.5 Yes 96 13.6 20.5 Total 469 66.4 100.0 Missing System 237 33.6 Total 706 100.0
38
Table 7 – Juvenile with Learning Disability in Special Education Classes Learning Disability Special Education Classes Frequency Percent Valid Percent No Valid No 518 92.5 94.2 Yes 32 5.7 5.8 Total 550 98.2 100.0 Missing System 10 1.8 Total 560 100.0 Yes Valid No 88 45.6 47.6 Yes 97 50.3 52.4 Total 185 95.9 100.0 Missing System 8 4.1 Total 193 100.0
Family related variables
This section will provide the results of family related variables as provided by
responses from the participants and parent or guardians. 42.2% of responding
juveniles reported living with only their mother at the time of intake with mother and
father being the next highest response with 33.9% of the respondents (see Table 8).
Only 46.4% of the parents indicated that they were married which corresponds to the
percentage of juveniles who reported living in a single parent home (see Table 9).
Table 8 – Parent/Guardian That Juvenile Lives With Frequency Percent Valid Percent
Total 154 11.7 100.0Missing System 1159 88.3 Total 1313 100.0
Table 21 – Juvenile Reported Sexual Abuse Frequency Percent Valid Percent
No 109 8.3 70.8Yes 45 3.4 29.2
Valid
Total 154 11.7 100.0Missing System 1159 88.3 Total 1313 100.0
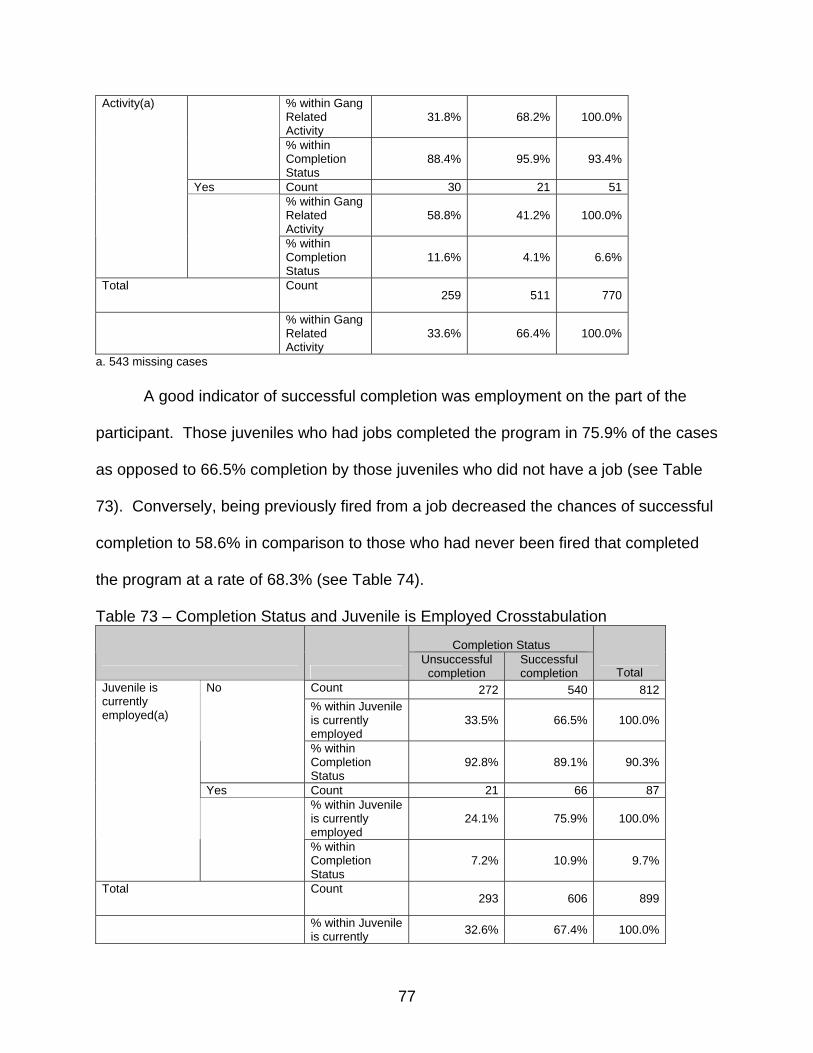
Of 899 responses from the parents, only 9.7% indicated that their child was
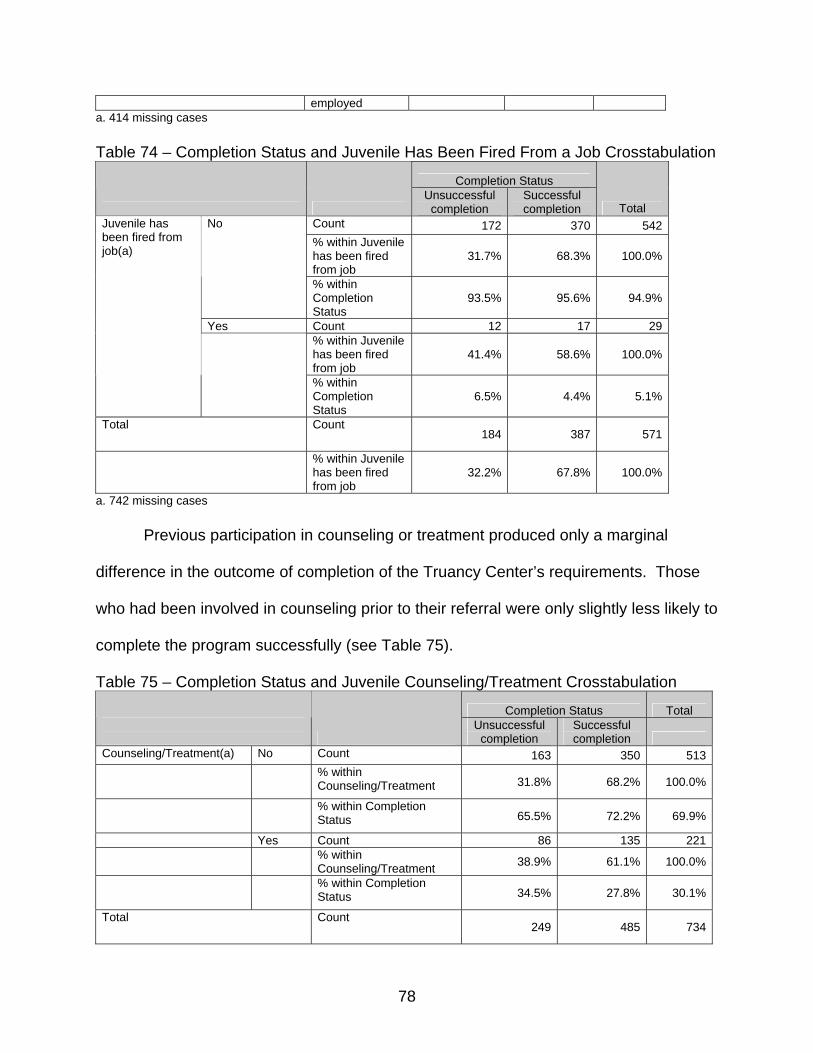
currently employed (see Table 22). Additionally, only 5.1% of 571 parent responses
indicated that their child had been fired from a job (see Table 23). Considering the
relatively young average age of the participants it would be expected that the amount of
work experience for this sample would be limited.
Table 22 – Juvenile is Currently Employed Frequency Percent Valid Percent
No 812 61.8 90.3Yes 87 6.6 9.7
Valid
Total 899 68.5 100.0Missing System 414 31.5 Total 1313 100.0
Table 23 – Juvenile Has Been Fired From a Job Frequency Percent Valid Percent
No 542 41.3 94.9Yes 29 2.2 5.1
Valid
Total 571 43.5 100.0Missing System 742 56.5 Total 1313 100.0
43
Both the juvenile participants and their parent or guardian provided information
regarding alcohol, nicotine and drug use by the juvenile. The juveniles were asked if
they had ever used the above mentioned illegal substances and at what age each was
first used. Parents were asked about their knowledge of their child’s use of alcohol and
drugs and if they were aware of the child’s involvement in selling drugs. Information
gathered from the juvenile participants showed that 14.9% had used nicotine, 17.7%
had used alcohol, 15.8% had used marijuana and 4.1% had used at least one type of
hard drug (inhalants, cocaine, crack, crank, amphetamines, barbiturates, hallucinogens,
tranquilizers, or heroin) (see Tables 24, 25, 26, 27).
The average age for first nicotine use was 12.3 years with the earliest reported
use at age six. The average age for first alcohol use was 12.5 years with the earliest
reported use occurring at age five. For marijuana use the mean age of first use was
12.4 years with the earliest reported age of first use being seven years old. Hard drug
average age of first use was 13.1 years with nine being the earliest reported use.
Table 24 – Juvenile Has Use Nicotine Frequency Percent Valid Percent
No 1118 85.1 85.1Yes(a) 195 14.9 14.9
Valid
Total 1313 100.0 100.0a. Mean age of first use - 12.3 years Table 25 – Juvenile Has Use Alcohol Frequency Percent Valid Percent
No 1081 82.3 82.3Yes(a) 232 17.7 17.7
Valid
Total 1313 100.0 100.0a. Mean age of first use - 12.5 years Table 26 – Juvenile Has Used Marijuana Frequency Percent Valid Percent
No 1106 84.2 84.2Yes(a) 207 15.8 15.8
Valid
Total 1313 100.0 100.0
44
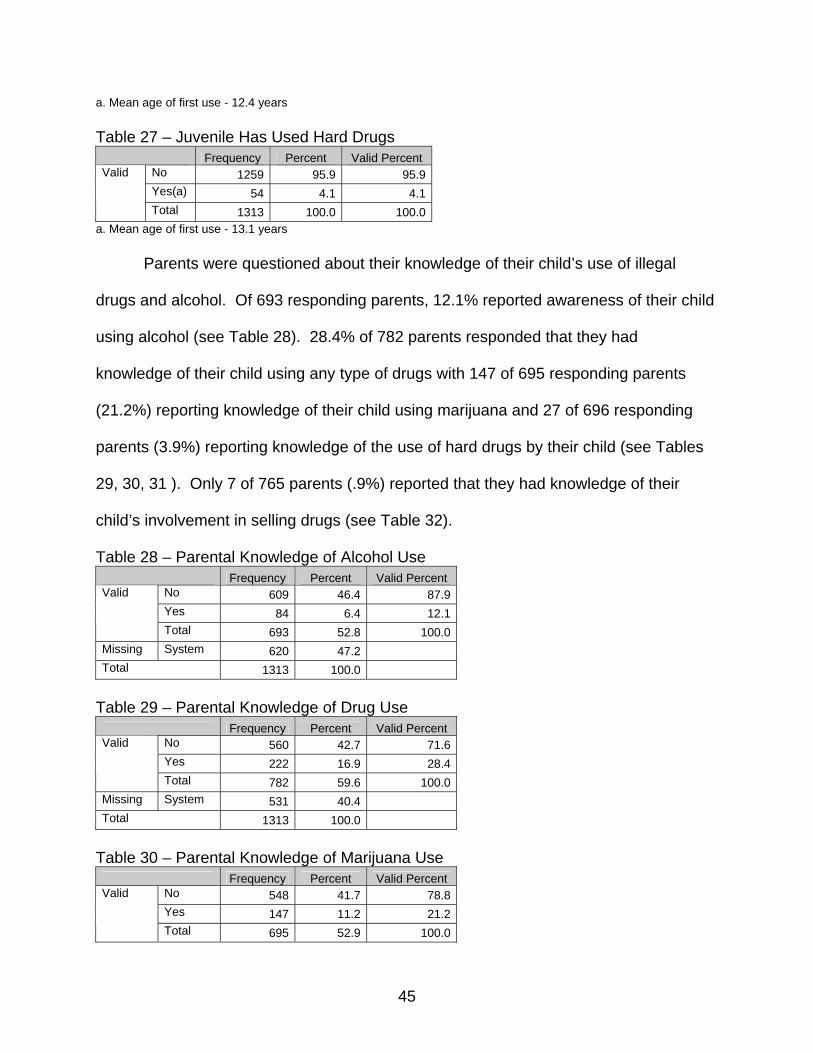
a. Mean age of first use - 12.4 years Table 27 – Juvenile Has Used Hard Drugs Frequency Percent Valid Percent
No 1259 95.9 95.9Yes(a) 54 4.1 4.1
Valid
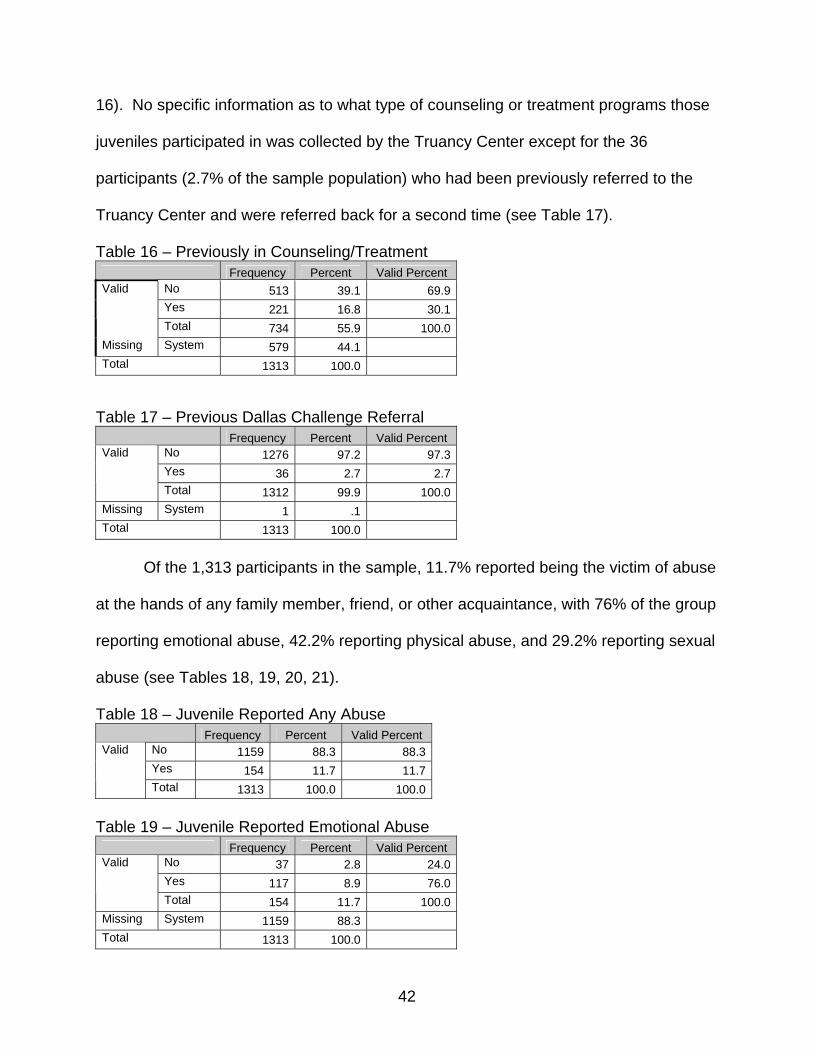
Total 1313 100.0 100.0a. Mean age of first use - 13.1 years Parents were questioned about their knowledge of their child’s use of illegal
drugs and alcohol. Of 693 responding parents, 12.1% reported awareness of their child
using alcohol (see Table 28). 28.4% of 782 parents responded that they had
knowledge of their child using any type of drugs with 147 of 695 responding parents
(21.2%) reporting knowledge of their child using marijuana and 27 of 696 responding
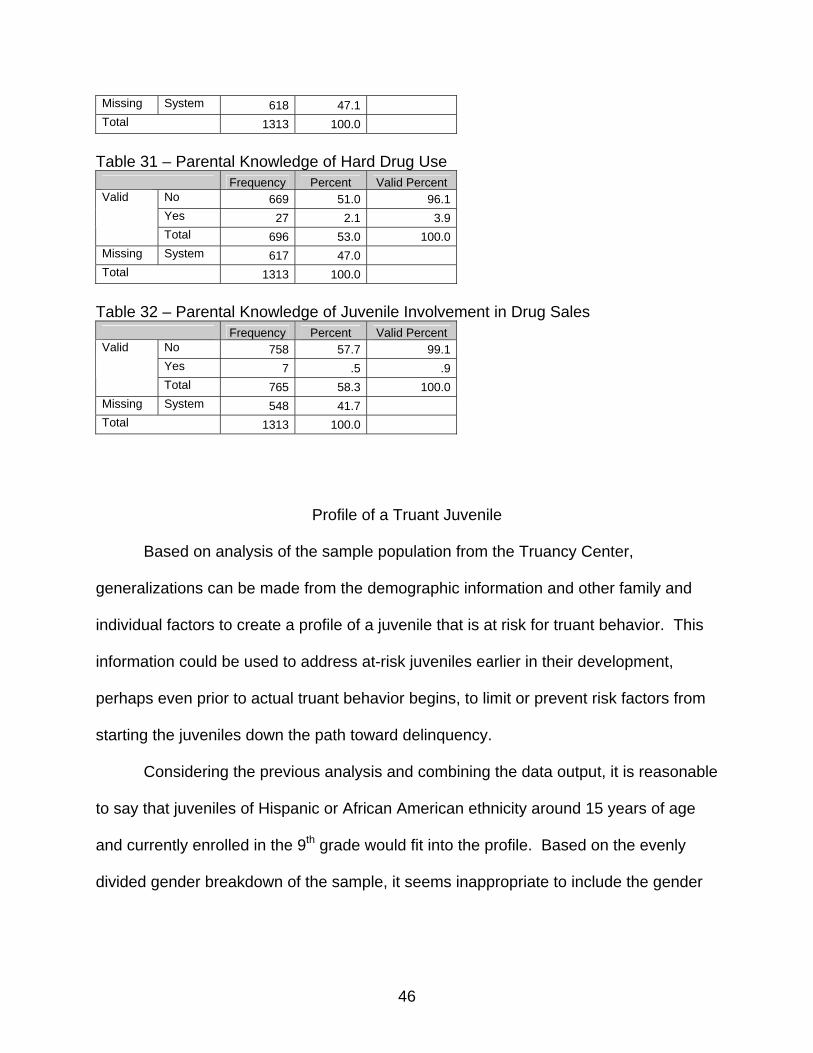
parents (3.9%) reporting knowledge of the use of hard drugs by their child (see Tables
29, 30, 31 ). Only 7 of 765 parents (.9%) reported that they had knowledge of their
child’s involvement in selling drugs (see Table 32).
Table 28 – Parental Knowledge of Alcohol Use Frequency Percent Valid Percent
No 609 46.4 87.9Yes 84 6.4 12.1
Valid
Total 693 52.8 100.0Missing System 620 47.2 Total 1313 100.0
Table 29 – Parental Knowledge of Drug Use Frequency Percent Valid Percent
No 560 42.7 71.6Yes 222 16.9 28.4
Valid
Total 782 59.6 100.0Missing System 531 40.4 Total 1313 100.0
Table 30 – Parental Knowledge of Marijuana Use Frequency Percent Valid Percent
No 548 41.7 78.8Yes 147 11.2 21.2
Valid
Total 695 52.9 100.0
45
Missing System 618 47.1 Total 1313 100.0
Table 31 – Parental Knowledge of Hard Drug Use Frequency Percent Valid Percent
No 669 51.0 96.1Yes 27 2.1 3.9
Valid
Total 696 53.0 100.0Missing System 617 47.0 Total 1313 100.0
Table 32 – Parental Knowledge of Juvenile Involvement in Drug Sales Frequency Percent Valid Percent
No 758 57.7 99.1Yes 7 .5 .9
Valid
Total 765 58.3 100.0Missing System 548 41.7 Total 1313 100.0
Profile of a Truant Juvenile
Based on analysis of the sample population from the Truancy Center,
generalizations can be made from the demographic information and other family and
individual factors to create a profile of a juvenile that is at risk for truant behavior. This
information could be used to address at-risk juveniles earlier in their development,
perhaps even prior to actual truant behavior begins, to limit or prevent risk factors from
starting the juveniles down the path toward delinquency.
Considering the previous analysis and combining the data output, it is reasonable
to say that juveniles of Hispanic or African American ethnicity around 15 years of age
and currently enrolled in the 9th grade would fit into the profile. Based on the evenly
divided gender breakdown of the sample, it seems inappropriate to include the gender
46
of the juvenile in the profile except to say that either sex is equally at risk for truant
behavior.
Additionally, the juvenile has most likely experienced behavioral issues that have
resulted in his/her parents being called to school and may have also been suspended or
expelled because of behavior problems. Despite behavioral problems, the juvenile has
most likely never failed a grade in school nor does he/she have a learning disability or
require enrollment in special education classes.
It is likely that the child comes from a single parent or broken home consisting of
a combination of birth parents and stepparents. One or both parents are most likely to
be employed but there is a possibility that the family does not have medical insurance.
The juvenile will also be likely to come from a multiple child household.
Regarding other personal factors of the juvenile, there is a low probability that the
juvenile has been the victim of abuse, has ever been involved in counseling, is currently
employed, or has used nicotine, alcohol or drugs.
This summary provides a loose idea of the profile of a truant juvenile. It should
be understood that because truancy is a status offense and therefore relatively minor in
the spectrum of illegal behavior for juveniles this profile is somewhat benign in nature.
What is important to consider is the presence of school problems that could lead to
disconnection from school by a student and that these problems most likely develop into
truant behavior during the years leading into the 9th grade that was presented as the
target year in the profile. That being said, it would be most useful to anticipate the
development of truant behavior through the identification of the above mentioned profile
characteristics in a juvenile prior to the manifestation of problem behavior. To do so
47
would require forecasting and assessment of individual and family factors for school
populations that fit the profile early in their school career as a proactive measure to
prevent truancy later in the academic career.
Comparison of successful and unsuccessful completion groups
Ideally, every individual referred to the Truancy Center would complete the
program requirements and utilize the services to change the problem behavior
previously exhibited. Unfortunately, that is not the reality of any program of this nature
and it is therefore necessary to compare the group that completed successfully to those
that did not and determine those characteristics that increased the probability of
successful completion based on the outcome of that comparison. To do so, a logistic
regression analysis was used to determine those variables that increase the probability
of completion and the amount of predictive power that each independent variable
contributes to the outcome of the dependant variable, in this case successful or
unsuccessful completion of the Truancy Center’s program requirements.
The incompleteness of data provided by the Truancy Center, due to the self
reported nature of the information gathered, has been previously discussed but plays a
major factor in the regression analysis. The statistical program being used for analysis
eliminates a case from consideration if any variable has a missing response when
processing the logistic regression. Therefore, the independent variables that were used
in the regression analysis were limited to those variables that had few missing cases.
The variables included in the analysis included were: age, sex, ethnicity, previous
48
Dallas Challenge referral, number of previous Dallas Challenge referrals, current grade,
number of grades failed, and report of abuse.
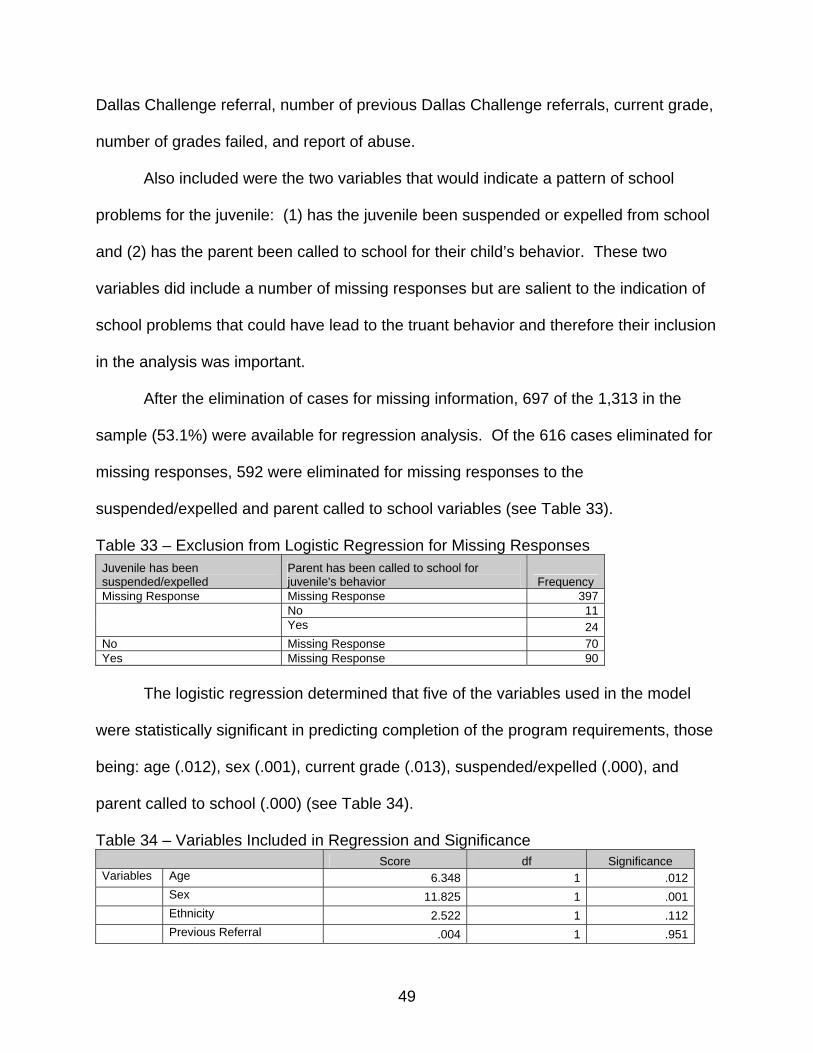
Also included were the two variables that would indicate a pattern of school
problems for the juvenile: (1) has the juvenile been suspended or expelled from school
and (2) has the parent been called to school for their child’s behavior. These two
variables did include a number of missing responses but are salient to the indication of
school problems that could have lead to the truant behavior and therefore their inclusion
in the analysis was important.
After the elimination of cases for missing information, 697 of the 1,313 in the
sample (53.1%) were available for regression analysis. Of the 616 cases eliminated for
missing responses, 592 were eliminated for missing responses to the
suspended/expelled and parent called to school variables (see Table 33).
Table 33 – Exclusion from Logistic Regression for Missing Responses Juvenile has been suspended/expelled
Parent has been called to school for juvenile's behavior Frequency
Missing Response Missing Response 397 No 11 Yes 24 No Missing Response 70 Yes Missing Response 90
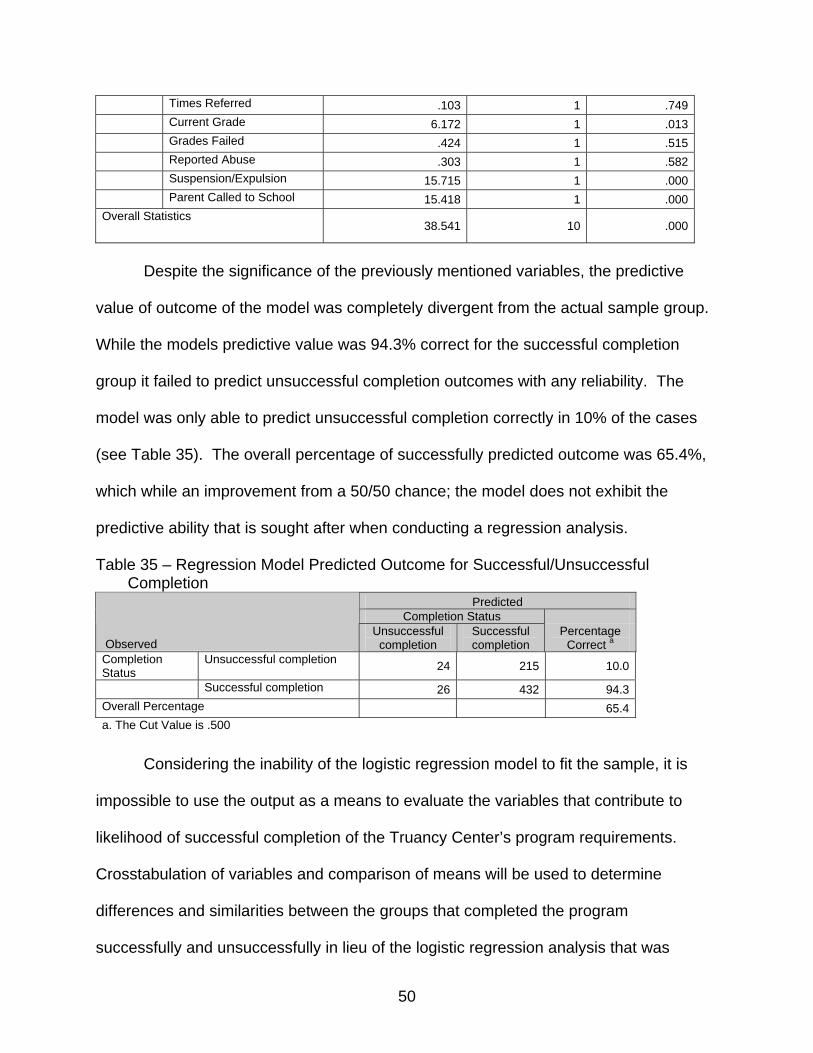
The logistic regression determined that five of the variables used in the model
were statistically significant in predicting completion of the program requirements, those
being: age (.012), sex (.001), current grade (.013), suspended/expelled (.000), and
parent called to school (.000) (see Table 34).
Table 34 – Variables Included in Regression and Significance Score df Significance Variables Age 6.348 1 .012 Sex 11.825 1 .001 Ethnicity 2.522 1 .112 Previous Referral .004 1 .951
49
Times Referred .103 1 .749 Current Grade 6.172 1 .013 Grades Failed .424 1 .515 Reported Abuse .303 1 .582 Suspension/Expulsion 15.715 1 .000 Parent Called to School 15.418 1 .000Overall Statistics
38.541 10 .000
Despite the significance of the previously mentioned variables, the predictive
value of outcome of the model was completely divergent from the actual sample group.
While the models predictive value was 94.3% correct for the successful completion
group it failed to predict unsuccessful completion outcomes with any reliability. The
model was only able to predict unsuccessful completion correctly in 10% of the cases
(see Table 35). The overall percentage of successfully predicted outcome was 65.4%,
which while an improvement from a 50/50 chance; the model does not exhibit the
predictive ability that is sought after when conducting a regression analysis.
Table 35 – Regression Model Predicted Outcome for Successful/Unsuccessful Completion
Predicted Completion Status
Observed Unsuccessful completion
Successful completion
Percentage Correct a
Completion Status
Unsuccessful completion 24 215 10.0
Successful completion 26 432 94.3 Overall Percentage 65.4 a. The Cut Value is .500
Considering the inability of the logistic regression model to fit the sample, it is
impossible to use the output as a means to evaluate the variables that contribute to
likelihood of successful completion of the Truancy Center’s program requirements.
Crosstabulation of variables and comparison of means will be used to determine
differences and similarities between the groups that completed the program
successfully and unsuccessfully in lieu of the logistic regression analysis that was
50
originally intended. Comparison of crosstabulation percentages and mean results will
allow for conclusions to be drawn from the independent variables that have missing
responses based on the available responses from the sample of participants.
Crosstabulation and Means Comparison Results for Demographic and Truancy Center
Related Variables
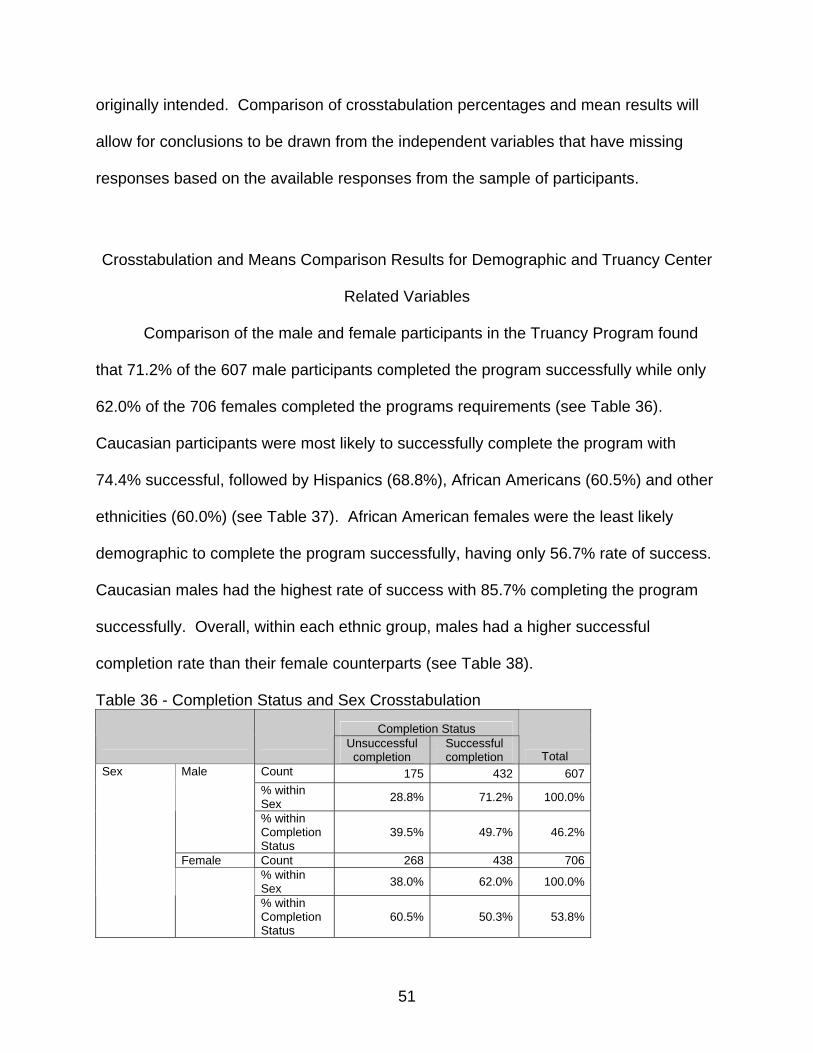
Comparison of the male and female participants in the Truancy Program found
that 71.2% of the 607 male participants completed the program successfully while only
62.0% of the 706 females completed the programs requirements (see Table 36).
Caucasian participants were most likely to successfully complete the program with
74.4% successful, followed by Hispanics (68.8%), African Americans (60.5%) and other
ethnicities (60.0%) (see Table 37). African American females were the least likely
demographic to complete the program successfully, having only 56.7% rate of success.
Caucasian males had the highest rate of success with 85.7% completing the program
successfully. Overall, within each ethnic group, males had a higher successful
completion rate than their female counterparts (see Table 38).
Table 36 - Completion Status and Sex Crosstabulation
Completion Status
Unsuccessful completion
Successful completion Total
Count 175 432 607 % within Sex 28.8% 71.2% 100.0%
Male
% within Completion Status
39.5% 49.7% 46.2%
Female Count 268 438 706 % within Sex 38.0% 62.0% 100.0%
Sex
% within Completion Status
60.5% 50.3% 53.8%
51
Total Count 443 870 1313
% of Total 33.7% 66.3% 100.0% Table 37 - Completion Status and Ethnicity of Juvenile Crosstabulation
Completion Status
Unsuccessful completion
Successful completion Total
Count 166 254 420% within Ethnicity of juvenile
39.5% 60.5% 100.0%
African American
% within Completion Status
38.0% 29.5% 32.3%
Caucasian Count 21 61 82% within Ethnicity of juvenile
25.6% 74.4% 100.0%
% within Completion Status
4.8% 7.1% 6.3%
Hispanic Count 244 538 782% within Ethnicity of juvenile
31.2% 68.8% 100.0%
% within Completion Status
55.8% 62.4% 60.2%
Other Count 6 9 15% within Ethnicity of juvenile
40.0% 60.0% 100.0%
Ethnicity of juvenile(a)
% within Completion Status
1.4% 1.0% 1.2%
Total Count 437 862 1299% within Ethnicity of juvenile
33.6% 66.4% 100.0%
a. 14 missing cases Table 38 – Completion Status by Sex and Ethnicity Crosstabulation
Completion Status Sex
Unsuccessful completion
Successful completion
Total
Male Ethnicity of juvenile(a)
African American
Count 69 127 196
% within Ethnicity of juvenile
35.2% 64.8% 100.0%
% within Completion Status
39.9% 29.7% 32.7%
% of Total 11.5% 21.2% 32.7%
52
a. 14 missing cases
Caucasian Count 6 36 42 % within
Ethnicity of juvenile
14.3% 85.7% 100.0%
% within Completion Status
3.5% 8.4% 7.0%
% of Total 1.0% 6.0% 7.0% Hispanic Count 96 260 356 % within
Ethnicity of juvenile
27.0% 73.0% 100.0%
% within Completion Status
55.5% 60.9% 59.3%
% of Total 16.0% 43.3% 59.3% Total Count 173 427 600 % within
Ethnicity of juvenile
28.8% 71.2% 100.0%
Female Ethnicity of juvenile(a)
African American
Count 97 127 224
% within Ethnicity of juvenile
43.3% 56.7% 100.0%
% within Completion Status
36.7% 29.2% 32.0%
% of Total 13.9% 18.2% 32.0%
Caucasian Count 15 25 40 % within
Ethnicity of juvenile
37.5% 62.5% 100.0%
% within Completion Status
5.7% 5.7% 5.7%
% of Total 2.1% 3.6% 5.7%
Hispanic Count 148 278 426
% within Ethnicity of juvenile
34.7% 65.3% 100.0%
% within Completion Status
56.1% 63.9% 60.9%
% of Total 21.2% 39.8% 60.9%
Total Count 264 435 699
% within Ethnicity of juvenile
37.8% 62.2% 100.0%
53
When comparing the mean ages of the two groups it was noted that while the
average age of those who completed the program successfully were older than those
who did not, the age difference in the two groups was negligible (10 weeks) (see Table
39).
Table 39 – Comparison of Mean Age by Completion Status Completion Status Mean Age N(a) Std. Deviation Unsuccessful completion 15.34 443 1.086Successful completion 15.54 869 1.114Total 15.47 1312 1.109
a. 1 missing case
The data also indicated that those participants who had a previous referral to the
Truancy Center completed the program successfully in only 41.7% of the cases while
those who were participating in their first referral completed the program in 66.9% of the
cases (see Table 40). It should be noted that while the number of second referrals to
the Truancy Center is small (n = 36) the 25.2% difference from those who have not
previously been referred to the program is substantial and could indicate that
alternatives to a second referral would be warranted.
Table 40 - Completion Status and Previous Dallas Challenge Referral Crosstabulation
Completion Status
Unsuccessful completion
Successful completion Total
Count 422 854 1276% within Previous Dallas Challenge referral
33.1% 66.9% 100.0%
No
% within Completion Status
95.3% 98.3% 97.3%
Yes Count 21 15 36% within Previous Dallas Challenge referral
58.3% 41.7% 100.0%
Previous Dallas Challenge referral(a)
% within Completion Status
4.7% 1.7% 2.7%
Total Count 443 869 1312
% within Previous 33.8% 66.2% 100.0%
54
Dallas Challenge referral
a. 1 missing case
Crosstabulation Results for School Related Variables
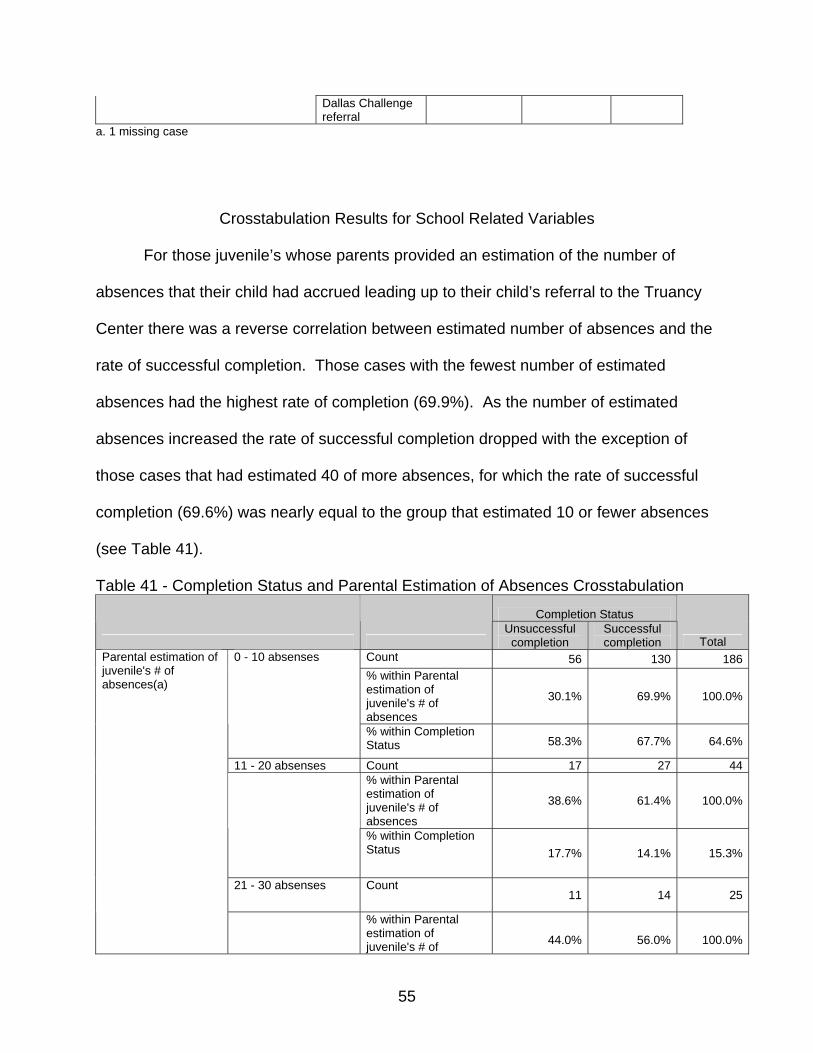
For those juvenile’s whose parents provided an estimation of the number of
absences that their child had accrued leading up to their child’s referral to the Truancy
Center there was a reverse correlation between estimated number of absences and the
rate of successful completion. Those cases with the fewest number of estimated
absences had the highest rate of completion (69.9%). As the number of estimated
absences increased the rate of successful completion dropped with the exception of
those cases that had estimated 40 of more absences, for which the rate of successful
completion (69.6%) was nearly equal to the group that estimated 10 or fewer absences
(see Table 41).
Table 41 - Completion Status and Parental Estimation of Absences Crosstabulation
Completion Status
Unsuccessful completion
Successful completion Total
Count 56 130 186% within Parental estimation of juvenile's # of absences
30.1% 69.9% 100.0%
0 - 10 absenses
% within Completion Status 58.3% 67.7% 64.6%
11 - 20 absenses Count 17 27 44% within Parental estimation of juvenile's # of absences
38.6% 61.4% 100.0%
% within Completion Status 17.7% 14.1% 15.3%
21 - 30 absenses Count 11 14 25
Parental estimation of juvenile's # of absences(a)
% within Parental estimation of juvenile's # of 44.0% 56.0% 100.0%
55
absences % within Completion Status 11.5% 7.3% 8.7%
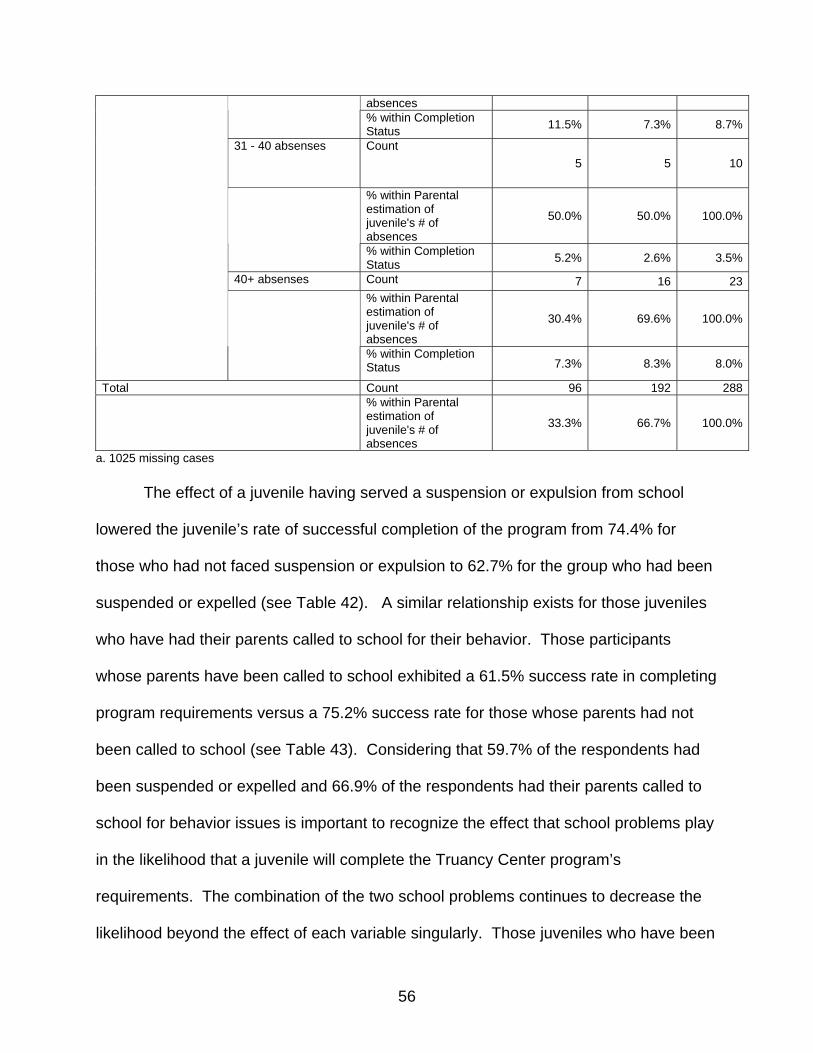
31 - 40 absenses Count 5 5 10
% within Parental estimation of juvenile's # of absences
50.0% 50.0% 100.0%
% within Completion Status 5.2% 2.6% 3.5%
40+ absenses Count 7 16 23% within Parental estimation of juvenile's # of absences
30.4% 69.6% 100.0%
% within Completion Status 7.3% 8.3% 8.0%
Total Count 96 192 288% within Parental estimation of juvenile's # of absences
33.3% 66.7% 100.0%
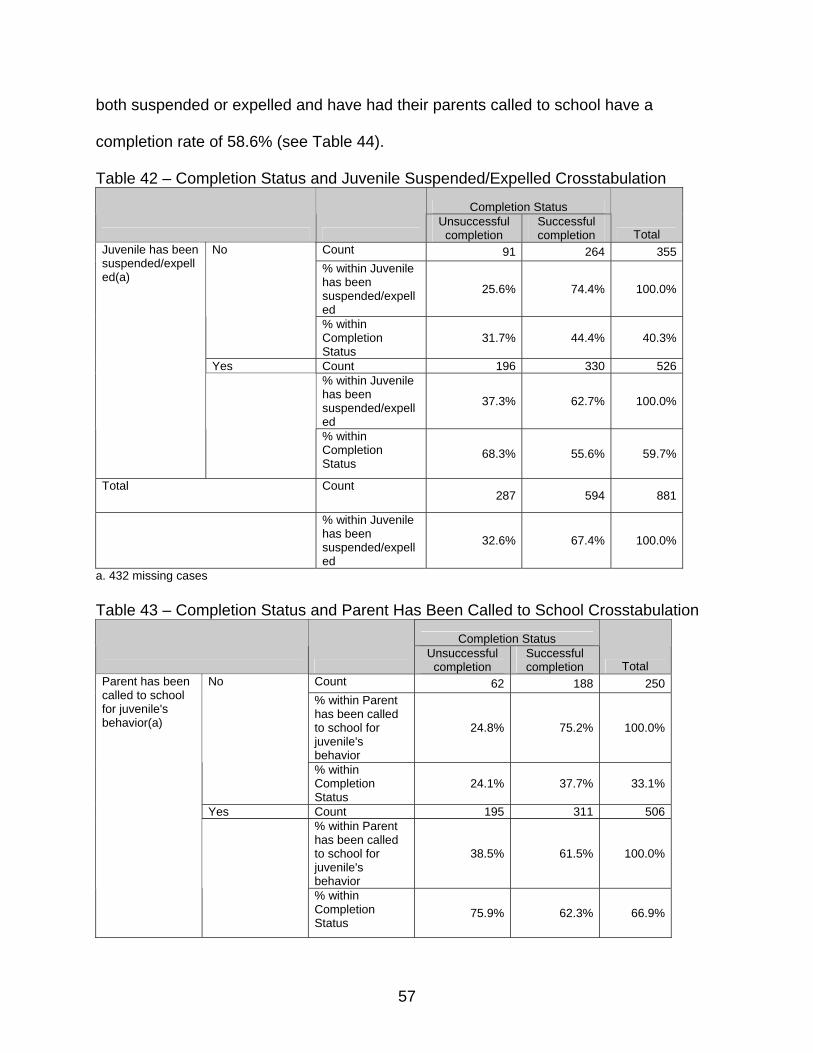
a. 1025 missing cases The effect of a juvenile having served a suspension or expulsion from school
lowered the juvenile’s rate of successful completion of the program from 74.4% for
those who had not faced suspension or expulsion to 62.7% for the group who had been
suspended or expelled (see Table 42). A similar relationship exists for those juveniles
who have had their parents called to school for their behavior. Those participants
whose parents have been called to school exhibited a 61.5% success rate in completing
program requirements versus a 75.2% success rate for those whose parents had not
been called to school (see Table 43). Considering that 59.7% of the respondents had
been suspended or expelled and 66.9% of the respondents had their parents called to
school for behavior issues is important to recognize the effect that school problems play
in the likelihood that a juvenile will complete the Truancy Center program’s
requirements. The combination of the two school problems continues to decrease the
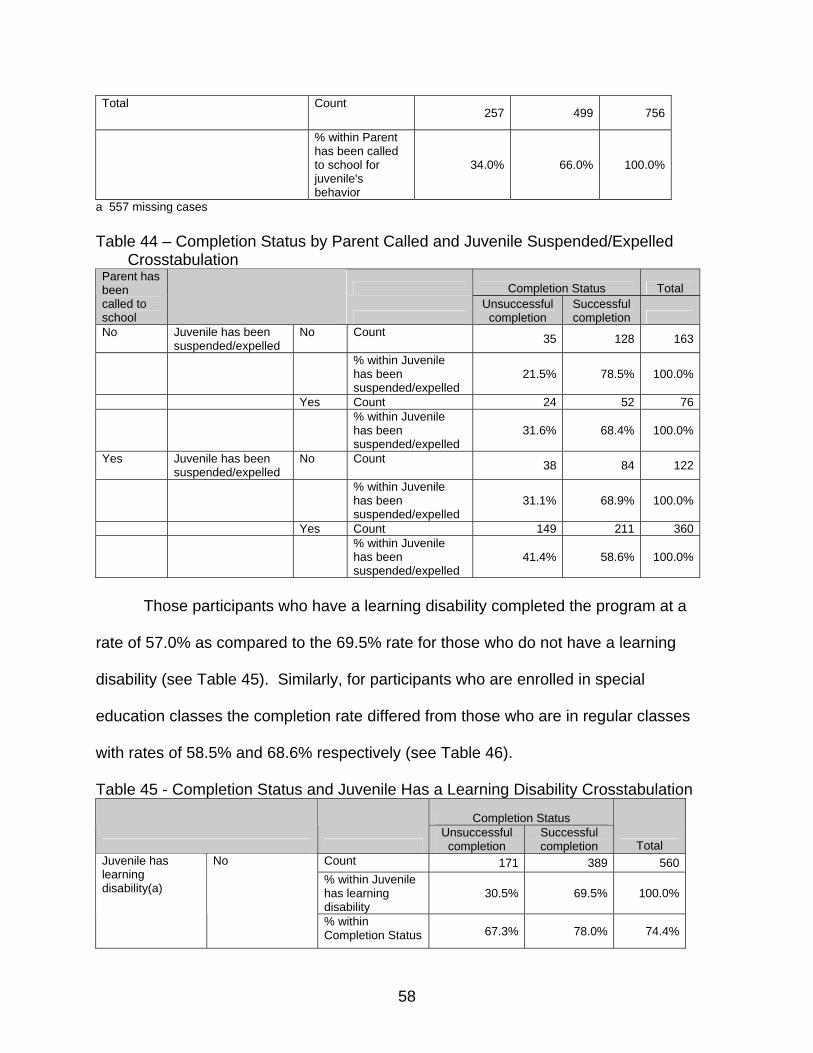
likelihood beyond the effect of each variable singularly. Those juveniles who have been
56
both suspended or expelled and have had their parents called to school have a
completion rate of 58.6% (see Table 44).
Table 42 – Completion Status and Juvenile Suspended/Expelled Crosstabulation
Completion Status
Unsuccessful completion
Successful completion Total
Count 91 264 355% within Juvenile has been suspended/expelled
25.6% 74.4% 100.0%
No
% within Completion Status
31.7% 44.4% 40.3%
Yes Count 196 330 526% within Juvenile has been suspended/expelled
37.3% 62.7% 100.0%
Juvenile has been suspended/expelled(a)
% within Completion Status
68.3% 55.6% 59.7%
Total Count 287 594 881
% within Juvenile has been suspended/expelled
32.6% 67.4% 100.0%
a. 432 missing cases Table 43 – Completion Status and Parent Has Been Called to School Crosstabulation
Completion Status
Unsuccessful completion
Successful completion Total
Count 62 188 250% within Parent has been called to school for juvenile's behavior
24.8% 75.2% 100.0%
No
% within Completion Status
24.1% 37.7% 33.1%
Yes Count 195 311 506% within Parent has been called to school for juvenile's behavior
38.5% 61.5% 100.0%
Parent has been called to school for juvenile's behavior(a)
% within Completion Status
75.9% 62.3% 66.9%
57
Total Count 257 499 756
% within Parent has been called to school for juvenile's behavior
34.0% 66.0% 100.0%
a 557 missing cases Table 44 – Completion Status by Parent Called and Juvenile Suspended/Expelled
Crosstabulation
Completion Status Total Parent has been called to school
Unsuccessful completion
Successful completion
No Juvenile has been suspended/expelled
No Count 35 128 163
% within Juvenile has been suspended/expelled
21.5% 78.5% 100.0%
Yes Count 24 52 76 % within Juvenile
has been suspended/expelled
31.6% 68.4% 100.0%
Yes Juvenile has been suspended/expelled
No Count 38 84 122
% within Juvenile has been suspended/expelled
31.1% 68.9% 100.0%
Yes Count 149 211 360 % within Juvenile
has been suspended/expelled
41.4% 58.6% 100.0%
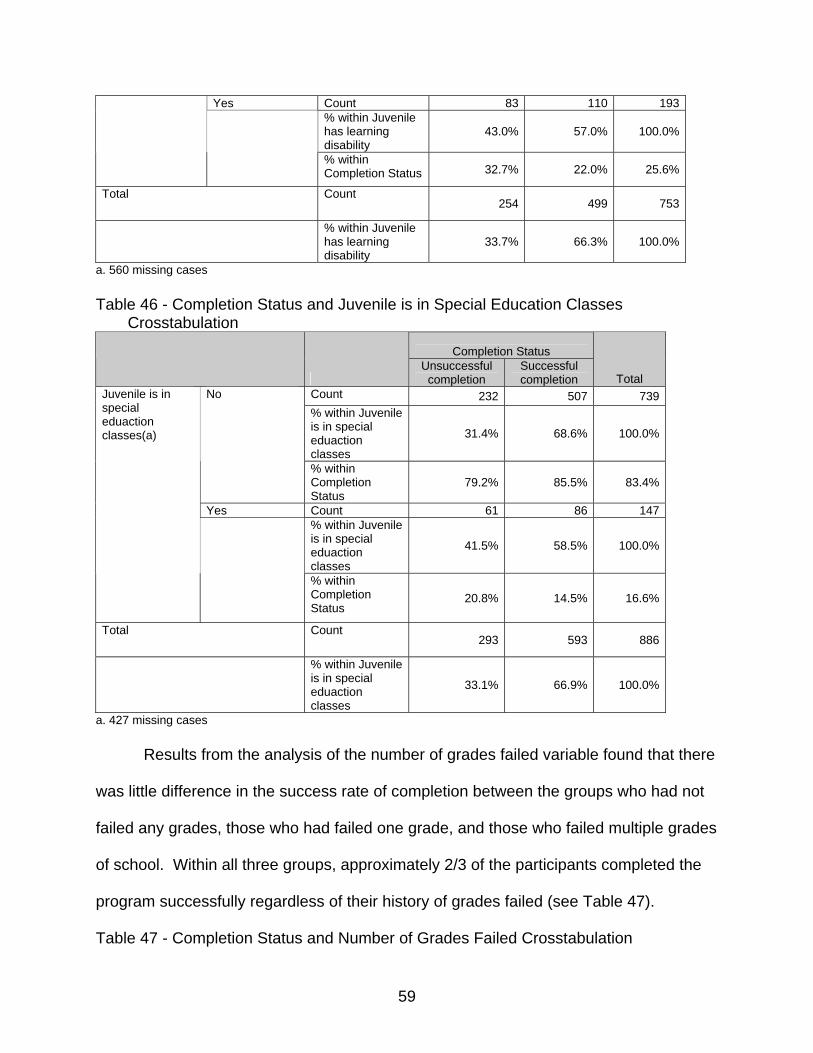
Those participants who have a learning disability completed the program at a
rate of 57.0% as compared to the 69.5% rate for those who do not have a learning
disability (see Table 45). Similarly, for participants who are enrolled in special
education classes the completion rate differed from those who are in regular classes
with rates of 58.5% and 68.6% respectively (see Table 46).
Table 45 - Completion Status and Juvenile Has a Learning Disability Crosstabulation
Completion Status
Unsuccessful completion
Successful completion Total
Count 171 389 560% within Juvenile has learning disability
30.5% 69.5% 100.0%
Juvenile has learning disability(a)
No
% within Completion Status 67.3% 78.0% 74.4%
58
Yes Count 83 110 193% within Juvenile has learning disability
43.0% 57.0% 100.0%
% within Completion Status 32.7% 22.0% 25.6%
Total Count 254 499 753
% within Juvenile has learning disability
33.7% 66.3% 100.0%
a. 560 missing cases Table 46 - Completion Status and Juvenile is in Special Education Classes
Crosstabulation
Completion Status
Unsuccessful completion
Successful completion Total
Count 232 507 739% within Juvenile is in special eduaction classes
31.4% 68.6% 100.0%
No
% within Completion Status
79.2% 85.5% 83.4%
Yes Count 61 86 147% within Juvenile is in special eduaction classes
41.5% 58.5% 100.0%
Juvenile is in special eduaction classes(a)
% within Completion Status
20.8% 14.5% 16.6%
Total Count 293 593 886
% within Juvenile is in special eduaction classes
33.1% 66.9% 100.0%
a. 427 missing cases Results from the analysis of the number of grades failed variable found that there
was little difference in the success rate of completion between the groups who had not
failed any grades, those who had failed one grade, and those who failed multiple grades
of school. Within all three groups, approximately 2/3 of the participants completed the
program successfully regardless of their history of grades failed (see Table 47).
Table 47 - Completion Status and Number of Grades Failed Crosstabulation
59
Completion Status
Unsuccessful completion
Successful completion Total
Count 338 654 992% within Grades failed 34.1% 65.9% 100.0%
No Grades Failed
% within Completion Status 76.6% 75.8% 76.1%
One Grade Failed Count 83 171 254% within Grades failed 32.7% 67.3% 100.0%
% within Completion Status 18.8% 19.8% 19.5%
Multiple Grades Failed
Count 20 38 58
% within Grades failed 34.5% 65.5% 100.0%
Grades failed(a)
% within Completion Status 4.5% 4.4% 4.4%
Total Count 441 863 1304% within Grades failed 33.8% 66.2% 100.0%
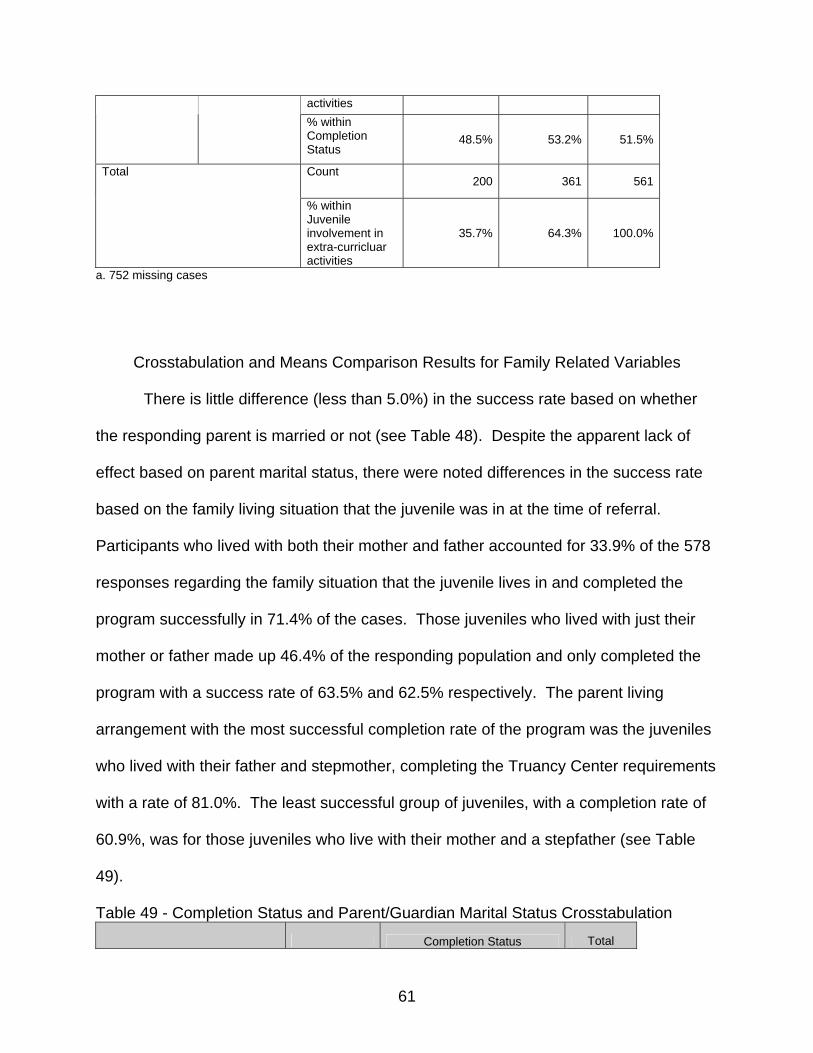
a. 9 missing cases Involvement in extracurricular activities had a minimal effect on increasing
likelihood of successful program completion. The participants responding to the
question were evenly regarding their involvement in extra-curricular activities and the
rate of completion of the program for both responses was inline with the overall
completion percentages of the sample (see Table 48).
Table 48 - Completion Status and Juvenile Involvement in Extra-Curricular Activities Crosstabulation
Completion Status
Unsuccessful completion
Successful completion Total
Count 103 169 272 % within Juvenile involvement in extra-curricluar activities
37.9% 62.1% 100.0%
No
% within Completion Status
51.5% 46.8% 48.5%
Yes Count 97 192 289
Juvenile involvement in extra-curricluar activities(a)
% within Juvenile involvement in extra-curricluar
33.6% 66.4% 100.0%
60
activities % within Completion Status
48.5% 53.2% 51.5%
Total Count 200 361 561
% within Juvenile involvement in extra-curricluar activities
35.7% 64.3% 100.0%
a. 752 missing cases
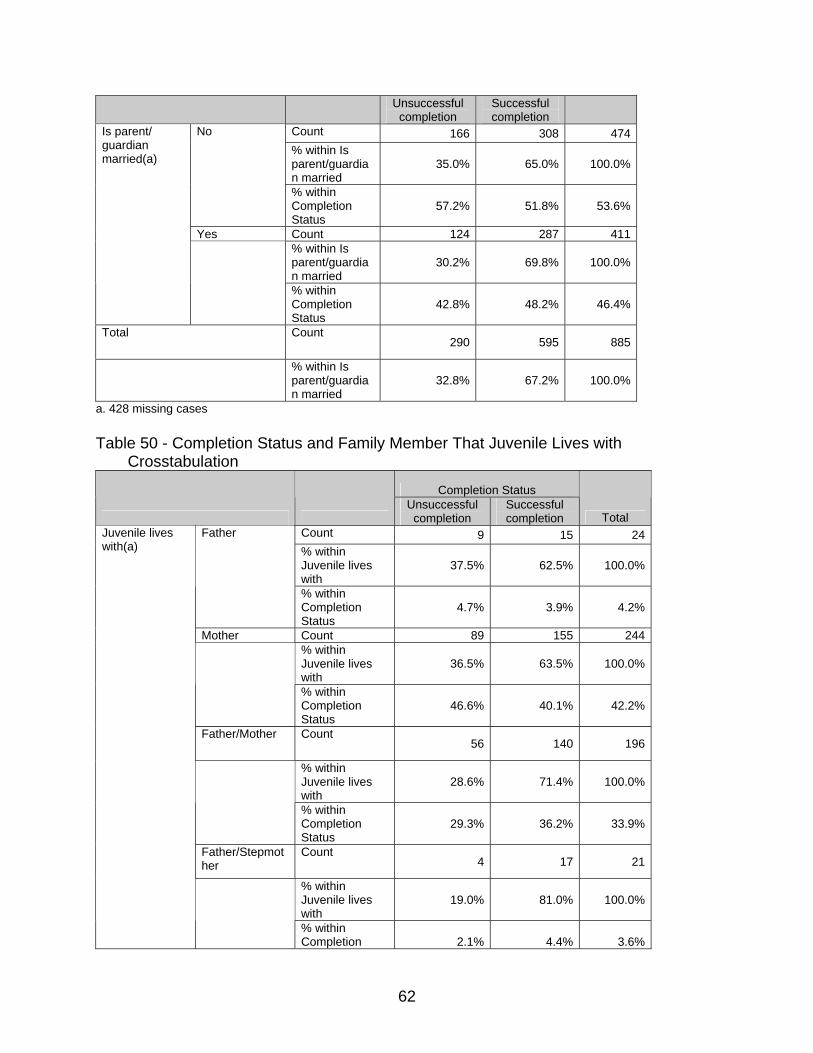
Crosstabulation and Means Comparison Results for Family Related Variables
There is little difference (less than 5.0%) in the success rate based on whether
the responding parent is married or not (see Table 48). Despite the apparent lack of
effect based on parent marital status, there were noted differences in the success rate
based on the family living situation that the juvenile was in at the time of referral.
Participants who lived with both their mother and father accounted for 33.9% of the 578
responses regarding the family situation that the juvenile lives in and completed the
program successfully in 71.4% of the cases. Those juveniles who lived with just their
mother or father made up 46.4% of the responding population and only completed the
program with a success rate of 63.5% and 62.5% respectively. The parent living
arrangement with the most successful completion rate of the program was the juveniles
who lived with their father and stepmother, completing the Truancy Center requirements
with a rate of 81.0%. The least successful group of juveniles, with a completion rate of
60.9%, was for those juveniles who live with their mother and a stepfather (see Table
49).
Table 49 - Completion Status and Parent/Guardian Marital Status Crosstabulation
Completion Status Total
61
Unsuccessful completion
Successful completion
Count 166 308 474 % within Is parent/guardian married
35.0% 65.0% 100.0%
No
% within Completion Status
57.2% 51.8% 53.6%
Yes Count 124 287 411 % within Is parent/guardian married
30.2% 69.8% 100.0%
Is parent/ guardian married(a)
% within Completion Status
42.8% 48.2% 46.4%
Total Count 290 595 885
% within Is parent/guardian married
32.8% 67.2% 100.0%
a. 428 missing cases Table 50 - Completion Status and Family Member That Juvenile Lives with
Crosstabulation
Completion Status
Unsuccessful completion
Successful completion Total
Count 9 15 24 % within Juvenile lives with
37.5% 62.5% 100.0%
Father
% within Completion Status
4.7% 3.9% 4.2%
Mother Count 89 155 244 % within Juvenile lives with
36.5% 63.5% 100.0%
% within Completion Status
46.6% 40.1% 42.2%
Father/Mother Count 56 140 196
% within Juvenile lives with
28.6% 71.4% 100.0%
% within Completion Status
29.3% 36.2% 33.9%
Father/Stepmother
Count 4 17 21
% within Juvenile lives with
19.0% 81.0% 100.0%
Juvenile lives with(a)
% within Completion 2.1% 4.4% 3.6%
62
Status Count
27 42 69
% within Juvenile lives with
39.1% 60.9% 100.0%
Mother/Stepfather
% within Completion Status
14.1% 10.9% 11.9%
Stepfather/Stepmother
Count 2 7 9
% within Juvenile lives with
22.2% 77.8% 100.0%
% within Completion Status
1.0% 1.8% 1.6%
Stepmother Count 4 11 15 % within Juvenile lives with
26.7% 73.3% 100.0%
% within Completion Status
2.1% 2.8% 2.6%
Total Count 191 387 578
% within Juvenile lives with
33.0% 67.0% 100.0%
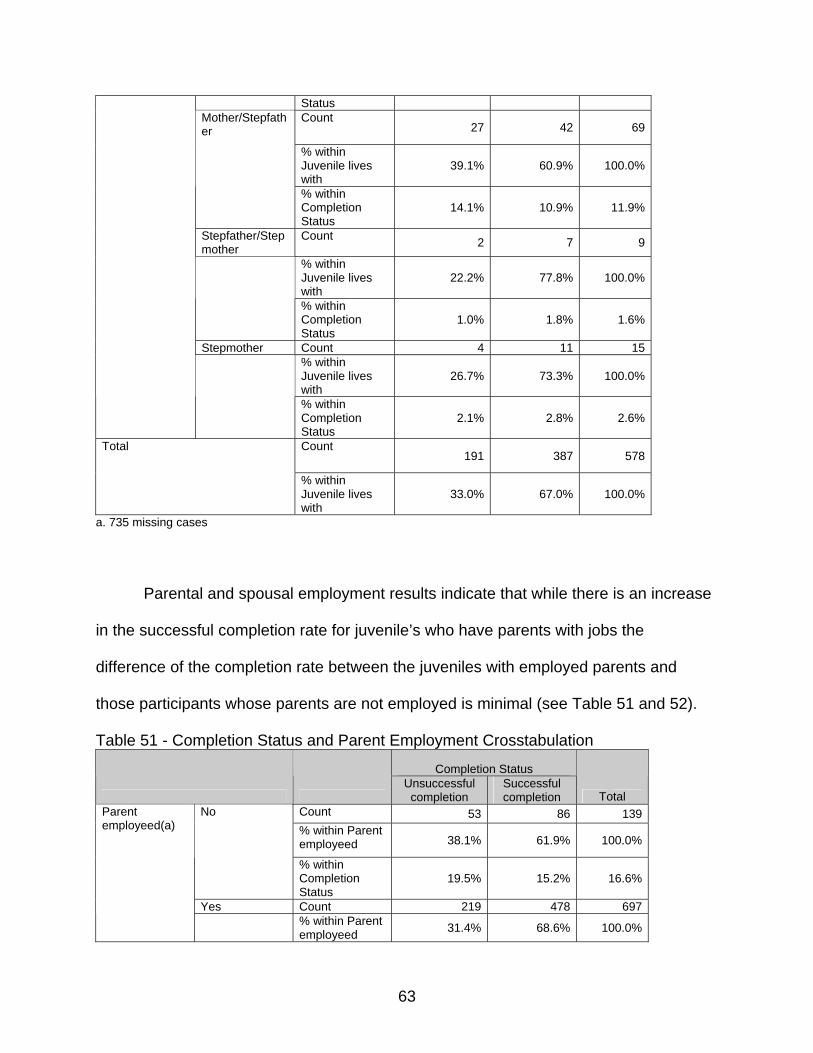
a. 735 missing cases Parental and spousal employment results indicate that while there is an increase
in the successful completion rate for juvenile’s who have parents with jobs the
difference of the completion rate between the juveniles with employed parents and
those participants whose parents are not employed is minimal (see Table 51 and 52).
Table 51 - Completion Status and Parent Employment Crosstabulation
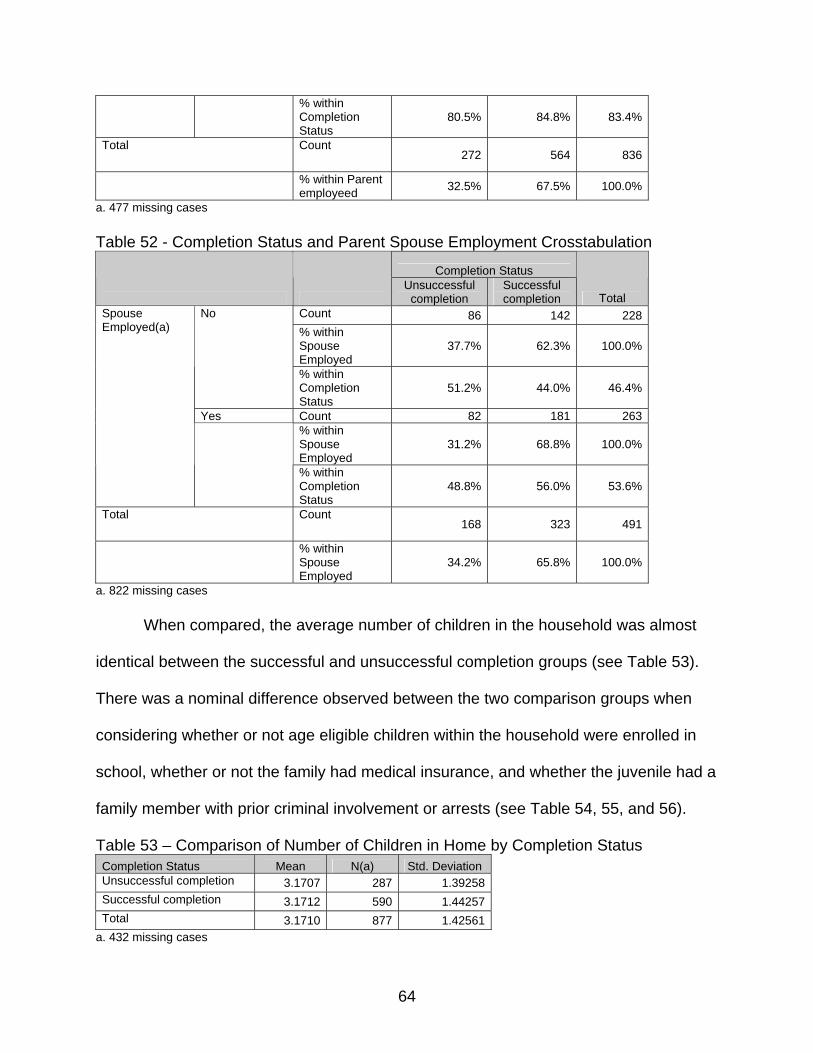
a. 477 missing cases Table 52 - Completion Status and Parent Spouse Employment Crosstabulation
Completion Status
Unsuccessful completion
Successful completion Total
Count 86 142 228 % within Spouse Employed
37.7% 62.3% 100.0%
No
% within Completion Status
51.2% 44.0% 46.4%
Yes Count 82 181 263 % within Spouse Employed
31.2% 68.8% 100.0%
Spouse Employed(a)
% within Completion Status
48.8% 56.0% 53.6%
Total Count 168 323 491
% within Spouse Employed
34.2% 65.8% 100.0%
a. 822 missing cases When compared, the average number of children in the household was almost
identical between the successful and unsuccessful completion groups (see Table 53).
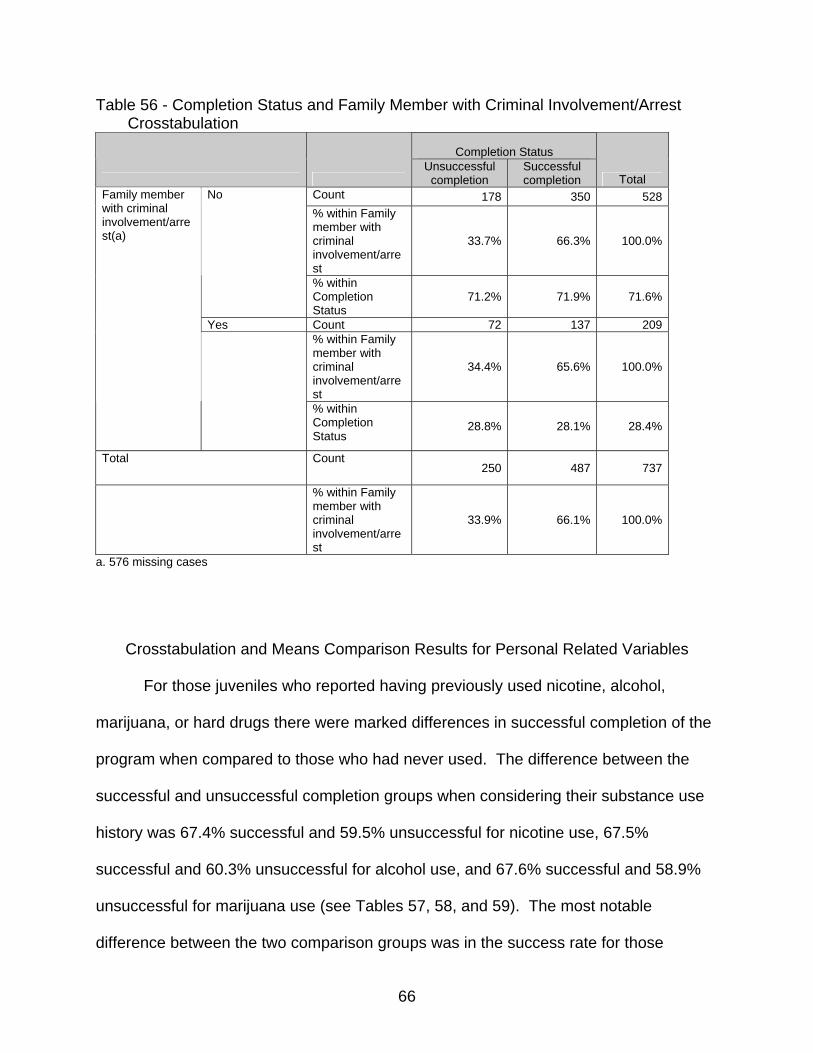
There was a nominal difference observed between the two comparison groups when
considering whether or not age eligible children within the household were enrolled in
school, whether or not the family had medical insurance, and whether the juvenile had a
family member with prior criminal involvement or arrests (see Table 54, 55, and 56).
Table 53 – Comparison of Number of Children in Home by Completion Status Completion Status Mean N(a) Std. Deviation Unsuccessful completion 3.1707 287 1.39258Successful completion 3.1712 590 1.44257Total 3.1710 877 1.42561
a. 432 missing cases
64
Table 54 – Completion Status and Age Eligible Children Enrolled in School
Crosstabulation
Completion Status
Unsuccessful completion
Successful completion Total
Count 14 24 38% within Age eligible children enrolled in school
36.8% 63.2% 100.0%
No
% within Completion Status
4.6% 3.9% 4.2%
Yes Count 289 584 873% within Age eligible children enrolled in school
33.1% 66.9% 100.0%
Age eligible children enrolled in school(a)
% within Completion Status
95.4% 96.1% 95.8%
Count 303 608 911
Total
% within Age eligible children enrolled in school
33.3% 66.7% 100.0%
a. 402 missing cases Table 55 - Completion Status and Medical Insurance Crosstabulation
Completion Status
Unsuccessful completion
Successful completion Total
Count 142 294 436 % within Medical Insurance
32.6% 67.4% 100.0%
No
% within Completion Status
59.4% 61.6% 60.9%
Yes Count 97 183 280 % within Medical Insurance
34.6% 65.4% 100.0%
Medical Insurance(a)
% within Completion Status
40.6% 38.4% 39.1%
Total Count 239 477 716
% within Medical Insurance
33.4% 66.6% 100.0%
a. 597 missing cases
65
Table 56 - Completion Status and Family Member with Criminal Involvement/Arrest Crosstabulation
Completion Status
Unsuccessful completion
Successful completion Total
Count 178 350 528% within Family member with criminal involvement/arrest
33.7% 66.3% 100.0%
No
% within Completion Status
71.2% 71.9% 71.6%
Yes Count 72 137 209% within Family member with criminal involvement/arrest
34.4% 65.6% 100.0%
Family member with criminal involvement/arrest(a)
% within Completion Status
28.8% 28.1% 28.4%
Total Count 250 487 737
% within Family member with criminal involvement/arrest
33.9% 66.1% 100.0%
a. 576 missing cases
Crosstabulation and Means Comparison Results for Personal Related Variables
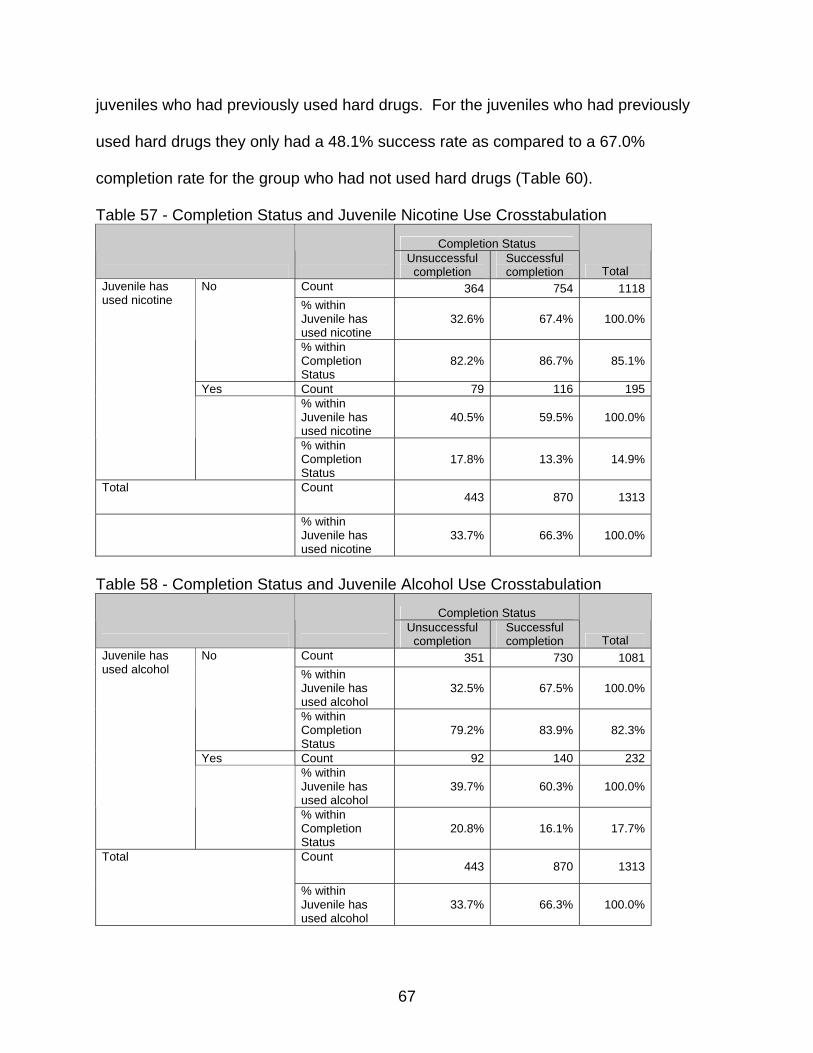
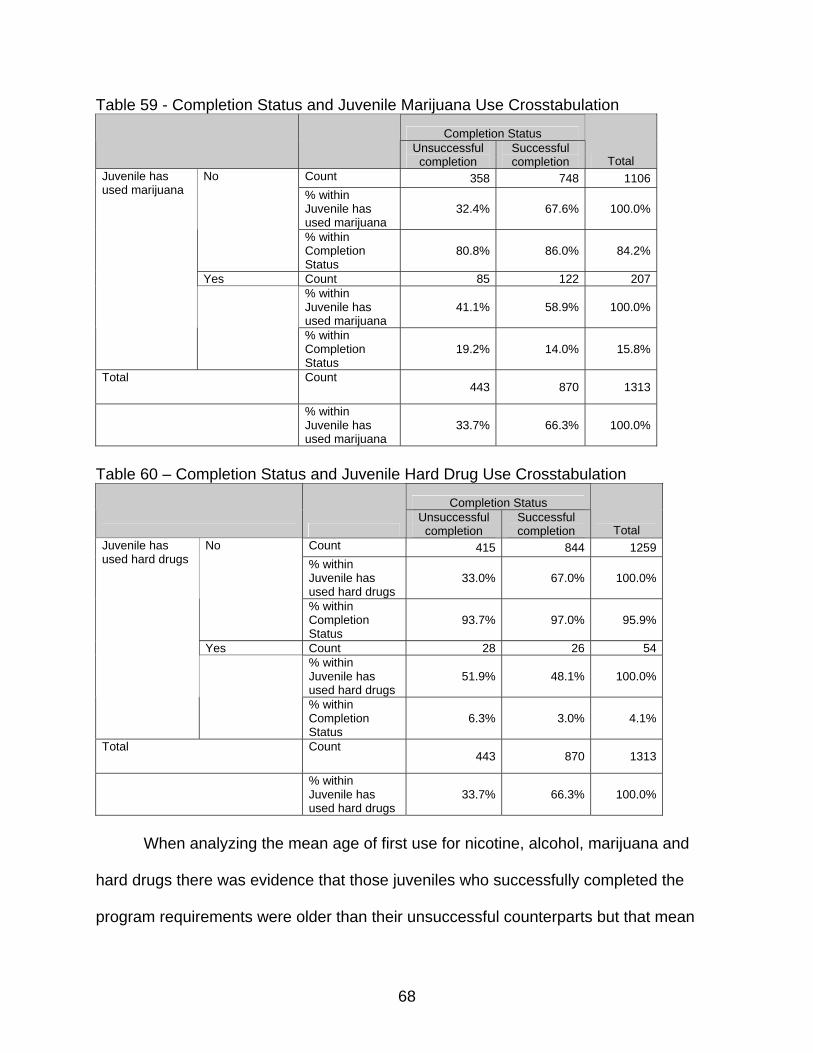
For those juveniles who reported having previously used nicotine, alcohol,
marijuana, or hard drugs there were marked differences in successful completion of the
program when compared to those who had never used. The difference between the
successful and unsuccessful completion groups when considering their substance use
history was 67.4% successful and 59.5% unsuccessful for nicotine use, 67.5%
successful and 60.3% unsuccessful for alcohol use, and 67.6% successful and 58.9%
unsuccessful for marijuana use (see Tables 57, 58, and 59). The most notable
difference between the two comparison groups was in the success rate for those
66
juveniles who had previously used hard drugs. For the juveniles who had previously
used hard drugs they only had a 48.1% success rate as compared to a 67.0%
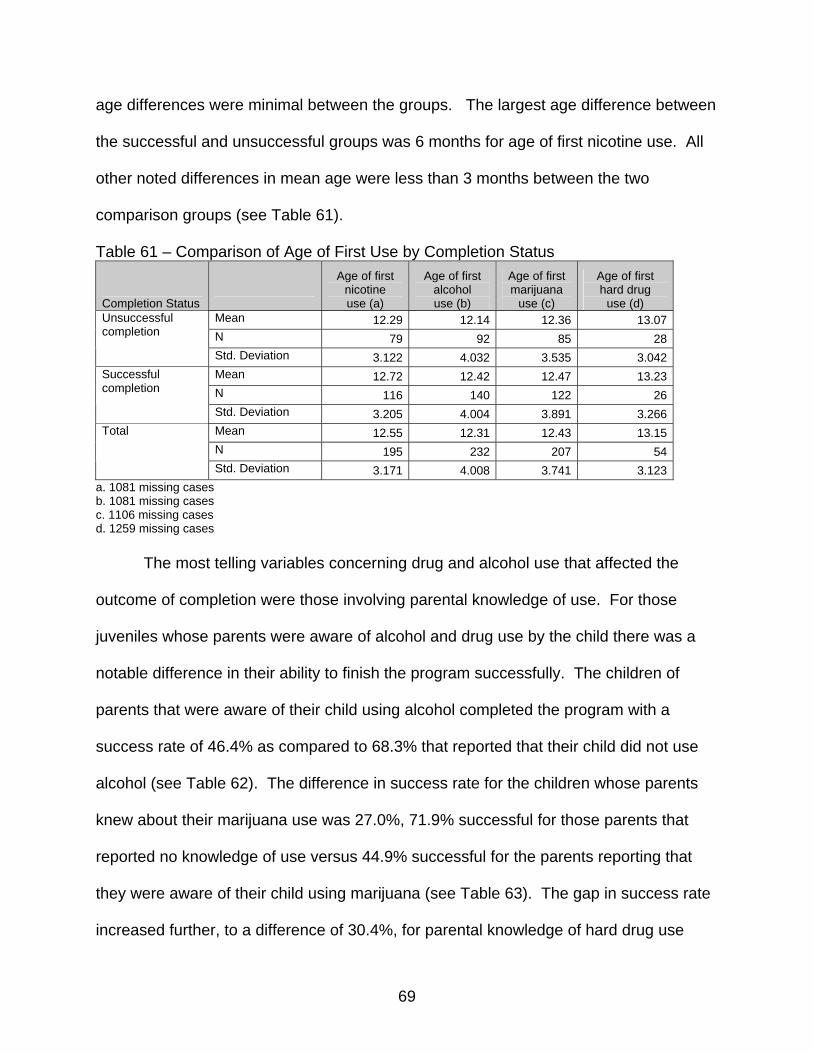
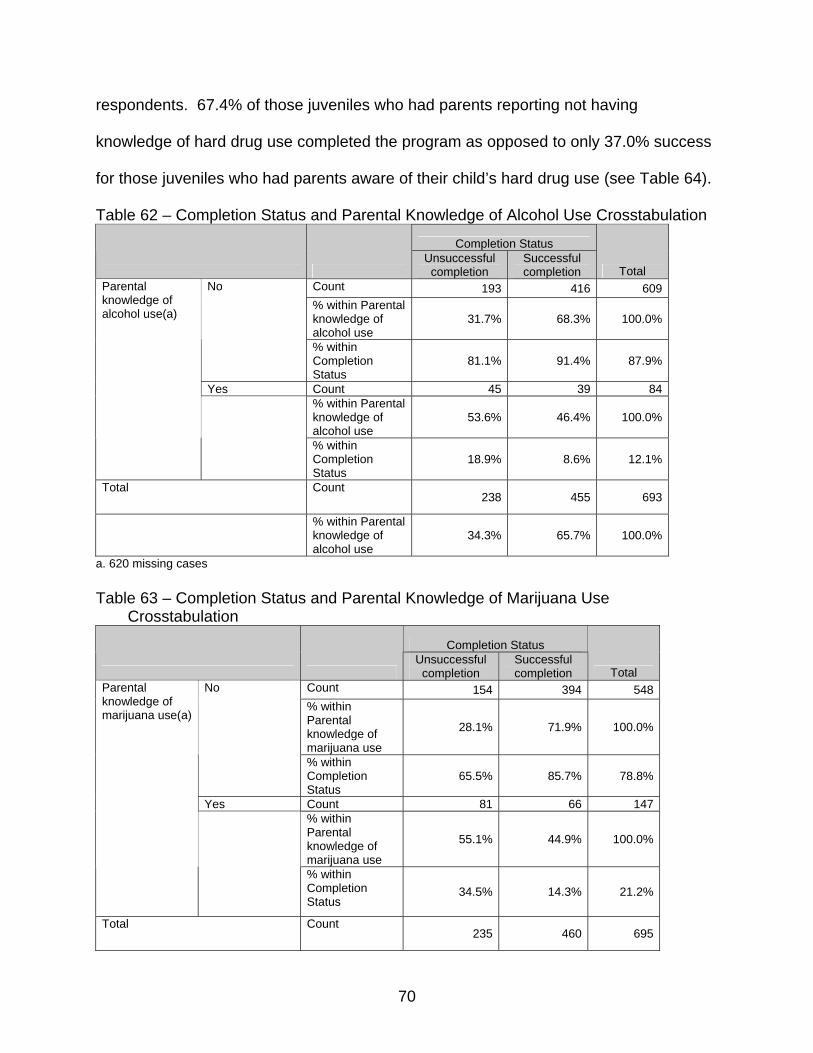
completion rate for the group who had not used hard drugs (Table 60).
Table 57 - Completion Status and Juvenile Nicotine Use Crosstabulation
Completion Status
Unsuccessful completion
Successful completion Total
Count 364 754 1118 % within Juvenile has used nicotine
32.6% 67.4% 100.0%
No
% within Completion Status
82.2% 86.7% 85.1%
Yes Count 79 116 195 % within Juvenile has used nicotine
40.5% 59.5% 100.0%
Juvenile has used nicotine
% within Completion Status
17.8% 13.3% 14.9%
Total Count 443 870 1313
% within Juvenile has used nicotine
33.7% 66.3% 100.0%
Table 58 - Completion Status and Juvenile Alcohol Use Crosstabulation
Completion Status
Unsuccessful completion
Successful completion Total
Count 351 730 1081 % within Juvenile has used alcohol
32.5% 67.5% 100.0%
No
% within Completion Status
79.2% 83.9% 82.3%
Yes Count 92 140 232 % within Juvenile has used alcohol
39.7% 60.3% 100.0%
Juvenile has used alcohol
% within Completion Status
20.8% 16.1% 17.7%
Total Count 443 870 1313
% within Juvenile has used alcohol
33.7% 66.3% 100.0%
67
Table 59 - Completion Status and Juvenile Marijuana Use Crosstabulation
Completion Status
Unsuccessful completion
Successful completion Total
Count 358 748 1106 % within Juvenile has used marijuana
32.4% 67.6% 100.0%
No
% within Completion Status
80.8% 86.0% 84.2%
Yes Count 85 122 207 % within Juvenile has used marijuana
41.1% 58.9% 100.0%
Juvenile has used marijuana
% within Completion Status
19.2% 14.0% 15.8%
Total Count 443 870 1313
% within Juvenile has used marijuana
33.7% 66.3% 100.0%
Table 60 – Completion Status and Juvenile Hard Drug Use Crosstabulation
Completion Status
Unsuccessful completion
Successful completion Total
Count 415 844 1259% within Juvenile has used hard drugs
33.0% 67.0% 100.0%
No
% within Completion Status
93.7% 97.0% 95.9%
Yes Count 28 26 54% within Juvenile has used hard drugs
51.9% 48.1% 100.0%
Juvenile has used hard drugs
% within Completion Status
6.3% 3.0% 4.1%
Total Count 443 870 1313
% within Juvenile has used hard drugs
33.7% 66.3% 100.0%
When analyzing the mean age of first use for nicotine, alcohol, marijuana and
hard drugs there was evidence that those juveniles who successfully completed the
program requirements were older than their unsuccessful counterparts but that mean
68
age differences were minimal between the groups. The largest age difference between
the successful and unsuccessful groups was 6 months for age of first nicotine use. All
other noted differences in mean age were less than 3 months between the two
comparison groups (see Table 61).
Table 61 – Comparison of Age of First Use by Completion Status
Std. Deviation 3.171 4.008 3.741 3.123a. 1081 missing cases b. 1081 missing cases c. 1106 missing cases d. 1259 missing cases The most telling variables concerning drug and alcohol use that affected the
outcome of completion were those involving parental knowledge of use. For those
juveniles whose parents were aware of alcohol and drug use by the child there was a
notable difference in their ability to finish the program successfully. The children of
parents that were aware of their child using alcohol completed the program with a
success rate of 46.4% as compared to 68.3% that reported that their child did not use
alcohol (see Table 62). The difference in success rate for the children whose parents
knew about their marijuana use was 27.0%, 71.9% successful for those parents that
reported no knowledge of use versus 44.9% successful for the parents reporting that
they were aware of their child using marijuana (see Table 63). The gap in success rate
increased further, to a difference of 30.4%, for parental knowledge of hard drug use
69
respondents. 67.4% of those juveniles who had parents reporting not having
knowledge of hard drug use completed the program as opposed to only 37.0% success
for those juveniles who had parents aware of their child’s hard drug use (see Table 64).
Table 62 – Completion Status and Parental Knowledge of Alcohol Use Crosstabulation
Completion Status
Unsuccessful completion
Successful completion Total
Count 193 416 609% within Parental knowledge of alcohol use
31.7% 68.3% 100.0%
No
% within Completion Status
81.1% 91.4% 87.9%
Yes Count 45 39 84% within Parental knowledge of alcohol use
53.6% 46.4% 100.0%
Parental knowledge of alcohol use(a)
% within Completion Status
18.9% 8.6% 12.1%
Total Count 238 455 693
% within Parental knowledge of alcohol use
34.3% 65.7% 100.0%
a. 620 missing cases Table 63 – Completion Status and Parental Knowledge of Marijuana Use
Crosstabulation
Completion Status
Unsuccessful completion
Successful completion Total
Count 154 394 548 % within Parental knowledge of marijuana use
28.1% 71.9% 100.0%
No
% within Completion Status
65.5% 85.7% 78.8%
Yes Count 81 66 147 % within Parental knowledge of marijuana use
55.1% 44.9% 100.0%
Parental knowledge of marijuana use(a)
% within Completion Status
34.5% 14.3% 21.2%
Total Count 235 460 695
70
% within Parental knowledge of marijuana use
33.8% 66.2% 100.0%
a. 618 missing cases Table 64 – Completion Status and Parental Knowledge of Hard Drug Use Crosstabulation
Completion Status
Unsuccessful completion
Successful completion Total
Count 218 451 669 % within Parental knowledge of hard drug use
32.6% 67.4% 100.0%
No
% within Completion Status
92.8% 97.8% 96.1%
Yes Count 17 10 27 % within Parental knowledge of hard drug use
63.0% 37.0% 100.0%
Parental knowledge of hard drug use(a)
% within Completion Status
7.2% 2.2% 3.9%
Total Count 235 461 696
% within Parental knowledge of hard drug use
33.8% 66.2% 100.0%
a. 617 missing cases
The one statistical outcome that seems counterintuitive is the relationship
between parental knowledge of the juvenile’s involvement in selling drugs and their
completion of the program. For the seven parents who reported knowledge of their
child’s involvement in drug sales, 85.7% of the participants successfully completed the
program. Only 66.5% of the juveniles whose parents reported no knowledge of drug
selling involvement successfully completed the program, which is almost equal to the
overall 66/34% split of successful/unsuccessful completion of the program without
variable consideration (see Table 65). Considering the small number and the
71
contradiction of logic that arises from the increased success rate correlated with
involvement in drug sales the possibility of a statistical anomaly must be considered.
Table 65 – Completion Status and Parental Knowledge of Involvement in Drug Sales Crosstabulation
Completion Status
Unsuccessful completion
Successful completion Total
Count 254 504 758 % within Parental knowledge of juvenile involvement in selling drugs
33.5% 66.5% 100.0%
No
% within Completion Status
99.6% 98.8% 99.1%
Yes Count 1 6 7 % within Parental knowledge of juvenile involvement in selling drugs
14.3% 85.7% 100.0%
Parental knowledge of juvenile involvement in selling drugs(a)
% within Completion Status .4% 1.2% .9%
Total Count 255 510 765
% within Parental knowledge of juvenile involvement in selling drugs
33.3% 66.7% 100.0%
a. 548 missing cases Those juveniles who reported any abuse, emotional abuse, or physical abuse all
had successful completion rates similar to those juveniles who did not report a history of
abuse (see Table 66, 67, 68). The exception was those cases where the juvenile
reported being the victim of sexual abuse. Those juveniles who reported past sexual
abuse only completed the program in 55.6% of the cases whereas those who had not
been abused completed the program with a success rate of 71.6% (see Table 69).
Table 66 – Completion Status and Juvenile Reported Abuse Crosstabulation
72
Completion Status
Unsuccessful completion
Successful completion Total
Count 392 767 1159 % within Juvenile reported any abuse
33.8% 66.2% 100.0%
No
% within Completion Status
88.5% 88.2% 88.3%
Yes Count 51 103 154 % within Juvenile reported any abuse
33.1% 66.9% 100.0%
Juvenile reported any abuse
% within Completion Status
11.5% 11.8% 11.7%
Count 443 870 1313
Total
% within Juvenile reported any abuse
33.7% 66.3% 100.0%
Table 67 – Completion Status and Juvenile Reported Emotional Abuse Crosstabulation
Completion Status
Unsuccessful completion
Successful completion Total
Count 13 24 37% within Juvenile reported emotional abuse
35.1% 64.9% 100.0%
No
% within Completion Status
25.5% 23.3% 24.0%
Yes Count 38 79 117% within Juvenile reported emotional abuse
32.5% 67.5% 100.0%
Juvenile reported emotional abuse
% within Completion Status
74.5% 76.7% 76.0%
Total Count 51 103 154
% within Juvenile reported emotional abuse
33.1% 66.9% 100.0%
Table 68 – Completion Status and Juvenile Reported Physical Abuse Crosstabulation
Completion Status
Unsuccessful completion
Successful completion Total
Juvenile reported No Count 30 59 89
73
% within Juvenile reported physical abuse
33.7% 66.3% 100.0%
% within Completion Status
58.8% 57.3% 57.8%
Yes Count 21 44 65% within Juvenile reported physical abuse
32.3% 67.7% 100.0%
physical abuse(a)
% within Completion Status
41.2% 42.7% 42.2%
Total Count 51 103 154
% within Juvenile reported physical abuse
33.1% 66.9% 100.0%
Table 69 – Completion Status and Juvenile Reported Sexual Abuse Crosstabulation
Completion Status
Unsuccessful completion
Successful completion Total
Count 31 78 109% within Juvenile reported sexual abuse
28.4% 71.6% 100.0%
No
% within Completion Status
60.8% 75.7% 70.8%
Yes Count 20 25 45% within Juvenile reported sexual abuse
44.4% 55.6% 100.0%
Juvenile reported sexual abuse(a)
% within Completion Status
39.2% 24.3% 29.2%
Total Count 51 103 154
% within Juvenile reported sexual abuse
33.1% 66.9% 100.0%
Upon examining juvenile contact with the police through the variables of picked
up and arrested by the police it is apparent that a history of a juvenile engaging in
behavior that leads to police involvement has a detrimental effect on the juvenile
completing the program successfully. For both police pick ups and arrests, as contact
with the police increased the completion success rate decreased. Juveniles who had
never been picked up by the police completed the program with a 70.9% success rate
74
as compared to the 50.0% success rate for those juveniles who had been picked up
multiple times (see Table 70 ). Similarly, 72.0% of the juveniles with no arrest history
completed the program while only 41.4% of those who had multiple arrests were able to
finish successfully (see Table 71).
Table 70 – Completion Status and Juvenile Has Been Picked Up By Police Crosstabulation
Completion Status
Unsuccessful
completion Successful completion Total
Count 145 354 499% within Juvenile Has Been Picked Up By Police (collapsed catagories)
29.1% 70.9% 100.0%
Never Picked Up
% within Completion Status 54.9% 66.3% 62.5%
Picked Up Once Count 83 144 227% within Juvenile Has Been Picked Up By Police (collapsed catagories)
36.6% 63.4% 100.0%
% within Completion Status 31.4% 27.0% 28.4%
Multiple Times Picked Up
Count 36 36 72
% within Juvenile Has Been Picked Up By Police (collapsed catagories)
50.0% 50.0% 100.0%
Juvenile Has Been Picked Up By Police (collapsed catagories)(a)
% within Completion Status 13.6% 6.7% 9.0%
Total Count 264 534 798
% within Juvenile Has Been Picked Up By Police (collapsed catagories)
33.1% 66.9% 100.0%
a. 515 missing cases Table 71 – Completion Status and Juvenile Has Been Arrested Crosstabulation
Completion Status
Unsuccessful completion
Successful completion Total
75
Count 134 345 479 % within Juvenile Has Been Arrested (collapsed categories)
28.0% 72.0% 100.0%
Never Arrested
% within Completion Status
65.4% 79.7% 75.1%
One Arrest Count 54 76 130 % within Juvenile Has Been Arrested (collapsed categories)
41.5% 58.5% 100.0%
% within Completion Status
26.3% 17.6% 20.4%
Multiple Arrests Count 17 12 29
% within Juvenile Has Been Arrested (collapsed categories)
58.6% 41.4% 100.0%
Juvenile Has Been Arrested(a)
% within Completion Status
8.3% 2.8% 4.5%
Total Count 205 433 638
% within Juvenile Has Been Arrested (collapsed categories)
32.1% 67.9% 100.0%
a. 675 missing cases Involvement is gang related activity also set the participants at a disadvantage for
successful completion of the program. Those juveniles who were reportedly involved in
a gang by their parents had a successful completion rate of 41.2%. Those who were
not involved in gang related activity, according to their parents, completed the program
at a rate of 68.2% (see Table 72).
Table 72 – Completion Status and Parent Reported Gang Involvement Crosstabulation
Completion Status
Unsuccessful completion
Successful completion Total
Gang Related No Count 229 490 719
76
% within Gang Related Activity
31.8% 68.2% 100.0%
% within Completion Status
88.4% 95.9% 93.4%
Yes Count 30 21 51 % within Gang Related Activity
58.8% 41.2% 100.0%
Activity(a)
% within Completion Status
11.6% 4.1% 6.6%
Total Count 259 511 770
% within Gang Related Activity
33.6% 66.4% 100.0%
a. 543 missing cases A good indicator of successful completion was employment on the part of the
participant. Those juveniles who had jobs completed the program in 75.9% of the cases
as opposed to 66.5% completion by those juveniles who did not have a job (see Table
73). Conversely, being previously fired from a job decreased the chances of successful
completion to 58.6% in comparison to those who had never been fired that completed
the program at a rate of 68.3% (see Table 74).
Table 73 – Completion Status and Juvenile is Employed Crosstabulation
Completion Status
Unsuccessful completion
Successful completion Total
Count 272 540 812% within Juvenile is currently employed
33.5% 66.5% 100.0%
No
% within Completion Status
92.8% 89.1% 90.3%
Yes Count 21 66 87% within Juvenile is currently employed
24.1% 75.9% 100.0%
Juvenile is currently employed(a)
% within Completion Status
7.2% 10.9% 9.7%
Total Count 293 606 899
% within Juvenile is currently 32.6% 67.4% 100.0%
77
employed a. 414 missing cases Table 74 – Completion Status and Juvenile Has Been Fired From a Job Crosstabulation
Completion Status
Unsuccessful completion
Successful completion Total
Count 172 370 542% within Juvenile has been fired from job
31.7% 68.3% 100.0%
No
% within Completion Status
93.5% 95.6% 94.9%
Yes Count 12 17 29% within Juvenile has been fired from job
41.4% 58.6% 100.0%
Juvenile has been fired from job(a)
% within Completion Status
6.5% 4.4% 5.1%
Total Count 184 387 571
% within Juvenile has been fired from job
32.2% 67.8% 100.0%
a. 742 missing cases Previous participation in counseling or treatment produced only a marginal
difference in the outcome of completion of the Truancy Center’s requirements. Those
who had been involved in counseling prior to their referral were only slightly less likely to
complete the program successfully (see Table 75).
Table 75 – Completion Status and Juvenile Counseling/Treatment Crosstabulation
Completion Status Total
Unsuccessful completion
Successful completion
Counseling/Treatment(a) No Count 163 350 513 % within
Counseling/Treatment 31.8% 68.2% 100.0%
% within Completion Status 65.5% 72.2% 69.9%
Yes Count 86 135 221 % within
Counseling/Treatment 38.9% 61.1% 100.0%
% within Completion Status 34.5% 27.8% 30.1%
Total Count 249 485 734
78
% within Counseling/Treatment 33.9% 66.1% 100.0%
a. 579 missing cases
Summary of Variables That Indicate a Change in Successful Completion of Truancy
Center Program Requirements
In lieu of the logistic regression results, it is important to examine those variables
that suggest a positive or negative effect on the participants’ ability to successfully
complete the program. This section will present those variables that produced results
based on the crosstabulation results for successful completion that differed from the
baseline success rate of 66.3%. Variables existed within the analysis that produced a
positive result by substantially increasing the rate at which participants completed the
program beyond the baseline percentage. On the other side, variables also produced a
negative result by considerably lowering the rate of successful completion below 66.3%.
Without testing for significance, the standard change that will be considered significant
by the researcher in this study will be a change in success rate of 8.0% or more in either
direction. Those difference caused by such variables is an important indicator of those
factors that lead to or take away from the probability of successful completion in the
absence of the logistic regression results originally intended (see Table 76).
Table 76 - Variables Values Which Produced Significant Difference from Baseline Successful Completion Percentage
Variable Name and Response
Percentage of Successful Completion
Baseline Percentage of Successful Completion
Difference from Baseline Percentage
of Completion Previous Dallas Challenge referral 41.7% 66.3% - 23.6%
Caucasian males 85.7% 66.3% + 19.4% African American females 56.7% 66.3% - 9.6% Juvenile lives with father and stepmother 81.0% 66.3% + 14.7%
Juvenile lives with stepfather and stepmother 77.8% 66.3% + 11.5%
79
Juvenile reported sexual abuse 55.6% 66.3% - 10.7%
Juvenile has used hard drugs 48.1% 66.3% - 18.2%
Juvenile is involved in gang related activity 41.2% 66.3% - 25.1%
Juvenile has been suspended/expelled Yes 68.3% 55.6% 12.7%
Parent has been called to school for juvenile behavior Yes 75.9% 62.3% 13.6%
Juvenile has a learning disability Yes 32.7% 22.0% 10.7%
Juvenile is in special education classes Yes 20.8% 14.5% 6.3%
Juvenile has failed a grade in school
Yes (one or multiple grades) 23.3% 24.2% .9%
Juvenile is involved in extra-curricular activities Yes 48.5% 53.2% 4.7%
Parental marital status Married 42.8% 48.2% 5.4% Parent employment status Employed 80.5% 84.8% 4.3% Parent’s spouse employment status Employed 48.8% 56.0% 7.2%
Number of children in household 3.17 3.17 0.0
Age eligible children in school Yes 95.4% 96.1% .7% Family medical insurance Yes 40.6% 38.4% 2.2% Family member with criminal involvement/arrest Yes 28.8% 28.1% .7%
Juvenile nicotine use Yes 17.8% 13.3% 4.5% Age of first nicotine use 12.29 years 12.72 years .43 years Juvenile alcohol use Yes 20.8% 16.1% 4.7% Age of first alcohol use 12.14 years 12.42 years .28 years Parental knowledge of alcohol use Yes 18.9% 8.6% 10.3%
Juvenile marijuana use Yes 19.2% 14.0% 5.2% Age of first marijuana use 12.36 years 12.47 years .11 years Parental knowledge of marijuana use Yes 34.5% 14.3% 20.2%
Juvenile hard drug use Yes 6.3% 3.0% 3.3% Age of first hard drug use 13.07 years 13.23 years .16 years Parental knowledge of hard drug use Yes 7.2% 2.2% 5.0%
Parental knowledge of involvement in drug sales Yes .4% 1.2% .8%