“Truck Dealer Digest” is published monthly by Americas Commercial Transportation Research Company, LLC (ACT), 4400 Ray Boll Blvd., Columbus, IN 47203. Phone: 812-379-2085, Fax: 812-378-5997, e-mail: [email protected]Copyright 2016 by ACT with all rights reserved. Reproduction, copying, or publication of this report in whole or part is not permitted without prior approval. This document is for internal use only. Questions and subscription requests should be directed to K.W . Vieth, Publisher. www.actresearch.net ACT For Hire Trucking Index April 2016 Volumes 46.3 ▼ Freight Rates 48.1 ▲ ACT CL8 Used Truck Database June 2016 Prelim Units Sales (m/m) -1% ▼ Avg Sales Price (m/m) -1% ▼ April 2016 Data Published May 18, 2016 Americas Commercial Transportation Research Co., LLC • www.actresearch.net Truck Dealer Digest Transportation Trends, Equipment Markets & the Economy Contributor to Blue Chip Economic Indicators and WSJ Economic Forecast Panel
Transcript
“Truck Dealer Digest” is published monthly by Americas Commercial Transportation Research Company, LLC (ACT), 4400 Ray Boll B lvd., Columbus, IN 47203. Phone: 812-379-2085,
Fax: 812-378-5997, e-mail: [email protected] Copyright 2016 by ACT with all rights reserved. Reproduction, copying, or pub lication of this report in whole or part is not permitted
without prior approval. This document is for internal use only. Questions and subscription requests should be directed to K.W . Vieth, Publisher. www.actresearch.net
ACT For Hire Trucking Index April 2016
Volumes 46.3 ▼
Freight Rates 48.1 ▲
ACT CL8 Used Truck Database June 2016 Prelim
Units Sales (m/m) -1% ▼
Avg Sales Price (m/m) -1% ▼
April 2016 Data
Published May 18, 2016
Americas Commercial Transportation Research Co., LLC • www.actresearch.net
Truck Dealer Digest
Transportation Trends, Equipment Markets & the Economy Contributor to Blue Chip Economic Indicators
Forecast Tables ............................................................................................................... 4 U.S. and Canada Classes 5-7 and Class 8 Retail Sales
New Class 8 Truck Trends ............................................................................................ 12 New Medium Duty Truck Trends .................................................................................. 13
Used Truck Trends ........................................................................................................ 14
New Trailer Trends ......................................................................................................... 15
Appendices:
Used Trucks ....................................................................................................... 16-18
Energy Prices ..................................................................................................... 25-26
May 2016 • Truck Dealer Digest
FORECAST SUMMARY
May 2016 • Truck Dealer Digest • Page 1
FORECAST CHANGES: The biggest forecast change this month was to 2016 GDP, which when adjusted for Q1 actuals and lowered expectations for the industrial economy fell 40 bps to 1.5%. Other than some truck-tractor mix-shift tweaking of the Class 8 market and a hit to expectations for flatbed trailers, topline commercial vehicle fore-casts for build and sales/shipment data were largely unchanged in this month’s report.
Forecast Watch: Weak Class 8 orders in April accelerated the backlog burn rate above what is currently baked into the forecast. This raises the specter of a weaker 2017 starting point (backlog & build), and low-er full-year production. Staying our hand on the ax were “above re-quirement” orders through Q1 and an incomplete view of April metrics: A sharp drop in new orders, or a cancellation spike on front-side met-rics, as well as whether backside progress on inventories and sales continued.
ECONOMY: In addition to the pullback to 1.5% GDP growth in 2016, the 2017 forecast was tweaked 10bps lower to 2.3%. The Blue Chip Consensus GDP forecast for this year slipped 20bps to 1.8%, while the 2017 forecast remained unchanged at 2.3%.
As has been the case since the global commodity bubble burst in 2H’14, the U.S. economy is a decidedly two-speed affair, with a bub-ble-less consumer sector continuing to grow at a reasonably healthy rate, even as manufacturing remains weak. Problematically, the man-ufacturing/industrial sector punches well above its weight in terms of heavy vehicle freight creation. To that end, ACT’s freight composite is projected to grow just 1.3% in 2016, 10bps above our expectation for productivity growth this year, netting freight growth of just 0.1% (graph on next page).
Looking further afield, there does not appear to be a ticking clock on the end of the current cycle, which will become the third longest in U.S. history by year’s end. While one would assume that there would be a recession sometime in the next five years, barring an exogenous event, there is no obvious trigger presently. As food for thought, after the industrial sector cycled in mid-1995, the economy went another five-plus years before the start of the 2001 recession. If current expec-tations become reality, by mid-2019 this will become the longest eco-nomic expansion in U.S. history.
FREIGHT METRICS: After some surprisingly strong data points from the ATA marking sharp upticks in tonnage and loads in February, those indices moderated in March, returning freight-related indicators to universally soft levels. Soft readings have characterized freight re-lated data since 2H’15.
ACT For-Hire Survey (Mar.): The freight index was barely positive (51), the first trip above the 50-mark since August. Positively, the capacity index continued to slow (52). March was the 14th time in 16 months that capacity rose faster than freight.
DAT (April): Spreads between spot and contract rates remained wide in April, signaling no change in the supply-demand relation-ship between trucks and freight. At 3.0 SA, DAT’s load to truck ra-tio (ACT aggregate) remain depressed (4.5 avg.), underscoring the capacity relative to freight imbalance.
ATA (Mar.): Tonnage, +2.2% y/y, and TL loads at +0.6 came more into line with trend following high-side surprises in March.
ISM Index (Mar.): Second consecutive above 50 reading suggests economy is overlapping year-ago weakness. But at 51, there’s no suggestion of growth. Positive: best back-back order component readings, 57.1 avg., since late 2014.
May 2016 • Truck Dealer Digest • Page 2
FORECAST SUMMARY
CLASS 8: At the heart of current market weakness, Class 8 capaci-ty grew substantively faster than freight in 2015. In addition to the econ-omy adding virtually nothing to freight volumes after Q1’15 in a period of strong sales, the industry, preparing for a robust freight year, saw deal-ers add meaningfully to stocking levels. The need to rebalance Class 8 inventories is driving production nearly 20,000 units below sales in 2016. With inventories worked-off, production in 2017 should mirror the level of sales.
Looking further afield, we believe conditions are in place for robust, reg-ulation-assisted Class 8 demand into the end of the decade, followed by a sharp fall-off in 2021.
ACT estimates the FMCSA’s ELD regulation will effectively remove ~3.5% of U.S. tractor fleet capacity in 2017-2018 by eliminating HOS cheating. That sets the stage for a quicker rebalancing of supply and demand leading to an earlier rebound in fleet profits. The risk to this assumption is litigation filed by OOIDA. No ELD capacity take-out means fleet overcapacity lingers, delaying the anticipated demand rebound.
With ELDs eliminating excess capacity, healthier carrier profits, cou-pled with an underlying trade-cycle of 2014-2015 units, should drive markets upward into 2019-2020.
The likelihood that GHG2 scheduled in 2021 comes with a high price and long period to payback drives a demand pull-forward into 2020 and a payback period and delay in 2021. (Note that 2021 require-ments have not yet been finalized by EPA and NHTSA.)
NA C8 BU 188228248194224267333252146181182269339376212206118154255278246297323237245275291327199
ACTUAL BUILD
10 Yr Avg.
FORECAST
May 2016 • Truck Dealer Digest • Page 3
FORECAST SUMMARY
CLASSES 5-7: With several months of better than expected activity in hand, we have bumped up our 2016 production and retail sales fore-casts. Production in 2016 is still expected to outpace sales, adding mod-estly to inventory that is well within the target range. Beginning in 2017, sales and production much more closely parallel each other, with an an-nual average growth rate through 2021 of 2.1% and 2.6%, respectively.
TRAILERS: Ongoing strongly positive demand from the market’s two biggest volume segments, dry and reefer vans, continues to propel the trailer industry. This is a nice counterpoint to the fall-off in Class 8 as carriers focus capex on trailer fleet upgrades. Through Q1, production and shipments continued to run above forecast levels for van-type trail-ers.
While the general freight end of the market is resilient, demand levels are not universal across segments. Even as dry and reefer van BL/BU ratios remained around 8 months, and dump and liquid tank BL/BUs were holding above 4 months, the other 6 trailer categories, including the higher-volume flatbed market, have BL/BUs at or below 3 months.
Owing to a paucity of late-model equipment, healthy used values are buttressing current high demand levels and supporting trades. A key in-dicator of changing trailer market fortunes will be softening used trailer prices. To that end, while the forecast paints a relatively tranquil demand picture, we know that when the turn comes, it is unlikely to be shallow or slow.
HIGHLIGHTS & COMMENTARY TRANSPORTATION Participants of our proprietary ACT For-Hire Trucking Survey report-ed freight volumes degraded to an index reading of 46.3, the lowest reading since January and the lowest April since we began this survey.
The pricing index recovered a bit in April, after sinking to a new low in March, but at 48.1, it was still the lowest April reading since the survey began. Thirty percent of responding fleets saw a decrease in their reve-nue per mile.
Even as freight volumes and rates remained weak, the capacity index once again showed growth; although the majority of responding fleets had no change in their tractor or trailer counts, just over 22% of the fleets reported a modest increase in their number of tractors and 20% had a modest increase in their trailer count.
Sixty-seven percent of the responding fleets said they intend to acquire equipment in the next three months. Slightly more fleets intend to buy tractors than trailers. A large majority of the purchases will be new equipment; the purchases will be fairly evenly divided between replace-ment and additional equipment. (Pages 2-4)
The March ATA For-Hire Truck Tonnage Index posted a 4.5% se-quential decline, offsetting most of the surprising 7+% February surge. The index was up 2.2% y/y. With the assistance of that February spike, ytd volume is up 3.9% versus the same time last year. ATA Chief Economist Bob Costello noted that “tonnage came back to earth in March,” remarking that easing was “expected” following February’s all-
time record. (Page 5)
DAT Trendlines reported dry van spot rates continued to slide in April, although the y/y comps may have pulled out of their nosedive. Dry van contract rates have now entered negative y/y comp territory.
(Page 5)
The ACT Research Publicly Traded Truckload Carrier Database is de-veloped using financial reporting from the publicly traded truckload car-riers. Our preliminary Q1’16 database shows operating revenue was down 7.6% q/q, but up 4.3% y/y. Fuel surcharge revenue was off al-
most 30% q/q. (Page 6)
Rail volume continues to suffer; the AAR reported total rail traffic off 6.5% in Q1’16 versus the same quarter last year. Intermodal was
the only bright spot, with Q1 volume up 1.5% y/y. (Pages 7, 16)
EQUIPMENT U.S. Class 8 ytd retail sales are off 2%, as the March 26% m/m gain helped offset a weak January and February. Inventory still re-mains troublesome; while noticeably lower than Q4’15 peaks, there
were still 8% more vehicles in stock than at this time last year. (Page 8)
The March results of the U.S. Medium Duty Truck market rivaled those of February’s banner month. Backlog for U.S. Classes 5 to 7 have to-taled just over 46k through March, off 15% from the same period last
year. (Page 9) NOTE! New market segment coverage
Class 8 Used Truck same dealer sales volumes continued their upward trek in March, following a significant recovery last month from January’s low. March used Class 8 volumes rose by 8% month-over-
month. (Pages 10, 12-14)
The 2015/16 Trailer order season is now closed, ending on a very lack-luster note. Cancellations increased sequentially in March, but the moves were mostly one-off adjustments to existing commitments rather
than the start of any wholesale shift in fleet psyche. (Page 11)
ECONOMY The U.S. economy barely advanced in the opening quarter of 2016. That is what is implied, perhaps misleadingly, by the +0.5% rise in real GDP. History suggests that the initial Q1 estimate will be revised up-ward in the forthcoming two revisions or the more comprehensive July 29th benchmark re-estimations. A broader view of the economy sug-gests that activity is advancing at a moderate rate, not substantially different from the approximate 2% pace of the past five years.
In 2016, we expect real GDP growth to rise by just under 2% and to accelerate to 2.3% in 2017. Furthermore, we consider the probability of
a recession in the near-term to be low. (Pages 17-20)
May 2016 • Truck Dealer Digest • Page 5
VOLUME INDEX: Volumes degraded to an index of 46.3, the low-est reading since January and the lowest April reading since we began this survey. Seventy-two percent of responding fleets said that freight was still soft. “Complete lack of seasonal surge in April. Load counts the same as February,” said one fleet. Said another, “The shippers that usually provide us with an uptick in freight in the spring and early sum-mer are running soft this year.”
Two fleets used the word “scary” to describe conditions: “This economy is getting scary bad. We haul frozen and perishable food and you would think the whole country decided to go on a diet at the same time.” The news is not all bad: 8% of responding fleets said they saw signs of improving freight conditions. “Very spotty,” said one. “Seeing some areas pick up and some drop off.”
PRICING INDEX: The pricing index recovered a bit in April, after sinking to a new low in March, but at 48.1, it was still the lowest April reading since the survey began. Thirty percent of responding fleets saw a decrease in their revenue per mile. Said one fleet, “Customers aren’t honoring contracts. [They are] taking contracted lanes to bid. Rates are dictating relationships; no loyalty to current carrier base!”
Another fleet said, “We find freight is plentiful, but at rates that are piti-ful.” Added another, “We have a backlog of freight for the first time this year on our yard. I don’t know when that will convert to firmer rates, but I hope soon!”
HOW TO INTERPRET THE ACT FOR-HIRE TRUCKING INDEX: The index is based on a survey of various sized carriers that measures degree and
directional changes in selected metrics. It is a diffusion index, meaning readings
above 50 show improvement and readings below 50, degradation.
May 2016 • Truck Dealer Digest • Page 6
ACT FOR-HIRE TRUCKING SURVEY
ACT For-Hire Trucking Index
Volumes
January '10 - April '16
ACT Research Co., LLC: Copyright 2016
'10 '11 '12 '13 '14 '15 16
30
35
40
45
50
55
60
65
70
75
80
85Index
0
5
10
15
20
25
30
35
-5
-10
-15
-20
Growing
Contracting
ACT For-Hire Trucking Index
Freight Rates
January '10 - April '16
ACT Research Co., LLC: Copyright 2016
'10 '11 '12 '13 '14 '15 16
35
40
45
50
55
60
65
70
75
80Index
0
5
10
15
20
25
30
-5
-10
-15
Growing
Contracting
CAPACITY INDEX: Even as freight volumes and rates remained weak, the capacity index once again showed growth, with an index of 53.8. Although the majority of responding fleets had no change in their tractor or trailer counts, just over 22% of the fleets reported a modest increase in their number of tractors and 20% had a modest increase in their trailer count. The majority of the fleets that added tractors were “mega” fleets, i.e. fleets with more than 1,001 tractors.
Said one fleet, “Getting additional drivers is and will be the most limit-ing factor in growing our fleet.” Another fleet noted that the percentage of driver turnover has decreased significantly compared to the last two years.
PRODUCTIVITY INDEX (miles/tractor): After improving slightly in March, the productivity index again dropped below 50. It was the low-est reading for April since the survey began. Thirty-seven percent of responding fleets reported a decrease in their average miles per trac-tor; 43% reported no change and the remaining 20% saw an increase in April.
HOW TO INTERPRET THE ACT FOR-HIRE TRUCKING INDEX: The index is based on a survey of various sized carriers that measures degree and
directional changes in selected metrics. It is a diffusion index, meaning readings
above 50 show improvement and readings below 50, degradation.
May 2016 • Truck Dealer Digest • Page 7
ACT FOR-HIRE TRUCKING SURVEY
ACT For-Hire Trucking Index
Fleet Capacity
January '10 - April '16
ACT Research Co., LLC: Copyright 2016
'10 '11 '12 '13 '14 '15 16
35
40
45
50
55
60
65Index
0
5
10
15
-5
-10
-15
Growing
Contracting
ACT For-Hire Trucking Index
Productivity
January '10 - April '16
ACT Research Co., LLC: Copyright 2016
'10 '11 '12 '13 '14 '15 16
30
35
40
45
50
55
60
65
70
75Index
0
5
10
15
20
25
-5
-10
-15
-20
Growing
Contracting
FLEET PURCHASE INTENTIONS: Sixty-seven percent of the re-sponding fleets said they intend to buy tractors or trailers in the next three months. Slightly more fleets intend to buy tractors than trailers. A large majority of the purchases will be new equipment; the purchases will be fairly evenly divided between replacement and additional equip-ment, with slightly more of the tractors as additions and slightly more of the trailers as replacements.
SUPPLY-DEMAND BALANCE: For an eighth consecutive month the fleet capacity index has risen faster than the freight index. In fact, in the past year, only once has the reverse been true. Widespread in-ventory overhang in this economy continues to be a problem, although one fleet noted that inbound bulk material seems to be picking up as inventories begin to drop.
Said a responding fleet, “There has been a slight increase in the vol-ume of freight, but the market is still considered weak.”
HOW TO INTERPRET THE ACT FOR-HIRE TRUCKING INDEX: The index is based on a survey of various sized carriers that measures degree and
directional changes in selected metrics. It is a diffusion index, meaning readings
above 50 show improvement and readings below 50, degradation.
May 2016 • Truck Dealer Digest • Page 8
ACT FOR-HIRE TRUCKING SURVEY
ACT For-Hire Trucking Index
% Respondents Buying Equipment in Next 3 Months
January '10 - April '16
ACT Research Co., LLC: Copyright 2016
'10 '11 '12 '13 '14 '15 16
15
25
35
45
55
65
75
85Index
ACT For-Hire Trucking Survey
Supply-Demand Balance
Capacity (Supply) Index Less Freight (Demand) Index
January '10 - April '16
ACT Research Co., LLC: Copyright 2016
J M M J S N J M M J S N J M M J S N J M M J S N J M M J S N J M M J S N J M M J S N'10 '11 '12 '13 '14 '15 '16
35
40
45
50
55
60
65
70
75Index
0
5
10
15
20
25
-5
-10
-15
Improving
Deteriorating
TRUCKING SECTOR TRENDS
ATA TONNAGE INDEX: The March ATA measure posted a 4.5% sequential decline, offsetting most of the surprising 7+% February surge. The index was up 2.2% y/y. With the assistance of that Febru-ary spike, ytd volume is up 3.9% versus the same time last year. ATA Chief Economist Bob Costello noted that “tonnage came back to earth in March,” remarking that easing was “expected” following February’s all-time record. He noted that the overall market continues to be mixed; support came from housing and consumer spending, while new frac’ing activity and factory output depressed totals. The reoccurring theme of inventory overhang and its dampening impact on freight vol-umes was also noted.
DAT TRENDLINES: Dry van spot rates continued to slide in April, although the y/y comps may have pulled out of their nosedive. Dry van contract rates have now entered negative y/y comp territory. Overca-pacity has impacted spot rates since mid’15; that is now beginning to spill into contract business. Indications are that re-bidding of existing contracts is occurring; shippers are rushing to take advantage of the favorable market dynamics.
May 2016 • Truck Dealer Digest • Page 9
ATA SA Truck Tonnage IndexJanuary '10 - March '16
Source: American Trucking Associations, ACT Research Co., LLC: Copyright 2016
10 11 12 13 14 15 16
80
90
100
110
120
130
140
150Index
0
5
10
15
20
25
30
35
40
45
50
55
60
-5
-10
Y/Y % Chg
DAT Trendlines: Contract Rates
January '09 - April '16
Source: DAT Solutions, ACT Research Co., LLC: Copyright 2016
PUBLICLY TRADED TRUCKLOAD CARRIERS This database is developed using financial reporting from the publicly traded truckload carriers. Q1’16 preliminary information is now availa-ble.
Operating revenue was down 7.6% q/q, but up 4.3% y/y. Lower fuel prices made their impact known in fuel surcharge revenues; this finan-cial measure was off almost 30% q/q and down almost 46% from the same quarter last year. Total revenue, the combination of operating and fuel surcharge revenue, was down 9.3% from Q4’15 and off a more moderate 1.3% y/y. Q1’16 was the second consecutive quarter posting a negative y/y comp, although results have been noticeably lackluster since Q4’14.
Net income was off 31% q/q and 11% y/y, as fleets posted a 4.72% profit margin for the quarter; that compared to the 6.22% margin of Q4’15 and the 5.22% level of Q1 last year.
While miles per tractor were unchanged from Q4, the $1.88/mile reve-nue level was well below Q4’s $2.12 rate.
Rail volume continues to suffer; the AAR reported total rail traffic off 6.5% in Q1’16 versus the same quarter last year. Intermodal was the only bright spot, with Q1 volume up 1.5% y/y, while conventional car-load traffic was off almost 14% from last year’s opening quarter.
Coal, rails’ largest volume commodity, continues on a dismal path; March 2016 was off almost 36% versus the same month last year. An indication of the dramatic softness in overall rail volumes: total head-count at the rails closed Q1’16 down 11% y/y. On a positive note, headcounts down more than volume indicates improving productivity. Holding that productivity gain when volumes improve would have a quick positive bottom-line impact.
Another positive for the rails are reports that shippers intend to move additional freight to intermodal. Trucking won’t give up that volume without a fight; expect overcapacity in both modes to generate further rate headwinds. Noteworthy in supporting the shippers’ intensions: im-
proved rail service (read: better speed and shorter dwell times).
May 2016 • Truck Dealer Digest • Page 11
N.A. Rail: Coal
4-week moving averageJanuary '10 - April '16
(4/23/2016)
Source: Association of American Railroads, ACT Research Co., LLC: Copyright 2016
10 11 12 13 14 15 16
0
20
40
60
80
100
120
140
160Loads/week (000)
0
20
40
60
80
100
120
-20
-40
Y/Y % Chg
US Rail Carloads
4-week moving averageJanuary '10 - April '16
(4/23/2016)
Source: Association of American Railroads, ACT Research Co., LLC: Copyright 2016
10 11 12 13 14 15 16
100
150
200
250
300
350
400Loads/week (000)
0
5
10
15
20
25
30
35
40
-5
-10
-15
-20
Y/Y % Chg
US Rail: Intermodal
4-week moving averageJanuary '10 - April '16
(4/23/2016)
Source: Association of American Railroads, ACT Research Co., LLC: Copyright 2016
10 11 12 13 14 15 16
50
75
100
125
150
175
200
225
250
275
300Loads/week (000)
0
10
20
30
40
50
60
70
80
-10
-20
Y/Y % Chg
NEW U.S. CLASS 8 TRUCK TRENDS
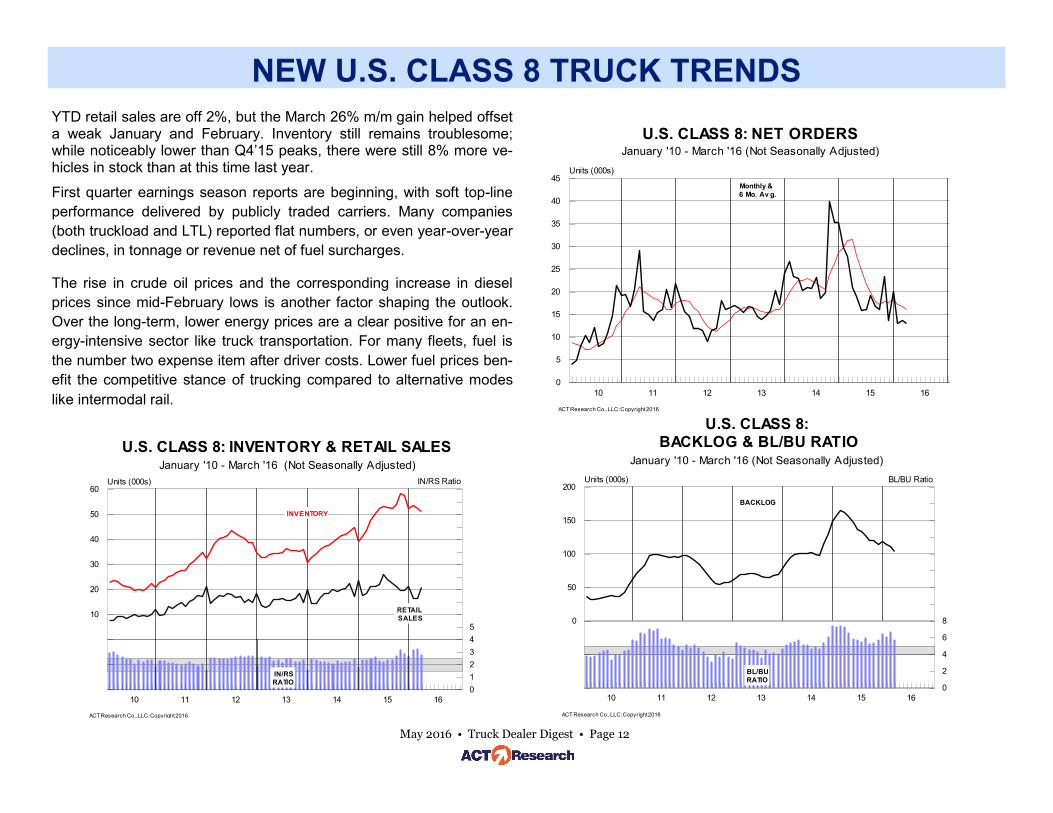
YTD retail sales are off 2%, but the March 26% m/m gain helped offset a weak January and February. Inventory still remains troublesome; while noticeably lower than Q4’15 peaks, there were still 8% more ve-hicles in stock than at this time last year.
First quarter earnings season reports are beginning, with soft top-line
performance delivered by publicly traded carriers. Many companies
(both truckload and LTL) reported flat numbers, or even year-over-year
declines, in tonnage or revenue net of fuel surcharges.
The rise in crude oil prices and the corresponding increase in diesel
prices since mid-February lows is another factor shaping the outlook.
Over the long-term, lower energy prices are a clear positive for an en-
ergy-intensive sector like truck transportation. For many fleets, fuel is
the number two expense item after driver costs. Lower fuel prices ben-
efit the competitive stance of trucking compared to alternative modes
like intermodal rail.
May 2016 • Truck Dealer Digest • Page 12
U.S. CLASS 8: NET ORDERSJanuary '10 - March '16 (Not Seasonally Adjusted)
U.S. CLASS 8: INVENTORY & RETAIL SALESJanuary '10 - March '16 (Not Seasonally Adjusted)
ACT Research Co., LLC: Copyright 2016
10 11 12 13 14 15 16
0
10
20
30
40
50
60
-10
-20
Units (000s)
0
1
2
3
4
5
6
7
8
9
10
11
12
13
14
15
16IN/RS Ratio
INVENTORY
IN/RS
RATIO
RETAIL
SALES
NEW U.S. MEDIUM DUTY TRUCK TRENDS
The March results of the overall medium duty market rivaled those of February’s banner month. The continued progress resulted in a small increase in the production and retail sales forecasts for 2016, borrowed from 2017. The change pushes the peak production year from 2015 to 2016, though the downturn remains small, less than 1%. In the short run, seasonals suggest activity will be mixed in April. As we mentioned last month, given that current market activity is one of the key inputs into the forecasting process, we will continue to closely scrutinize the situation.
Backlog for U.S. Classes 5 to 7 have totaled just over 46k through March, off 15% from the same period last year. YTD net orders are off as well; just over 56k net orders were booked through March, a 4% decline from last year.
This market consists of trucks, school/urban buses, and recreational vehicles and step vans. Through March, trucks were responsible for approximately 71% of the backlog and 74% of the net orders.
May 2016 • Truck Dealer Digest • Page 13
U.S. CLASSES 5-7: NET ORDERS
January '10 - March '16 (Not Seasonally Adjusted)
ACT Research Co., LLC: Copyright 2016
10 11 12 13 14 15 16
0
5
10
15
20
25Units (000s)
Monthly &
6 Mo. Av g.
U.S. CLASSES 5-7: BACKLOG & BL/BU RATIOJanuary '10 - March '16 (Not Seasonally Adjusted)
ACT Research Co., LLC: Copyright 2016
10 11 12 13 14 15 16
0
6
12
18
24
30
36
42
48
54
60Units (000s)
0
1
2
3
4
5
6
7
8
9
10BL/BU Ratio
BACKLOG
BL/BU
RATIO
U.S. CLASSES 5-7: INVENTORY & RETAIL SALESJanuary '10 - March '16 (Not Seasonally Adjusted)
ACT Research Co., LLC: Copyright 2016
10 11 12 13 14 15 16
0
10
20
30
40
50
60
-10
Units (000s)
0
2
4
6
8
10
12
14IN/RS Ratio
INVENTORY
IN/RS
RATIO
RETAIL
SALES
USED TRUCK TRENDS
Class 8 same dealer used truck sales volumes continued their upward trek in March, following a significant recovery last month from Janu-ary’s low. March used Class 8 volumes rose by 8% month-over- month. Despite the short term increase, volumes were down by 2% compared to March of last year, and down 5% year-to-date over 2015.
Dealers continue to report falling used truck values and they believe prices will continue to fall for some time. Used truck inventories are growing at both the OEM and dealer level. Used late model aerody-namic fleet spec’d sleepers are over-supplied, as there is not enough demand to decrease the supply of these used trucks quickly. This is due to the high number of new trucks sold in 2014 and 2015 and the resulting late model aerodynamic sleeper trades.
Some dealers and finance companies are feeling the pinch from lower oil prices and the slowdown in petroleum and natural gas drilling and exploration. Weakening oil prices have slowed growth in the oil and gas patch, putting trucks and day cab tractors out of work in some states.
May 2016 • Truck Dealer Digest • Page 14
CLASS 8: U.S. USED TRUCK AVERAGE SALE PRICEJanuary '09 - March '16
ACT Research Co., LLC: Copyright 2016
09 10 11 12 13 14 15 16
0
10
20
30
40
50
60
-10
Total Reported Price ($000)
0
50
100
150
200
250
300
-50
Y/Y % Change
Y/Y% Chg.
(right axis)
Monthly &
6 Mo. Avg.
CLASS 8: U.S. USED TRUCK AVERAGE SALE PRICE4 to 5 years old, 400-500,000 miles
January '09 - March '16
ACT Research Co., LLC: Copyright 2016
09 10 11 12 13 14 15 16
0
10
20
30
40
50
60
70
80
90
-10
Total Reported Price ($000)
0
50
100
150
200
250
300
350
400
450
-50
Y/Y % Change
Y/Y% Chg.
(right axis)
Monthly &
6 Mo. Avg.
ACT’s USED CLASS 8 SUMMARY – APRIL (P) 2016
TOTAL CLASS 8 UNITS
AVERAGE PRICE
AVERAGE MILES
AVERAGE AGE
MONTH/ MONTH
-1%
-1%
3%
-3%
YEAR/ YEAR
-5%
-14%
-3%
-2%
YTD/ YTD
-5%
-12%
-4%
1%
NEW TRAILER TRENDS
The 2015/16 order season is now closed, ending on a very lackluster note. Fleets’ changing order patterns have been a regular theme here, and the latest order season is a prime example of that shift. Long trail-er lead times encouraged fleets to accelerate their commitments; the continual growth of those fleets only amplifies the trend. The trailer or-der season normally was an October to March event; the past couple of years, September now needs to be included in the analysis to get the correct picture of the market.
Cancellations increased sequentially in March, but the moves were mostly one-off adjustments to existing commitments rather than the start of any wholesale shift in fleet psyche. That’s not to say that the latest quarter’s financial performance, along with continual headwinds from both freight rates and volumes won’t prevent fleets from closely reviewing their equipment acquisitions scheduled over the next few months.
May 2016 • Truck Dealer Digest • Page 15
10 11 12 13 14 15 16
0
5
10
15
20
25
30
35
40
45
-5
-10
-15
-20
Units (000s)
0.0
0.5
1.0
1.5
2.0
2.5
3.0
3.5
4.0
4.5
5.0
5.5
6.0
6.5Trailer:Tractor Ratio
NET ORDER RATIO
U.S. TRAILERS & U.S. CL.8 TRACTORS
3 Month Moving Averages, January '10 - March '16
ACT Research Co., LLC: Copyright 2016
CL. 8
TRACTORS
TRAILERS
TRAILER:TRACTOR
ORDER RATIO (Right Axis)
TRAILER INDUSTRY NET ORDERS
Year Over Year Percent ChangeJanuary '10 - March '16
ACT Research Co., LLC: Copyright 2016
10 11 12 13 14 15 16
0
10
20
30
40
50
60
-10
-20
-30
-40
-50
Units (000s)
0
50
100
150
200
250
300
350
400
450
-50
-100
Y/Y % Change
Y/Y % Change
(Right Axis)
Net Orders
(Left Axis)
TL Carrier Database:TL Carrier Net Incom e (Ex SWFT, UACL) & New US Trailer Orders
Poor y/y comps in March are a combination of the stronger perfor-mance in January and February, combined with some holiday impact
on March operation schedules.
Rail volume continues to suffer; the AAR reported total rail traffic off 6.5% in Q1’16 on a y/y basis. Intermodal was the only bright spot, with volumes up 1.5% y/y and reaching the highest percent of total
loads on record.
May 2016 • Truck Dealer Digest • Page 20
Ports of LA/LB:
Inbound Loaded Containers
January '10 - March '16
ACT Research Co., LLC: Copyright 2016
10 11 12 13 14 15 16
0
100
200
300
400
500
600
700
800
900TEUs (000)
0
10
20
30
40
50
-10
-20
-30
-40
Y/Y % Chg
Intermodal as a Percentage of Total LoadsJanuary '10 - April '16
(4/23/2016)
Source: Association of American Railroads, ACT Research Co., LLC: Copyright 2016
10 11 12 13 14 15 16
34
36
38
40
42
44
46
48
50
52
54IM as % of Total Loads
% Intermodal
10-week ma
Bar
APPENDIX—ECONOMICS
Our outlook for the U.S. economy remains largely unchanged. In 2016, we expect real GDP growth to rise by a moderate 1.9%, with acceleration to 2.4% in 2017. We still consider the probability of a
U.S. recession in the near-term to be relatively minor.
ACT’s freight composite is projected to grow just 1.3% in 2016, 10bps above our expectation for productivity growth this year, netting
freight growth of just 0.1%.
May 2016 • Truck Dealer Digest • Page 21
Real Gross Domestic ProductQ/Q at SAAR Q1'10 - Q4'17
Source: BEA, ACT Research Co., LLC: Copyright 2016
Industrial Production IndexJanuary 2010 - March 2016
Index 2002=100 (SAAR)
Source: Federal Reserve, ACT Research: Copyright 2016
10 11 12 13 14 15 16
0
20
40
60
80
100
120
-20
Index
0
2
4
6
8
10
-2
-4
Y/Y % Chg
APPENDIX—ECONOMICS
Real disposable income rose at a 3.1% pace, a tad faster than the 2.6% pace of earlier months. The longer-term outlook is for continued increases in real disposable income, especially if wages accelerate.
Real disposable income growth, coupled with a high 5.4% savings rate, means consumers have the wherewithal for additional spending
if they so desire. At the moment that desire seems quiescent.
May 2016 • Truck Dealer Digest • Page 23
Real Disposable Personal IncomePercent Change Q/Q at SAAR
Q1'10 - Q1'16
Source: BEA, ACT Research Co., LLC: Copyright 2016
March CPI rose 0.1% (0.9% y/y), after a February drop of 0.2% (1.0% y/y). The movements were primarily due to a swing in energy prices, which fell
6.0% in February but rose 0.9% in March.
Inflation continues to be the major source of movement here; stable unem-ployment rates have had minimal impact.
May 2016 • Truck Dealer Digest • Page 24
Consumer Price Index:
All Items and Core RateJanuary 2010 - March 2016
Source: BLS, ACT Research: Copyright 2016
10 11 12 13 14 15 16
0
1
2
3
4
-1
Y/Y % Chg
All Items Core: LFE a
Misery Index
Inflation Rate + Unemployment RateJanuary 2010 - March 2016
Source: BLS, ACT Research: Copyright 2016
10 11 12 13 14 15 16
5
6
7
8
9
10
11
12
13
14Y/Y % Chg
APPENDIX—ENERGY PRICES
May 2016 • Truck Dealer Digest • Page 25
Assuming that WTI stays largely within the $30 to $45 range, our model suggests that gasoline prices should remain in the $1.90 to $2.50 range. Diesel prices would correspondingly move within the
$2.15 to $2.75 range in 2016.
Crude oil prices continued their upward march. April WTI averaged $40.87, about $2.50 higher than last month and nearly $10 above the January 2016 lows. Early May prices are up an additional $2.
Diesel Fuel & Spot Crude Oil (WTIC) Prices
2010 - 2016 (Week 18)
Source: EIA, ACT Research Co., LLC: Copyright 2016
Source: EIA, ACT Research Co., LLC: Copyright 2016
2010 2011 2012 2013 2014 2015 2016
20
30
40
50
60
70
80
90
100
110
120
130WTIC: $/Bbl.
1.60
1.90
2.20
2.50
2.80
3.10
3.40
3.70
4.00
4.30
4.60
4.90Diesel & Gas: $/Gal.
West Texas Intermediate
Regular Unleaded Gasoline
Bar
APPENDIX—ENERGY PRICES
May 2016 • Truck Dealer Digest • Page 26
Horizontal rig counts have slid to 318, off 55% y/y and down 77% from the Aug’14 activity peak. Higher energy prices will be the only
source of stimulus for energy exploration growth.
Natural gas averaged $2.00 per 1 million BTU in April, approxi-mately $0.60 below last year’s levels. Ample supplies and consid-erably mild weather explain current low prices. Prices are not likely
to rise until late summer.
Spot Natural Gas Prices: Henry Hub
January 2010 - 2016 (Week 17)
Source: EIA, ACT Research Co., LLC: Copyright 2016
2010 2011 2012 2013 2014 2015 2016
0.00
1.00
2.00
3.00
4.00
5.00
6.00
7.00
8.00Wellhead: $/1MBTU
0
200
400
600
800
1,000
1,200
1,400
1,600
Rig Count by Trajectory
Dir. Horz Vert
This page left blank intentionally.
TRUCK DEALER DIGEST
ACT Research Company, LLC 4400 Ray Boll Blvd. Columbus, IN 47203