Page 1
Research Report
UKTRP-85-8
TRUCK DESIGN AND USAGE
RELATED TO
HIGHWAY PAVEMENT PERFORMANCE
by
Robert C. Deen
Director
Herbert F. Southgate
Chief Research Engineer
Gary w. Sharpe
Chief Research Engineer
David L. Allen
Chief Research Engineer
and
Jerry G. Pigman
Chief Research Engineer
Transportation Research Program
University of Kentucky
Lexington, Kentucky
The contents of this report reflect the views of the authors
who are responsible for the facts and the accuracy of the
data presented here.in. The contents do not necessarily
reflect the official views or policies of the University
of Kentucky. The report does not represent a standard,
specification, or regulation.
March 1985
Page 2
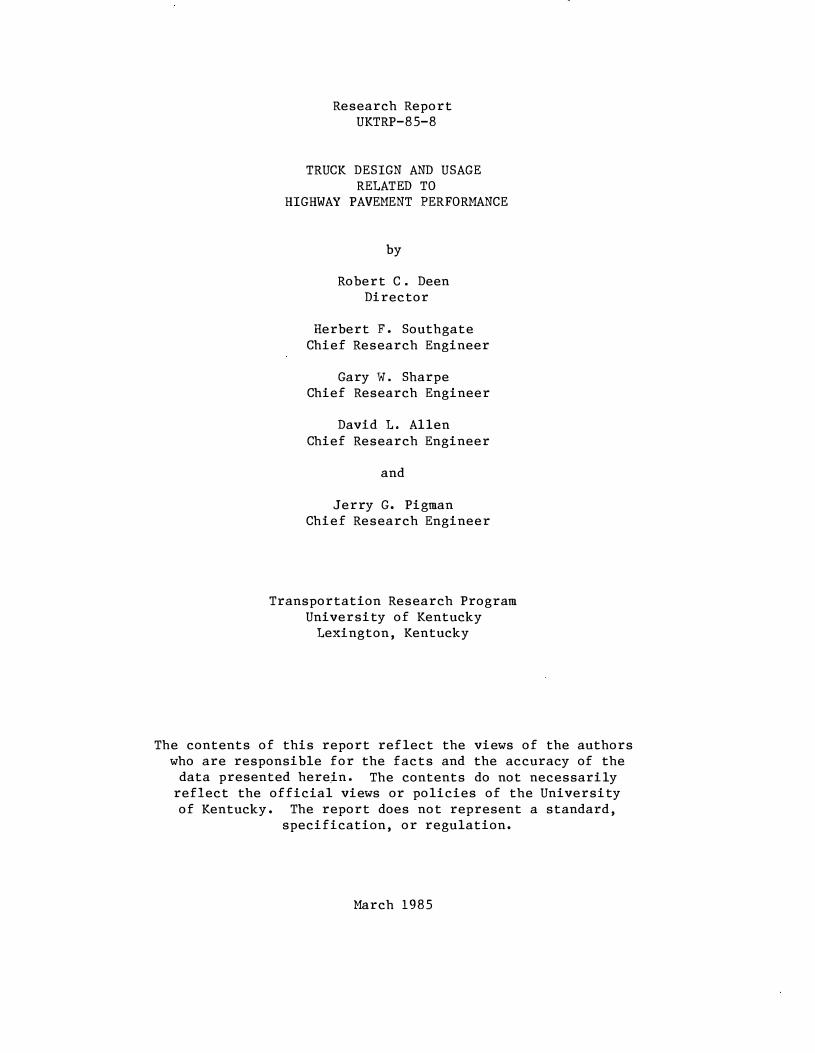
Figure 1. Variation of Damage Factor for Selected Axle Groups as load on Axle Group Is Changed.
Page 3
20
10
2
Figure 2.
INITIAL ·. G.ROSS LOA�Rg�K THE ·.�..E_·.· ··"" .••• '--'------..,.� 0
2 0 40
ADDITIONAL LOAD ON TRUCK (KIPS)
Increase in Damage Factor for Selected Vehicles as Load on Truck Is Increased.
60
Page 4
20F---------------------,---------------------�
16
� 12
1-(.) � IJJ <!> <( :::E <( 0 8
4
Figure 3.
30 50
PAYLOAD (KIPS)
Variation of Damage Factor for Selected Vehicle Types as Payload Is Changed.
90
Page 5
10
5
2
a: 0 1-0 � .5
... (!) <
. 2 ::i < Q
.I
.05
.02
.01 0
Figure 1.
FOUR TIRES SINGLE AXLE
w 40 w 00 TOTAL LOAD ON AXLE GROUP (KIPS)
SIXTEEN TIRES FOUR AXLES
TWENTY TIRES FIVE AXLES
TIRES
100
Variation of Damage Factor for Selected Axle Groups as Load on Axle Group Is Changed.
Page 6
50
20
10 a= 0 1-u Ll!: LLI
5
(!) <( :::E <( 0
2
Figure 2.
INITIAL GROSS LOAD ON THE � TRUCK
0 0 0
I 1 lbil 0 00 00
I I' I� 0 00 000
2 0 4 0 60
ADDITIONAL LOAD ON TRUCK (KIPS)
Increase in Damage Factor for Selected Vehicles as Load on Truck Is Increased.
Page 7
20P---------------------�--------------------�
16
� 12
1-u <t lL. UJ (.!) <t :::E <t 0 8
4
Figure 3.
30 50
PAYLOAD (KIPS) 70
Variation of Damage Factor for Selected Vehicle Types as Payload Is Changed.
90
Page 8
1.0 I-
0.8 I-
- l:-z - 0.6 - I-I I-0.. .,.. w 0 0.4 I-I-::> 0::: I-
0. 2 ....
-
0 80
-- ______ .. __ _
I I I I I
J"1. -{ 13 "Asphaltic Concrete
Subgrade CBR = 7 EAL = 1.0XI07
A
r 8 " Asphaltic Concrete '-- 16" Dense- Graded Aggregate
Subgrade C BR = 7
._ EAL = 8.2 X 10⁶
� .....,
5 112" Dense- Graded Aggregate { 5 112" ••oholtio c'""'"
'-Subgrade CBR = 6 EAL = I.OX 105
I I I I 90 100 110 120
I 130
TIRE PRESSURE (PSI)
I -
� I
-='
j
I -, I I I
-
I I 140 150
Page 9
The 1986 International Conference on Bearing Capacity of Roads and Airfields. September 16th- 18th 1986, Plymouth, England.
TRUCK DESIGN AND USAGE RELATED TO HIGHWAY PAVEMENT PERFORMANCE
R. C. DEEN H. F . SOUTHGATE G. W. SHARPE D. L. ALLEN J. G. PIGMAN
ABSTRACT
TRANSPORTATION RESEARCH PROGRAM UNIVERSITY OF KENTUCKY
LEXINGTON, KENTUCKY UNITED STATES
OF AMERICA
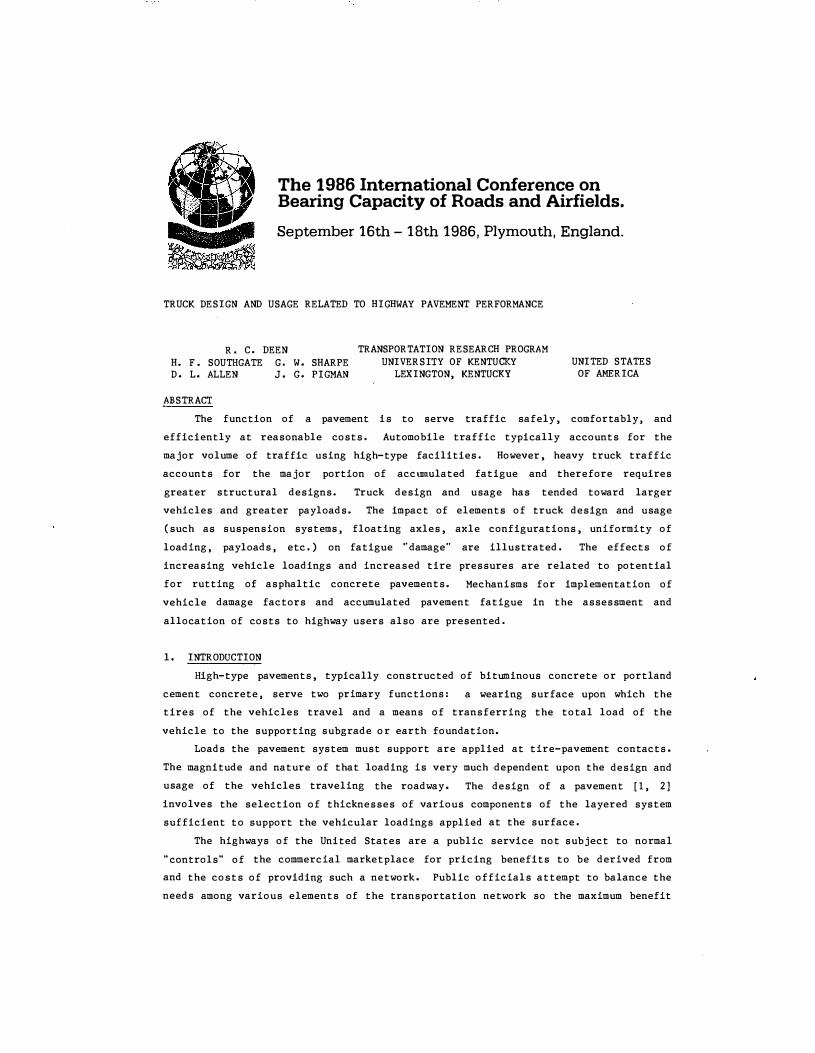
The function of a pavement is to serve traffic safely, comfortably, and
efficiently at reasonable costs. Automobile traffic typically accounts for the
major volume of traffic using high-type facilities. However, heavy truck traffic
accounts for the major portion of accumulated fatigue and therefore requires
greater structural designs. Truck design and usage has tended toward larger
vehicles and greater payloads. The impact of elements of truck design and usage
(such as suspension systems, floating axles, axle configurations, uniformity of
loading, payloads, etc.) on fatigue "damage" are illustrated. The effects of
increasing vehicle loadings and increased tire pressures are related to potential
for rutting of asphaltic concrete pavements. Mechanisms for implementation of
vehicle damage factors and accumulated pavement fatigue in the assessment and
allocation of costs to highway users also are presented.
1. INTRODUCTION
High-type pavements, typically constructed of bituminous concrete or portland
cement concrete, serve two primary functions: a wearing surface upon which the
tires of the vehicles travel and a means of transferring the total load of the
vehicle to the supporting subgrade or earth foundation.
Loads the pavement system must support are applied at tire-pavement contacts.
The magnitude and nature of that loading is very much dependent upon the design and
usage of the vehicles traveling the roadway. The design of a pavement [1, 2]
involves the selection of thicknesses of various components of the layered system
sufficient to support the vehicular loadings applied at the surface.
The highways of the United States are a public service not subject to normal
"controls" of the commercial marketplace for pricing benefits to be derived from
and the costs of providing such a network. Public officials attempt to balance the
needs among various elements of the transportation network so the maximum benefit
Page 10
is obtained from the funds available. Many relationships, are involved -- some are
engineering in nature, others are social and economic. Some relationships are
reasonably well defined, others may be unknown.
readily retrievable so they may be analyzed
relationships developed.
2. TRUCK DESIGN AND USAGE
In other instances, data are not
and necessary and appropriate
The more significant vehicular contributors to the loads on the pavement
system are trucks, the design and usage of which are not within the direct control
of the highway engineer. Vehicle designers and manufacturers can play a
significant role in this respect. Shippers as well as the truckers also are key
elements in the performance of highway pavements as reflected by the way in which
they load and use their vehicles.
Since vehicular loads are transmitted to the pavement at tire-pavement
contacts, the tires of the vehicle are a major factor in the loading of the
pavement structure. The width, wall stiffness, and pressure of the tire control
the contact area and thus is a factor limiting stresses applied to the pavement
[3 J. The nwnber of tires supporting a given load also influences the contact
pressure and the stresses induced in the pavement structure. Spacing between tires
is important in that stress fields from adjacent tires may overlap and result in
additive stresses at certain points within the pavement system.
An increased number of axles provide additional contact points to transmit a
given load to the pavement. If axles are closely spaced, there may be an
overlapping of stress fields. The distribution of the vehicular load among the
axles may be more prevailing than the number of axles or number of tires [4]. If
it is assumed the load is distributed uniformly among the axles, when it is not,
the effects of that particular vehicle may be underestimated [5, 6]. Placement of
the load within the vehicle and the design of the suspension system may be
important. As an example, only about 10 percent of the tandem axle groups observed
in Kentucky have loads uniformily distributed between the two axles. Such a
nonuniform distribution may account for as much as a 40-percent increase in the
fatigue damage to a pavement. The use of "floating" axles also may be undesirable
unless means are provided by which the floating axle carries its proper share of
the load [6]. It has been observed that the load carried by third floating axles
may vary from a very low portion of the total load, providing very little benefit
from the additional axle and shifting the addi tiona! load to the two remaining
axles in the group, to a very large percentage of the load (up to 240 percent).
The kingpin location may be varied up to 24 or 30 inches (610 or 760 mm) from
its desirable location (midpoint between tandem axles). Displacements of the
kingpin by as much as 18 inches (460 mm) are not uncommon [3]. Such a displacement
tends to shift a portion of the trailer load to the front steering axle of the
vehicle where small increases in load are disproportionately more damaging to the
j.,.,
Page 11
pavement; i.e., a 10-percent increase in load produces a 35-percent increase in
fatigue.
3. PRINCIPLES OF PAVEMENT DESIGN
A load applied at the surface of a pavement is distributed downward through
the pavement to underlying materials. The objective of the design of pavement
thickness is to select the combination of thicknesses of various component layers
to reduce the stresses and strains at any given level to a value that can be
resisted by the material at that level without failure.
Interactions between various materials of a pavement system and the loading
are extremely complex. Computerized mathematical models [1, 2] based on elastic
layer theory may be used to obtain a first approximation of stresses and strains
within a pavement under various loading configurations. By extending the elastic
theory and making use of energy (work) concepts [3], it has been possible to
further refine evaluations and interpretations of observed phenomena.
The equivalent axleload (EAL) approach was selected in Kentucky as a means to
express a variable traffic stream in terms of a single number that can be used for
design purposes and that can be related to a stress (or strain)-repetitions of load
curve or the fatigue concept. All axleloads are expressed in terms of a reference
or base axleload (18,000 pounds (80 kN)), The EAL for a given axle configuration
represents the damage equivalency for that particular configuration. Figure 1
illustrates the variation of damage or load equivalency for selected axle
configurations as a function of loads on those configurations [3].
4. PAVEMENT RESPONSES TO LOADS
4.1 SELECTED ILLUSTRATIONS
A single four-tired axle carrying 18,000 pounds (80.0 kN) will cause one
"unit" of damage (1 EAL) to the pavement. This was the legal axleload in Kentucky
prior to 1974. The current legal axleload of 20,000 pounds (88.9 kN) on this same
axle results in an equivalent damage of 1.7 units (Figure 1), A tandem axle group
can support a load of 37,400 pounds (166.4 kN) with a resultant damage equivalency
of 1.0; three-axle groups carry 56,300 pounds (250.4 kN) at an equivalent damage of
1.0. There is a significant increase in total load on the axle group as additional
axles are added. For the fourth and each additional axle, the load on the axle
group may be increased by slightly more than 18,000 pounds (80.0 kN) with no
increase in damage to the pavement.
In Figure 2, damage equivalencies for three commonly used vehicle types
increase as the gross load on the vehicle is increased. The importance of the
proper selection of vehicle type is vividly illustrated when, for the same payload,
the style of vehicle utilized may result in damage equivalencies from 1 to 20.
Figure 3 shows that the percentage increase in payload is very much less than the
corresponding percentage increase in damage equivalency.
Page 12
� 0 " u � w i a
10
•
.•
.•
·"
.02
TWENTY TIRES fiVE AXLES
TillES
.oto�"-.... '--':"'"''--�<�<-:"'"'-_.._--:,'::.--'--�,c.--'--7. ... AKI.E GROUP (KIPS}
Figure 1 . Damage (or Load Equivalency) Factor for Selected Axle Groups as a Function of Load on the Axle Group.
Figure 2. Damage (or Load Equivalency) Factor for Selected Vehicles as a Function of Load on the Truck.
••r---------------,----------------,
•
(})
w 0 I
�r-----------------------.
..
"
llfiT141.. fiROSS LOA�8�k THI'. ��,-----,0,0,;1
20 40 ADDITIONAL I..OAD ON TRUCK !KIPS)
•
Figure 3. Damage (or Load Equivalency) Factor for Selected Vehicle Types as a Function of Payload.
'•
- _____ _ )_ _ _
30 50 PAYLOAD I KIPS l
"
c ____ ,
Page 13
4.2 TIRE PRESSURES AND RUTTING
It is expected that increased tire pressures would decrease the area of the
tire footprint and increase the potential for rutting or a punching shear failure.
Allen and Deen [7] reported on an extensive laboratory investigation into the
rutting potential of flexible pavement components (asphaltic concrete, dense-graded
aggregate, and subgrade soils). Rut prediction models were formulated for each
pavement component. In addition, traffic and environmental models were developed,
and all models were combined into a single computer program (PAVRUT) capable of
providing estimates of rutting for any flexible pavement structure.
The rutting models take the following form for all three pavement components
tested: 2
Ep = A (log N) + B {log N) 3 + C (log N) + D, ( 1)
in which Ep is the permanent strain, N is the number of load repetitions, and A, B,
C, and D are experimentally determined variables dependent on stress, temperature,
moisture content, and subgrade CBR. The environmental (temperature) model was
developed from data reported by Southgate and Deen [8] to predict temperatures of
asphaltic concrete layers at any depth and for any hour of the year.
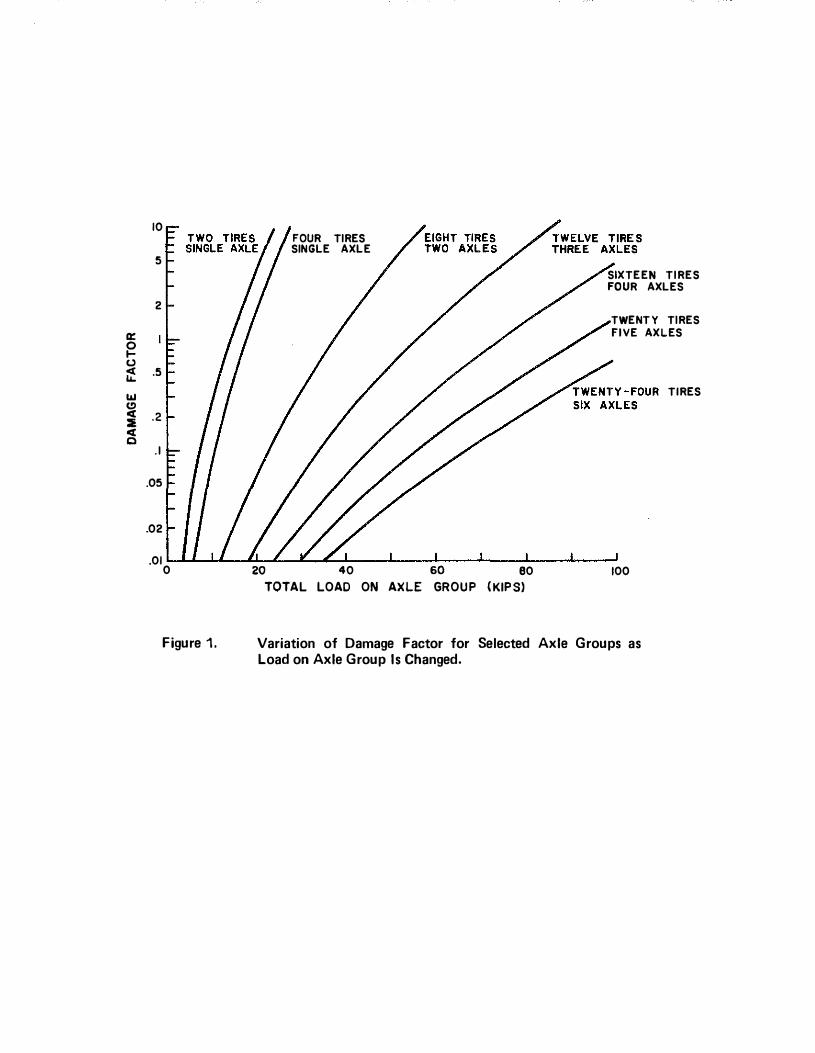
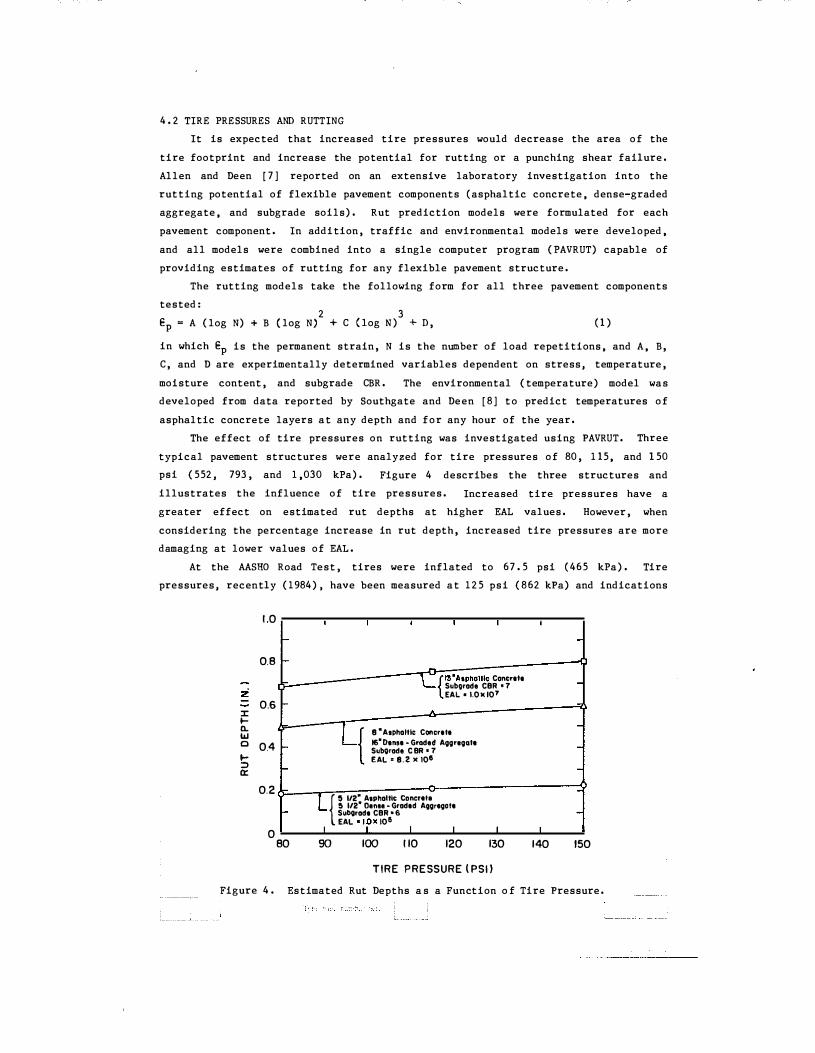
The effect of tire pressures on rutting was investigated using PAVRUT. Three
typical pavement structures were analyzed for tire pressures of 80, 115, and 150
psi (552, 793, and 1,030 kPa). Figure 4 describes the three structures and
illustrates the influence of tire pressures. Increased tire pressures have a
greater effect on estimated rut depths at higher EAL values. However, when
considering the percentage increase in rut depth, increased tire pressures are more
damaging at lower values of EAL.
At the AASHO Road Test, tires were inflated to 67.5 psi (465 kPa). Tire
pressures, recently (1984), have been measured at 125 psi (862 kPa) and indications
z J: .... 0. "' 0 .... ::J a:
1.0 -
0.8
0.6 -
0.4
0.2 -
0 80
' ' '
L{t3"Aiphollle
.
Contrlfl Suborode CBR • 7 EAL • tOxtOl'
L{ 8 "A1pholtlc Concr1t1
16"D1ns1- Graded AQQrtQOtl SubQrode C BR • 7 EAL = 8.2 x lOIS
L { • 112" Aophollto """"'" 5 112" 01n11- Grod1d AgQriQOtl Subf;lrodl CBR • 6
I EAL •t?X IO' I I
90 100 110 120 I
130
TIRE PRESSURE (PSI)
-
-
-
-
I 140 150
Figure 4. Estimated Rut Depths as a Function of Tire Pressure.
Page 14
are that pressures will increase in the next few years. Recent research indicates
increased tire pressures cause substantial increased fatigue for the same axleload.
Thinner pavements are affected more than thicker pavements, as indicated by a
multiplying factor of 3.40, 1.95, and 1.43 for 3 inches (76 mm), 5 inches (127 mm),
and 8 inches (203 mm) of asphaltic concrete, respectively.
4.3 OTHER ISSUES AND FACTORS
4.3.1 Bridges
Bridge loadings are considere.d in two ways: the wheel loading on the floor or
deck system and the loading on the span. Capacity may be limited by either or
both. There is some load that will cause catastrophic failure. Other loads may
induce stresses greater than a safe level and be permanently but insidiously
damaging ( i n fatigue).
4.3.2 Operating Costs
Energy savings might be realized if fewer truck trips result from larger
payloads. However, increased fuel consumption per truck trip would be required to
move those increased payloads. Greater weights will result in increased wear and
tear on the tires, the brakes, and the basic vehicle.
4.3.3 Safety
Accident severity and fatalities involving large trucks may increase. On the
other hand, increased payloads may lead to a reduced number of truck �rips that
would, in turn, result in less exposure to accidents. Increased vehicular weights,
requiring more efficient braking systems, may result in an increased potential for
brake fade and may lead to an increase in the number and severity of accidents
involving trucks. Increased truck weights will cause greater differentials in
vehicle speeds that are potential causes of highlv-ay accidents.
4.3.4 Other Economic Considerations
Increased truck weights will require heavier and more durable equipment.
Thus, capital costs will increase. If savings do accrue as a result of increased
productivity, will those savings be passed to the consumer? Productivity in the
trucking industry may or may not increase. Other modes of transportation, such as
rail and water, may experience a decrease in goods movement.
4.3.5 Enforcement
Enforcement of truck weight laws is a necessary attempt to minimize the
potential for premature failure of pavements and bridges. Enforcement of present
truck weight laws are difficult. Changing the laws to make enforcement less
difficult is not in itself good reasoning; however, the cost of enforcement may
decrease if fewer violations would result. An aspect of enforcement is the
comparison of the issuance of citations for oversized and overloaded vehicles to
the rate of convictions and the severity of fines. The costs of enforcement and
the delays to truckers may be decreased if a system of issuing citations by sight
(based on the presence of sideboards or on the length of the tire-pavement contact
and tire pressure, for example) could be developed to minimize the need to stop,
�--_ ______; ___ _:
Page 15
weigh, and inspect vehicles. The use of available technology to weigh vehicles in
motion also may be used to screen potential violators, allowing those trucks
obviously not in violation to proceed without delay.
5. USER COSTS ALLOCATIONS [9]
The first step in determining costs and revenues attributable to the highway
system involves the establishment of the degree of
adequately represent the variability of costs
stratification necessary to
and revenues
Characteristics of the highway considered significant are
generated.
federal-aid
classification, rural or urban character, number of lanes, total mileage, vehicle
miles traveled, and annual average daily traffic.
To determine total annual costs for the highway system in Kentucky, it was
necessary to develop construction, replacement, or current value costs representing
capital investment components. Components of roadway costs considered of interest
were limited to pavements and shoulders.
The method of allocation of capital investments for pavements and shoulders
differed significantly from the traditional incremental approach. Typical pavement
designs and their accompanying thicknesses are an integral part of the traditional
approach. For this study, pavement and shoulder cost allocation was based on the
concept of proportional distribution of equivalent axleloads (EAL). Percent cost
responsibility was related directly to accumulated EAL"'s for a 20-year design
period for each highway classification. Damage factors and repetitions of vehicle
types were used to calculate accumulated EAL .. s for the design period for each
highway classification. Percentage of cost responsibility for various vehicle
classes and/or weight registrations for each highway classification are presented
in Table 1.
Pavement and shoulder maintenance expenditures were allocated on the basis of
axle-miles of travel. All vehicles shared 80 percent of the expenditures and the
remaining 20 percent was shared by trucks only. For the primary road system, Iowa
[10] assigned 80 percent of the expenditures for pavement maintenance to all
vehicles based on axle-miles traveled and 20 percent to trucks only. All vehicles
were charged with 8 5 percent of the total costs for shoulder maintenance and 15
percent was assigned to trucks. The percentage assigned to all vehicles rose to 90
percent for secondary and municipal road systems. Similar results were noted in a
Federal Highway Administration study [11), but the percentage assigned to all
vehicles was nearly constant for each highway system listed.
6. CONCLUDING REMARKS
The mechanics of pavement behavior in response to vehicular loadings are
reasonably well understood. Reliable mathematical models have been programmed for
high-speed computers so that analyses and designs may be made with confidence.
Comprehensive modeling of the economic factors has not yet been satisfactorily
accomplished. General trends of many of the component economic relationships may
Page 16
TABlE 1. PERCENTAGE CF COST RESPONSIBILITY FOR PAVEMENI'S AND SHCXJLCERS BY VEHICLE TIPE
HIG!UAY CLASSIFICATION
Interstate
F ederal- aid Prlnary
Fede ral-aid Urban
Federal-aid Secorrlary
NOnfederal-aid
Rural
Urban
Rural
Urban
Urban
Rural
Rural State Mllnta:ined
Urban
Total, All Systans
4 6 4 6
2 4 2 4
2 4
2 4
2 4 2 4
1.09 1.81 2.46 3.51
3.52 1.92 2.68 6.80
10.21 10.02
4.16 4.25
3.87 4.25 9.89
10.02
2.83
REGIS1ERED MAXIML1M CROSS WliG!IT ClASS FOR TROCKS (1,000 RJUNffi)
4.09 5.09
11.32 8.52
12.83 7.91 9.54
13.60
19.27 18.13
14.92 16.77
12.70 16.77 19.44 18.13
8.45
14-262
32-44 55-62 73.28
5.% 18.98 16.85 13.84
18.23 13.56 15.32 29.04
36.11 31.73
24.46 23.24
24.39 23.24 35.93 31.73
10.% 11.49 12.44 12.19
15.04 13.79 16.10 12.96
12.19 15.16
16.57 15.22
22.35 15.22 12.49 15.16
16.51 14.70 14.63 14.89
15.48 15.97 17.25 11.92
8.47 11.59
14.85 13.99
19.04 13.99
8.56 11.59
33.87 26.88 23.68 26.05
19.63 26.14 21.80 14.48
8.00 7.75
14.18 14.70
10,24 14.70
7.% 7.75
82
27.52 21.05 18.62 21.00
15.27 20.71 17.31 11.20
5.75 5.62
10.86 11.83
7.41 11.83
5.73 5.62
16.21 12.40 14.92 25.18 20.01
be known, but precise interrelationships have not yet been defined, nor have those
various components been brought together into a comprehensive model. Even in those
cases where economic relationships are known, input data for analyzing specific
situations are sometimes very difficult to obtain.
Statutes dealing with weight limitations on trucks should be reviewed for
consistency with the mechanics of pavement performance. Efforts should be made, by
statute, to encourage the use of those vehicle styles that are less damaging to
highway pavements. Legal limitations, and their enforcement for vehicle styles
that are extremely damaging, should be very stringent. Incentives, in the form of
tax credits or increased allowable gross weights, for example, may be coupled with
modifications of the statutes to encourage and assist the trucking industry to use
those vehicles that are less damaging to highway pavements.
An educational effort is needed to impress upon all affected groups (the
trucking industry, users of trucking, vehicle designers, state and national
legislators, and the public) the gravity of this problem. Until users of heavy
vehicles understand and appreciate the significance of the interrelationships of
the types of vehicles used to carry heavy loads and the manner in which loads are
distributed on individual vehicles, progress will be very difficult and long in
coming.
Page 17
7 . REFERENCES
1 HAVENS, J. H., DEEN, R. C., and SOUTHGATE, H. F., "Design Guide for Bituminous
Concrete Pavement Structures", Report UKTRP-81-17, Transportation Research
Program, University of Kentucky, Lexington, Aug 1981.
2 SOUTHGATE, H. F., DEEN, R. C., and HAVENS, J. H., "Development of a Thickness
Design System for Bituminous Concrete Pavements," Report UKTRP-81-20,
Transportation Research Program, University of Kentucky, Lexington, Nov 1981.
3 HAVENS, J. H., DEEN, R. C., and SOUTHGATE, H. F., "Fatigue Damage of Flexible
Pavements under Heavy Loads," Report 518, Division of Research, Kentucky
Department of Transportation, Lexington, Apr 1979.
4 DEEN, R. c. and SOUTHGATE, H. F., "Truck Design and Usage and Highway Pavement
Performance", Proceedings, The Association of Asphalt Paving Technologists,
1980.
5 SOUTHGATE, H. F., DEEN, R. C., and M AYES, J. G., "Strain Energy Analysis of
Pavement Designs for Heavy Trucks", Record 949, Transportation Research Board,
Washington, DC, 1983.
6 SOUTHGATE, H. F. and DEEN, R. C., "Variations of Fatigue due to Unevenly Loaded
Axles within Tridem Groups," Report UKTRP-84-11, Transportation Research
Program, University of Kentucky, Lexington, Apr 1984.
7 ALLEN, D. L. and DEEN, R. C., "Rutting Models for Asphaltic Concrete and Dense
graded Aggregate from Repeated Load Tests", Proceedings, The Association of
Asphalt Paving Technologists, 1980.
8 SOUTHGATE, H. F. and DEEN, R. C., "Temperature Distributions in Asphaltic
Concrete Pavements", Record 549, Transportation Research Board, Washington, DC,
1975.
9 BLACK, J. E. and PIGMAN, J. G., "Allocation of Transportation Costs to Users",
Report UKTRP-81-22, Transportation Research Program, University of Kentucky,
Lexington, May 1982.
10 "Report on Iowa State Highway Commission Study to Determine Automobile and Truck
Annual Cost Responsibilities for Iowa ... s Road and Street Systems'', Needs Study
Unit, Systems Planning Department, Division of Planning, Iowa State Highway
Commission, Sep 1973.
11 OEHHANN, J. C. and BIELAK, S. F., "Allocation of Highway Cost, Responsibility
and Tax Payments, 1969", Federal Highway Administration, US Department of
Transportation, Washington, DC, May 1970.