Prepared for National Cooperative Freight Research Program (NCFRP) Transportation Research Board of The National Academies TRUCK IDLING SCOPING STUDY BOOZ | ALLEN | HAMILTON McLean, Virginia
Transcript
Prepared for
National Cooperative Freight Research Program (NCFRP)
Appendix A Truck Idling Sources ............................................................................................................
AppendixB Specifications for Dell Server ..............................................................................................
AUTHOR ACKNOWLEDGMENTS
The research reported herein was performed under NCFRP Project 28 by Booz Allen Hamilton. Stephen
Brady, P.E., lead associate at Booz Allen, was the project director and principal investigator. The other
author of this report was Deborah Van Order, associate at Booz Allen Hamilton. The technology support
was provided by Skip Yeakel of Volvo Heavy Trucks.
1
SUMMARY
Truck idling is a significant source of air pollution and contributes to potential health risks, higher
operating costs, and greater fuel consumption. Although information exists on truck emissions while
idling, recent data on the time that trucks spend idling are anecdotal or speculative. This limited
information may not adequately reflect the variability across all types of trucking operations, vehicle
models, or regional tendencies. Enhanced datasets could help to better characterize the variability of
the contributing factors in truck idling activity across all truck classes and operations.
The objective of this research is to develop a plan for decisionmakers that provides the scope, methods,
and cost estimates for obtaining national and regional datasets for the time spent and fuel consumed by
on-road trucks while idling. The datasets will include truck characteristics, operation types, and idling
causes. The plan will be used as part of a follow-on study to provide guidance on how to apply and
supplement the idling estimates at the local level.
The research team developed a comprehensive plan for profiling truck idling characteristics associated
with Class 2b through Class 8 truck operations within the United States. The overall approach included
researching existing idling reports, identifying idling data sources, developing comprehensive data
parameters, and segmenting the commercial vehicle market.
The research of existing truck idling data identified a wide range of idling times and data collections
methods. Previous reports used driver surveys, engine control module downloads, vehicle
instrumentation, and onsite observations. The driver survey provided the largest sample size, but relied
on the respondents to provide accurate answers. Vehicles with installed instrumentation provided the
most accurate idling times, but had the smallest sample size. A review of the overall findings found idling
times as low as 6 hours per week and as high as 5 hours per day. This research helped to identify three
considerations required to provide a robust truck idling scoping plan:
The proposed test plan will outline a data collection method that represents all commercial vehicles, Class 2b through Class 8.
The proposed test plan will recommend downloading idling data from existing electronic control units or installed vehicle monitoring equipment.
The proposed test plan will use various data sources to obtain a statistically significant sample size. The sample size will represent a diverse fleet of vehicles, including local fleets, motor coaches, and long-haul tractors.
To provide an economical, but extensive, idling test plan, several key factors were identified. The final
database must encompass vehicles across the United States; provide a large, diverse sample vehicle
composition; use proven technology to collect the data; monitor vehicles remotely; and use previously
installed equipment. Software companies have developed the capability to remotely monitor vehicle
status, including idling, mileage, and so on. The information allows tracking of vehicle routing, idling
time, and other data requested by the fleet. An investigation into remote vehicle monitoring (RVM)
companies identified several sources for idling data. Using a combination of companies, the test plan is
2
capable of providing a national snapshot of commercial truck idling. The size of the test fleet can be
adjusted by adding or removing participating RVM companies.
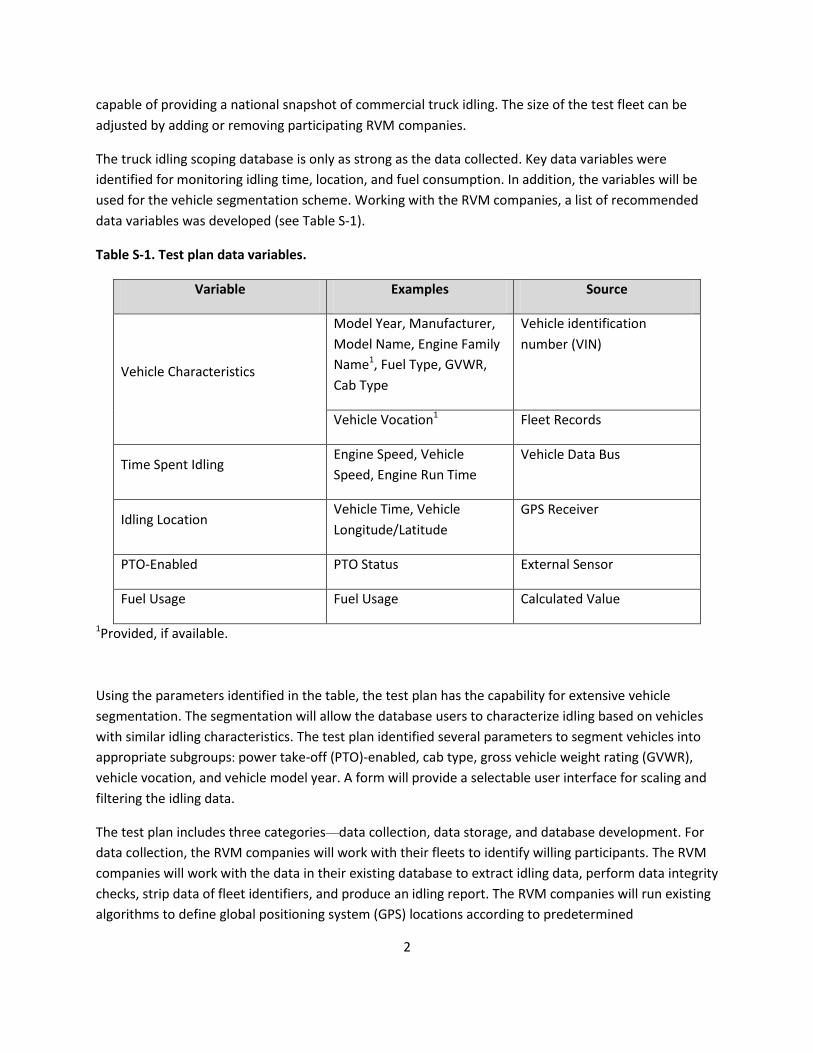
The truck idling scoping database is only as strong as the data collected. Key data variables were
identified for monitoring idling time, location, and fuel consumption. In addition, the variables will be
used for the vehicle segmentation scheme. Working with the RVM companies, a list of recommended
data variables was developed (see Table S-1).
Table S-1. Test plan data variables.
Variable Examples Source
Vehicle Characteristics
Model Year, Manufacturer,
Model Name, Engine Family
Name1, Fuel Type, GVWR,
Cab Type
Vehicle identification
number (VIN)
Vehicle Vocation1 Fleet Records
Time Spent Idling Engine Speed, Vehicle
Speed, Engine Run Time
Vehicle Data Bus
Idling Location Vehicle Time, Vehicle
Longitude/Latitude
GPS Receiver
PTO-Enabled PTO Status External Sensor
Fuel Usage Fuel Usage Calculated Value
1Provided, if available.
Using the parameters identified in the table, the test plan has the capability for extensive vehicle
segmentation. The segmentation will allow the database users to characterize idling based on vehicles
with similar idling characteristics. The test plan identified several parameters to segment vehicles into
Advances in engine control modules and GPS have the potential to provide a new perspective. Enhanced
datasets could help to better characterize the variability of the contributing factors in truck idling
activity across all truck classes and operations.
5
CHAPTER 2
Research Approach
The research approach required knowledge in four key areas to support the final truck idling scoping
plan. The preliminary work included the following tasks:
Research existing truck idling reports,
Identify and evaluate new truck idling sources,
Identify truck idling data elements and sources, and
Develop a vehicle segmentation scheme.
2.1 Research Existing Truck Idling Reports
Previously, few researchers attempted to evaluate the frequency and duration of idling events under
real-world conditions. Instead, they made educated guesses about idling behavior or applied general
rules of thumb that assumed a particular number of idling hours for a specific timeframe for a specific
truck type or application. Although the estimates are useful in assessing the general magnitude of the
idling issue, it is difficult to assess the accuracy of these estimates without validation by empirical data.
As a result, several recently published reports have attempted to evaluate idling events under real-world
conditions.
For this task, the research team conducted an analysis of those truck idling reports to document the
methodology of collecting idling data, the idling times recorded, and the advantages and disadvantages
of each method. The analysis identified 11 reports published within the past 10 years. The reports
estimated truck idling using one of three methods—driver surveys, onsite observations, or engine
control module downloads. The idling estimates varied widely between each report, from 5 hours per
day to 6 hours per week. Some variations were attributed to the type of vehicle surveyed (e.g., sleeper
berth versus day cab). Other variations were attributed to the data collection method. For example, the
driver surveys monitored an individual driver’s idle time, but the onsite observations monitored the idle
time per parking space. A review of the data found that the driver surveys provided the largest data
source (55,000 trucks). For the test using the engine control module download, the scope and purpose
of the test limited the sampled vehicles to 270, which is too small to scale to a national representation.
Larger downloads, however, can be achieved with minimal effort.
The research identified three considerations for the development of the truck idling scoping plan:
Vehicles Surveyed: The reviewed plans did not represent a diverse vehicle set. None of the plans included vehicles in Class 2b through Class 7, which represent two-thirds of the commercial market. The proposed test plan will outline a data collection method that represents all commercial vehicles, Class 2b through Class 8.
6
Data Collection Methods: Two-thirds of the reviewed reports used surveys, data loggers, or estimations to calculate idling time. Each of these methods introduces its own set of complications. Surveys are only as accurate as the responses provided. Drivers may mask their actual idle time in fear of repercussions from employers. Data loggers are limited by project cost. As the sample size is increased, additional equipment and installation costs are incurred. Finally, estimations are only as accurate as the original data source. If the estimation is based on limited source data, the accuracy of the idling time decreases. The proposed test plan will recommend downloading idling data from existing electronic control units or installed vehicle monitoring equipment. The researchers have identified sources for obtaining idling data.
Sample Size and Distribution: With the exception of one report, the sample sizes of the idling reports represented less than 1/20 of a percentage of registered commercial vehicles. The sample sizes did not include a diverse commercial fleet; Class 8 vehicles were represented. The proposed plan will use various data sources to obtain a statistically significant sample size. The sample size will represent a diverse fleet of vehicles, including local fleets (e.g., plumbing companies, utility companies, local delivery fleets), motor coaches, and long-haul tractors.
2.2 Identify and Evaluate New Truck Idling Sources
In field studies, data acquisition and collection is a critical component of the effectiveness of the study.
The types of required data must be clearly identified, and the methods that will be used to calculate the
idle time of the vehicles must be determined before the test begins. The amount of data must be limited
to prevent data overload in the analysis phase and to reduce the resource requirements on the fleet and
personnel.
The use of existing in-vehicle communications networks minimizes the test’s cost implications and
expands the field of available vehicles. Existing communication networks include the On-Board
Diagnostic II (OBDII) for medium-duty vehicles and the SAE J1939 for heavy-duty vehicles. Software
companies specializing in RVM and maintenance services work directly with interested fleets to monitor
these communication networks. For a fee, the RVM companies wirelessly download data from the in-
vehicle communication networks and aftermarket sensors. The RVM companies analyze the data and
provide reports to the fleet. Examples of monitored data include vehicle idle time, vehicle speed, and
vehicle location.
In considering the sources for the truck idling data, the research team identified several key factors to
ensure compilation of a diverse idling database. The factors include:
Access to vehicles distributed across the United States—The National Cooperative Freight Research Program (NCFRP) has requested that the idling scoping study includes datasets at regional and national levels.
Access to a large, diverse vehicle composition—The dataset must represent the current distribution of commercial vehicles in the United States.
7
Use of proven technology recognized within the industry—The field test will not be used as a test to validate prototype technologies. The data must be obtained using recognized practices to ensure that industry experts accept the study findings.
Remote monitoring of the vehicle dataset—To minimize the study cost, the monitored vehicles must be monitored remotely to reduce the interaction with the vehicles to obtain the datasets.
Previously installed monitoring equipment—To minimize the study cost, the vehicles selected for the study must have the monitoring equipment installed. The study does not include the instrumentation of the vehicles.
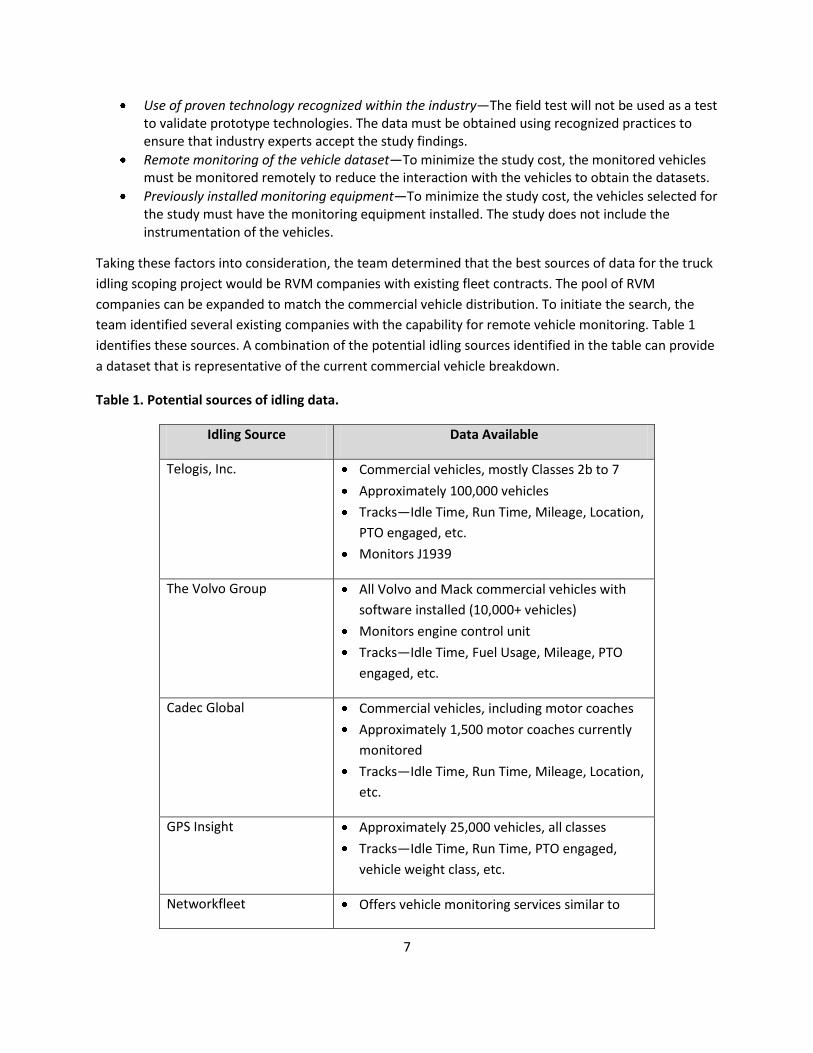
Taking these factors into consideration, the team determined that the best sources of data for the truck
idling scoping project would be RVM companies with existing fleet contracts. The pool of RVM
companies can be expanded to match the commercial vehicle distribution. To initiate the search, the
team identified several existing companies with the capability for remote vehicle monitoring. Table 1
identifies these sources. A combination of the potential idling sources identified in the table can provide
a dataset that is representative of the current commercial vehicle breakdown.
Table 1. Potential sources of idling data.
Idling Source Data Available
Telogis, Inc. Commercial vehicles, mostly Classes 2b to 7
Approximately 100,000 vehicles
Tracks—Idle Time, Run Time, Mileage, Location,
PTO engaged, etc.
Monitors J1939
The Volvo Group All Volvo and Mack commercial vehicles with
software installed (10,000+ vehicles)
Monitors engine control unit
Tracks—Idle Time, Fuel Usage, Mileage, PTO
engaged, etc.
Cadec Global Commercial vehicles, including motor coaches
Approximately 1,500 motor coaches currently
monitored
Tracks—Idle Time, Run Time, Mileage, Location,
etc.
GPS Insight Approximately 25,000 vehicles, all classes
Tracks—Idle Time, Run Time, PTO engaged,
vehicle weight class, etc.
Networkfleet Offers vehicle monitoring services similar to
8
Telogis and GPS Insight
Malone Specialty Inc.
Fleet Logix
Independently installed by fleets
Does not offer central database of parameters
across several fleets
2.3 Identify Truck Idling Data Elements and Sources
Conducting an idle reduction study requires more than simply compiling the total time a vehicle is at
idle. The reasons for the idle events are of great importance to understanding the requirements for
idling each particular vehicle’s engine and to determining the best technical solutions for idle reduction
in each application. Therefore, additional data elements are required to gain an understanding of the
nature of truck idling.
The NCFRP requested a dataset that monitored idling time of on-road commercial vehicles and their
corresponding fuel consumption. NCFRP requested additional variables to characterize the idling,
including truck characteristics, operation type, and idling cause. Using this information, the research
team recommends the variables shown in Table 2 for analysis.
Table 2. Recommended data variables.
Variable Name Description
Vehicle Model Year Year of Manufacture
Vehicle Manufacturer
Vehicle Model Name
Vehicle GVWR Pounds
Cab Type Sleeper, Day Cab
Vehicle Class Classes 2b through 8
Engine Family Name
Vehicle Vocation Parcel, Long-Haul, Delivery
Vehicle Fuel Type Gasoline, Diesel, Propane, Natural
Gas (Compressed and Liquid)
9
Time Spent Idling Per Event
Idling Location Storage Yard, Intersection
PTO-Enabled Time Off/On
Fuel Consumption Calculated per Idling Event
These variables will be collected by the RVM companies using a variety of sources including on-board
communications networks (J1708, J1939, and OBDII), GPS receivers, and existing sensors on the vehicle.
No additional sensors will be added to the vehicle.
2.4 Develop a Vehicle Segmentation Scheme
The idling scoping study will provide datasets for the time spent and corresponding fuel consumed by
on-road trucks while idling. The findings are to be scaled from the available dataset to mimic the vehicle
distribution at the regional or national level. Therefore, the dataset must represent the distribution of
commercial vehicles in the United States. An industry analysis (see Table 3) estimated that nine million
Class 2b through Class 8 vehicles are registered in the United States. As shown in the table, the final
dataset should be broken down into 33 percent Class 8 vehicles and 67 percent Class 2b through Class 7
vehicles.
Table 3. Distribution of registered commercial vehicles.
10
Source: Based on the Booz Allen team analyses of numerous sources including the 2002 truck inventory
and use survey; estimated growth in segments; data accumulated by the Booz Allen team in completing
assignments for private-sector clients; and information provided by numerous industry trade
associations.
The vehicle segmentation scheme provides the ability to categorize the idling data from the vehicles into
subgroups with similar idling characteristics. The data will have the ability to be segmented by up to five
characteristics—PTO-enabled, GVWR, vehicle vocation, vehicle model year, and cab type.
PTO-enabled will be the most significant segmentation characteristic, which will define whether the
vehicle is idling due to on-board equipment operation. It will separate the vehicles that were identified
as idling due to the operation of the PTO equipment. These idling statistics, although significant, are not
as vital as the idling of vehicles during load/unload operations, required hours of service (HOS) breaks,
and so on. Idling during PTO operation is required to operate the auxiliary equipment. Vehicles with PTO
Class 8 Tractor Units Comments / Examples Less-than-Truckload (LTL) 508,000 UPS, Yellow Roadway, Ryder, FedEx Truckload (TL) 1,044,000 J.B. Hunt, Schneider, Swift Owner Operators 365,000 N/A Private Fleets 415,000 Walmart, Tysons Food, Sysco Corp. Total Class 8 tractors 2,332,000 Large Buses
Public Transit Buses 80,000 Operated by Local Government Transportation Agencies Motor Coach 48,000 Greyhound, Trailways, etc.
Private Shuttles (e.g., Airports) 16,000 Total Large Buses 144,000 Vocational Class 8
Fire Trucks 84,000 Refuse Haulers 140,000
Armored Car 12,000 Concrete Mixers 79,000
Dump & Misc. Class 8 170,000 Total Vocational Class 8 485,000
Total Class 8 2,961,000 Vocational Classes 2b through 7 Units Comments / Examples Units
School Buses 512,000 (1000s) Cable TV & Telecommunications 245,000 2b 2,790
Local Contract Delivery 335,000 Local Delivery Service (Non USPS, Non Overnight)
Ambulances, Emergency Response 43,000
Roads, Parks, & Construction Related 485,000 Dump, Rack, Flatbeds, etc.
Government (Misc) 652,000 Misc. Trucks Used by Federal, State, & Local Government Not Falling into Other Categories; Includes Classes 2b through 7 Trucks Used on Military Bases
Total Classes 2b through 7 6,051,000
Total Class 2b through Class 8 9,012,000
Class
11
capability, which are idling without the PTO enabled, will be grouped with the non-PTO-enabled vehicle
data.
The remaining segmentation characteristics can be used alone, or in combination, to provide a discrete
idling dataset. The remaining characteristics are:
GVWR—GVWR provides the weight and class of the vehicle.
Vehicle Vocation—Describes the primary role of the vehicle (e.g., long-haul, delivery, trades).
Model Year—The year of the vehicle manufacture. The model year can help to identify levels of emissions regulated by the US Department of Energy (e.g., a 2007 engine versus a 2010 engine).
Cab Type—For long-haul vehicles, the cab could be a sleeper cab or a day cab.
2.5 Data Collection Process
Figure 1 outlines the flow of idling data from the participating fleets to the test facilitator.
The test facilitator will collect idling data from fleets that the RVM companies have identified as being
willing to share anonymous vehicle data. The RVM companies outfitted each vehicle with GPS
equipment and wireless modems. The GPS equipment tracks vehicle location, idle time, and route
optimization. The RVM companies extract data from the vehicle’s electronic control module (ECM) to
track engine operation, fuel usage, and vehicle fault codes. The wireless modem transfers the GPS and
ECM data to a central database.
The RVM companies perform data integrity checks on the uploaded data to ensure the data is within the
proper ranges. Erroneous data is flagged, fixed, or discarded. Using the validated data, the RVM
companies generate reports for the participating fleets to outline vehicle usage, fuel economy, and
upcoming maintenance activities. In addition, the fleets are provided with any alerts that were
generated as a result of the vehicle operation, such as operation outside of service range, excessive
speed, or heavy braking.
12
Figure 1. Data collection process.
For the idling scoping study, the test facilitator will work with the RVM companies to define the
parameters for the data extraction. The facilitator will set the minimal idling time and the date range for
the report. An ideal data extraction would exclude idling times less than 90 sec, which is the standard
queuing time for red lights. The date range is expected to cover a year-long period established by the
NCFRP. These parameters will assist in the filtration of data from the RVM database.
Using these parameters, the RVM companies will extract a fleet’s data from the database. The findings
will be scrubbed to ensure the anonymity of the participating fleets and manipulated to meet the
requirements of the idling scoping study, including post-processing of the geospatial data. The RVM
companies should be able to provide location names for the GPS idling locations to reduce post-
processing by the test facilitator. The ability of the RVM companies to complete this task will reduce the
need for the test facilitator to produce algorithms to predict and name idling locations. The final product
will be saved in a comma delimited text file (*.CSV) for ease of transfer between the RVM companies
and the test facilitator.
As the .CSV file is not expected to exceed the file size limitations of an email server, the data will be
transferred to the test facilitator via email. If the file exceeds the limitations of an email server, a file
transfer protocol (FTP) site will be established for transferring the data file from each RVM company.
Upon receipt of the file, the test facilitator will validate, scrub, and parse the data into the established
data categories (see Table 2). The test facilitator will export the data into normalized database tables. A
case study showed that the database would likely require only two tables (see Figure 2). The first table
stores the information for each truck monitored during the study. The second table stores all idling
events during the study period.
Heavy Duty Fleets(Commercial Vehicles, Class 8)
RVM #1Database
Vocational Fleets(Commercial Vehicles, Classes 2b through 7)
RVM #2Database
Data Scrubbing
FacilitatorDatabase
Segmentation &Analysis
Findings
Data Scrubbing
13
Figure 2. Database tables.
To ensure anonymity, the researchers recommend developing database tables that do not differentiate
the source of the idling data. During the case studies, strong assurances were provided that the idling
data would not identify specific fleets or drivers. In the final study, the test facilitator must ensure the
database does not provide unique identifiers for each idling event or monitored truck. Therefore,
although the study currently recommends logging the monitoring of each truck, this information must
be either (a) locked from public access, or (b) eliminated from the database.
2.6 Hardware Requirements
The hardware requirements were estimated on the basis of the final storage requirements of the
database, the minimum operational characteristics of the server, and the ability to expand the storage
and/or memory.
Minimum Idling Data Storage Calculations
The storage requirements for the final idling database depend on several factors—total number of
vehicles monitored, total length of the test period, and total number of idling events. With a population
estimated at 9,012,000, a confidence level of 99 percent and confidence interval of 2 requires a sample
size of 4,158. The research team recommends monitoring the idling characteristics of 9,000 vehicles,
which represents 0.1 percent of the registered commercial vehicles. The sample size was chosen to
represent a reasonable amount of data collection effort and to provide an estimate of the software and
hardware requirements required for the task. A test period of approximately 365 days will provide idling
events for vehicles under most operating conditions (i.e., winter, summer, spring, fall, extreme
temperatures). Finally, it was assumed that each vehicle averages four idling events per day.
After conducting the case study, the researchers confirmed that the RVM companies provide datasets as
individual events versus a continuous data stream to be analyzed by the recipient. This knowledge
significantly reduces the hardware requirements for the database. To estimate the hardware
requirements for the database, the field names, field types, and field sizes for each table in the database
were outlined (see Table 4).
14
Table 4. Projected data fields.
Table
Name Field Name Field Units
Field
Type
Field
Size
(Byte)
Truck Info ID (Primary Key) Numeric int 4
Truck Info Vehicle ID Numeric int 4
Truck Info RVM Alphanumeric char 20
Truck Info Vehicle Vocation Numeric char 20
Truck Info Model Year Numeric smallint 2
Truck Info Manufacturer Alphanumeric char 20
Truck Info Model Name Alphanumeric char 20
Truck Info Engine Family Name Alphanumeric char 20
Truck Info Fuel Type D, G, P, CNG, LNG char 3
Truck Info Vehicle GVWR Pounds int 4
Truck Info Cab Type S, D bit 1
Truck Info Ping Rate Minutes tinyint 1
Idling Info Trip ID (Primary Key) Numeric int 4
Idling Info Vehicle ID Numeric int 4
Idling Info Day Numeric int 4
Idling Info Idle Start Time H-min-S time 3
Idling Info Idle End Time H-Min-S time 3
Idling Info Total Idle Time H-Min-S time 3
Idling Info City Alphanumeric char 40
Idling Info PTO Status 0-1 bit 1
Idling Info Location Alphanumeric char 20
15
Idling Info Fuel Consumed Gallons real 4
Using the field size data assigned in Table 4, the researchers calculated the storage requirements for the
database. The findings, combined with the hardware requirements for the operating system, will
determine the minimum requirements for the file server. The minimum database size was determined
using the variables shown in Table 5.
Table 5. Database size calculation.
Truck Info Idling Info
Number of Rows 9,000 13,140,000
Number of Columns 12 10
Fixed Data Size 16 26
Number of Variable
Columns 6 2
Maximum Size of
Variable Column 103 60
Null Bitmap 4 4
Variable Data Size 117 66
Row Size 141 100
Rows Per Page 56 79
Number of Pages 161 166,330
Table size (bytes) 1.3 MB 1.36 TB
Total Database Size 1.4 TB
The first variable assigns the number of rows to be stored in each table. For the Truck Info table, each
row represents the vehicle information for each vehicle tested. For the Idling Info table, each row
represents a single idling event. The table will record all idling events, regardless of data source. To
calculate the size of the Idling Info table, the researchers assumed that a tractor averages four idling
events per day. For a year-long field test, the test facilitator can anticipate approximately 13 million
rows of idling data. The remaining variables were assigned based on information outlined in Table 4 and
16
formulas generated by SQL Server (the anticipated database program). In conclusion, the research team
recommends a file server with the capability to store at least 8 TB of idling data. The recommendation is
for a hard drive capable of storing four times the minimum storage requirements (1.4 TB) to ensure
efficient operation of the server and to allow additional expansion, if desired.
Hardware Recommendations
Using this information as a baseline, the research team conducted an extensive study of the hardware
and software requirements to identify potential equipment that would meet the needs of the project
from capacity, performance, and budget standpoints. The Dell PowerEdge T610 server was identified as
a quad-processor unit that will serve three main functions: (1) as a SQL database server to coordinate
and organize the data, (2) as a hard drive to store the idling data locally, and (3) as a processor to
perform the data analysis and reporting. The latter operation will require some significant processing
capabilities along with a large amount of memory. The server can store up to 24 TB of data among eight
internal hard drives. If necessary, internal memory can be expanded to 192 gigabytes (GB). These
hardware specifications exceed the minimum requirements to operate the preferred database program.
The unit, as priced, contains the following features:
PowerEdge T610 - Tower Chassis for up to eight, 3.5" Hard Drives,
Windows Server 2008 R2 SP1, Standard Edition, Includes 5 CALS
Memory up to 192 GB (priced with 12 megabyte [MB] of RAM)
Maximum Internal Storage: Up to 24 TB (priced with 12 TB of hard drive space)
Eight additional drive bays (priced with four hard drives of 2 TB each)
2.7 Database Development
In past programs with the Federal Motor Carrier Safety Administration (FMCSA), the research team has
found that Microsoft Access was capable of handling large amounts of data and sufficiently flexible to be
tailored for the specific needs of the project. The team has also been successful in writing visual basic
code to integrate graphical presentation software into the database. However, the performance needs
of this project are significantly higher; it requires a more powerful software development environment
and a larger database storage capacity. Therefore, the research team recommends the use of
Microsoft’s SQL Server as the database engine for several reasons: (1) it is a powerful, low-cost database
alternative; (2) the team is familiar with its use; and (3) it is flexible and quick to implement. Alternatives
to the SQL Server include Oracle (which cost more than the SQL Server), Dbase (which has different size
and performance parameters), and Access (which also has different size and performance parameters).
A user interface could be generated to perform data queries and generate reports (see Figure 3). As
shown, the user interface has selectable fields to narrow the data into manageable segments. The
selectable fields are based on the segmentation scheme discussed above. The user would also be able to
generate a report on the entire database by leaving all fields within the form blank. The user would
17
select one of two display options for the final report—on-screen or export. The on-screen report will
provide the segmented data according to the selected fields, but the user will not be able to manipulate
the data for analysis. The second option, an export to a spreadsheet (such as Microsoft Excel), will allow
the user to manipulate and analyze the data.
Figure 3. Database user interface.
18
CHAPTER 3
Findings and Applications
The research team developed a comprehensive plan for profiling truck idling characteristics associated
with Class 2b through Class 8 truck operations in the United States. Upon approval of the draft, the team
conducted a series of case studies to validate the plan as outlined. The objective of the case study was
to test the proposed methodology, to identify issues that may arise in real-world implementation, and
to generate enhancements or modifications to the original plan.
Similar to the test plan, the case study included three crucial phases for developing a truck idling
database. First, the team identified participants willing to provide idling data. Second, the team
coordinated with the participants to identify dataset and delivery methods. Finally, the team developed
a database to store the collected data.
NCFRP requested three case studies to ensure that the test plan adequately addresses all vehicles in the
commercial market. The researchers recommended tracking a Class 8 commercial truck with a sleeper
cab, a Class 8 vocational truck, and a local fleet comprising vehicles in Classes 2b through 7.
3.1 Participant Identification
During the development of the test plan, the research team contacted several companies that provided
RVM capabilities to commercial fleets. The services provided real-time and historical data on the
operation of the fleet’s vehicles, including idling times, routes driven, and speeding events. The team
identified participants that used the Software as a Service (SaaS) concept. SaaS allows the participants to
poll the entire customer platform and pull data locally. If the participant required its customers to store
their own data, the data collection method outlined in the test plan would require a significantly higher
number of participants. For the case study, the researchers contacted two SaaS-capable participants
who expressed an interest in the study and a willingness to participate in a small data-gathering
exercise: Telogis, Inc. and the Volvo Group.
Telogis, Inc. was founded in 2000 and is headquartered in Irvine, California, with a development center
in Christchurch, New Zealand. It operates a wireless fleet management platform for a variety of fleets.
Its capabilities include fleet productivity, vehicle tracking, route optimization, and vehicle maintenance
monitoring. The company serves construction and building products, distribution, food and beverage
towing and salvage, carpet cleaning and restoration, telecommunications, packaging, less-than-
truckload (LTL) carriers, real estate inspection, health care, property management, utilities, pest control,
landscaping, water delivery, and retail distribution industries. Telogis customers are dispersed across the
United States and operate vehicles in each of the vehicle classes.
The Volvo Group is headquartered in Gothenburg, Sweden, and is the world’s second-largest
manufacturer of heavy-duty trucks. Volvo Group manufactures heavy-duty vehicles used for long-haul,
19
regional transport, and construction operations under the Volvo, Mack, and Renault logos. Volvo Group
offers Volvo Link Sentry as a fleet management tool for fleets and owner/operators. Volvo Link Sentry
continuously monitors a truck’s systems and fault codes, and automatically sends that data via satellite
to a central facility called Volvo Action Service. The technology supports the download of specific
datasets for further analysis.
3.2 Data Collection
For the case study, each participant provided the data variables shown in Table 6. The researchers
requested each participant to provide idling data for a month-long period, identify the appropriate
vehicles, and obtain the necessary client approvals to share the data.
Table 6. Requested data variables.
Variable Name
Time Spent Idling Per Event
Idling Location Storage Yard, Intersection
PTO-Enabled Time Off/On
Vehicle Fuel Type Gasoline, Diesel
Vehicle Class Classes 2b through 8
Cab Type Sleeper, Day Cab
Vehicle Vocation Parcel, Long-Haul, Delivery
Vehicle GVWR Pounds
Model Year Year of Manufacture
Vocation Long-Haul, Trades
Fuel Consumption Calculated per Idling Event
The first participant provided idling information for two separate case studies. The first case study
monitored two long-haul commercial trucks with sleeper cabs. Each vehicle operated in a different
region of the United States. The second case study monitored the idling events for a single Class 8
vocational truck operating in the state of Pennsylvania. The participant downloaded idling data for the
case studies and forwarded it, in its raw form, to an outside contractor. The contractor sorted the raw
data identifying idle events, noting idling locations, and scrubbing fleet identifiers. The data from this
participant offered varying degrees of information. For example, the software ping rate varied between
tractors, at either 15 or 30 min. In addition, the vocational truck did not provide specific city/state
information for idling location in order to eliminate potential identifiers based on the construction site.
20
The researchers worked with the second participant for a period of 2 months. During the initial rounds
of communication, the researchers spoke with a marketing representative who expressed ongoing
interest in the project. Several follow-up discussions during the course of the test plan development
solidified the company’s interest in the project. By the time approval had been given to move forward
with the case study, the marketing representative had moved onto a new position. Although the
researchers continued to communicate with a vice president of the company, interest in the case study
waned and the participant never delivered the promised data. The researchers opted to move forward
with the case study and attempt to secure additional idling data from alternate sources.
For the third case study, additional participants, including actual RVM companies, commercial truck
fleets, and a commercial motor coach manufacturer, were contacted for idling data. Due to the time
constraints, researchers were unable to secure an additional data provider. With additional time, it is
believed that another RVM company could have been identified to participate in the third case study.
Upon reviewing the needs for the case study, the research team determined that two case studies
would provide sufficient data to validate the test plan. This decision was based on several assumptions:
The researchers developed a methodology to gather electronic data from central databases. The data collected from these sources can be manipulated into identical datasets, regardless of the source.
The monitoring of a significant number of vehicles in the case study would not enhance the validation of the test plan. By using idling data from an electronic database, the test facilitator receives datasets that meet the specific request. The case study can be validated using a single vehicle, as the data received would be consistent across all fleets/vehicles. Additional vehicles would only increase the size of the database for the case study.
The elimination of the second RVM company would not diminish the assessment of the proposed test plan. The use of electronic data would standardize the information received from all sources, regardless of fleet size. The researchers contacted a small local fleet to review the data provided by the RVM company. The idling reports matched the information that the researchers received from the other two case studies.
3.3 Database Development
Upon reviewing the data provided for the case study, the research team modified the expected storage
requirements for a full study. The initial review based the data requirements on a streaming dataset,
including idling and non-idling events. The case study showed the idling reports are pared down to single
events. In other words, the data received from the RVM company will not be streaming data, but will
detail a single idling event, including total idling time and idling location. As a result, the data storage
requirements for a single tractor were modified.
A relational database, consisting of two data tables, was developed using the data parameters discussed
previously. As shown in Figure 4, the database contains a Truck Info table and an Idling Info table. The
Truck Info table stores the truck-specific information, including truck vocation, truck model year, truck
21
manufacturer, and cab type. The Idling Info table stores individual idling events. The table contains the
vehicle’s identification number, the total idling time, and the idling location.
Figure 4. Database tables.
Using these tables, various reports can be generated based on the user’s needs. Reports can be sorted
by vocation, model year, cab type, region, idle locale, or PTO status. The reports can be developed to
summarize total idling, idling with PTO active, and so on.
3.4 Case Study Analysis
During negotiations with the RVM companies to collect idling data, the research team agreed to
suppress the truck-level identifiers to ensure complete anonymity. As a result, the analysis below does
not detail specific truck-level idling events, but provides a high-level analysis to demonstrate the
capabilities of an idling database.
The two case studies track idling events for three vehicles during a month-long period (June 2011). The
first case study monitors idling data for two long-haul trucks; the second case study monitors a
vocational truck. Figure 5 provides a screenshot of the database used to store the idling events. The
database was developed in two steps. First, the Truck Info table was generated to store pertinent
information for each truck in the study. Second, the Idling Info table was generated to store all idling
events during the month-long study.
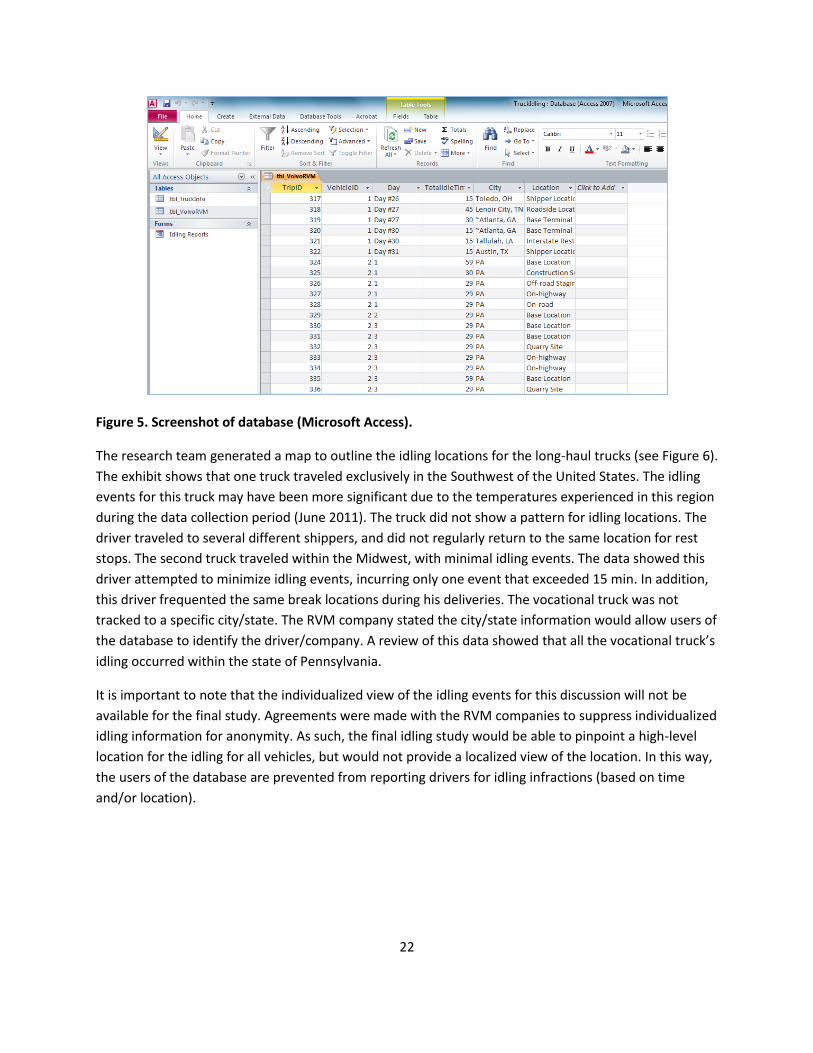
22
Figure 5. Screenshot of database (Microsoft Access).
The research team generated a map to outline the idling locations for the long-haul trucks (see Figure 6).
The exhibit shows that one truck traveled exclusively in the Southwest of the United States. The idling
events for this truck may have been more significant due to the temperatures experienced in this region
during the data collection period (June 2011). The truck did not show a pattern for idling locations. The
driver traveled to several different shippers, and did not regularly return to the same location for rest
stops. The second truck traveled within the Midwest, with minimal idling events. The data showed this
driver attempted to minimize idling events, incurring only one event that exceeded 15 min. In addition,
this driver frequented the same break locations during his deliveries. The vocational truck was not
tracked to a specific city/state. The RVM company stated the city/state information would allow users of
the database to identify the driver/company. A review of this data showed that all the vocational truck’s
idling occurred within the state of Pennsylvania.
It is important to note that the individualized view of the idling events for this discussion will not be
available for the final study. Agreements were made with the RVM companies to suppress individualized
idling information for anonymity. As such, the final idling study would be able to pinpoint a high-level
location for the idling for all vehicles, but would not provide a localized view of the location. In this way,
the users of the database are prevented from reporting drivers for idling infractions (based on time
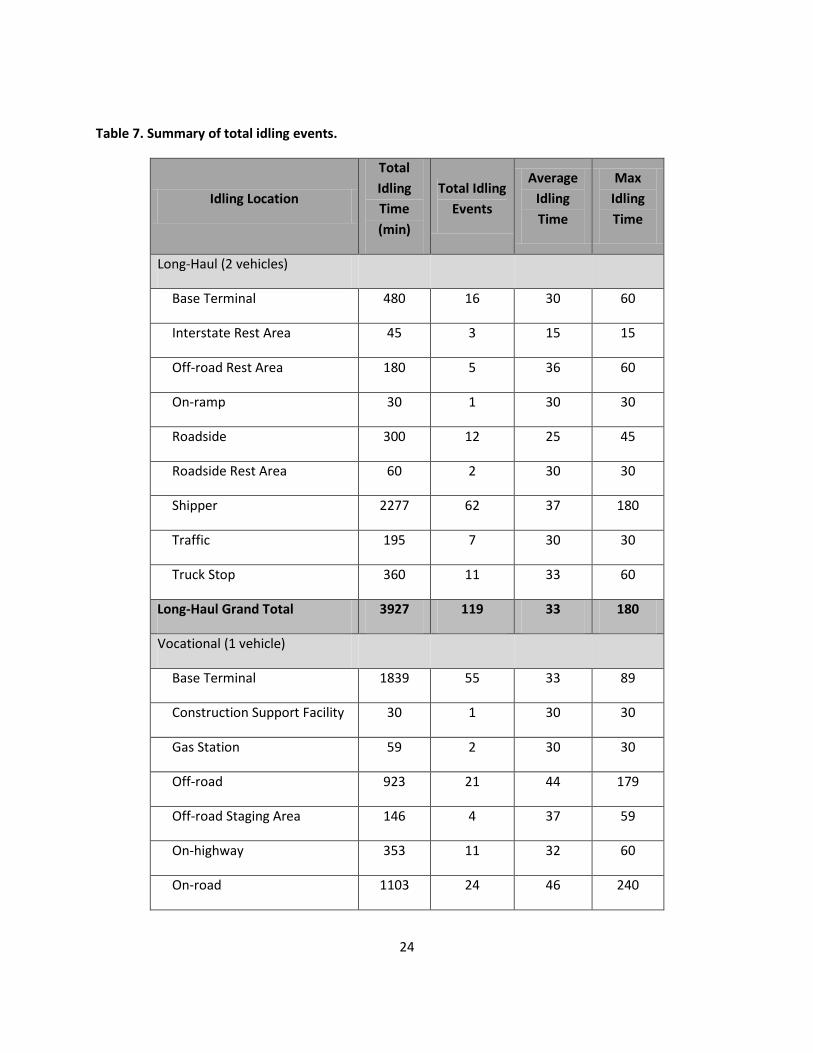
The analysis of the idling events showed the vocational truck idled twice as long as a single long-haul
truck. As shown in Table 7, the long-haul trucks tended to idle during their rest periods (i.e., rest areas,
truck stops, and shippers). The long-haul trucks attempted to minimize all idling events. On average,
most idling events did not exceed a single ping rate. For the idling event that reached 180 min, the truck
was parked at a shipping yard in Las Vegas, Nevada, during the middle of the day. In comparison, the
vocational truck idled frequently. A review of the data suggests the truck’s engine ran during the entire
trip. Though the average idle time mirrors the time calculated for the long-haul tractors, the vocational
tractor had twice the idling events. This can be attributed to the vocational truck operating continuously
between two or three locations during a single trip.
24
Table 7. Summary of total idling events.
Idling Location
Total
Idling
Time
(min)
Total Idling
Events
Average
Idling
Time
Max
Idling
Time
Long-Haul (2 vehicles)
Base Terminal 480 16 30 60
Interstate Rest Area 45 3 15 15
Off-road Rest Area 180 5 36 60
On-ramp 30 1 30 30
Roadside 300 12 25 45
Roadside Rest Area 60 2 30 30
Shipper 2277 62 37 180
Traffic 195 7 30 30
Truck Stop 360 11 33 60
Long-Haul Grand Total 3927 119 33 180
Vocational (1 vehicle)
Base Terminal 1839 55 33 89
Construction Support Facility 30 1 30 30
Gas Station 59 2 30 30
Off-road 923 21 44 179
Off-road Staging Area 146 4 37 59
On-highway 353 11 32 60
On-road 1103 24 46 240
25
Quarry Site 234 8 29 30
Vocational Grand Total 4687 126 37 240
Grand Total 8614 245 35 240
The case study suggests several things. First, the driver of the first long-haul tractor tried to minimize
idling. The driver tended to idle for no more than 15 min in a single location. During the longer idling
events, the idling location tended to be in hotter climates during the peak hours of the day. Second,
vocational trucks experience longer and more frequent idling events due to the nature of the job. The
vocational truck tended to idle for at least an hour, and frequently left the engine running during an
entire shift. Third, idling times are affected by the weather conditions and operating locations. The
driver of the second long-haul tractor had varying degrees of idling. This trucker frequently traveled
through Arizona and Nevada. The driver tended to idle at shipper locations, with some idle events
reaching 90 min. The trucker conducting business in the Southwest would be exposed to high
temperatures during layovers at the shipping yards.
26
CHAPTER 4
Conclusions and Suggestions
The test plan, as outlined, ensures minimal impact to the fleets under test. The proposed layout
of the test plan retrieves information from the RVM companies’ databases and does not require the
installation of any additional equipment by the test facilitator.
4.1 Observations
The case studies presented several elements to consider during the full idling study.
The research team understands the importance of identifying reliable sources for the data. The team
has conducted several other field tests that required extensive interaction with the participants to
obtain valid test data. The team understood the need to secure willing participants early in the test plan
development. Due to the time constraints with the case study, the researchers continued to work with
the other participant while trying to secure additional data sources. The procurement of data from the
commercial industry, outside of Class 8 vehicles, may prove to be difficult. Small RVM companies may
not have a vested interest in assisting in an industry study of idling. As a result, the research team could
not secure a participant for the Class 2b through Class 7 fleets. The team recommends directly
contacting Class 2b through Class 7 fleets and requesting their data. The fleets may be more willing to
provide data, and the RVM companies will be required to provide the data, if requested by their clients.
The location data for the case study was obtained by reviewing a map for each individual idling instance
and assigning an appropriate designation for each idling event. The process proved to be labor intensive
and impractical for larger datasets. The research team reviewed the data available from other RVM
companies and determined idling reports would provide an approximate address for the idling location.
Similarly, the data would require manipulation to standardize idling locations. Therefore, the
researchers recommend that a locational database be developed during the initial stages of the idling
project. The database would be developed as the developer assigns idling locations. As found during a
review of the case study data, drivers frequently return to specific locations to idle, such as rest areas,
shippers, and base terminals. As the location database is populated, the location parameter in the idling
table can be populated through a standard “find and replace” function.
The case study corrected the estimated cost to implement the final idling study. The original cost
estimate for equipment was based on a streaming set of idling data. As a result, the research team
projected the need for more than 2 GB of data per tractor, and more than 20 TB of data storage. If the
datasets are provided as individual idling events, the researchers estimate that the data storage needs
will be reduced to 1.4 TB. This level of storage can be accomplished via simple external hard drives with
the current state of memory storage technology.
During the review of the case study idling data, the research team noted high ping rates for some
vehicles. The review showed that longer ping rates on the vehicles tended to falsely represent total
27
idling time. For example, the vocational truck had a ping rate of 30 min. For tractors with the higher ping
rate, the team found it difficult to determine if a tractor had been idling continuously between the 30
min ping times. A continuous idling event was noted if the tractor had not moved from a location during
the previous 30 min. In some instances, the truck would be idling at each 30-min interval, but a review
of the idling location showed the vehicle had moved. As a result, the team recommends requesting ping
rates of approximately 10 min. The team researched other RVM companies and noted they were able to
monitor the client’s vehicles on a varying scale, down to 1-min intervals. The ping rate is essential for
collecting accurate idling data. The idling time cannot be estimated any lower than the minimum ping
rate. For example, each time the vocational truck idled, the database noted 30 min of idling. RVM
companies recommended interviewed fleets monitor vehicles for idling in excess of 10 min. Therefore, a
similar ping rate is recommended.
4.2 Cost Estimation
Table 8 presents the cost for the study. The cost breakdown is based on the information provided within
this report. Costs will increase or decrease based on the equipment purchased, the sample size, and the
number of RVM companies used.
Data collection results in the largest cost element. The table provides approximate values for the
collection and storage of data for 9,000 vehicles for 365 days.
Table 8. Truck idling scoping study price breakdown.
Price Unit Total
Data Collection*
Data files
(distributed among three vendors) $10,000 3 $30,000*
Data Storage
Server –
Dell Power Edge T610, Enhanced $5,359 1 $ 5,359*
Software –
Microsoft SQL Server 2008 RS $2,500 1 $ 2,500
Database Development
Database Development $150 200 $ 30,000
Total $67,859
28
Note: Items marked with an asterisk (*) indicate cost is dependent on final sample size.
4.3 Conclusion
The goal of this study is to provide a detailed roadmap for the collection of truck idling data that can
then be implemented as needed. Because this study includes case studies that are designed to validate
and refine the proposed methodology, the applicability of results to practice has been indicated. This
study will generate data about an activity (truck idling) that is poorly understood, but has implications
on key issues including climate change, energy security, and the economic health of the freight transport
sector. This study is also unique in scale (addressing the full range of trucks, from Class 2B to Class 8) and
in its data collection methods, which will rely on data collected from RVM companies versus driver
interviews or onsite observations.
The information gleaned from the database should be useful for various entities of the trucking industry,
including academic researchers, nonprofit organizations (especially those active in the environmental
and energy arenas), government agencies (local, state, and federal), industry associations, and private
corporations (including manufacturers of truck engines, chassis, and powertrain components). In
addition to implementing this test plan, the test facilitator could perform a series of queries on the idling
database (additional costs to be incurred). Examples of idling analyses that could be performed include
the following:
Average number of hours of idling, by class,
Average number of hours of idling, by idling location,
Average number of hours of idling, by cab type, and
Average number of hours of idling, by region.
At the completion of the database development, and the suggested analysis, the trucking industry
should have a de facto standard for trucking idling. Researchers may continue to analyze the database to
develop further idling suggestions. Future research can be based on a real-world understanding of idling,
and any number and variety of tests could be performed on the database.
29
Acronyms and Abbreviations
ECM electronic control module FMCSA Federal Motor Carrier Safety Administration FTP file transfer protocol GB gigabyte GPS global positioning system GVWR gross vehicle weight rating HOS hours of service LTL less-than-truckload MB megabyte PTO power take-off RVM remote vehicle monitoring SaaS Software as a Service TB terabyte VIN vehicle identification number