123
City of Fontana County of San Bernardino State of California Truck Trip Generation Study August 2003
| Date post: | 08-Jul-2018 |
| Category: |
Documents |
| Upload: | hoangtuyen |
| View: | 214 times |
| Download: | 1 times |

City of Fontana County of San BernardinoState of California
Truck Trip Generation Study
August 2003

TRUCK TRIP GENERATION STUDY
CITY OFFICIALS
Honorable Mark Nuaimi, Mayor Honorable Janice Rutherford, Mayor Pro Tem Honorable John B. Roberts, Council Member Honorable Josie Gonzales, Council Member
Honorable Acquanetta Warren, Council Member Kenneth R. Hunt, City Manager
PROJECT MANAGERS
Raymond Bragg, Director of Redevelopment & Special Projects Paul Balbach, Strategic Transportation Engineering Manager
William G. Bryant, P.E., Project Manager DMJM+Harris
PREPARED BY
Transportation Engineering and Planning, Inc. Craig Neustaedter, P.E., AICP
Nathan Neustaedter Christine Gamatero, E.I.T.
Linda Fuller, Linda Fuller Communications
Traffic Counts by
Counts Unlimited
Barbara Sackett, President i

Truck Trip Generation Study
Table of Contents 1. Purpose and Background ..............................................................................................................................................................1 2. Definition of Terms ........................................................................................................................................................................2 Land Use Categories ...............................................................................................................................................................2 Vehicle Classifications .............................................................................................................................................................2 Statistical Terms.......................................................................................................................................................................3 Miscellaneous Terms ...............................................................................................................................................................4 3. Methodology ..................................................................................................................................................................................5 Site Selection ...........................................................................................................................................................................5 Site Traffic Counts....................................................................................................................................................................5 Calculation of Trip Generation Rates and Equations ...............................................................................................................6 Criteria for Recommending Trip Generation Rates and Equations..........................................................................................7 4. How to Use this Manual.................................................................................................................................................................8 Using Trip Generation Rates and Equations............................................................................................................................8 Selection of Appropriate Trip Generation Rate or Equation.....................................................................................................9 Using Vehicle Mix and Enter/Exit Splits ...................................................................................................................................9 Using Enter/Exit Splits..............................................................................................................................................................9 Application of Vehicle Mix and Enter/Exit Split Factors..........................................................................................................10 5. Summary of Recommended Trip Generation Rates and Equations ...........................................................................................11 Light Warehouse....................................................................................................................................................................11 Heavy Warehouse..................................................................................................................................................................12 Light Industrial........................................................................................................................................................................13 Heavy Industrial .....................................................................................................................................................................14 Industrial Park ........................................................................................................................................................................15 Truck Sales and Leasing........................................................................................................................................................16 Used Truck Sales...................................................................................................................................................................17 Truck Terminals .....................................................................................................................................................................18 Truck Stops ............................................................................................................................................................................19 6. Vehicle Mix and Enter/Exit Splits by Land Use Category ............................................................................................................20 Light Warehouse....................................................................................................................................................................20 Heavy Warehouse..................................................................................................................................................................21 Light Industrial........................................................................................................................................................................22 Heavy Industrial .....................................................................................................................................................................23
ii

Truck Trip Generation Study
Industrial Park ........................................................................................................................................................................24 Truck Sales and Leasing........................................................................................................................................................25 Used Truck Sales...................................................................................................................................................................26 Truck Terminals .....................................................................................................................................................................27 Truck Stops ............................................................................................................................................................................28 7. Trip Generation Analysis by Land Use Category ........................................................................................................................29 Light Warehouse....................................................................................................................................................................29 Heavy Warehouse..................................................................................................................................................................35 Light Industrial........................................................................................................................................................................41 Heavy Industrial .....................................................................................................................................................................47 Industrial Park ........................................................................................................................................................................53 Truck Sales and Leasing........................................................................................................................................................59 Used Truck Sales...................................................................................................................................................................65 Truck Terminals .....................................................................................................................................................................71 Truck Stops ............................................................................................................................................................................77 Appendices A. Surveyed Sites ............................................................................................................................................................... A-1 B. Analysis of 24-Hour Driveway Counts ............................................................................................................................ B-1 C. Peak Arterial Location ....................................................................................................................................................C-1
iii

Truck Trip Generation Study
iv
CITY OF FONTANA Location The City of Fontana is located in Southern California in the southwestern portion of San Bernardino County. Fontana is situated approximately 50 miles east of the City of Los Angeles, approximately 110 miles north of the City of San Diego, and approximately 15 miles west of the Cities of Riverside and San Bernardino. The City is bordered to the north by the San Bernardino National Forest, to the east by the City of Rialto, and to the west by the City of Rancho Cucamonga, and by the City of Ontario, the Jurupa Hills and the unincorporated areas of Riverside County located to the south. The region in which Fontana is located is often referred to as the Inland Empire. History In 1913, the town site of Fontana was officially founded by A.B. Miller between Foothill Boulevard and the Santa Fe railroad line. Over 4,000 people from the local area showed up on June 7, 1913, to celebrate the opening of the town site. The first three prominent buildings erected in the town site, the grammar school, packing house, and Pacific Electric Railway Depot, were constructed in 1914. During the period extending from 1915 through 1920, agricultural activity in the region was extremely successful. During this time, water development ensued and the planting of citrus and deciduous orchards expanded. The orchards produced numerous varieties of oranges, along with lemons and seedless grapefruit. The Fontana Development Company continued to increase the acreage being planted and, by the end of 1920, approximately 5,000 acres of citrus orchards and approximately 12,000 acres of deciduous orchards had been planted. In addition, approximately 1,000 acres of peanuts, barley, sweet potatoes, hay, and the like had been cultivated, and grapes, poultry, and swine were also
leading commodities. Diversifications of the agricultural industry in the Fontana area, in addition to the entire Southern California region, were in no small part due to the efforts of A.B. Miller. The popularity of Fontana as a prime location for establishing an orchard, vineyard, or poultry house led to a dramatic rise in the population within the community. From 1924 to 1926, the City of Fontana doubled in size, reaching an estimated population of 4,200 citizens. Although the reliance on agriculture and livestock would dominate Fontana until the early 1940s, economic change was on the horizon. In 1942, the economic focus of the City of Fontana was shifted with the opening of the Kaiser Steel Mill. By the end of the 1940s, there were over 8,000 people employed by Kaiser Steel in Fontana, with a payroll of approximately $38 million (approximately $262 million in year 2000 dollars, when adjusted for inflation). In an attempt to keep pace with Fontana’s rapidly growing population, residential development also flourished and, during 1949, building permits totaled $16,197,525 (approximately $112 million in year 2000 dollars). The result of this industrial boom meant that the orchards, which had once dominated the Fontana landscape, were being replaced by companies such as the Basalt Rock Company (manufacturers of steel and concrete pipe), the Western Steel Company, the Taylor Forge and Pipe Works, the Graver Tank and Manufacturing Company (manufacturers of steel tanks), and the West Coast Loading Corporation (manufacturers of flares). The City of Fontana was incorporated June 25, 1952, during this boom in the economy. By 1954, Fontana’s population totaled approximately 15,000 residents. The economy of Fontana continued to be dominated by the steel industry until the late 1970s, when Kaiser Steel began to reduce production and trimmed their

Truck Trip Generation Study
v
workforce. In 1984, Kaiser Steel ceased production altogether at the Fontana plant, but the plate steel and rolling mill plant was acquired by the California Steel Industry (CSI) and is still in operation today employing a work force of over 1,000. Present Today the City of Fontana covers approximately 36 square miles, while its sphere of influence encompasses an area of approximately 56 square miles. According to the U.S. Bureau of the Census, the population of Fontana has risen from 87,535 in 1990 to 139,100 in 2002, which is an increase of over 47 percent. The California Department of Finance estimates that the 2003 population in Fontana has grown to 145,770, which is an increase of over 970 percent since 1954. The economy of Fontana has gone through many permutations since the early reliance of the economy on agriculture until the early 1940s, which was followed by the dominance of the steel industry until the 1980s. Today the economy is supported by the many distribution centers located in Fontana because of the City’s location to major good movement transportation routes like: Interstate 10; Interstate 15; Interstate 60; the recently completed Interstate 210; the Burlington Northern and Santa Fe and Union Pacific Railroads; the Ontario International Airport; and, the ports of Los Angeles and Long Beach. These distribution centers include Target, Sears, Napa Auto Parts, Mercedes Benz, Big 5 Sporting Goods, and Home Shopping Network. In addition, Metrolink provides local rail connection to surrounding communities throughout Southern California.

1. PURPOSE AND BACKGROUND

Truck Trip Generation Study
1
PURPOSE AND BACKGROUND A truck trip generation study was completed for the City of Fontana in 1992. This was an innovative project, with the findings from the study published in the ITE Journal in 1994. This was one of the first published studies on truck trip generation. However, the study was completed in the early 1990s when California was in the midst of a severe recession. The City of Fontana initiated this current study to determine truck trip generation data to reflect more normal economic conditions. Extensive areas have been developed as industrial and warehouse uses both within and adjacent to Fontana. These uses generate a high volume of large truck traffic that significantly impacts local area freeways and arterials. The purpose of this study is to evaluate the vehicle trip generation characteristics of several land use categories that typically generate significant volumes of truck traffic. The study presents equations that are to be used to predict the vehicle trip generation characteristics for the land use categories that have been evaluated. The methodology of this study is structured to follow procedures of the ITE trip generation manual. This study contributes to the relatively limited information provided by the ITE trip generation manual on truck internal land uses by addressing several land uses that are not covered by this manual and by presenting vehicle trip generation rates with break down by axles. The study is based solely on locally collected data. The study results may be most applicable to local conditions in Southern California. SIGNIFICANCE TO THE INLAND EMPIRE The Inland Empire area has had a significant growth over the last two decades in truck intense land use developments. The strategic location of the Inland Empire, well served by major East-West and North-South national and international freight lines, both rail, freeway and air
freight airports, draws national and international freight carriers, warehousing and logistic industries to locate in the Inland Empire. The Interstate 10 and Interstate 15 confluence has the highest number of trucks in the nation, and some of the regional arterials have 30% to 40% truck traffic. The tremendous growth in truck intense land uses in the Inland Empire area has created a major impact on the regional and local circulation system. Many two-lane rural routes which once served local citrus farms or vineyards, now serve as major truck routes. Most of these roads do not have the traffic handling capacity and the infrastructure capacity to accommodate this shift in land use, particularly the increase in truck traffic. Therefore the need arises for studies such as this one, in order to provide a valuable tool to public agencies staff and officials in planning land use developments and roadway infrastructure development capable of handling the area’s growth. Local governmental agencies such as the City of Fontana as well as regional transportation agencies, such as San Bernardino County Transportation Department, San Bernardino County Associated Governments (SANBAG), Riverside Transportation Commission (RCTC), CALTRANS, and Southern California Association of Governments (SCAG), all have a need to properly identify and forecast truck impacts to our highway system. This study has been conducted in consultations with these agencies. This study will be a primary tool in the preparation of Traffic Impact Analysis (TIA’s) for Congestion Management Plan (CMP) compliance in southern California, since it reflects trip making with local characteristics. The results of this study will be utilized in several regional and sub-regional transportation studies to help determine the impact of truck traffic on our circulation system. It is also anticipated that the data in this study will be incorporated in the Institute of Transportation Engineers (ITE) Trip Generation Manual.

2. DEFINITION OF TERMS

Truck Trip Generation Study
DEFINITION OF TERMS Land Use Categories Warehousing (ITE code 150) Warehouses are primarily devoted to the storage of materials; they may also include office and maintenance areas. Light warehouses are 100,000 square feet G. F. A. or less. Heavy warehouses are greater than 100,000 square feet G. F. A. General Light Industrial (ITE code 110) Light industrial facilities usually employ fewer than 500 persons and have an emphasis on activities other than manufacturing. Nevertheless, the distinction between light industrial and manufacturing (ITE code 140) is sometimes vague. Typical light industrial activities include printing plants, material testing laboratories, assemblers of data processing equipment, and power stations. All of the facilities surveyed are freestanding and devoted to a single use. General Heavy Industrial (ITE code 120) Heavy industrial facilities usually have a high number of employees per industrial plant and could also be categorized as manufacturing facilities (ITE code 140). The distinction between heavy industrial and manufacturing is vague. However, heavy industrial uses are limited to the manufacturing of large items. Industrial Park (ITE code 130) Industrial parks are areas containing a number of industrial or related facilities. They are characterized by a mix of manufacturing, service, and warehouse facilities with a wide variation in the proportion of each
type of use from one location to another. Many industrial parks contained highly diversified facilities, some with a large number of small businesses and others with one or two dominant industries. Truck Sales and Leasing (not an ITE category) Facilities included in this category are primarily for the sale and leasing of new heavy duty commercial vehicles, 10,000 GVW, or greater. Typically, the facilities are located along major arterials in either commercial or industrial areas. The facilities can also include maintenance services, part sales, and used truck sales. Used Truck Lots (not an ITE category) Facilities included in this category are similar to the category, truck sales and leasing, however, they are primarily for the sale of used heavy duty commercial vehicles (10,000 GVW, or greater). Typically, the facilities are located along major arterials in either commercial or industrial areas. The facilities can also include maintenance services, and part sales. Truck Terminal (ITE code 030) Truck terminals are facilities where goods are transferred between trucks, or trucks and railroads. Truck Stops (not an ITE category) The primary function of a truck stop is to provide fueling for truckers. Ancillary services include maintenance services, restaurants, and the sale of sundries. The general motoring public also extensively uses these facilities. Vehicle Classifications Passenger Vehicles (Pass Veh) Motorcycles, passenger cars, pickups, vans, and other two-axle, four tire vehicles. Included in this
2

Truck Trip Generation Study
class are campers, motorhomes, ambulances, minibuses, hearses, carryalls, including vehicles pulling recreational or other light trailers. Large 2 Axle (Lge 2 Ax) Buses, including all vehicles manufactured as passenger carrying vehicles with two axles and six tires, or three or more axles. Two-axle truck tractors without trailers. Two-axle, six-tire single unit trucks, including camping and recreational vehicles, motorhomes, and large step vans having two axles and dual rear tires. 3 Axle Three-axle, single-unit trucks. All vehicles on a single frame having three axles, including three-axle buses and tractors. 4+ Axle Four or more axle single unit trucks. Single trailer trucks (combos), including all vehicles consisting of two units, of which the pulling unit is a tractor or a single unit truck. Multi-trailer trucks (combos), including all vehicles consisting of three or more units of which the pulling unit is a tractor or a single unit truck. The most common truck in this category is the 5-axle 18 wheeler semi-tractor-trailer. Statistical Terms Independent Variable A physical and measurable unit describing the site generator that can be used to predict the value of the dependent variable (trip ends). In this study, four independent variables have been used. These are: number of employees, gross building area, acreage, and vehicle fueling positions (for truck stops only).
Dependent Variable The result of the trip generation equation, i.e., trip ends. Weighted Average Trip Rate The weighted average trip rate is calculated by summing all trip ends and all independent variable units (e.g. number of employees) and then dividing the sum of the trip ends by the sum of the independent variable units. This is the method preferred by ITE to calculate the average trip rate. Mean Trip Rate The average trip rate of the sample set. This is calculated by computing the trip rate for each site in the sample set, then summing the trip rates and dividing by the number of samples. Standard Deviation A measure of how widely dispersed the data points are around the calculated average. The lower in the standard deviation, meaning the less dispersion there is in the data, the better the data fit. In this study, the standard deviation has been calculated in relation to the mean trip rate. Regression Equation An equation expressing the relationship between the independent variable and the dependent variable. Linear Regression An equation that, when plotted, shows a linear relationship between the independent variable and the dependent variable. The equation is expressed in the following form: dependent variable = coefficient * independent variable + y intercept
3

Truck Trip Generation Study
Logarithmic Regression An equation that, when plotted, shows a curvilinear relationship between the independent variable and the dependent variable. The equation is expressed in the following form: dependent variable = y intercept * coefficient ^ independent variable r squared Also known as the "Coefficient of Determination". A measure of the variance in the dependent variable with the independent variable. As the r squared value increases towards 1.0, the better the correlation between the dependent and independent variable. In this study, a regression equation must have an r squared value of 0.8 or greater to be considered appropriate for use. Miscellaneous Terms Street Trip Rate This is the one-hour weekday trip generation rate for 7 a.m. to 8 a.m. and 5 p.m. to 6 p.m., and corresponds to the "average trip rate for the peak hour of the adjacent street traffic" from the ITE trip generation manual. These hours are the peak hours of traffic flow in the area of the surveyed sites. Site Trip Rate This is the vehicle trip generation rate during the hour of highest volume of traffic entering and exiting the surveyed site during the AM or PM hours. This corresponds to the "average trip rate for the peak hour of the generator." Gross Building Area This term corresponds to "gross floor area" as used in the ITE trip generation manual.
Vehicle Fueling Positions The number of vehicles that can be fueled simultaneously at a truck stop.
4

3. METHODOLOGY
Fontana TMC

Truck Trip Generation Study
METHODOLOGY Site Selection Most sites that were analyzed in the study are located in Fontana or adjacent areas in unincorporated San Bernardino County, Ontario, and Rancho Cucamonga. Only one site is located outside of this area; a truck stop, located in Palm Springs. The following criteria were considered in the selection of sites to be analyzed:
The site is freestanding. The site does not share parking areas or driveways with adjacent developments.
Cooperation of the site occupant. The site
occupant voluntarily agreed to participate in the study by allowing driveway counts, and provide information about the site such as the number of on-site employees.
Availability of data concerning the site.
Data were available from public records concerning site characteristics such as building gross floor area and acreage.
Site Traffic Counts Traffic counts for the study were collected in late 2002 by the firm of Counts Unlimited, Inc. of Moreno Valley, California. Traffic counting consisted of three tasks that are discussed as follows: 1) Midblock 24-hour Counts Midblock traffic counts were taken at 10 arterial locations using automatic traffic counters. These counts were taken for 24-hour periods, recorded in 15-minute increments. The purpose of these counts was to identify a.m. and p.m. peak hours of traffic on arterial streets in the area encompassing the sites that were analyzed. From these data, it was
determined that the peak hours with the highest traffic volumes are 7:00 to 8:00 a.m. in the morning, and 5:00 to 6:00 p.m. in the afternoon. 2) Driveway 24-hour Counts Driveway traffic counts were taken at the driveways of all sites except two truck stops. Automatic traffic counters (ATCs) were used to tabulate 24-hour counts, recorded in 15-minute increments. The purpose of these counts was to identify the a.m. and p.m. peak hours of total vehicle trip generation of each site. These counts were also used to estimate the daily (24-hour) total vehicle trip generation of each site. In addition, it was subsequently found that the ATCs were not accurately tabulating the total number of vehicles entering and exiting any individual site or driveway. The ATCs could not accurately tabulate vehicle classifications. Due to the high percentage of multi-axle vehicles, the ATCs consistently tabulated a greater number of vehicles than actually occurred. To correct this deficiency, driveway 24-hour counts were concurrently collected manually and with the ATCs at eight sites, and the results compared. This analysis showed that, on average, the manual counts were only forty-four (44) percent of the ATCs’ counts. The results of this analysis are shown in Appendix B. This factor was applied to the driveway 24-hour counts for all remaining sites that were not manually counted, for the purpose of calculating 24-hour trip generation rates. 3) Driveway Peak Period Counts Manual traffic counts were taken for each site driveway, except two truck stops. The counts were collected for a.m. and p.m. peak periods, and recorded in 15-minute increments. At a minimum,
5

Truck Trip Generation Study
these periods encompassed 7:00 a.m. to 8:00 a.m. and 5:00 p.m. to 6:00 p.m. plus the peak hours of site vehicle trip generation identified by the driveway 24-hour counts. The manual counts quantified entering and exiting trips. In addition, the manual counts quantified the following vehicle classifications: passenger vehicles, large 2-axle vehicles, 3-axle vehicles, and 4-axle vehicles or greater. Calculation of Trip Generation Rates and Equations A total of nine land use classifications were analyzed in this study. Except as noted, the following statistical information pertaining to trip generation rates were calculated for each land use classification:
Weighted average trip rate of the sample set Mean trip rate of the sample set Standard deviation of the sample set y intercept and coefficient of the linear
regression equation y intercept and coefficient of the logarithmic
regression equation r square value of the linear and logarithmic
regression equation Except for truck stops, trip generation statistics were calculated for three independent variables, including:
Number of employees Gross building area, measured in 1000 square
feet (KSF) Acres
The statistics were calculated for five periods:
Daily (24-hour) a.m. peak hour street p.m. peak hour street a.m. peak hour site p.m. peak hour site
For all periods, except daily, trip generation statistics were calculated for total vehicle trips (including passenger vehicles), and truck trips (excluding passenger vehicles). Trip generation statistics for daily truck trips were not calculated because vehicle classifications counts could not be obtained from the driveway 24-hour counts. According to the Institute of Transportation Engineers (ITE) 1, the weighted average trip rate is to be preferred over the mean trip rate. Sites in the sample set with a large variance from the mean have excessive influence over the average rate, therefore the weighted average trip rate is recommended. The mean trip rate is also reported for the purpose of measuring the size of the variance of the sample set, when compared to the standard deviation. LINEST and LOGEST functions of the Microsoft Excel software application were used to calculate y intercept, coefficients, and r square statistics for the linear and logarithmic regression equations. Statistical data for linear regression and logarithmic regression equations were not reported if there were less than four sites in the sample set, or if there was a 0 value reported in the sample set. Truck Stops Trip generation statistics were calculated for two independent variables, the number of fueling positions and acres. The sample set for truck stops included two sites for which there were only p.m. peak period driveway counts. Due to this limitation in available count data, trip generation regression statistics were computed for the following only:
p.m. peak hour street p.m. peak hour site
1 Institute of Transportation Engineers, “Trip Generation 6th Edition, An Informational Report of the Institute of Transportation Engineers,” Volume 3, 1997, p. 17.
6

Truck Trip Generation Study
However, weighted average trip rate and mean trip rate of truck stops were computed for all five periods. Criteria for Recommending Trip Generation Rates and Equations A list of recommended trip generation rates is reported in the section of this report entitled, "Summary of Recommended Trip Generation Rates." For all land use classifications, the weighted average trip rates are reported. Any regression equation which has an r square value of .80 or greater is also reported. An r square value of .80 or greater indicates a high degree of correlation between the independent variable (number of employees, gross floor area, acres, or number of fueling positions) and the dependent variable (total vehicle or truck trips). Regression equations that have an r square value less than .80 are not reported. Regression equations that have an r square value of .50 or greater to less than .80 are identified as marginal.
7

4. HOW TO USE THIS MANUAL

Truck Trip Generation Study
HOW TO USE THIS MANUAL Information in this report is to be used to compute site trip generation of total vehicles and large trucks for land uses included in the following categories:
Light Warehousing Heavy Warehousing General Light Industrial General Heavy Industrial Industrial Park Truck Sales and Leasing Used Truck Sales Truck Terminals Truck Stops
The main body of this report includes Chapters 5, 6, and 7 which contain the results of the trip generation analysis for the land use categories listed above. Chapters 5 and 6 contain summaries of recommended data to be used to calculate total vehicle and large truck trip generation. Chapter 7 contains more detailed information on the analysis of each land use category addressed in this report. In addition, the appendix lists detailed information on each site that has been included in the study. Using Trip Generation Rates and Equations For all land use classifications, except truck stops, trip generation rates and equations are reported for three independent variables. These are: number of employees, gross building area, and acres. For truck stops, the only independent variable is number of fueling positions. Rates and equations for total vehicle trip generation are reported for five time periods:
a.m. peak hour - street p.m. peak hour - street a.m. peak hour - site p.m. peak hour - site Daily
Rates and equations for large truck trip generation are reported for all the same periods, except the daily time period. Trip generation has been computed by the following methods:
Weighted average trip rate Linear regression equation Logarithmic regression equation
Examples of Trip Generation Rates and Equations Example: 25,000 square feet gross building area,
Used Truck Sales, a.m. peak hour (street)
Equation Form Equation Result
- a.m. peak hour trips
Weighted average trip rate
Number of trips = weighted average trip rate * X
25 * 1.132 28
Linear regression
Number of trips = coefficient * X + y intercept
.932 * 25 + 5.537
29
Logarithmic regression
Number of trips = y intercept * coefficient ^ X
10.979 * 1.027 ^ 25
21
The results of the computations for all land use classifications, vehicle classifications, independent variables, and time periods are reported in Chapter 7. The recommended trip generation rates and equations are summarized in Chapter 5. In all cases, weighted average trip rates are reported in Chapter 5. Also, linear regression and logarithmic regression equations are reported when a high correlation has been determined to exist between the dependent and independent variable as measured by the r square statistic.
8

Truck Trip Generation Study
Selection of Appropriate Trip Generation Rate or Equation Guidance for the selection of an appropriate trip generation rate or equation is found in Chapter 3, "Guidelines for Estimating Trip Generation" of the Trip Generation Handbook, An ITE Recommended Practice, Institute of Transportation Engineers, March 2001. Users are cautioned to not use regression equations when the independent variable is small and the equation’s y intercept is a large positive or negative value. Also, logarithmic equations may not be appropriate when the independent variable is greatly outside the range of the size of the sample set from which the equations are derived. Using Vehicle Mix and Enter/Exit Splits Vehicle mix and enter/exit splits by land use classifications are summarized in Chapter 6. These data are also in Chapter 7. Vehicle mix is expressed as a percentage of each vehicle classification that has been counted. Vehicle mix has been calculated for two conditions, which are as follows:
Condition #1: mix of all large trucks Example: Lge 2 Ax 3 Axle 4 + Axle Total %age: 26.3 42.9 30.8 100
Condition # 2: mix of all vehicles
Example: Pass Veh Lge 2 Ax 3 Axle 4 + Axle Total %age: 73.7 4.9 12.1 9.2 100
Condition #1 mix is to be applied to computation of large truck trip generation for a.m. and p.m. peak hours. Condition #2 mix is to be applied to computation of the total daily vehicle trip generation. Using Enter/Exit Splits Enter/exit splits are expressed as percentages for four time periods, which are the following:
a.m. peak hour - site p.m. peak hour - site a.m. peak hour - street p.m. peak hour - street
For each period, splits are provided for total vehicles and large trucks. For the daily period, it is assumed that the split between entering and exiting trips is typically a 50/50 split.
9

Truck Trip Generation Study
Application of Vehicle Mix and Enter/Exit Split Factors
Example: 25,000 square feet gross building area, Used Truck Sales Calculation of a.m. peak hour (street) total vehicles enter/exit split: 1. Calculate a.m. peak hour (street) total vehicle trip generation: Linear regression equation: .932 * 25 + 5.537 = 29 vehicle trips 2. Calculate enter/exit split (street): Enter: Exit: %age: 68.85 31.15 Vehicle trips: 20 9 Calculation of a.m. peak hour (street) large truck vehicle mix and enter/exit split: 1. Calculate a.m. peak hour (street) large truck trip generation: Linear regression: .387 * 25 - 1.172 = 9 large truck trips 2. Calculate vehicle mix (Condition #1 - large truck mix): Lge 2 Ax 3 Axle 4 + Axle Total %age: 26.3 42.9 30.8 100 Large truck trips: 2 4 3 9 3. Calculate enter/exit split (street): Enter: Exit: %age: 48.78 51.22 Vehicle trips: 4 5 Calculation of daily total vehicle mix and enter/exit split: 1. Calculate daily total vehicle trip generation: Linear regression: 40.401 * 25 + 5.993 = 1016 vehicle trips 2. Calculate vehicle mix (Condition #2 -total vehicle mix): Pass Veh Lge 2 Ax 3 Axle 4 + Axle Total %age: 73.7 4.9 12.1 9.2 100 Vehicle trips: 749 50 123 93 1,015 3. Calculate enter/exit split, assume 50/50 split a. Total vehicle: Enter: Exit: %age: 50 50 Vehicle trips: 508 508 b. Large truck: Enter: Exit: %age: 50 50 Large truck trips: 133 133
10

5. SUMMARY OF RECOMMENDED TRIP GENERATION RATES AND EQUATIONS

Truck Trip Generation Study
SUMMARY OF RECOMMENDED TRIP GENERATION RATES AND EQUATIONS Classification: Light Warehouse
Period Weighted
Average Trips
Linear Regression
Logarithmic Regression
Weighted Average Trips
Linear Regression
Logarithmic Regression
Weighted Average
Trips
Linear Regression
Logarithmic Regression
Daily Total Vehicles 3.713*X Marginal Marginal 1.659*X Marginal 4156.615*.991^X 35.874*X Marginal MarginalAM Street Total Vehicles 0.273*X n.a. n.a. 0.122*X Marginal Marginal 2.637*X Marginal Marginal Trucks 0.051*X -0.041+10.328 15.349*0.989^X 0.023*X Marginal n.a. 0.497*X Marginal MarginalPM Street Total Vehicles 0.201*X n.a. n.a. 0.090*X n.a. n.a. 1.946*X n.a. n.a. Trucks 0.047*X n.a. Marginal 0.021*X 0.051*X-7.461 0.463*1.010^X 0.454*X n.a. n.a.AM Site Total Vehicles 0.327*X n.a. n.a. 0.146*X n.a. n.a. 3.156*X Marginal Marginal Trucks 0.065*X n.a. Marginal 0.029*X n.a. n.a. 0.627*X Marginal MarginalPM Site Total Vehicles 0.282*X 0.221*X+6.813 13.375*1.007^X 0.126*X n.a. n.a. 2.726*X Marginal Marginal Trucks 0.074*X n.a. n.a. 0.033*X n.a. n.a. 0.713*X Marginal Marginal
NO. OF EMPLOYEES ACRESGROSS BUILDING AREA (KSF)
Note: All symbols are per Microsoft Excel (+, -, *, and ^) add, subtract, multiply and raise to a power. “X” is the independent variable.
11

Truck Trip Generation Study
SUMMARY OF RECOMMENDED TRIP GENERATION RATES AND EQUATIONS (Cont’d) Classification: Heavy Warehouse Period Weighted
Average Trips
Linear Regression
Logarithmic Regression
Weighted Average
Trips
Linear Regression
Logarithmic Regression
Weighted Average
Trips
Linear Regression Logarithmic Regression
Daily Total Vehicles 4.657*X n.a. n.a. 3.547*x n.a. n.a. 69.959*X n.a. n.a.AM Street Total Vehicles 0.091*X Marginal n.a. 0.070*X 0.032*X+21.235 Marginal 1.373*X 0.589*X+22.708 Marginal Trucks 0.034*X 0.021*X+6.025 8.090*1.001^X 0.026*X 0.016*X+5.638 7.929*1.001^X 0.518*X 0.301*X+6.291 8.220*1.017^XPM Street Total Vehicles 0.095*X 0.054*X+17.889 22.051*1.001^X 0.073*X 0.042*X+17.592 Marginal 1.433*X 0.771*X+19.178 Marginal Trucks 0.034*X Marginal n.a. 0.026*X 0.023*X+1.584 Marginal 0.509*X 0.419*X2.609 MarginalAM Site Total Vehicles 0.309*X 0.268*X+17.625 50.347*1.002^X 0.235*X 0.215*X+11.213 48.177*1.001^X 4.637*X 3.951*X+19.862 50.856*1.025^X Trucks 0.040*X n.a. n.a. 0.030*X n.a. n.a. 0.596*X n.a. n.a.PM Site Total Vehicles 0.417*X 0.390*X+11.980 Marginal 0.318*X 0.323*X-2.803 49.975*1.002^X 6.268*X 5.902*X+10.616 50.560*1.030^X Trucks 0.044*X 0.021*X+9.850 Marginal 0.033*X 0.016*X+10.004 Marginal 0.656*X 0.291*X+10.585 Marginal
NO. OF EMPLOYEES ACRESGROSS BUILDING AREA (KSF)
Note: All symbols are per Microsoft Excel (+, -, *, and ^) add, subtract, multiply and raise to a power. “X” is the independent variable.
12

Truck Trip Generation Study
SUMMARY OF RECOMMENDED TRIP GENERATION RATES AND EQUATIONS (Cont’d) Classification: Light Industrial Period Weighted
Average Trips
Linear Regression
Logarithmic Regression
Weighted Average
Trips
Linear Regression
Logarithmic Regression
Weighted Average
Trips
Linear Regression
Logarithmic Regression
Daily Total Vehicles 8.046*X 9.322*X-55.491 64.160X1.035^X 11.744*X Marginal n.a. 37.313*X 35.607*X+16.007 87.895*1.132^XAM Street Total Vehicles 0.466*X Marginal Marginal 0.679*X n.a. n.a. 2.159*X n.a. Marginal Trucks 0.184*X n.a. n.a. 0.268*X n.a. n.a. 0.853*X n.a. n.a.PM Street Total Vehicles 0.299*X Marginal Marginal 0.436*X 0.193*X+7.240 8.152*1.013^X 1.386*X Marginal 6.258*1.070^X Trucks 0.069*X 0.093*X-1.026 0.570*1.034^X 0.101*X 0.056*X+1.323 Marginal 0.320*X 0.329*X-.090 0.835*1.122^XAM Site Total Vehicles 0.787*X 1.004*X-9.410 7.306*1.032^X 1.149*X 0.615*X+15.911 Marginal 3.651*X 3.729*X-0.725 9.947*1.119^X Trucks 0.224*X n.a. n.a. 0.327*X Marginal 15.086*0.977^X 1.039*X n.a. n.a.PM Site Total Vehicles 1.069*X 1.224*X-6.744 12.310*1.028^X 1.560*X 0.742*X+24.373 26.078*1.015^X 4.957*X 4.345*X-5.749 16.771*1.098^X Trucks 0.201*X n.a. n.a. 0.294*X n.a. n.a. 0.933*X n.a. n.a.
NO. OF EMPLOYEES ACRESGROSS BUILDING AREA (KSF)
Note: All symbols are per Microsoft Excel (+, -, *, and ^) add, subtract, multiply and raise to a power. “X” is the independent variable.
13

Truck Trip Generation Study
SUMMARY OF RECOMMENDED TRIP GENERATION RATES AND EQUATIONS (Cont’d) Classification: Heavy Industrial
Period Weighted
Average Trips
Linear Regression
Logarithmic Regression
Weighted Average Trips
Linear Regression
Logarithmic Regression
Weighted Average
Trips
Linear Regression
Logarithmic Regression
Daily Total Vehicles 3.787*X n.a. n.a. 7.541*X n.a. n.a. 71.607*X n.a. n.a.AM Street Total Vehicles 0.237*X n.a. n.a. 0.473*X n.a. n.a. 4.490*X n.a. n.a. Trucks 0.105*X n.a. n.a. 0.209*X n.a. n.a. 1.985*X n.a. n.a.PM Street Total Vehicles 0.158*X Marginal Marginal 0.315*X Marginal n.a. 2.993*X Marginal n.a. Trucks 0.058*X n.a. n.a. 0.116*X n.a. n.a. 1.100*X n.a. n.a.AM Site Total Vehicles 0.352*X 0.177*X+27.122 28.109*1.003^X 0.701*X n.a. n.a. 6.659*X n.a. n.a. Trucks 0.095*X n.a. n.a. 0.190*X n.a. n.a. 1.802*X n.a. n.a.PM Site Total Vehicles 0.278*X 0.059*X+33.809 33.793*1.001^X 0.553*X Marginal Marginal 5.254*X n.a. n.a. Trucks 0.126*X n.a. n.a. 0.251*X n.a. n.a. 2.382*X n.a. n.a.
NO. OF EMPLOYEES ACRESGROSS BUILDING AREA (KSF)
Note: All symbols are per Microsoft Excel (+, -, *, and ^) add, subtract, multiply and raise to a power. “X” is the independent variable.
14

Truck Trip Generation Study
SUMMARY OF RECOMMENDED TRIP GENERATION RATES AND EQUATIONS (Cont’d) Classification: Industrial Park
Period Weighted
Average Trips
Linear Regression
Logarithmic Regression
Weighted Average Trips
Linear Regression
Logarithmic Regression
Weighted Average
Trips
Linear Regression
Logarithmic Regression
Daily Total Vehicles 2.485*X 1.638*X+156.726 188.297*1.004^X 1.236*X Marginal Marginal 24.805*X n.a. MarginalAM Street Total Vehicles 0.191*X Marginal Marginal 0.095*X n.a. n.a. 1.902*X n.a. n.a. Trucks 0.078*X Marginal Marginal 0.039*X n.a. n.a. 0.782*X n.a. n.a.PM Street Marginal Total Vehicles 0.193*X Marginal Marginal 0.096*X n.a. n.a. 1.929*X n.a. n.a. Trucks 0.097*X Marginal Marginal 0.048*X n.a. n.a. 0.971*X n.a. n.a.AM Site Total Vehicles 0.265*X Marginal Marginal 0.132*X n.a. n.a. 2.644*X n.a. n.a. Trucks 0.053*X n.a. n.a. 0.026*X n.a. n.a. 0.526*X n.a. n.a.PM Site Total Vehicles 0.382*X 0.397*X-2.740 16.146*1.007^X 0.190*X n.a. n.a. 3.818*X n.a. n.a. Trucks 0.120*X Marginal Marginal 0.060*X n.a. n.a. 1.201*X n.a. n.a.
NO. OF EMPLOYEES ACRESGROSS BUILDING AREA (KSF)
Note: All symbols are per Microsoft Excel (+, -, *, and ^) add, subtract, multiply and raise to a power. “X” is the independent variable.
15
Truck Trip Generation Study
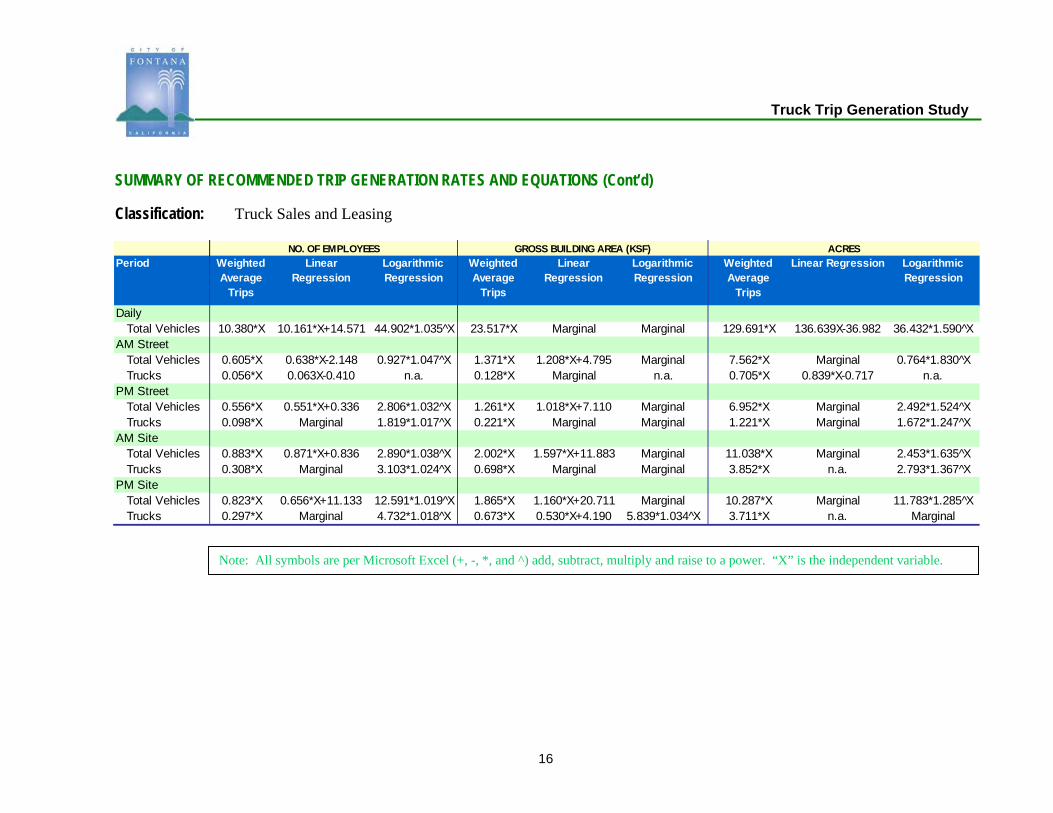
SUMMARY OF RECOMMENDED TRIP GENERATION RATES AND EQUATIONS (Cont’d) Classification: Truck Sales and Leasing
Period Weighted
Average Trips
Linear Regression
Logarithmic Regression
Weighted Average
Trips
Linear Regression
Logarithmic Regression
Weighted Average
Trips
Linear Regression Logarithmic Regression
Daily Total Vehicles 10.380*X 10.161*X+14.571 44.902*1.035^X 23.517*X Marginal Marginal 129.691*X 136.639X-36.982 36.432*1.590^XAM Street Total Vehicles 0.605*X 0.638*X-2.148 0.927*1.047^X 1.371*X 1.208*X+4.795 Marginal 7.562*X Marginal 0.764*1.830^X Trucks 0.056*X 0.063X-0.410 n.a. 0.128*X Marginal n.a. 0.705*X 0.839*X-0.717 n.a.PM Street Total Vehicles 0.556*X 0.551*X+0.336 2.806*1.032^X 1.261*X 1.018*X+7.110 Marginal 6.952*X Marginal 2.492*1.524^X Trucks 0.098*X Marginal 1.819*1.017^X 0.221*X Marginal Marginal 1.221*X Marginal 1.672*1.247^XAM Site Total Vehicles 0.883*X 0.871*X+0.836 2.890*1.038^X 2.002*X 1.597*X+11.883 Marginal 11.038*X Marginal 2.453*1.635^X Trucks 0.308*X Marginal 3.103*1.024^X 0.698*X Marginal Marginal 3.852*X n.a. 2.793*1.367^XPM Site Total Vehicles 0.823*X 0.656*X+11.133 12.591*1.019^X 1.865*X 1.160*X+20.711 Marginal 10.287*X Marginal 11.783*1.285^X Trucks 0.297*X Marginal 4.732*1.018^X 0.673*X 0.530*X+4.190 5.839*1.034^X 3.711*X n.a. Marginal
NO. OF EMPLOYEES ACRESGROSS BUILDING AREA (KSF)
Note: All symbols are per Microsoft Excel (+, -, *, and ^) add, subtract, multiply and raise to a power. “X” is the independent variable.
16

Truck Trip Generation Study
SUMMARY OF RECOMMENDED TRIP GENERATION RATES AND EQUATIONS (Cont’d) Classification: Used Truck Sales
Period Weighted
Average Trips
Linear Regres-
sion
Logarithmic Regres-
sion
Weighted Average
Trips
Linear Regression
Logarithmic Regression
Weighted Average
Trips
Linear Regression Logarithmic Regression
Daily Total Vehicles 20.874*X n.a. n.a. 20.039*X 20.671-17.428 137.430*1.033^X 67.996*X 94.942*X-219.206 102.271*1.159^XAM Street Total Vehicles 1.179*X n.a. n.a. 1.132*X 0.932*X+5.537 10.979*1.027^X 3.841*X 4.233*X-3.183 8.786*1.124^X Trucks 0.358*X n.a. n.a. 0.344*X 0.387*X-1.172 n.a. 1.168*X 1.753XX-4.759 n.a.PM Street Total Vehicles 1.481*X n.a. n.a. 1.422*X 1.122*X+8.283 13.124*1.028^X 4.825*X 5.024*X-1.622 Marginal Trucks 0.226*X n.a. n.a. 0.217*X Marginal n.a. 0.738*X Marginal n.a.AM Site Total Vehicles 1.764*X n.a. n.a. 1.694*X 1.155*X+14.876 22.051*1.020^X 5.747*X 5.323*X+3.450 18.125*1.097^X Trucks 0.594*X n.a. n.a. 0.571*X 0.503*X+1.855 n.a. 1.936*X 2.309X-3.030 n.a.PM Site Total Vehicles 1.575*X n.a. n.a. 1.513*X .973*X+14.899 Marginal 5.132*X 4.617*X+4.193 Marginal Trucks 0.481*X n.a. n.a. 0.462*X .396*X+1.812 Marginal 1.567*X 1.847X-2.272 Marginal
NO. OF EMPLOYEES ACRESGROSS BUILDING AREA (KSF)
Note: All symbols are per Microsoft Excel (+, -, *, and ^) add, subtract, multiply and raise to a power. “X” is the independent variable.
17

Truck Trip Generation Study
SUMMARY OF RECOMMENDED TRIP GENERATION RATES AND EQUATIONS (Cont’d) Classification: Truck Terminals
Period Weighted
Average TripsLinear Regres-
sionLogarithmic
Regres- sion
Weighted Average
Trips
Linear Regression Logarithmic Regression
Weighted Average
Trips
Linear Regression Logarithmic Regression
Daily Total Vehicles 3.428*X 1.844*X+480.332 Marginal 16.857*X Marginal n.a. 42.582*X 27.391*X+370.843 MarginalAM Street Total Vehicles 0.104*X n.a. n.a. 0.511*X n.a. n.a. 1.290*X n.a. n.a. Trucks 0.047*X n.a. n.a. 0.231*X n.a. n.a. 0.584*X n.a. n.a.PM Street Total Vehicles 0.122*X Marginal Marginal 0.600*X n.a. n.a. 1.516*X Marginal Marginal Trucks 0.062*X Marginal Marginal 0.304*X n.a. n.a. 0.768*X 0.408*X+8.790 MarginalAM Site Total Vehicles 0.157*X Marginal n.a. 0.770*X n.a. n.a. 1.946*X n.a. n.a. Trucks 0.059*X n.a. Marginal 0.288*X Marginal Marginal 0.727*X n.a. n.a.PM Site Total Vehicles 0.176*X n.a. n.a. 0.864*X n.a. n.a. 2.181*X Marginal n.a. Trucks 0.091*X n.a. n.a. 0.446*X n.a. n.a. 1.126*X n.a. n.a.
NO. OF EMPLOYEES ACRESGROSS BUILDING AREA (KSF)
Note: All symbols are per Microsoft Excel (+, -, *, and ^) add, subtract, multiply and raise to a power. “X” is the independent variable.
18

Truck Trip Generation Study
SUMMARY OF RECOMMENDED TRIP GENERATION RATES AND EQUATIONS (Cont’d) Classification: Truck Stops
Per io d W eig ht ed
A verag e T r ip sLinear
R eg ressio nLo g ar it hmic R eg ressio n
W eig ht ed A verag e T r ip s
Linear R eg ressio n Lo g ar it hmic R eg ressio n
Daily
Total Vehicles 34.565*X n.a. n.a. 319.730*X n.a. n.a.
AM Street
Total Vehicles 2.257*X n.a. n.a. 20.875*X n.a. n.a.
Trucks 1.189*X n.a. n.a. 11.000*X n.a. n.a.
PM Street
Total Vehicles 8.216*X n.a. n.a. 76.000*X n.a. n.a.
Trucks 4.811*X n.a. n.a. 44.500*X n.a. n.a.
AM Site
Total Vehicles 2.324*X n.a. n.a. 21.500*X n.a. n.a.
Trucks 1.878*X n.a. n.a. 17.375*X n.a. n.a.
PM Site
Total Vehicles 9.500*X n.a. n.a. 87.875*X n.a. n.a.
Trucks 5.000*X n.a. n.a. 46.250*X n.a. n.a.
N O. OF F U ELIN G POSIT ION S A C R ES
Note: All symbols are per Microsoft Excel (+, -, *, and ^) add, subtract, multiply and raise to a power. “X” is the independent variable.
19

6. VEHICLE MIX AND ENTER/EXIT SPLITS BY LAND USE CATEGORY

Truck Trip Generation Study
VEHICLE MIX AND ENTER/EXIT SPLITS BY LAND USE CATEGORY Classification: Light Warehouse
Recommended Large Truck Mix ( %)
Lge 2 Ax 3 Axle 4+ Axle Total
24.7 20.6 54.6 100.0
Pass Veh Lge 2 Ax 3 Axle 4+ Axle Total
80.3 5.2 4.5 10.0 100.0
Site Entering & Exiting
Total Enter Total Exit Large Truck Enter
Large Truck Exit
Total Enter Total Exit Large Truck Enter
Large Truck Exit
Split 73.97 26.03 62.07 37.93 23.81 76.19 45.45 54.55Street Entering & Exiting
Total Enter Total Exit Large Truck Enter
Large Truck Exit
Total Enter Total Exit Large Truck Enter
Large Truck Exit
Split 73.77 26.23 65.22 34.78 20.00 80.00 31.58 68.42
a.m. p.m.
a.m. p.m.
20

Truck Trip Generation Study
VEHICLE MIX AND ENTER/EXIT SPLITS BY LAND USE CATEGORY (Cont’d) Classification: Heavy Warehouse
Recommended Large Truck Mix ( %)
Lge 2 Ax 3 Axle 4+ Axle Total
16.95 22.71 60.34 100
Pass Veh Lge 2 Ax 3 Axle 4+ Axle Total
79.57 3.46 4.64 12.33 100
Site Entering & Exiting
Total Enter Total Exit Large Truck Enter
Large Truck Exit
Total Enter Total Exit Large Truck Enter
Large Truck Exit
Split 85.66 14.34 46.38 53.62 46.01 53.99 56.58 43.42Street Entering & Exiting
Total Enter Total Exit Large Truck Enter
Large Truck Exit
Total Enter Total Exit Large Truck Enter
Large Truck Exit
Split 50.94 49.06 45.00 55.00 30.72 69.28 45.76 54.24
a.m. p.m.
a.m. p.m.
21

Truck Trip Generation Study
VEHICLE MIX AND ENTER/EXIT SPLITS BY LAND USE CATEGORY (Cont’d) Classification: Light Industrial
Recommended Large Truck Mix ( %)
Lge 2 Ax 3 Axle 4+ Axle Total
32.7 17.9 49.4 100.0
Pass Veh Lge 2 Ax 3 Axle 4+ Axle Total
78.6 8.0 3.9 9.5 100.0
Site Entering & Exiting
Total Enter Total Exit Large Truck Enter
Large Truck Exit
Total Enter Total Exit Large Truck Enter
Large Truck Exit
Split 64.96 35.04 41.03 58.97 43.01 56.99 42.86 57.14Street Entering & Exiting
Total Enter Total Exit Large Truck Enter
Large Truck Exit
Total Enter Total Exit Large Truck Enter
Large Truck Exit
Split 60.49 39.51 37.50 62.50 29.17 70.83 66.67 33.33
a.m. p.m.
a.m. p.m.
22

Truck Trip Generation Study
VEHICLE MIX AND ENTER/EXIT SPLITS BY LAND USE CATEGORY (Cont’d) Classification: Heavy Industrial
Recommended Large Truck Mix ( %)
Lge 2 Ax 3 Axle 4+ Axle Total
11.1 36.0 53.0 100.0
Pass Veh Lge 2 Ax 3 Axle 4+ Axle Total
61.2 6.1 12.7 19.9 100.0
Site Entering & Exiting
Total Enter Total Exit Large Truck Enter
Large Truck Exit
Total Enter Total Exit Large Truck Enter
Large Truck Exit
Split 65.60 34.40 50.85 49.15 43.02 56.98 58.82 41.18Street Entering & Exiting
Total Enter Total Exit Large Truck Enter
Large Truck Exit
Total Enter Total Exit Large Truck Enter
Large Truck Exit
Split 69.39 30.61 47.69 52.31 28.42 71.58 55.56 44.44
a.m. p.m.
a.m. p.m.
23

Truck Trip Generation Study
VEHICLE MIX AND ENTER/EXIT SPLITS BY LAND USE CATEGORY (Cont’d) Classification: Industrial Park
Recommended Large Truck Mix ( %)
Lge 2 Ax 3 Axle 4+ Axle Total
7.9 7.1 85.0 100.0
Pass Veh Lge 2 Ax 3 Axle 4+ Axle Total
52.8 4.0 3.3 39.8 100.0
Site Entering & Exiting
Total Enter Total Exit Large Truck Enter
Large Truck Exit
Total Enter Total Exit Large Truck Enter
Large Truck Exit
Split 68.88 31.12 58.97 41.03 43.11 56.89 51.69 48.31Street Entering & Exiting
Total Enter Total Exit Large Truck Enter
Large Truck Exit
Total Enter Total Exit Large Truck Enter
Large Truck Exit
Split 60.99 39.01 50.00 50.00 32.87 67.13 37.50 62.50
a.m. p.m.
a.m. p.m.
24

Truck Trip Generation Study
VEHICLE MIX AND ENTER/EXIT SPLITS BY LAND USE CATEGORY (Cont’d) Classification: Truck Sales and Leasing
Recommended Large Truck Mix ( %)
Lge 2 Ax 3 Axle 4+ Axle Total
42.8 33.0 24.2 100.0
Pass Veh Lge 2 Ax 3 Axle 4+ Axle Total
72.7 11.7 9.0 6.6 100.0
Site Entering & Exiting
Total Enter Total Exit Large Truck Enter
Large Truck Exit
Total Enter Total Exit Large Truck Enter
Large Truck Exit
Split 40.90 59.10 48.94 51.06 51.70 48.30 55.14 44.86Street Entering & Exiting
Total Enter Total Exit Large Truck Enter
Large Truck Exit
Total Enter Total Exit Large Truck Enter
Large Truck Exit
Split 46.85 53.15 52.86 47.14 36.21 63.79 50.98 49.02
a.m. p.m.
a.m. p.m.
25

Truck Trip Generation Study
VEHICLE MIX AND ENTER/EXIT SPLITS BY LAND USE CATEGORY (Cont’d) Classification: Used Truck Sales
Recommended Large Truck Mix ( %)
Lge 2 Ax 3 Axle 4+ Axle Total
26.3 42.9 30.8 100.0
Pass Veh Lge 2 Ax 3 Axle 4+ Axle Total
73.7 4.9 12.1 9.2 100.0
Site Entering & Exiting
Total Enter Total Exit Large Truck Enter
Large Truck Exit
Total Enter Total Exit Large Truck Enter
Large Truck Exit
Split 47.59 52.41 39.68 60.32 53.29 46.71 49.02 50.98Street Entering & Exiting
Total Enter Total Exit Large Truck Enter
Large Truck Exit
Total Enter Total Exit Large Truck Enter
Large Truck Exit
Split 68.85 31.15 48.78 51.22 29.94 70.06 33.33 66.67
a.m. p.m.
a.m. p.m.
26
Truck Trip Generation Study
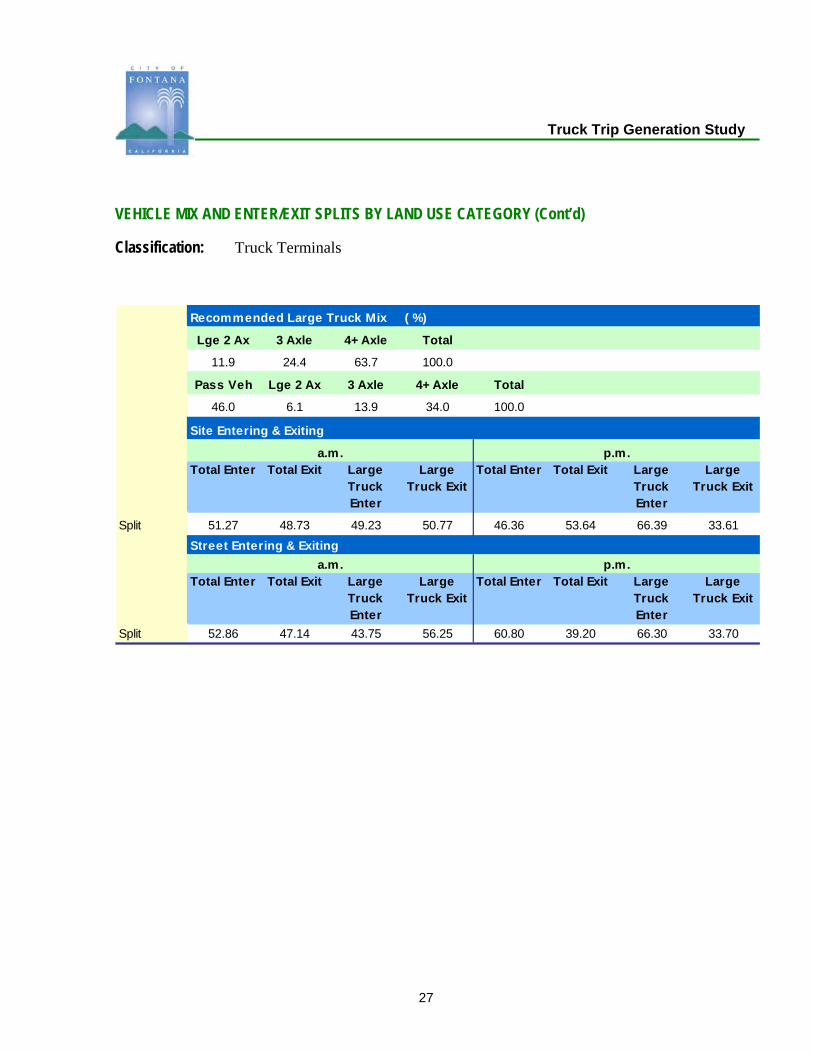
VEHICLE MIX AND ENTER/EXIT SPLITS BY LAND USE CATEGORY (Cont’d) Classification: Truck Terminals
Recommended Large Truck Mix ( %)
Lge 2 Ax 3 Axle 4+ Axle Total
11.9 24.4 63.7 100.0
Pass Veh Lge 2 Ax 3 Axle 4+ Axle Total
46.0 6.1 13.9 34.0 100.0
Site Entering & Exiting
Total Enter Total Exit Large Truck Enter
Large Truck Exit
Total Enter Total Exit Large Truck Enter
Large Truck Exit
Split 51.27 48.73 49.23 50.77 46.36 53.64 66.39 33.61Street Entering & Exiting
Total Enter Total Exit Large Truck Enter
Large Truck Exit
Total Enter Total Exit Large Truck Enter
Large Truck Exit
Split 52.86 47.14 43.75 56.25 60.80 39.20 66.30 33.70
a.m. p.m.
a.m. p.m.
27

Truck Trip Generation Study
VEHICLE MIX AND ENTER/EXIT SPLITS BY LAND USE CATEGORY (Cont’d) Classification: Truck Stops
Recommended Large Truck Mix ( %)
Lge 2 Ax 3 Axle 4+ Axle Total
4.9 16.2 78.9 100.0
Pass Veh Lge 2 Ax 3 Axle 4+ Axle Total
44.1 2.2 9.0 44.6 100.0
Site Entering & Exiting
Total Enter Total Exit Large Truck Enter
Large Truck Exit
Total Enter Total Exit Large Truck Enter
Large Truck Exit
Split 52.33 47.67 53.96 46.04 50.92 49.08 54.86 45.14Street Entering & Exiting
Total Enter Total Exit Large Truck Enter
Large Truck Exit
Total Enter Total Exit Large Truck Enter
Large Truck Exit
Split 46.11 53.89 45.45 54.55 50.00 50.00 53.09 46.91
a.m. p.m.
a.m. p.m.
28

7. TRIP GENERATION ANALYSIS BY LAND USE CATEGORY

Warehouses are primarily devoted to the storage of materials; they may also include
office and maintenance areas.Light warehouses are 100,000 square feet
G. F. A. or less.
Light Warehousing (ITE code 150)

Truck Trip Generation Study
TRIP GENERATION ANALYSIS BY LAND USE CATEGORY Classification: Light Warehouse Period: Total Daily Traffic
Statistics No. of Employees Gross Building Area (KSF)
Acres
Weighted Average Trips 3.713 1.659 35.874 Mean Trip Rate 6.755 1.710 37.111 Standard Deviation 6.868 .638 14.695 Linear Regression Coefficient 1.149 -3.676 -63.690 y Intercept 286.492 1334.121 1151.451 r Squared .700 .791 .606 Logarithmic Regression Coefficient 1.003 .991 .855 y Intercept 296.840 4156.615 2444.849 r Squared .642 .838 .597
Trip RatesJR Distribution 17.006 1.319 29.653 Medline Industries 4.044 2.196 40.511 Kumo Tires 3.561 1.020 22.222 Barth & Dryfuss 2.409 2.307 56.058 Mean Trip Rates 6.755 1.710 37.111
y
29

Truck Trip Generation Study
TRIP GENERATION ANALYSIS BY LAND USE CATEGORY (Cont’d) Classification: Light Warehouse Period: AM Peak Hour Street Total/AM Peak Hour Street Truck
Statistics No. of Employees
Gross Building
Area (KSF)
Acres No. of Employees
Gross Building
Area (KSF)
Acres
Weighted Average Trips 0.273 0.122 2.637 0.051 0.023 0.497 Mean Trip Rate 0.516 0.116 2.505 0.148 0.022 0.479 Standard Deviation 0.479 0.086 1.886 0.205 0.013 0.292 Linear Regression Coefficient -0.098 0.802 14.280 -0.041 0.082 1.907 y Intercept 41.493 -170.055 -134.646 10.328 -14.692 -16.306 r Squared 0.102 0.750 0.607 0.961 0.422 0.587 Logarithmic Regression Coefficient 0.996 1.022 1.517 0.989 1.019 1.817 y Intercept 36.190 0.099 0.197 15.349 0.040 0.004 r Squared 0.179 0.765 0.700 0.915 0.279 0.724
Trip RatesJR Distribution 1.000 0.078 1.744 0.450 0.035 0.785 Medline Industries 0.150 0.081 1.503 0.042 0.023 0.417 Kumo Tires 0.854 0.244 5.327 0.098 0.028 0.609 Barth & Dryfuss 0.062 0.060 1.448 0.004 0.004 0.103 Mean Trip Rates 0.516 0.116 2.505 0.148 0.022 0.479
AM PEAK HOUR STREET TOTAL AM PEAK HOUR STREET TRUCK
30

Truck Trip Generation Study
TRIP GENERATION ANALYSIS BY LAND USE CATEGORY (Cont’d) Classification: Light Warehouse Period: PM Peak Hour Street Total/PM Peak Hour Street Truck Statistics No. of
EmployeesGross
Building Area (KSF)
Acres No. of Employees
Gross Building
Area (KSF)
Acres
Weighted Average Trips 0.201 0.090 1.946 0.047 0.021 0.454 Mean Trip Rate 0.291 0.088 1.913 0.109 0.021 0.451 Standard Deviation 0.198 0.047 1.049 0.130 0.004 0.095 Linear Regression Coefficient 0.025 0.294 5.354 -0.012 0.051 0.725 y Intercept 19.723 -50.989 -39.423 6.623 -7.461 -3.138 r Squared 0.023 0.350 0.296 0.497 0.937 0.487 Logarithmic Regression Coefficient 1.003 1.008 1.200 0.998 1.010 1.144 y Intercept 13.650 2.340 2.315 6.677 0.463 1.071 r Squared 0.146 0.125 0.150 0.534 0.919 0.464
Trip RatesJR Distribution 0.400 0.031 0.697 0.300 0.023 0.523 Medline Industries 0.158 0.086 1.586 0.033 0.018 0.334 Kumo Tires 0.512 0.147 3.196 0.085 0.024 0.533 Barth & Dryfuss 0.093 0.089 2.172 0.018 0.017 0.414 Mean Trip Rates 0.291 0.088 1.913 0.109 0.021 0.451
PM PEAK HOUR STREET TOTAL PM PEAK HOUR STREET TRUCK
31

Truck Trip Generation Study
TRIP GENERATION ANALYSIS BY LAND USE CATEGORY (Cont’d) Classification: Light Warehouse Period: AM Peak Hour Site Total/AM Peak Hour Site Truck
Statistics No. of
EmployeesGross
Building Area (KSF)
Acres No. of Employees
Gross Building
Area (KSF)
Acres
Weighted Average Trips 0.327 0.146 3.156 0.065 0.029 0.627 Mean Trip Rate 0.475 0.143 2.951 0.131 0.029 0.599 Standard Deviation 0.366 0.127 2.548 0.123 0.023 0.406 Linear Regression Coefficient -0.088 0.487 20.387 -0.027 -0.008 2.736 y Intercept 46.310 -85.325 -199.280 10.259 9.205 -24.386 r Squared 0.050 0.171 0.763 0.210 0.002 0.610 Logarithmic Regression Coefficient 0.996 1.013 2.074 0.991 1.008 2.007 y Intercept 35.703 1.015 0.005 14.712 0.723 0.002 r Squared 0.080 0.090 0.786 0.505 0.039 0.782
Trip RatesJR Distribution 0.500 0.039 0.872 0.300 0.023 0.523 Medline Industries 0.442 0.240 4.424 0.108 0.059 1.085 Kumo Tires 0.927 0.265 5.784 0.110 0.031 0.685 Barth & Dryfuss 0.031 0.030 0.724 0.004 0.004 0.103 Mean Trip Rates 0.475 0.143 2.951 0.131 0.029 0.599
AM PEAK HOUR SITE TOTAL AM PEAK HOUR SITE TRUCK
32

Truck Trip Generation Study
TRIP GENERATION ANALYSIS BY LAND USE CATEGORY (Cont’d) Classification: Light Warehouse Period: PM Peak Hour Site Total/PM Peak Hour Site Truck
Statistics No. of
EmployeesGross
Building Area (KSF)
Acres No. of Employees
Gross Building
Area (KSF)
Acres
Weighted Average Trips 0.282 0.126 2.724 0.074 0.033 0.713 Mean Trip Rate 0.392 0.130 2.903 0.137 0.033 0.699 Standard Deviation 0.272 0.088 2.236 0.118 0.013 0.209 Linear Regression Coefficient 0.221 -0.324 -11.027 -0.010 0.021 1.894 y Intercept 6.813 112.420 159.026 9.361 3.001 -13.658 r Squared 0.938 0.222 0.658 0.071 0.035 0.730 Logarithmic Regression Coefficient 1.007 0.990 0.753 0.998 1.003 1.282 y Intercept 13.375 340.838 733.582 9.196 3.740 0.440 r Squared 0.993 0.259 0.527 0.102 0.042 0.766
Trip RatesJR Distribution 0.800 0.062 1.395 0.300 0.023 0.523 Medline Industries 0.233 0.127 2.337 0.092 0.050 0.918 Kumo Tires 0.268 0.077 1.674 0.134 0.038 0.837 Barth & Dryfuss 0.267 0.255 6.205 0.022 0.021 0.517 Mean Trip Rates 0.392 0.130 2.903 0.137 0.033 0.699
PM PEAK HOUR SITE TOTAL PM PEAK HOUR SITE TRUCK
33

Truck Trip Generation Study
TRIP GENERATION ANALYSIS BY LAND USE CATEGORY (Cont’d) Classification: Light Warehouse
Recommended Large Truck Mix ( %)
Lge 2 Ax 3 Axle 4+ Axle Total
24.7 20.6 54.6 100.0
Pass Veh Lge 2 Ax 3 Axle 4+ Axle Total
80.3 5.2 4.5 10.0 100.0
Site Entering & Exiting
Total Enter Total Exit Large Truck Enter
Large Truck Exit
Total Enter Total Exit Large Truck Enter
Large Truck Exit
Split 73.97 26.03 62.07 37.93 23.81 76.19 45.45 54.55Street Entering & Exiting
Total Enter Total Exit Large Truck Enter
Large Truck Exit
Total Enter Total Exit Large Truck Enter
Large Truck Exit
Split 73.77 26.23 65.22 34.78 20.00 80.00 31.58 68.42
a.m. p.m.
a.m. p.m.
34

Warehouses are primarily devoted to the storage of materials; they may also include
office and maintenance areas.Heavy warehouses are greater than
100,000 square feet G. F. A.
Heavy Warehousing (ITE code 150)

Truck Trip Generation Study
Classification: Heavy Warehouse Period: Total Daily Traffic Statistics No. of
EmployeesGross Building
Area (KSF)Acres
Weighted Average Trips 4.657 3.547 69.959 Mean Trip Rate 2.842 1.970 39.244 Standard Deviation 3.382 2.515 48.279 Linear Regression Coeff icient n.a. n.a. n.a. y Intercept n.a. n.a. n.a. r Squared n.a. n.a. n.a.Logarithmic Regression n.a. n.a. n.a. Coeff icient n.a. n.a. n.a. y Intercept n.a. n.a. n.a. r Squared n.a. n.a. n.a.
Trip RatesTarget 6.685 5.252 98.888 Thrifty/Big 5 0.000 0.000 0.000 TAB 4.683 2.629 58.087 Sportsmart 0.000 0.000 0.000 Mean Trip Rates 2.842 1.970 39.244
35

Truck Trip Generation Study
TRIP GENERATION ANALYSIS BY LAND USE CATEGORY (Cont’d) Classification: Heavy Warehouse Period: AM Peak Hour Street Total/AM Peak Hour Street Truck
Statistics No. of
EmployeesGross
Building Area (KSF)
Acres No. of Employees
Gross Building
Area (KSF)
Acres
Weighted Average Trips 0.091 0.070 1.373 0.034 0.026 0.518 Mean Trip Rate 0.138 0.092 1.941 0.046 0.034 0.710 Standard Deviation 0.096 0.042 0.980 0.021 0.015 0.326 Linear Regression Coefficient 0.037 0.032 0.589 0.021 0.016 0.301 y Intercept 23.872 21.235 22.708 6.025 5.638 6.291 r Squared 0.656 0.811 0.798 0.956 0.946 0.950 Logarithmic Regression Coefficient 1.001 1.001 1.014 1.001 1.001 1.017 y Intercept 25.094 22.937 23.826 8.090 7.929 8.220 r Squared 0.455 0.649 0.630 0.916 0.902 0.907
Trip RatesTarget 0.060 0.047 0.888 0.026 0.021 0.390 Thrifty/Big 5 0.165 0.083 1.737 0.045 0.023 0.474 TAB 0.263 0.147 3.256 0.075 0.042 0.930 Sportsmart 0.064 0.090 1.883 0.036 0.050 1.046 Mean Trip Rates 0.138 0.092 1.941 0.046 0.034 0.710
AM PEAK HOUR STREET TOTAL AM PEAK HOUR STREET TRUCK
36

Truck Trip Generation Study
TRIP GENERATION ANALYSIS BY LAND USE CATEGORY (Cont’d) Classification: Heavy Warehouse Period: PM Peak Hour Street Total/PM Peak Hour Street Truck Statistics No. of
EmployeesGross
Building Area (KSF)
Acres No. of Employees
Gross Building
Area (KSF)
Acres
Weighted Average Trips 0.095 0.073 1.433 0.034 0.026 0.509 MeanTrip Rate 0.122 0.097 2.016 0.042 0.025 0.529 Standard Deviation 0.041 0.057 1.207 0.031 0.012 0.268 Linear Regression Coefficient 0.054 0.042 0.771 0.026 0.023 0.419 y Intercept 17.889 17.592 19.178 3.330 1.584 2.609 r Squared 0.949 0.885 0.896 0.758 0.917 0.905 Logarithmic Regression Coefficient 1.001 1.001 1.016 1.002 1.002 1.031 y Intercept 22.051 22.144 22.866 4.646 3.677 4.002 r Squared 0.818 0.731 0.744 0.387 0.616 0.595
Trip RatesTarget 0.070 0.055 1.036 0.030 0.024 0.444 Thrifty/Big 5 0.170 0.085 1.789 0.080 0.040 0.842 TAB 0.119 0.067 1.473 0.050 0.028 0.620 Sportsmart 0.129 0.180 3.766 0.007 0.010 0.209 Mean Trip Rates 0.122 0.097 2.016 0.042 0.025 0.529
PM PEAK HOUR STREET TOTAL PM PEAK HOUR STREET TRUCK
37

Truck Trip Generation Study
TRIP GENERATION ANALYSIS BY LAND USE CATEGORY (Cont’d) Classification: Heavy Warehouse Period: AM Peak Hour Site Total/AM Peak Hour Site Truck
Statistics No. of
EmployeesGross
Building Area (KSF)
Acres No. of Employees
Gross Building
Area (KSF)
Acres
Weighted Average Trips 0.309 0.235 4.637 0.040 0.030 0.596 Mean Trip Rate 0.341 0.254 5.249 0.072 0.048 1.027 Standard Deviation 0.107 0.076 1.607 0.057 0.028 0.640 Linear Regression Coefficient 0.268 0.215 3.951 -0.002 0.000 0.004 y Intercept 17.625 11.213 19.862 17.946 17.042 17.146 r Squared 0.971 0.983 0.987 0.021 0.002 0.001 Logarithmic Regression Coefficient 1.002 1.001 1.025 1.000 1.000 1.001 y Intercept 50.347 48.177 50.856 17.038 16.027 16.167 r Squared 0.900 0.921 0.924 0.005 0.016 0.012
Trip RatesTarget 0.285 0.224 4.223 0.015 0.012 0.229 Thrifty/Big 5 0.495 0.248 5.211 0.090 0.045 0.947 TAB 0.325 0.182 4.031 0.144 0.081 1.783 Sportsmart 0.257 0.361 7.531 0.039 0.055 1.151 Mean Trip Rates 0.341 0.254 5.249 0.072 0.048 1.027
AM PEAK HOUR SITE TOTAL AM PEAK HOUR SITE TRUCK
38

Truck Trip Generation Study
TRIP GENERATION ANALYSIS BY LAND USE CATEGORY (Cont’d) Classification: Heavy Warehouse Period: PM Peak Hour Site Total/AM Peak Hour Site Truck
Statistics No. of
EmployeesGross
Building Area (KSF)
Acres No. of Employees
Gross Building
Area (KSF)
Acres
Weighted Average Trips 0.417 0.318 6.268 0.044 0.033 0.656 Mean Trip Rate 0.447 0.308 6.335 0.060 0.047 0.997 Standard Deviation 0.263 0.091 1.851 0.029 0.029 0.632 Linear Regression Coefficient 0.390 0.323 5.902 0.021 0.016 0.291 y Intercept 11.980 -2.803 10.616 9.850 10.004 10.585 r Squared 0.905 0.973 0.971 0.911 0.801 0.814 Logarithmic Regression Coefficient 1.002 1.002 1.030 1.001 1.001 1.013 y Intercept 55.428 49.975 53.560 11.324 11.587 11.874 r Squared 0.726 0.839 0.833 0.785 0.639 0.654
Trip RatesTarget 0.405 0.318 5.984 0.030 0.024 0.444 Thrifty/Big 5 0.825 0.413 8.684 0.050 0.025 0.526 TAB 0.338 0.189 4.186 0.100 0.056 1.240 Sportsmart 0.221 0.311 6.485 0.061 0.085 1.778 Mean Trip Rates 0.447 0.308 6.335 0.060 0.047 0.997
PM PEAK HOUR SITE TOTAL PM PEAK HOUR SITE TRUCK
39

Truck Trip Generation Study
TRIP GENERATION ANALYSIS BY LAND USE CATEGORY (Cont’d) Classification: Heavy Warehouse
Recommended Large Truck Mix ( %)
Lge 2 Ax 3 Axle 4+ Axle Total
16.95 22.71 60.34 100
Pass Veh Lge 2 Ax 3 Axle 4+ Axle Total
79.57 3.46 4.64 12.33 100
Site Entering & Exiting
Total Enter Total Exit Large Truck Enter
Large Truck Exit
Total Enter Total Exit Large Truck Enter
Large Truck Exit
Split 85.66 14.34 46.38 53.62 46.01 53.99 56.58 43.42Street Entering & Exiting
Total Enter Total Exit Large Truck Enter
Large Truck Exit
Total Enter Total Exit Large Truck Enter
Large Truck Exit
Split 50.94 49.06 45.00 55.00 30.72 69.28 45.76 54.24
a.m. p.m.
a.m. p.m.
40

Light industrial facilities usually employ fewer than 500 persons and have an emphasis on activities other than manufacturing. Nevertheless, the distinction between light industrial and
manufacturing (ITE code 140) is sometimes vague. Typical light industrial activities include printing plants, material testing
laboratories, assemblers of data processing equipment, and powerstations. All of the facilities surveyed are freestanding
and devoted to a single use.
Light Industrial (ITE code 110)
Truck Trip Generation Study
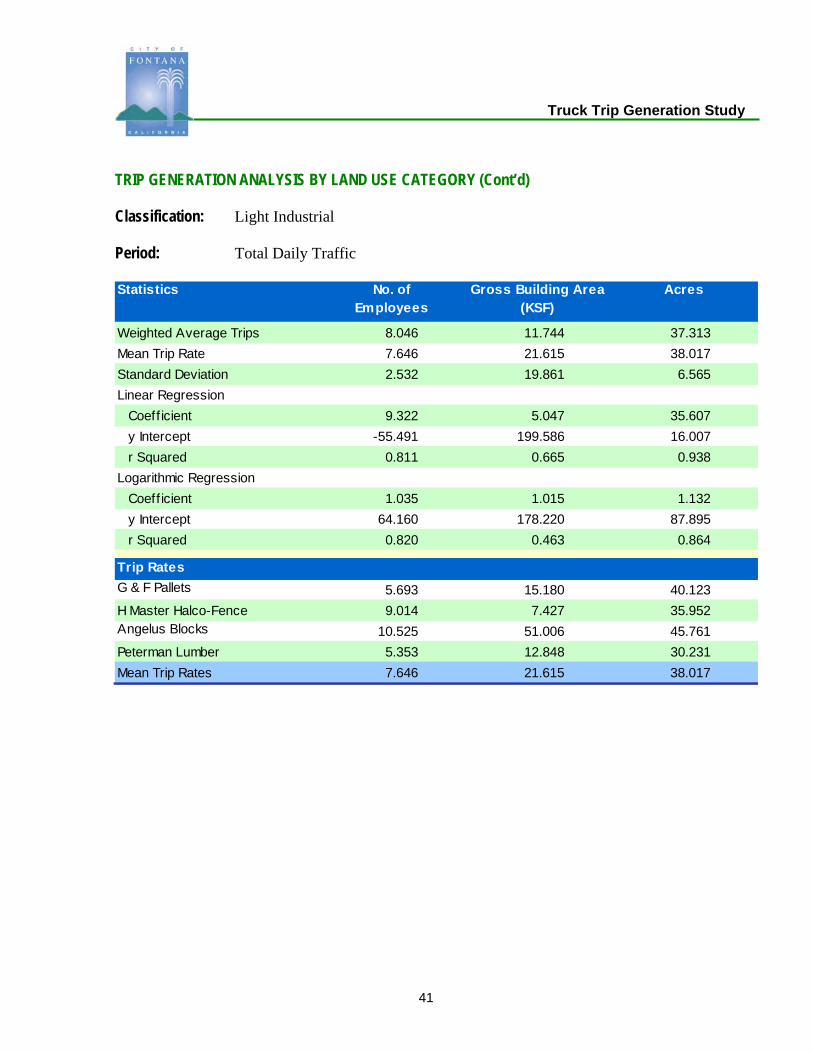
TRIP GENERATION ANALYSIS BY LAND USE CATEGORY (Cont’d) Classification: Light Industrial Period: Total Daily Traffic Statistics No. of
EmployeesGross Building Area
(KSF)Acres
Weighted Average Trips 8.046 11.744 37.313 Mean Trip Rate 7.646 21.615 38.017 Standard Deviation 2.532 19.861 6.565 Linear Regression Coeff icient 9.322 5.047 35.607 y Intercept -55.491 199.586 16.007 r Squared 0.811 0.665 0.938 Logarithmic Regression Coeff icient 1.035 1.015 1.132 y Intercept 64.160 178.220 87.895 r Squared 0.820 0.463 0.864
Trip RatesG & F Pallets 5.693 15.180 40.123 H Master Halco-Fence 9.014 7.427 35.952 Angelus Blocks 10.525 51.006 45.761 Peterman Lumber 5.353 12.848 30.231 Mean Trip Rates 7.646 21.615 38.017
41

Truck Trip Generation Study
TRIP GENERATION ANALYSIS BY LAND USE CATEGORY (Cont’d) Classification: Light Industrial Period: AM Peak Hour Street Total/AM Peak Hour Street Truck Statistics No. of
EmployeesGross
Building Area (KSF)
Acres No. of Employees
Gross Building
Area (KSF)
Acres
Weighted Average Trips 0.466 0.679 2.159 0.184 0.268 0.853 Mean Trip Rate 0.451 1.222 2.369 0.193 0.642 0.998 Standard Deviation 0.178 0.805 1.133 0.116 0.660 0.537 Linear Regression Coefficient 0.415 0.134 1.149 0.058 -0.041 0.116 y Intercept 2.205 16.245 9.471 5.491 9.212 6.910 r Squared 0.564 0.166 0.343 0.058 0.080 0.019 Logarithmic Regression Coefficient 1.032 1.011 1.100 1.017 0.998 1.048 y Intercept 4.162 12.004 6.714 2.961 6.624 4.037 r Squared 0.698 0.215 0.504 0.193 0.006 0.114
Trip RatesG & F Pallets 0.313 0.833 2.203 0.125 0.333 0.881 H Master Halco-Fence 0.357 0.294 1.425 0.071 0.059 0.285 Angelus Blocks 0.425 2.060 1.848 0.325 1.575 1.413 Peterman Lumber 0.708 1.700 4.000 0.250 0.600 1.412 Mean Trip Rates 0.451 1.222 2.369 0.193 0.642 0.998
AM PEAK HOUR STREET TOTAL AM PEAK HOUR STREET TRUCK
42

Truck Trip Generation Study
TRIP GENERATION ANALYSIS BY LAND USE CATEGORY (Cont’d) Classification: Light Industrial Period: PM Peak Hour Street Total/PM Peak Hour Street Truck
Statistics No. of
EmployeesGross
Building Area (KSF)
Acres No. of Employees
Gross Building
Area (KSF)
Acres
Weighted Average Trips 0.299 0.436 1.386 0.069 0.101 0.320 Mean Trip Rate 0.336 0.861 1.870 0.065 0.157 0.338 Standard Deviation 0.164 0.587 1.404 0.015 0.070 0.092 Linear Regression Coefficient 0.264 0.193 1.036 0.093 0.056 0.329 y Intercept 1.505 7.240 3.282 -1.026 1.323 -0.090 r Squared 0.643 0.961 0.783 0.912 0.943 0.916 Logarithmic Regression Coefficient 1.017 1.013 1.070 1.034 1.018 1.122 y Intercept 5.591 8.152 6.258 0.570 1.452 0.835 r Squared 0.649 0.950 0.798 0.994 0.760 0.921
Trip RatesG & F Pallets 0.563 1.500 3.965 0.063 0.167 0.441 H Master Halco-Fence 0.343 0.282 1.368 0.086 0.071 0.342 Angelus Blocks 0.250 1.212 1.087 0.050 0.242 0.217 Peterman Lumber 0.188 0.450 1.059 0.063 0.150 0.353 Mean Trip Rates 0.336 0.861 1.870 0.065 0.157 0.338
PM PEAK HOUR STREET TOTAL PM PEAK HOUR STREET TRUCK
43

Truck Trip Generation Study
TRIP GENERATION ANALYSIS BY LAND USE CATEGORY (Cont’d) Classification: Light Industrial Period: AM Peak Hour Site Total/AM Peak Hour Site Truck
Statistics No. of
EmployeesGross
Building Area (KSF)
Acres No. of Employees
Gross Building
Area (KSF)
Acres
Weighted Average Trips 0.787 1.149 3.651 0.224 0.327 1.039 Mean Trip Rate 0.757 1.928 3.902 0.301 1.004 1.724 Standard Deviation 0.160 1.165 0.974 0.210 0.885 1.408 Linear Regression Coefficient 1.004 0.615 3.729 -0.116 -0.135 -0.459 y Intercept -9.410 15.911 -0.725 14.783 13.782 14.051 r Squared 0.883 0.928 0.965 0.165 0.632 0.206 Logarithmic Regression Coefficient 1.032 1.017 1.119 0.975 0.977 0.905 y Intercept 7.306 17.503 9.947 22.606 15.086 19.323 r Squared 0.972 0.745 0.990 0.358 0.849 0.448
Trip RatesG & F Pallets 0.750 2.000 5.286 0.500 1.333 3.524 H Master Halco-Fence 0.971 0.800 3.875 0.029 0.024 0.114 Angelus Blocks 0.725 3.513 3.152 0.425 2.060 1.848 Peterman Lumber 0.583 1.400 3.294 0.250 0.600 1.412 Mean Trip Rates 0.757 1.928 3.902 0.301 1.004 1.724
AM PEAK HOUR SITE TOTAL AM PEAK HOUR SITE TRUCK
44

Truck Trip Generation Study
TRIP GENERATION ANALYSIS BY LAND USE CATEGORY (Cont’d) Classification: Light Industrial Period: PM Peak Hour Site Total/PM Peak Hour Site Truck
Statistics No. of
EmployeesGross
Building Area (KSF)
Acres No. of Employees
Gross Building
Area (KSF)
Acres
Weighted Average Trips 1.069 1.560 4.957 0.201 0.294 0.933 Mean Trip Rate 1.071 2.673 5.707 0.320 1.061 1.915 Standard Deviation 0.205 1.298 2.222 0.336 1.120 2.370 Linear Regression Coefficient 1.224 0.742 4.345 -0.199 -0.124 -0.563 y Intercept -6.744 24.373 5.749 17.400 12.438 14.032 r Squared 0.914 0.940 0.912 0.407 0.441 0.259 Logarithmic Regression Coefficient 1.028 1.015 1.098 0.971 0.983 0.918 y Intercept 12.310 26.078 16.771 23.765 10.826 14.679 r Squared 0.986 0.798 0.920 0.525 0.476 0.351
Trip RatesG & F Pallets 1.250 3.333 8.811 0.750 2.000 5.286 H Master Halco-Fence 1.229 1.012 4.900 0.043 0.035 0.171 Angelus Blocks 0.825 3.998 3.587 0.425 2.060 1.848 Peterman Lumber 0.979 2.350 5.529 0.063 0.150 0.353 Mean Trip Rates 1.071 2.673 5.707 0.320 1.061 1.915
PM PEAK HOUR SITE TOTAL PM PEAK HOUR SITE TRUCK
45

Truck Trip Generation Study
TRIP GENERATION ANALYSIS BY LAND USE CATEGORY (Cont’d) Classification: Light Industrial
Recommended Large Truck Mix ( %)
Lge 2 Ax 3 Axle 4+ Axle Total
32.7 17.9 49.4 100.0
Pass Veh Lge 2 Ax 3 Axle 4+ Axle Total
78.6 8.0 3.9 9.5 100.0
Site Entering & Exiting
Total Enter Total Exit Large Truck Enter
Large Truck Exit
Total Enter Total Exit Large Truck Enter
Large Truck Exit
Split 64.96 35.04 41.03 58.97 43.01 56.99 42.86 57.14Street Entering & Exiting
Total Enter Total Exit Large Truck Enter
Large Truck Exit
Total Enter Total Exit Large Truck Enter
Large Truck Exit
Split 60.49 39.51 37.50 62.50 29.17 70.83 66.67 33.33
a.m. p.m.
a.m. p.m.
46

Heavy industrial facilities usually have a high number of employees per industrial plant and could also be
categorized as manufacturing facilities (ITE code 140). The distinction between heavy industrial and
manufacturing is vague. However, heavy industrial uses are limited to the manufacturing of large items.
Heavy Industrial (ITE code 120)

Truck Trip Generation Study
TRIP GENERATION ANALYSIS BY LAND USE CATEGORY (Cont’d) Classification: Heavy Industrial Period: Total Daily Traffic
Statis tics No . o f Em p loye e s
Gr os s Bu ild ing Ar e a (KSF)
Acr e s
Weighted A v erage Tr ips 3.787 7.541 71.607 Mean Trip Rate 16.899 n.a. 95.274 Standard Dev iation 20.058 n.a. 90.883 Linear Regres s ion Coef f ic ient -1.301 -0.729 9.472 y Intercept 787.394 642.786 508.575 r Squared 0.250 0.024 0.023 Logarithmic Regres s ion Coef f ic ient 0.998 1.000 1.036 y Intercept 696.928 471.928 356.436 r Squared 0.278 0.000 0.097
Tr ip Rate sJames Hardie 2.966 3.274 36.687 Robertson Ready Mix 44.051 n.a. 229.064 Forged Metals 0.589 3.193 40.078 A ll State Rec y c ling 19.993 7.850 75.266 Mean Trip Rates 16.899 n.a. 95.274
47

Truck Trip Generation Study
TRIP GENERATION ANALYSIS BY LAND USE CATEGORY (Cont’d) Classification: Heavy Industrial Period: AM Peak Hour Street Total/AM Peak Hour Street Truck
Statistics No. of
EmployeesGross
Building Area (KSF)
Acres No. of Employees
Gross Building
Area (KSF)
Acres
Weighted Average Trips 0.237 0.473 4.490 0.105 0.209 1.985 Mean Trip Rate 0.784 n.a 5.712 0.458 n.a 2.539 Standard Deviation 0.759 n.a 2.800 0.773 n.a 3.925 Linear Regression Coefficient 0.032 0.065 1.189 -0.051 -0.033 0.424 y Intercept 31.805 31.668 27.022 24.156 18.826 12.779 r Squared 0.152 0.193 0.368 0.186 0.024 0.022 Logarithmic Regression Coefficient 1.001 1.002 1.036 0.995 1.003 1.121 y Intercept 28.520 29.616 25.721 12.964 5.150 2.509 r Squared 0.197 0.151 0.295 0.171 0.019 0.188
Trip RatesJames Hardie 0.211 0.233 2.616 0.088 0.097 1.090 Robertson Ready Mix 1.692 n.a. 8.800 1.615 n.a. 8.400 Forged Metals 0.106 0.573 7.198 0.003 0.015 0.195 All State Recycling 1.125 0.442 4.235 0.125 0.049 0.471 Mean Trip Rates 0.784 n.a. 5.712 0.458 n.a. 2.539
AM PEAK HOUR STREET TOTAL AM PEAK HOUR STREET TRUCK
48
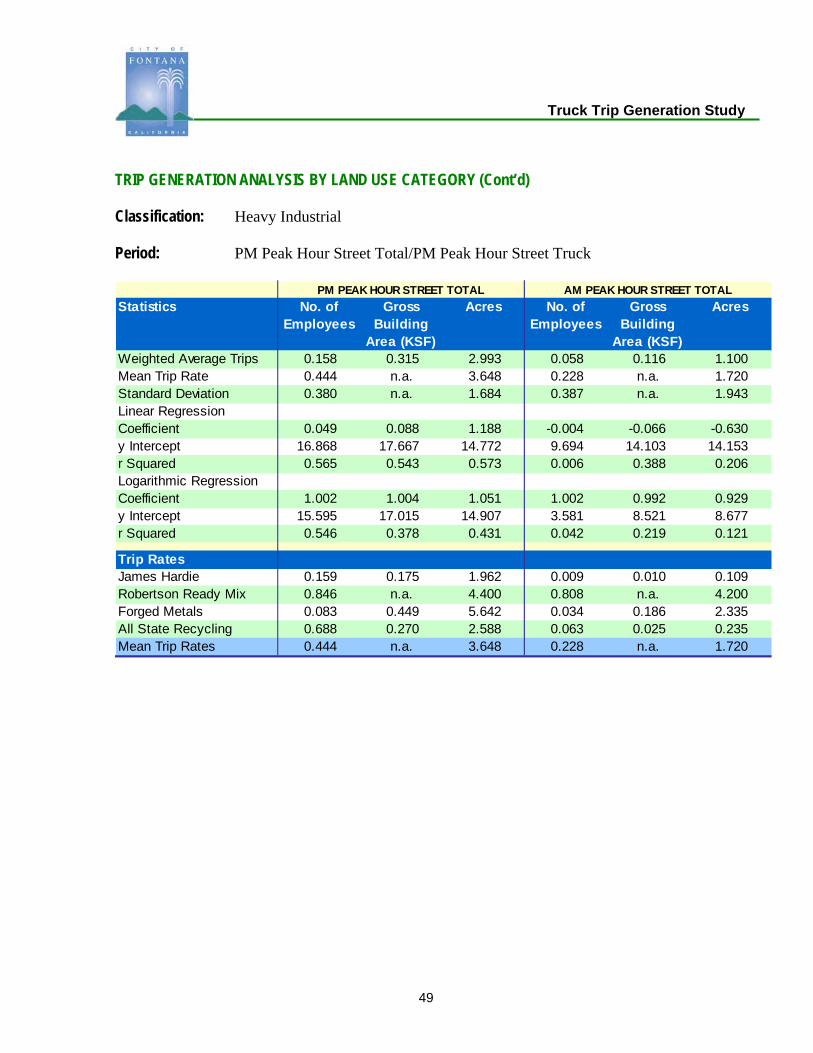
Truck Trip Generation Study
TRIP GENERATION ANALYSIS BY LAND USE CATEGORY (Cont’d) Classification: Heavy Industrial Period: PM Peak Hour Street Total/PM Peak Hour Street Truck Statistics No. of
EmployeesGross
Building Area (KSF)
Acres No. of Employees
Gross Building
Area (KSF)
Acres
Weighted Average Trips 0.158 0.315 2.993 0.058 0.116 1.100 Mean Trip Rate 0.444 n.a. 3.648 0.228 n.a. 1.720 Standard Deviation 0.380 n.a. 1.684 0.387 n.a. 1.943 Linear RegressionCoefficient 0.049 0.088 1.188 -0.004 -0.066 -0.630 y Intercept 16.868 17.667 14.772 9.694 14.103 14.153 r Squared 0.565 0.543 0.573 0.006 0.388 0.206 Logarithmic RegressionCoefficient 1.002 1.004 1.051 1.002 0.992 0.929 y Intercept 15.595 17.015 14.907 3.581 8.521 8.677 r Squared 0.546 0.378 0.431 0.042 0.219 0.121
Trip RatesJames Hardie 0.159 0.175 1.962 0.009 0.010 0.109 Robertson Ready Mix 0.846 n.a. 4.400 0.808 n.a. 4.200 Forged Metals 0.083 0.449 5.642 0.034 0.186 2.335 All State Recycling 0.688 0.270 2.588 0.063 0.025 0.235 Mean Trip Rates 0.444 n.a. 3.648 0.228 n.a. 1.720
PM PEAK HOUR STREET TOTAL AM PEAK HOUR STREET TOTAL
49

Truck Trip Generation Study
TRIP GENERATION ANALYSIS BY LAND USE CATEGORY (Cont’d) Classification: Heavy Industrial Period: AM Peak Hour Site Total/AM Peak Hour Site Truck
Statistics No. of
EmployeesGross
Building Area (KSF)
Acres No. of Employees
Gross Building
Area (KSF)
Acres
Weighted Average Trips 0.352 0.701 6.659 0.095 0.190 1.802 Mean Trip Rate 0.914 n.a. 8.392 0.379 n.a. 2.030 Standard Deviation 0.869 n.a. 5.686 0.430 n.a. 2.113 Linear Regression Coefficient 0.177 0.215 2.025 -0.028 0.052 1.210 y Intercept 27.122 37.807 37.922 19.127 10.687 4.844 r Squared 0.953 0.425 0.218 0.119 0.123 0.380 Logarithmic Regression Coefficient 1.003 1.005 1.045 n.a. n.a. n.a. y Intercept 28.109 33.507 33.519 n.a. n.a. n.a. r Squared 0.900 0.489 0.254 n.a. n.a. n.a.
Trip RatesJames Hardie 0.326 0.360 4.033 0.119 0.131 1.471 Robertson Ready Mix 0.962 n.a. 5.000 0.962 n.a. 5.000 Forged Metals 0.243 1.317 16.537 0.000 0.000 0.000 All State Recycling 2.125 0.834 8.000 0.438 0.172 1.647 Mean Trip Rates 0.914 n.a. 8.392 0.379 n.a. 2.030
AM PEAK HOUR SITE TOTAL AM PEAK HOUR SITE TRUCK
50

Truck Trip Generation Study
TRIP GENERATION ANALYSIS BY LAND USE CATEGORY (Cont’d) Classification: Heavy Industrial Period: PM Peak Hour Site Total/PM Peak Hour Site Truck
Statistics No. of
EmployeesGross
Building Area (KSF)
Acres No. of Employees
Gross Building
Area (KSF)
Acres
Weighted Average Trips 0.278 0.553 5.254 0.126 0.251 2.382 Mean Trip Rate 0.947 n.a. 6.894 0.526 n.a. 3.068 Standard Deviation 0.923 n.a. 2.943 0.608 n.a. 2.656 Linear Regression Coefficient 0.059 0.090 1.028 -0.032 0.000 0.571 y Intercept 33.809 35.972 34.585 24.436 19.494 14.826 r Squared 0.851 0.597 0.445 0.163 0.000 0.091 Logarithmic Regression Coefficient 1.001 1.002 1.024 0.998 1.001 1.044 y Intercept 33.793 35.704 34.567 21.330 15.107 11.400 r Squared 0.859 0.576 0.431 0.161 0.014 0.172
Trip RatesJames Hardie 0.233 0.258 2.888 0.110 0.122 1.362 Robertson Ready Mix 1.346 n.a. 7.000 1.346 n.a. 7.000 Forged Metals 0.146 0.790 9.922 0.023 0.124 1.556 All State Recycling 2.063 0.810 7.765 0.625 0.245 2.353 Mean Trip Rates 0.947 n.a. 6.894 0.526 n.a. 3.068
PM PEAK HOUR SITE TOTAL PM PEAK HOUR SITE TRUCK
51

Truck Trip Generation Study
TRIP GENERATION ANALYSIS BY LAND USE CATEGORY (Cont’d) Classification: Heavy Industrial
Recommended Large Truck Mix ( %)
Lge 2 Ax 3 Axle 4+ Axle Total
11.1 36.0 53.0 100.0
Pass Veh Lge 2 Ax 3 Axle 4+ Axle Total
61.2 6.1 12.7 19.9 100.0
Site Entering & Exiting
Total Enter Total Exit Large Truck Enter
Large Truck Exit
Total Enter Total Exit Large Truck Enter
Large Truck Exit
Split 65.60 34.40 50.85 49.15 43.02 56.98 58.82 41.18Street Entering & Exiting
Total Enter Total Exit Large Truck Enter
Large Truck Exit
Total Enter Total Exit Large Truck Enter
Large Truck Exit
Split 69.39 30.61 47.69 52.31 28.42 71.58 55.56 44.44
a.m. p.m.
a.m. p.m.
52

Industrial Park (ITE code 130)
Industrial parks are areas containing a number of industrial or related facilities. They are characterized by a varied mix of manufacturing,
services, and warehouse facilities.

Truck Trip Generation Study
TRIP GENERATION ANALYSIS BY LAND USE CATEGORY (Cont’d) Classification: Industrial Park Period: Total Daily Traffic
Statistics No. of Employees
Gross Building Area (KSF)
Acres
Weighted Average Trips 2.485 1.236 24.805 Mean Trip Rate 3.465 2.691 48.392 Standard Deviation 2.328 2.834 46.320 Linear Regression Coefficient 1.638 0.480 9.381 y Intercept 156.726 281.071 285.841 r Squared 0.819 0.574 0.486 Logarithmic Regression Coefficient 1.004 1.001 1.026 y Intercept 188.297 260.728 260.033 r Squared 0.869 0.617 0.558
Trip RatesHerman Engr & Man 6.893 6.896 116.180 Arrowhead 2.203 1.717 39.456 Schlosser Company 1.848 1.424 22.828 Excel Logistics 2.915 0.729 15.104 Mean Trip Rates 3.465 2.691 48.392
53

Truck Trip Generation Study
sTRIP GENERATION ANALYSIS BY LAND USE CATEGORY (Cont’d) Classification: Industrial Park Period: AM Peak Hour Street Total/AM Peak Hour Street Truck
Statistics No. of
EmployeesGross
Building Area (KSF)
Acres No. of Employees
Gross Building
Area (KSF)
Acres
Weighted Average Trips 0.191 0.095 1.902 0.078 0.039 0.782 Mean Trip Rate 0.301 0.259 4.658 0.075 0.060 1.190 Standard Deviation 0.293 0.322 5.354 0.056 0.053 1.142 Linear Regression Coefficient 0.148 0.004 -0.073 0.124 0.005 -0.023 y Intercept 7.937 33.826 36.596 -8.419 12.688 14.922 r Squared 0.514 0.003 0.002 0.537 0.007 0.000 Logarithmic Regression Coefficient 1.004 1.000 0.999 1.009 1.001 1.012 y Intercept 15.894 29.562 31.435 1.631 6.024 6.638 r Squared 0.557 0.006 0.000 0.741 0.056 0.024
Trip RatesHerman Engr & Man 0.733 0.734 12.360 0.100 0.100 1.685 Arrowhead 0.233 0.182 4.179 0.143 0.112 2.567 Schlosser Company 0.119 0.092 1.471 0.029 0.022 0.353 Excel Logistics 0.120 0.030 0.622 0.030 0.008 0.155 Mean Trip Rates 0.301 0.259 4.658 0.075 0.060 1.190
AM PEAK HOUR STREET TOTAL AM PEAK HOUR STREET TRUCK
54

Truck Trip Generation Study
TRIP GENERATION ANALYSIS BY LAND USE CATEGORY (Cont’d) Classification: Industrial Park Period: PM Peak Hour Street Total/PM Peak Hour Street Truck
Statistics No. of
EmployeesGross
Building Area (KSF)
Acres No. of Employees
Gross Building
Area (KSF)
Acres
Weighted Average Trips 0.193 0.096 1.929 0.097 0.048 0.971 Mean Trip Rate 0.264 0.226 4.118 0.104 0.084 1.624 Standard Deviation 0.215 0.239 4.039 0.072 0.076 1.474 Linear Regression Coefficient 0.196 -0.002 -0.189 0.139 0.006 -0.007 y Intercept -0.449 36.323 39.259 -7.783 15.596 18.122 r Squared 0.560 0.000 0.009 0.539 0.009 0.000 Logarithmic Regression Coefficient 1.005 1.000 0.995 1.008 1.001 1.010 y Intercept 11.387 30.047 31.701 2.898 8.738 9.602 r Squared 0.607 0.003 0.012 0.702 0.059 0.023
Trip RatesHerman Engr & Man 0.567 0.567 9.551 0.167 0.167 2.809 Arrowhead 0.263 0.205 4.716 0.167 0.130 2.985 Schlosser Company 0.143 0.110 1.765 0.038 0.029 0.471 Excel Logistics 0.085 0.021 0.440 0.045 0.011 0.233 Mean Trip Rates 0.264 0.226 4.118 0.104 0.084 1.624
PM PEAK HOUR STREET TOTAL PM PEAK HOUR STREET TRUCK
55

Truck Trip Generation Study
TRIP GENERATION ANALYSIS BY LAND USE CATEGORY (Cont’d) Classification: Industrial Park Period: AM Peak Hour Site Total/AM Peak Hour Site Truck
Statistics No. of
EmployeesGross
Building Area (KSF)
Acres No. of Employees
Gross Building
Area (KSF)
Acres
Weighted Average Trips 0.265 0.132 2.644 0.053 0.026 0.526 Mean Trip Rate 0.406 0.351 6.321 0.131 0.125 2.197 Standard Deviation 0.384 0.422 7.023 0.205 0.208 3.468 Linear Regression Coefficient 0.225 -0.001 -0.236 0.020 -0.011 -0.320 y Intercept 7.339 49.317 53.370 5.987 13.674 15.680 r Squared 0.509 0.000 0.010 0.043 0.094 0.191 Logarithmic Regression Coefficient 1.004 1.000 0.995 n.a. n.a. n.a. y Intercept 20.177 42.995 45.748 n.a. n.a. n.a. r Squared 0.536 0.002 0.014 n.a. n.a. n.a.
Trip RatesHerman Engr & Man 0.967 0.967 16.292 0.433 0.434 7.303 Arrowhead 0.340 0.265 6.090 0.080 0.062 1.433 Schlosser Company 0.176 0.136 2.176 0.000 0.000 0.000 Excel Logistics 0.140 0.035 0.725 0.010 0.003 0.052 Mean Trip Rates 0.406 0.351 6.321 0.131 0.125 2.197
AM PEAK HOUR SITE TOTAL AM PEAK HOUR SITE TRUCK
56

Truck Trip Generation Study
TRIP GENERATION ANALYSIS BY LAND USE CATEGORY (Cont’d) Classification: Industrial Park Period: PM Peak Hour Site Total/PM Peak Hour Site Truck
Statistics No. of
EmployeesGross
Building Area (KSF)
Acres No. of Employees
Gross Building
Area (KSF)
Acres
Weighted Average Trips 0.382 0.190 3.818 0.120 0.060 1.201 Mean Trip Rate 0.441 0.349 6.429 0.143 0.117 2.212 Standard Deviation 0.193 0.265 4.559 0.105 0.116 2.084 Linear Regression Coefficient 0.397 0.026 0.393 0.154 0.010 0.043 y Intercept -2.740 61.106 63.464 -6.228 18.503 21.450 r Squared 0.816 0.028 0.014 0.523 0.018 0.001 Logarithmic Regression Coefficient 1.007 1.001 1.017 1.006 1.001 1.011 y Intercept 16.146 41.914 41.775 4.869 11.470 12.702 r Squared 0.952 0.116 0.106 0.604 0.084 0.033
Trip RatesHerman Engr & Man 0.700 0.700 11.798 0.267 0.267 4.494 Arrowhead 0.457 0.356 8.179 0.193 0.151 3.463 Schlosser Company 0.362 0.279 4.471 0.043 0.033 0.529 Excel Logistics 0.245 0.061 1.269 0.070 0.018 0.363 Mean Trip Rates 0.441 0.349 6.429 0.143 0.117 2.212
PM PEAK HOUR SITE TOTAL PM PEAK HOUR SITE TRUCK
57

Truck Trip Generation Study
TRIP GENERATION ANALYSIS BY LAND USE CATEGORY (Cont’d) Classification: Industrial Park
Recommended Large Truck Mix ( %)
Lge 2 Ax 3 Axle 4+ Axle Total
7.9 7.1 85.0 100.0
Pass Veh Lge 2 Ax 3 Axle 4+ Axle Total
52.8 4.0 3.3 39.8 100.0
Site Entering & Exiting
Total Enter Total Exit Large Truck Enter
Large Truck Exit
Total Enter Total Exit Large Truck Enter
Large Truck Exit
Split 68.88 31.12 58.97 41.03 43.11 56.89 51.69 48.31Street Entering & Exiting
Total Enter Total Exit Large Truck Enter
Large Truck Exit
Total Enter Total Exit Large Truck Enter
Large Truck Exit
Split 60.99 39.01 50.00 50.00 32.87 67.13 37.50 62.50
a.m. p.m.
a.m. p.m.
58

Truck Sales and Leasing (not an ITE category)
Facilities included in this category are primarily for the sale and leasing of new heavy duty
commercial vehicles, 10,000 GVW, or greater. Typically, the facilities are located along major
arterials in either commercial or industrial areas. The facilities can also include maintenance services, part sales, and used truck sales.

Truck Trip Generation Study
TRIP GENERATION ANALYSIS BY LAND USE CATEGORY (Cont’d) Classification: Truck Sales and Leasing Period: Total Daily Traffic
Statistics No. of Employees
Gross Building Area (KSF)
Acres
Weighted Average Trips 10.380 23.517 129.691 Mean Trip Rate 11.626 30.031 116.763 Standard Deviation 2.624 14.272 32.265 Linear Regression Coefficient 10.161 14.874 136.639 y Intercept 14.571 253.696 -36.982 r Squared 0.998 0.684 0.965 Logarithmic Regression Coefficient 1.035 1.049 1.590 y Intercept 44.902 105.898 36.432 r Squared 0.981 0.619 0.978
Trip RatesKenworth 10.493 22.233 138.512 Peterbuilt 10.000 16.473 141.694 Trans-West Truck Cntr. 10.463 49.029 115.091 Sam's Truck Sales, Inc. 15.547 32.389 71.754 Mean Trip Rates 11.626 30.031 116.763
59

Truck Trip Generation Study
Classification: Truck Sales and Leasing Period: AM Peak Hour Street Total/AM Peak Hour Street Truck Statistics No. of
EmployeesGross
Building Area (KSF)
Acres No. of Employees
Gross Building
Area (KSF)
Acres
Weighted Average Trips 0.605 1.371 7.562 0.056 0.128 0.705 Mean Trip Rate 0.535 1.313 6.306 0.042 0.117 0.539 Standard Deviation 0.201 0.539 4.148 0.030 0.104 0.391 Linear Regression Coefficient 0.638 1.208 7.765 0.063 0.091 0.839 y Intercept -2.148 4.795 -1.080 -0.410 1.077 -0.717 r Squared 0.835 0.959 0.663 0.888 0.603 0.855 Logarithmic Regression Coefficient 1.047 1.072 1.830 n.a n.a. n.a y Intercept 0.927 2.490 0.764 n.a. n.a. n.a r Squared 0.977 0.728 0.924 n.a n.a. n.a
Trip Rates Kenworth 0.586 1.241 7.733 0.071 0.150 0.933 Peterbuilt 0.793 1.306 11.238 0.046 0.076 0.651 Trans-West Truck Cntr. 0.429 2.008 4.714 0.052 0.243 0.571 Sam's Truck Sales, Inc. 0.333 0.694 1.538 0.000 0.000 0.000 Mean Trip Rate 0.535 1.313 6.306 0.042 0.117 0.539
AM PEAK HOUR STREET TOTAL AM PEAK HOUR STREET TRUCK
60

Truck Trip Generation Study
TRIP GENERATION ANALYSIS BY LAND USE CATEGORY (Cont’d) Classification: Truck Sales and Leasing Period: PM Peak Hour Street Total/PM Peak Hour Street Truck Statistics No. of
EmployeesGross
Building Area (KSF)
Acres No. of Employees
Gross Building
Area (KSF)
Acres
Weighted Average Trips 0.556 1.261 6.952 0.098 0.221 1.221 Mean Trip Rate 0.660 1.575 6.506 0.234 0.531 1.628 Standard Deviation 0.253 0.511 2.470 0.290 0.581 1.019 Linear Regression Coefficient 0.551 1.018 6.791 0.080 0.120 1.057 y Intercept 0.336 7.110 0.853 1.186 2.976 0.877 r Squared 0.869 0.948 0.705 0.703 0.508 0.658 Logarithmic Regression Coefficient 1.032 1.051 1.524 1.017 1.024 1.247 y Intercept 2.806 5.446 2.492 1.819 2.700 1.672 r Squared 0.978 0.760 0.910 0.921 0.616 0.892
Trip Rates Kenworth 0.535 1.134 7.067 0.121 0.257 1.600 Peterbuilt 0.690 1.136 9.772 0.069 0.114 0.977 Trans-West Truck Cntr. 0.416 1.947 4.571 0.078 0.365 0.857 Sam's Truck Sales, Inc. 1.000 2.083 4.615 0.667 1.389 3.077 Mean Trip Rate 0.660 1.575 6.506 0.234 0.531 1.628
PM PEAK HOUR STREET TOTAL PM PEAK HOUR STREET TRUCK
61
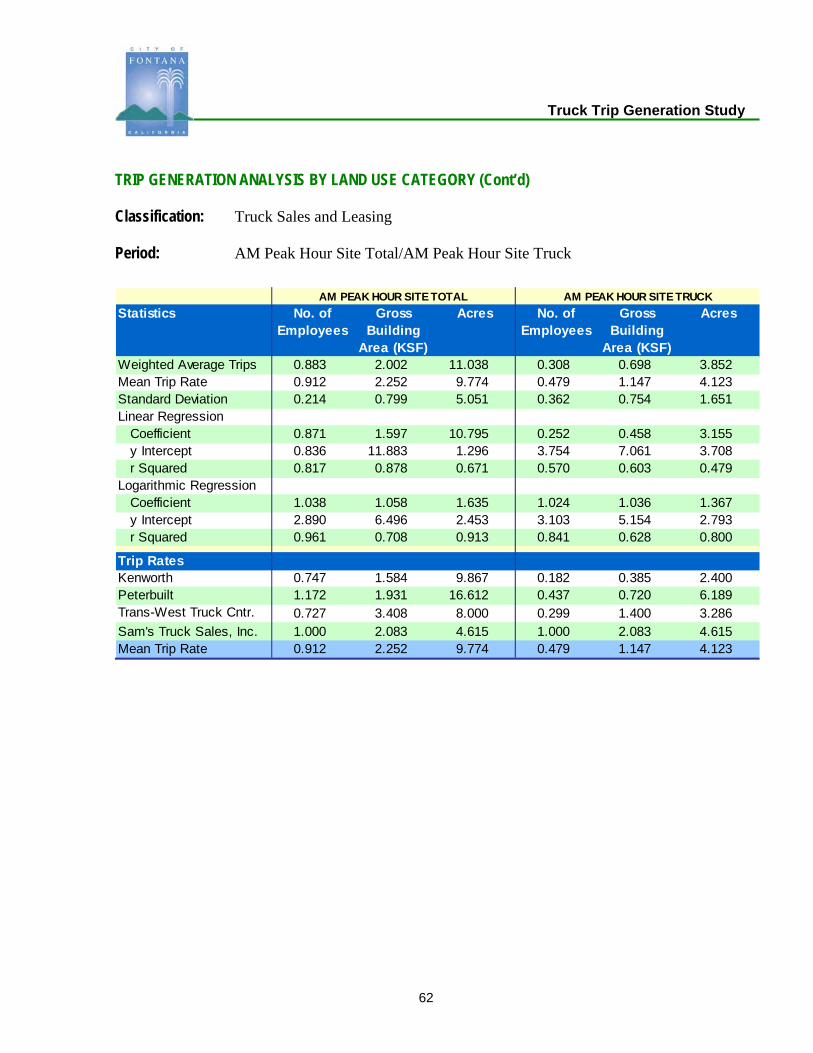
Truck Trip Generation Study
TRIP GENERATION ANALYSIS BY LAND USE CATEGORY (Cont’d) Classification: Truck Sales and Leasing Period: AM Peak Hour Site Total/AM Peak Hour Site Truck Statistics No. of
EmployeesGross
Building Area (KSF)
Acres No. of Employees
Gross Building
Area (KSF)
Acres
Weighted Average Trips 0.883 2.002 11.038 0.308 0.698 3.852 Mean Trip Rate 0.912 2.252 9.774 0.479 1.147 4.123 Standard Deviation 0.214 0.799 5.051 0.362 0.754 1.651 Linear Regression Coefficient 0.871 1.597 10.795 0.252 0.458 3.155 y Intercept 0.836 11.883 1.296 3.754 7.061 3.708 r Squared 0.817 0.878 0.671 0.570 0.603 0.479 Logarithmic Regression Coefficient 1.038 1.058 1.635 1.024 1.036 1.367 y Intercept 2.890 6.496 2.453 3.103 5.154 2.793 r Squared 0.961 0.708 0.913 0.841 0.628 0.800
Trip Rates Kenworth 0.747 1.584 9.867 0.182 0.385 2.400 Peterbuilt 1.172 1.931 16.612 0.437 0.720 6.189 Trans-West Truck Cntr. 0.727 3.408 8.000 0.299 1.400 3.286 Sam's Truck Sales, Inc. 1.000 2.083 4.615 1.000 2.083 4.615 Mean Trip Rate 0.912 2.252 9.774 0.479 1.147 4.123
AM PEAK HOUR SITE TOTAL AM PEAK HOUR SITE TRUCK
62

Truck Trip Generation Study
TRIP GENERATION ANALYSIS BY LAND USE CATEGORY (Cont’d) Classification: Truck Sales and Leasing Period: PM Peak Hour Site Total/PM Peak Hour Site Truck Statistics No. of
EmployeesGross
Building Area (KSF)
Acres No. of Employees
Gross Building
Area (KSF)
Acres
Weighted Average Trips 0.823 1.865 10.287 0.297 0.673 3.711 Mean Trip Rate 1.671 3.841 12.608 0.627 1.379 4.704 Standard Deviation 1.779 3.557 5.509 0.702 1.405 2.682 Linear RegressionCoefficient 0.656 1.160 8.249 0.236 0.530 2.631 y Intercept 11.133 20.711 10.843 4.087 4.190 5.744 r Squared 0.881 0.881 0.745 0.529 0.858 0.354 Logarithmic RegressionCoefficient 1.019 1.031 1.285 1.018 1.034 1.246 y Intercept 12.591 18.519 11.783 4.732 5.839 4.823 r Squared 0.959 0.763 0.887 0.811 0.903 0.656
Trip Rates Kenworth 0.697 1.477 9.200 0.222 0.471 2.933 Peterbuilt 0.954 1.572 13.518 0.437 0.720 6.189 Trans-West Truck Cntr. 0.701 3.286 7.714 0.182 0.852 2.000 Sam's Truck Sales, Inc. 4.333 9.028 20.000 1.667 3.472 7.692 Mean Trip Rates 1.671 3.841 12.608 0.627 1.379 4.704
PM PEAK HOUR SITE TOTAL PM PEAK HOUR SITE TRUCK
63

Truck Trip Generation Study
TRIP GENERATION ANALYSIS BY LAND USE CATEGORY (Cont’d) Classification: Truck Sales and Leasing
Lge 2 Ax 3 Axle 4+ Axle Total
42.8 33.0 24.2 100.0
Pass Veh Lge 2 Ax 3 Axle 4+ Axle Total
72.7 11.7 9.0 6.6 100.0
Site Entering & Exiting
Total Enter Total Exit Large Truck Enter
Large Truck Exit
Total Enter Total Exit Large Truck Enter
Large Truck Exit
Split 40.90 59.10 48.94 51.06 51.70 48.30 55.14 44.86Street Entering & Exiting
Total Enter Total Exit Large Truck Enter
Large Truck Exit
Total Enter Total Exit Large Truck Enter
Large Truck Exit
Split 46.85 53.15 52.86 47.14 36.21 63.79 50.98 49.02
a.m. p.m.
a.m. p.m.
Recommended Large Truck Mix (%)
64

Used Truck Sales (not an ITE category)
Facilities included in this category are primarily for the sale of used heavy duty commercial vehicles, 10,000 GVW, or greater. Typically, the facilities are located along major arterials in either commercial or industrial areas.

Truck Trip Generation Study
TRIP GENERATION ANALYSIS BY LAND USE CATEGORY (Cont’d) Classification: Used Truck Sales Period: Total Daily Traffic Statistics No. of Employees Gross Building Area
(KSF)Acres
Weighted Average Trips 20.874 20.039 67.996 Mean Trip Rate 24.702 24.242 55.201 Standard Deviation 31.090 12.604 20.243 Linear Regression Coefficient -5.828 20.671 94.942 y Intercept 707.592 -17.428 -219.206 r Squared 0.014 0.987 1.000 Logarithmic Regression Coefficient 1.009 1.033 1.159 y Intercept 265.680 137.430 102.271 r Squared 0.014 0.974 0.948
Trip RatesArrow 13.640 42.625 35.074 SelecTruck-Freightliner 71.100 20.737 83.335 TCI 7.400 14.000 51.800 TEC CAL 6.666 19.606 50.596 Mean Trip Rates 24.702 24.242 55.201
65

Truck Trip Generation Study
TRIP GENERATION ANALYSIS BY LAND USE CATEGORY (Cont’d) Classification: Used Truck Sales Period: AM Peak Hour Street Total/AM Peak Hour Street Truck
Statistics No. of
EmployeesGross
Building Area (KSF)
Acres No. of Employees
Gross Building
Area (KSF)
Acres
Weighted Average Trips 1.179 1.132 3.841 0.358 0.344 1.168 Mean Trip Rate 1.383 1.661 3.609 0.386 0.247 0.863 Standard Deviation 1.400 0.984 0.803 0.595 0.168 0.649 Linear Regression Coefficient -0.120 0.932 4.233 -0.036 0.387 1.753 y Intercept 34.420 5.537 -3.183 10.458 -1.172 -4.759 r Squared 0.003 1.000 0.991 0.002 1.000 0.987 Logarithmic Regression Coefficient 1.013 1.027 1.124 n.a. n.a. n.a. y Intercept 16.312 10.979 8.786 n.a. n.a. n.a. r Squared 0.039 0.941 0.886 n.a. n.a. n.a.
Trip RatesArrow 1.000 3.125 2.571 0.000 0.000 0.000 SelecTruck-Freightliner 3.455 1.008 4.049 1.273 0.371 1.492 TCI 0.629 1.189 4.400 0.171 0.324 1.200 TEC CAL 0.450 1.324 3.416 0.100 0.294 0.759 Mean Trip Rates 1.383 1.661 3.609 0.386 0.247 0.863
AM PEAK HOUR STREET TOTAL AM PEAK HOUR STREET TRUCK
66

Truck Trip Generation Study
TRIP GENERATION ANALYSIS BY LAND USE CATEGORY (Cont’d) Classification: Used Truck Sales Period: PM Peak Hour Street Total/PM Peak Hour Street Truck
Statistics No. of
EmployeesGross
Building Area (KSF)
Acres No. of Employees
Gross Building
Area (KSF)
Acres
Weighted Average Trips 1.481 1.422 4.825 0.226 0.217 0.738 Mean Trip Rate 1.677 1.945 4.614 0.235 0.171 0.650 Standard Deviation 1.685 0.833 1.857 0.322 0.230 0.854 Linear Regression Coefficient 0.016 1.122 5.024 0.015 0.200 0.860 y Intercept 38.817 8.283 -1.622 5.590 0.480 -0.999 r Squared 0.000 0.988 0.952 0.001 0.785 0.697 Logarithmic Regression Coefficient 1.022 1.028 1.125 n.a. n.a. n.a. y Intercept 15.777 13.124 10.680 n.a. n.a. n.a. r Squared 0.095 0.839 0.752 n.a. n.a. n.a.
Trip RatesArrow 1.000 3.125 2.571 0.000 0.000 0.000 SelecTruck-Freightliner 4.182 1.220 4.901 0.682 0.199 0.799 TCI 1.000 1.892 7.000 0.257 0.486 1.800 TEC CAL 0.525 1.544 3.985 0.000 0.000 0.000 Mean Trip Rates 1.677 1.945 4.614 0.235 0.171 0.650
PM PEAK HOUR STREET TOTAL PM PEAK HOUR STREET TRUCK
67

Truck Trip Generation Study
TRIP GENERATION ANALYSIS BY LAND USE CATEGORY (Cont’d) Classification: Used Truck Sales Period: AM Peak Hour Site Total/PM Peak Hour Site Truck
Statistics No. of
EmployeesGross
Building Area (KSF)
Acres No. of Employees
Gross Building
Area (KSF)
Acres
Weighted Average Trips 1.764 1.694 5.747 0.594 0.571 1.936 Mean Trip Rate 2.309 3.572 6.047 0.829 1.171 1.858 Standard Deviation 1.931 3.875 1.194 0.829 1.552 1.155 Linear Regression Coefficient -0.576 1.155 5.323 -0.435 0.503 2.309 y Intercept 62.007 14.876 3.450 27.267 1.855 -3.030 r Squared 0.044 0.968 0.987 0.120 0.884 0.893 Logarithmic Regression Coefficient 0.990 1.020 1.097 0.939 1.032 1.150 y Intercept 49.852 22.051 18.125 43.553 3.472 2.633 r Squared 0.042 0.971 0.982 0.323 0.431 0.416
Trip RatesArrow 3.000 9.375 7.714 1.111 3.472 2.857 SelecTruck-Freightliner 4.727 1.379 5.541 1.864 0.544 2.184 TCI 0.857 1.622 6.000 0.314 0.595 2.200 TEC CAL 0.650 1.912 4.934 0.025 0.074 0.190 Mean Trip Rates 2.309 3.572 6.047 0.829 1.171 1.858
AM PEAK HOUR SITE TOTAL AM PEAK HOUR SITE TRUCK
68

Truck Trip Generation Study
TRIP GENERATION ANALYSIS BY LAND USE CATEGORY (Cont’d) Classification: Used Truck Sales Period: PM Peak Hour Site Total/PM Peak Hour Site Truck
Statistics No. of
EmployeesGross
Building Area (KSF)
Acres No. of Employees
Gross Building
Area (KSF)
Acres
Weighted Average Trips 1.575 1.513 5.132 0.481 0.462 1.567 Mean Trip Rate 2.195 3.732 5.565 0.687 1.027 1.525 Standard Deviation 1.896 4.721 2.440 0.683 1.402 0.850 Linear Regression Coefficient -0.753 0.973 4.617 -0.369 0.396 1.847 y Intercept 61.705 14.899 4.193 22.534 1.812 -2.272 r Squared 0.094 0.855 0.925 0.140 0.884 0.922 Logarithmic Regression Coefficient 0.980 1.019 1.096 0.959 1.026 1.127 y Intercept 57.602 19.892 15.795 25.697 4.223 3.235 r Squared 0.146 0.660 0.762 0.329 0.681 0.715
Trip RatesArrow 3.444 10.764 8.857 1.000 3.125 2.571 SelecTruck-Freightliner 4.182 1.220 4.901 1.500 0.437 1.758 TCI 0.429 0.811 3.000 0.171 0.324 1.200 TEC CAL 0.725 2.132 5.503 0.075 0.221 0.569 Mean Trip Rates 2.195 3.732 5.565 0.687 1.027 1.525
PM PEAK HOUR SITE TOTAL PM PEAK HOUR SITE TRUCK
69

Truck Trip Generation Study
TRIP GENERATION ANALYSIS BY LAND USE CATEGORY (Cont’d) Classification: Used Truck Sales
Recommended Large Truck Mix ( %)
Lge 2 Ax 3 Axle 4+ Axle Total
26.3 42.9 30.8 100.0
Pass Veh Lge 2 Ax 3 Axle 4+ Axle Total
73.7 4.9 12.1 9.2 100.0
Site Entering & Exiting
Total Enter Total Exit Large Truck Enter
Large Truck Exit
Total Enter Total Exit Large Truck Enter
Large Truck Exit
Split 47.59 52.41 39.68 60.32 53.29 46.71 49.02 50.98Street Entering & Exiting
Total Enter Total Exit Large Truck Enter
Large Truck Exit
Total Enter Total Exit Large Truck Enter
Large Truck Exit
Split 68.85 31.15 48.78 51.22 29.94 70.06 33.33 66.67
a.m. p.m.
a.m. p.m.
70

Truck Terminal (ITE code 030)
Truck terminals are facilities where goods are transferred between trucks, or trucks and railroads.

Truck Trip Generation Study
TRIP GENERATION ANALYSIS BY LAND USE CATEGORY (Cont’d) Classification: Truck Terminals Period: Total Daily Traffic
Statistics No. of Employees Gross Building Area (KSF)
Acres
Weighted Average Trips 3.428 16.857 42.582 Mean Trip Rate 5.490 32.775 52.500 Standard Deviation 2.930 34.597 28.337 Linear RegressionCoefficient 1.844 8.249 27.391 y Intercept 480.332 530.855 370.843 r Squared 0.928 0.776 0.831 Logarithmic RegressionCoefficient 1.002 1.007 1.027 y Intercept 507.692 555.870 455.905 r Squared 0.728 0.512 0.653
Trip RatesArrow 9.423 11.461 44.172 SelecTruck-Freightliner 5.444 24.102 94.556 TCI 4.711 83.905 36.663 TEC CAL 2.379 11.631 34.608 Mean Trip Rates 5.490 32.775 52.500
71

Truck Trip Generation Study
TRIP GENERATION ANALYSIS BY LAND USE CATEGORY (Cont’d) Classification: Truck Terminals Period: AM Peak Hour Street Total/PM Peak Hour Street Truck
Statistics No. of
EmployeesGross
Building Area (KSF)
Acres No. of Employees
Gross Building
Area (KSF)
Acres
Weighted Average Trips 0.104 0.511 1.290 0.047 0.231 0.584 Mean Trip Rate 0.222 1.314 2.033 0.101 0.542 0.940 Standard Deviation 0.156 1.516 1.510 0.074 0.556 0.763 Linear Regression Coefficient 0.003 -0.018 0.011 0.003 0.005 0.007 y Intercept 30.620 32.615 31.227 13.401 13.931 14.087 r Squared 0.006 0.010 0.000 0.024 0.003 0.001 Logarithmic Regression Coefficient 1.000 1.000 1.004 1.000 1.001 1.004 y Intercept 26.759 29.118 26.724 11.714 12.427 11.971 r Squared 0.041 0.000 0.026 0.078 0.020 0.032
Trip RatesT N T Bestway 0.417 0.507 1.953 0.194 0.236 0.911 Overnite Transportation 0.237 1.048 4.113 0.116 0.513 2.011 USF Bestway 0.198 3.524 1.540 0.075 1.333 0.583 Roadway Express Inc. 0.036 0.177 0.527 0.018 0.086 0.255 Mean Trip Rates 0.222 1.314 2.033 0.101 0.542 0.940
AM PEAK HOUR STREET TOTAL AM PEAK HOUR STREET TRUCK
72

Truck Trip Generation Study
TRIP GENERATION ANALYSIS BY LAND USE CATEGORY (Cont’d) Classification: Truck Terminals Period: PM Peak Hour Street Total/PM Peak Hour Street Truck
Statistics No. of
EmployeesGross
Building Area (KSF)
Acres No. of Employees
Gross Building
Area (KSF)
Acres
Weighted Average Trips 0.122 0.600 1.516 0.062 0.304 0.768 Mean Trip Rate 0.269 1.550 2.095 0.142 0.756 1.004 Standard Deviation 0.241 1.960 0.881 0.151 0.963 0.490 Linear Regression Coefficient 0.030 0.100 0.539 0.022 0.090 0.408 y Intercept 28.013 30.811 23.851 11.941 13.195 8.790 r Squared 0.542 0.260 0.726 0.637 0.428 0.853 Logarithmic Regression Coefficient 1.001 1.003 1.015 1.001 1.004 1.022 y Intercept 27.150 29.520 24.203 11.951 12.871 9.925 r Squared 0.519 0.235 0.685 0.498 0.310 0.739
Trip RatesT N T Bestway 0.611 0.743 2.865 0.361 0.439 1.693 Overnite Transportation 0.153 0.676 2.651 0.047 0.210 0.823 USF Bestway 0.251 4.476 1.956 0.123 2.190 0.957 Roadway Express Inc. 0.063 0.306 0.909 0.038 0.183 0.545 Mean Trip Rates 0.269 1.550 2.095 0.142 0.756 1.004
PM PEAK HOUR STREET TOTAL PM PEAK HOUR STREET TRUCK
73

Truck Trip Generation Study
TRIP GENERATION ANALYSIS BY LAND USE CATEGORY (Cont’d) Classification: Truck Terminals Period: AM Peak Hour Site Total/AM Peak Hour Site Truck Statistics No. of
EmployeesGross
Building Area (KSF)
Acres No. of Employees
Gross Building
Area (KSF)
Acres
Weighted Average Trips 0.157 0.770 1.946 0.059 0.288 0.727 Mean Trip Rate 0.293 1.776 2.714 0.156 0.977 1.243 Standard Deviation 0.183 2.027 1.692 0.136 1.333 0.812 Linear Regression Coefficient 0.044 0.167 0.642 -0.018 -0.123 -0.233 y Intercept 34.247 37.172 31.833 23.314 25.337 23.437 r Squared 0.550 0.337 0.481 0.318 0.598 0.208 Logarithmic Regression Coefficient 1.001 1.004 1.016 0.998 0.991 0.979 y Intercept 30.970 33.976 29.010 23.595 26.045 25.025 r Squared 0.441 0.231 0.396 0.509 0.758 0.405
Trip RatesT N T Bestway 0.528 0.642 2.474 0.333 0.405 1.563 Overnite Transportation 0.295 1.305 5.119 0.116 0.513 2.011 USF Bestway 0.267 4.762 2.081 0.166 2.952 1.290 Roadway Express Inc. 0.081 0.397 1.182 0.008 0.037 0.109 Mean Trip Rates 0.293 1.776 2.714 0.156 0.977 1.243
AM PEAK HOUR SITE TOTAL AM PEAK HOUR SITE TRUCK
74

Truck Trip Generation Study
TRIP GENERATION ANALYSIS BY LAND USE CATEGORY (Cont’d) Classification: Truck Terminals Period: PM Peak Hour Site Total/PM Peak Hour Site Truck
Statistics No. of
EmployeesGross
Building Area (KSF)
Acres No. of Employees
Gross Building
Area (KSF)
Acres
Weighted Average Trips 0.176 0.864 2.181 0.091 0.446 1.126 Mean Trip Rate 0.335 2.310 2.891 0.194 1.269 1.697 Standard Deviation 0.222 3.107 1.276 0.135 1.650 1.047 Linear Regression Coefficient 0.043 0.125 0.786 0.002 -0.033 0.063 y Intercept 40.073 45.548 34.058 26.907 29.562 25.968 r Squared 0.388 0.134 0.516 0.003 0.042 0.015 Logarithmic Regression Coefficient 1.001 1.003 1.018 1.000 1.000 1.005 y Intercept 35.506 40.255 31.450 23.461 26.204 22.491 r Squared 0.378 0.132 0.461 0.035 0.005 0.050
Trip RatesT N T Bestway 0.611 0.743 2.865 0.361 0.439 1.693 Overnite Transportation 0.253 1.118 4.388 0.174 0.769 3.016 USF Bestway 0.390 6.952 3.038 0.209 3.714 1.623 Roadway Express Inc. 0.088 0.428 1.273 0.031 0.153 0.455 Mean Trip Rates 0.335 2.310 2.891 0.194 1.269 1.697
PM PEAK HOUR SITE TOTAL PM PEAK HOUR SITE TRUCK
75

Truck Trip Generation Study
TRIP GENERATION ANALYSIS BY LAND USE CATEGORY (Cont’d) Classification: Truck Terminals
Recommended Large Truck Mix ( %)
Lge 2 Ax 3 Axle 4+ Axle Total
11.9 24.4 63.7 100.0
Pass Veh Lge 2 Ax 3 Axle 4+ Axle Total
46.0 6.1 13.9 34.0 100.0
Site Entering & Exiting
Total Enter Total Exit Large Truck Enter
Large Truck Exit
Total Enter Total Exit Large Truck Enter
Large Truck Exit
Split 51.27 48.73 49.23 50.77 46.36 53.64 66.39 33.61Street Entering & Exiting
Total Enter Total Exit Large Truck Enter
Large Truck Exit
Total Enter Total Exit Large Truck Enter
Large Truck Exit
Split 52.86 47.14 43.75 56.25 60.80 39.20 66.30 33.70
a.m. p.m.
a.m. p.m.
76
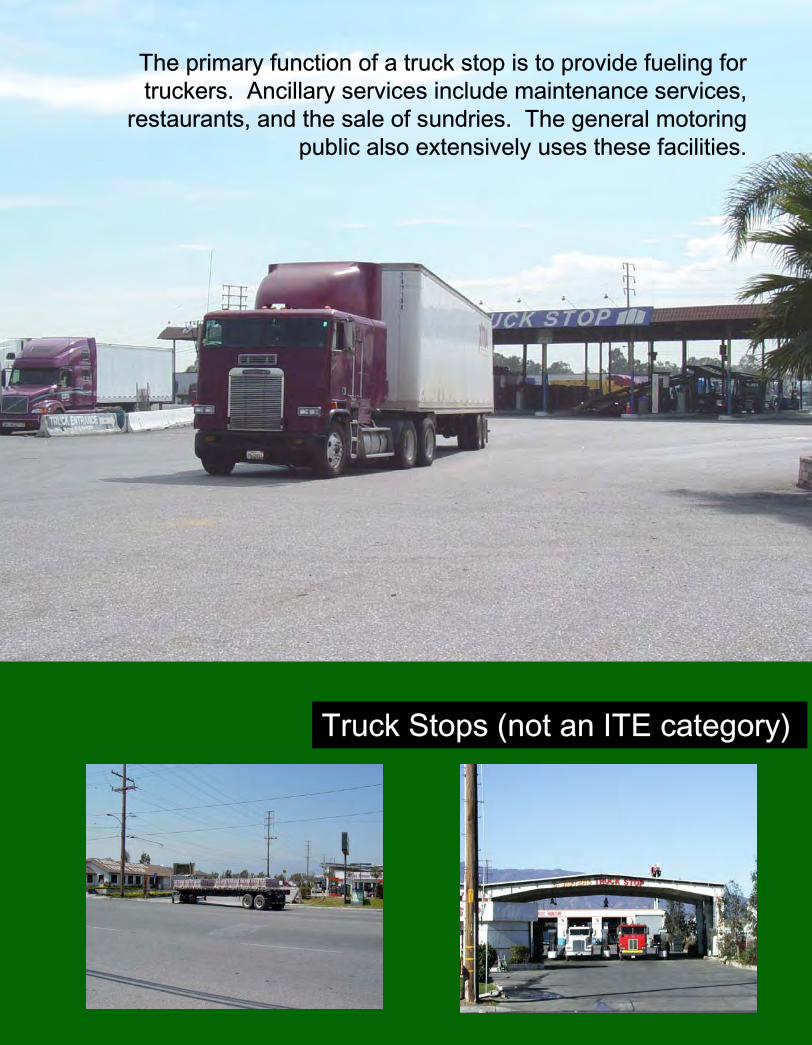
The primary function of a truck stop is to provide fueling for truckers. Ancillary services include maintenance services,
restaurants, and the sale of sundries. The general motoring public also extensively uses these facilities.
Truck Stops (not an ITE category)

Truck Trip Generation Study
TRIP GENERATION ANALYSIS BY LAND USE CATEGORY (Cont’d) Classification: Truck Stops Period: Total Daily Traffic TOTAL DAILY TRAFFIC TOTAL DAILY TRAFFICStatistics No. of Fueling
PositionsAcres
Weighted Average Trips 34.565 319.730 Mean Trip Rate 63.946 359.657 Standard Deviation 39.016 219.535 Linear Regression Coeff icient n.a. n.a. y Intercept n.a. n.a. r Squared n.a. n.a.Logarithmic Regression Coeff icient n.a. n.a. y Intercept n.a. n.a. r Squared n.a. n.a.
Trip Rates3 Sisters Truck Stop 79.400 272.380 A-Z Fuel Stop 48.490 446.930 Pilot Truck Stop 0.000 0.000 T/A Truck Stop 0.000 0.000 Mean Trip Rates 63.946 359.657
77

Truck Trip Generation Study
TRIP GENERATION ANALYSIS BY LAND USE CATEGORY (Cont’d) Classification: Truck Stops Period: AM Peak Hour Site Total/PM Peak Hour Site Truck Statistics No. of Fueling
PositionsAcres No. of Fueling
PositionsAcres
Weighted Average Trips 2.257 20.875 1.189 11.000 Mean Trip Rate 2.088 32.149 1.675 16.700 Standard Deviation 2.441 15.144 2.311 0.155 Linear Regression Coeff icient n.a. n.a. n.a. n.a. y Intercept n.a. n.a. n.a. n.a. r Squared n.a. n.a. n.a. n.a.Logarithmic Regression Coeff icient n.a. n.a. n.a. n.a. y Intercept n.a. n.a. n.a. n.a. r Squared n.a. n.a. n.a. n.a.
Trip Rates3 Sisters Truck Stop 3.700 21.441 4.900 16.810 A-Z Fuel Stop 4.650 42.857 1.800 16.590 Pilot Truck Stop 0.000 n.a. 0.000 n.a.T/A Truck Stop 0.000 n.a. 0.000 n.a.Mean Trip Rates 2.088 32.149 1.675 16.700
AM PEAK HOUR STREET TOTAL AM PEAK HOUR STREET TRUCK
78

Truck Trip Generation Study
TRIP GENERATION ANALYSIS BY LAND USE CATEGORY (Cont’d) Classification: Truck Stops Period: PM Peak Hour Street Total/PM Peak Hour Street Truck Statistics No. of Fueling
PositionsAcres No. of Fueling
PositionsAcres
Weighted Average Trips 8.216 76.000 4.811 44.500 Mean Trip Rate 8.548 32.149 5.371 16.700 Standard Deviation 4.535 15.144 2.760 0.155 Linear Regression Coeff icient -16.176 n.a. -6.412 n.a. y Intercept 451.265 n.a. 207.618 n.a. r Squared 0.297 n.a. 0.085 n.a.Logarithmic Regression Coeff icient 0.885 n.a. 0.897 n.a. y Intercept 1339.042 n.a. 575.237 n.a. r Squared 0.365 n.a. 0.170 n.a.
Trip Rates3 Sisters Truck Stop 4.600 21.441 4.900 16.810 A-Z Fuel Stop 4.650 42.857 1.800 16.590 Pilot Truck Stop 12.733 n.a. 6.467 n.a.T/A Truck Stop 12.211 n.a. 8.316 n.a.Mean Trip Rates 8.548 32.149 5.371 16.700
PM PEAK HOUR STREET TOTAL PM PEAK HOUR STREET TRUCK
79

Truck Trip Generation Study
TRIP GENERATION ANALYSIS BY LAND USE CATEGORY (Cont’d) Classification: Truck Stops Period: AM Peak Hour Site Total/AM Peak Hour Site Truck Statistics No. of Fueling
PositionsAcres No. of Fueling
PositionsAcres
Weighted Average Trips 2.324 21.500 1.878 17.375 Mean Trip Rate 2.150 21.550 1.738 17.852 Standard Deviation 2.949 0.154 2.319 1.474 Linear Regression Coeff icient n.a. n.a. n.a n.a. y Intercept n.a. n.a. n.a n.a. r Squared n.a. n.a. n.a n.a.Logarithmic Regression Coeff icient n.a. n.a. n.a n.a. y Intercept n.a. n.a. n.a n.a. r Squared n.a. n.a. n.a n.a.
Trip Rates3 Sisters Truck Stop 6.250 21.441 4.900 16.810 A-Z Fuel Stop 2.350 21.659 2.050 18.894 Pilot Truck Stop 0.000 n.a. 0.000 n.a.T/A Truck Stop 0.000 n.a. 0.000 n.a.Mean Trip Rates 2.150 21.550 1.738 17.852
AM PEAK HOUR SITE TOTAL AM PEAK HOUR SITE TRUCK
80

Truck Trip Generation Study
TRIP GENERATION ANALYSIS BY LAND USE CATEGORY (Cont’d) Classification: Truck Stops Period: PM Peak Hour Site Total/PM Peak Hour Site Truck Statistics No. of Fueling
PositionsAcres No. of Fueling
PositionsAcres
Weighted Average Trips 9.500 87.875 5.000 46.250 Mean Trip Rate 9.907 28.693 5.288 15.317 Standard Deviation 6.281 10.256 3.360 2.111 Linear Regression Coeff icient -20.735 n.a. -0.529 n.a. y Intercept 559.353 n.a. 102.294 n.a. r Squared 0.222 n.a. 0.000 n.a.Logarithmic Regression Coeff icient 0.860 n.a. 0.950 n.a. y Intercept 2476.988 n.a. 197.298 n.a. r Squared 0.319 n.a. 0.027 n.a.
Trip Rates3 Sisters Truck Stop 5.100 21.441 4.900 16.810 A-Z Fuel Stop 3.900 35.945 1.500 13.825 Pilot Truck Stop 14.733 n.a. 5.067 n.a.T/A Truck Stop 15.895 n.a. 9.684 n.a.Mean Trip Rates 9.907 28.693 5.288 15.317
PM PEAK HOUR SITE TOTAL PM PEAK HOUR SITE TRUCK
81

Truck Trip Generation Study
TRIP GENERATION ANALYSIS BY LAND USE CATEGORY (Cont’d) Classification: Truck Stops
Recommended Large Truck Mix ( %)
Lge 2 Ax 3 Axle 4+ Axle Total
4.9 16.2 78.9 100.0
Pass Veh Lge 2 Ax 3 Axle 4+ Axle Total
44.1 2.2 9.0 44.6 100.0
Site Entering & Exiting
Total Enter Total Exit Large Truck Enter
Large Truck Exit
Total Enter Total Exit Large Truck Enter
Large Truck Exit
Split 52.33 47.67 53.96 46.04 50.92 49.08 54.86 45.14Street Entering & Exiting
Total Enter Total Exit Large Truck Enter
Large Truck Exit
Total Enter Total Exit Large Truck Enter
Large Truck Exit
Split 46.11 53.89 45.45 54.55 50.00 50.00 53.09 46.91
a.m. p.m.
a.m. p.m.
82

APPENDICES
A. Surveyed Site ListB. Analysis of 24-hour Driveway CountsC. Peak Arterial Locations

Truck Trip Generation Study
APPENDIX A – SURVEYED SITE LIST
A-1
Land Uses Name of Site ID. No Location of Site Peak Hour AM Peak Hour PM
No. of Employees Gross Area
Warehouse, JR Distribution 3 10850 Business 6:45-7:45 16:30-17:30 20 257,810Light Medline Industries 22 14650 Meyer Canyon 6:15-7:15 13:45-14:45 120 221,000(< 100TSF) Kumo Tires 23 14605 Miller Ave. 7:15-8:15 17:15-18:15 82 286,353
Barth & Dryfuss 24 1150 S. Etiwanda 6:45-7:45 15:45-16:45 225 235,000Warehouse, Target 4 14750 Miller Ave. 5:00-6:00 15:45-16:45 1,100 1,400,000 Heavy Thrifty/Big 5 5 7351 McGuire 4:00-5:00 13:15-14:15 200 400,000(>100TSF) TAB 6 13050 Marlay Ave 6:00-7:00 14:45-15:45 160 285,000
Sportsmart 25 12925 Marlay Ave 5:15-6:15 14:30-15:30 280 199,580Industrial, Light G & F Pallets 26 10407 Elm Ave. 7:15-8:15 13:15-14:15 16 6,000
H Master Halco-Fence 27 9121 Cherry Ave. 5:00-6:00 13:15-14:15 70 84,960Angelus Blocks 28 14515 Whittram Ave 8:00-9:00 13:15-14:15 40 8,254Peterman Lumber 38 10330 Elm Ave 6:45-7:45 14:00-15:00 48 20,000James Hardie 13 10573 Beech 7:15-8:15 13:45-14:45 227 205,633Robertson Ready Mix 15 13792 Slover Ave. 7:00-8:00 16:45-17:45 26 120Forged Metals 29 10901 Elm Avenue 3:00-4:00 13:45-14:45 350 64,520All State Recycling 39 8889 Etiwanda 10:15-11:15 12:45-13:45 16 40,750Herman Engr &Manufc 18 8827 Rochester 10:00-11:00 16:45-17:45 30 29,987Arrowhead 31 5772 Jurupa
/Etiwanda4:15-5:15 13:15-14:15
300 385,000Schlosser Company 32 11711 Arrow 4:00-5:00 15:15-16:15 210 272,500Excel Logistics 40 101 Napa-off 3:15-4:15 11:45-12:45 200 800,000Kenworth 19 9730 Cherry Ave. 7:30-8:30 16:45-17:45 99 46,725Peterbuilt 20 14490 Slover Ave 11:00-12:00 13:30-14:30 87 52,813Trans-West Truck Cntr. 21 10150 Cherry Ave. 9:30-10:30 13:15-14:15 77 16,432Sam's Truck Sales, Inc 43 15083 Valley Blvd 7:45-8:45 16:00-17:00 3 1,440Arrow 33 10175 Cherry Ave 10:30-11:30 14:00-15:00 9 2,880SelecTruck-Freightliner 34 13750 Valley Blvd 11:15-12:15 16:45-17:45 22 75,432TCI 35 Cherry/Merill 10:45-11:45 16:45-17:45 35 18,500TEC CAL 41 14085 Valley 7:45-8:45 12:45-13:45 40 13,600T N T Bestway 46 10691 Poplar 10:15-11:15 16:45-17:45 36 29,600Overnite Transportation 36 9880 Banana Ave. 10:45-11:45 18:30-19:30 190 42,920USF Bestway 37 10661 Etiwanda Ave. 9:30-10:30 19:45-20:45 187 10,500Roadway Express Inc. 47 18298 Slover Ave. 6:15-7:15 14:30-15:30 800 163,6503 Sisters Truck Stop 44 14416 Slover 9:30-10:30 12:15-13:15 22 14800A-Z Fuel Stop 45 14529 SanBerdo 7:00-8:00 15:45-16:45 6 4000
Truck Stops
Used Truck Sales
Truck Terminals
Industrial, Heavy
Industrial Park
Truck Sales and Leasing
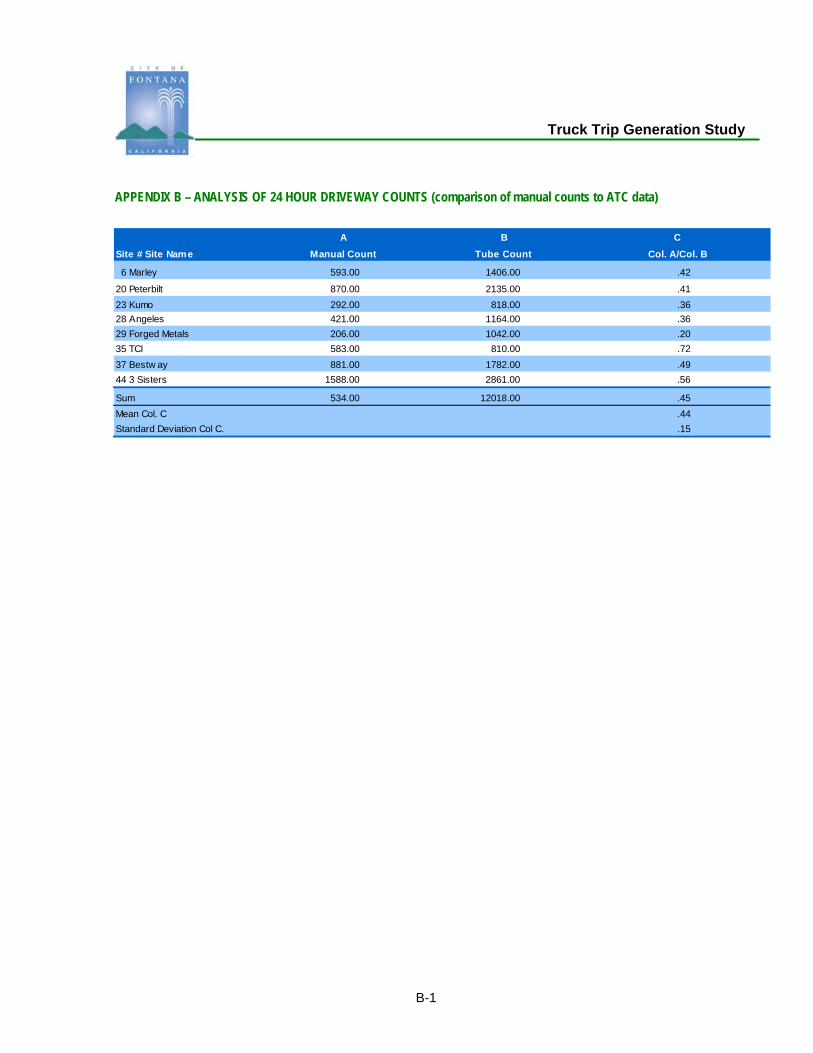
Truck Trip Generation Study
APPENDIX B – ANALYSIS OF 24 HOUR DRIVEWAY COUNTS (comparison of manual counts to ATC data)
B-1
A B CSite # Site Name Manual Count Tube Count Col. A/Col. B
6 Marley 593.00 1406.00 .42
20 Peterbilt 870.00 2135.00 .41 23 Kumo 292.00 818.00 .36 28 Angeles 421.00 1164.00 .36 29 Forged Metals 206.00 1042.00 .20 35 TCI 583.00 810.00 .72 37 Bestw ay 881.00 1782.00 .49 44 3 Sisters 1588.00 2861.00 .56
Sum 534.00 12018.00 .45 Mean Col. C .44 Standard Deviation Col C. .15

City of Fontana Combined
File Name: C:\Program Files\JAMAR\TraxPro\Data Files\FOFHCICH.twfStart Date: 8/5/2002Start Time: 12:00:00 PMSite Code: 000043101334CITY OF FONTANAFOOTHILL BOULEVARDB/CITRUS AVENUE & CHERRY AVENUE24 HR DIRECTIONAL CLASSIFICATION COUNT
Date Time Bike
s
Car
s &
Trlrs
2 Ax
le L
ong
Buse
s
2 Ax
le 6
Tire
3 Ax
le S
ingl
e
4 Ax
le S
ingl
e
<5 A
xle
Dou
ble
5 Ax
le D
oubl
e
>5 A
xle
Dou
ble
<6 A
xle
Mul
ti
6 Ax
le M
ulti
>6 A
xl M
ulti
8/5/2002 12:00:00 PM 0 703 124 3 20 4 0 7 2 0 1 0 08/5/2002 1:00:00 PM 2 847 158 4 29 6 0 12 3 1 2 0 08/5/2002 2:00:00 PM 2 987 206 9 24 4 0 15 5 1 0 0 18/5/2002 3:00:00 PM 5 1219 190 4 25 5 0 11 5 0 2 1 18/5/2002 4:00:00 PM 3 1033 167 4 19 3 0 15 2 1 0 1 08/5/2002 5:00:00 PM 3 1195 190 7 26 2 0 12 3 0 0 0 18/5/2002 6:00:00 PM 5 898 169 3 25 1 0 4 4 0 0 0 08/5/2002 7:00:00 PM 4 723 119 2 7 3 0 5 2 0 0 0 08/5/2002 8:00:00 PM 3 526 76 2 3 1 0 2 1 0 1 0 08/5/2002 9:00:00 PM 3 461 73 1 6 2 0 0 0 0 0 0 18/5/2002 10:00:00 PM 2 384 52 1 2 3 0 1 0 0 0 0 08/5/2002 11:00:00 PM 0 278 36 0 2 1 0 0 1 0 0 0 08/6/2002 12:00:00 AM 0 222 30 1 3 0 0 2 0 0 1 0 08/6/2002 1:00:00 AM 0 126 23 0 1 0 0 1 0 0 0 0 08/6/2002 2:00:00 AM 0 85 15 0 0 3 0 0 1 0 0 0 08/6/2002 3:00:00 AM 0 96 11 0 1 1 0 0 0 0 0 0 08/6/2002 4:00:00 AM 1 103 18 3 2 1 0 1 0 0 0 0 08/6/2002 5:00:00 AM 0 167 25 1 4 3 0 2 0 0 0 0 08/6/2002 6:00:00 AM 3 360 64 5 10 0 0 4 1 0 0 0 08/6/2002 7:00:00 AM 4 552 97 7 21 1 0 1 2 0 0 0 08/6/2002 8:00:00 AM 1 493 102 0 15 4 1 7 4 0 0 0 08/6/2002 9:00:00 AM 2 506 101 4 22 3 0 5 6 1 0 0 08/6/2002 10:00:00 AM 0 565 92 8 16 5 0 8 2 0 0 0 18/6/2002 11:00:00 AM 0 702 137 5 23 1 0 6 0 0 0 0 0
12-APPENDIX B01-FOFHCICHE1-EB 1 EB 10/1/2003

City of Fontana Combined
File Name: C:\Program Files\JAMAR\TraxPro\Data Files\FOFHCICH.twfStart Date: 8/5/2002Start Time: 12:00:00 PMSite Code: 000043101334CITY OF FONTANAFOOTHILL BOULEVARDB/CITRUS AVENUE & CHERRY AVENUE24 HR DIRECTIONAL CLASSIFICATION COUNT
Date Time Bike
s
Car
s &
Trl rs
2 Ax
le L
ong
Bus e
s
2 Ax
le 6
Tire
3 Ax
le S
i ngl
e
4 Ax
le S
i ngl
e
<5 A
x le
Dou
ble
5 Ax
le D
oubl
e
>5 A
x le
Dou
ble
<6 A
x le
Mul
ti
6 Ax
le M
ulti
>6 A
x l M
u lti
8/5/2002 12:00:00 PM 5 642 179 6 26 3 0 8 14 0 0 0 08/5/2002 1:00:00 PM 3 704 174 6 33 2 0 7 10 0 2 0 08/5/2002 2:00:00 PM 4 846 207 10 20 8 0 2 6 0 0 0 08/5/2002 3:00:00 PM 2 679 148 3 21 5 0 4 10 0 0 0 18/5/2002 4:00:00 PM 4 755 134 5 26 4 0 11 8 0 1 1 08/5/2002 5:00:00 PM 3 709 186 2 21 6 0 5 2 2 0 0 08/5/2002 6:00:00 PM 2 646 142 2 16 7 0 1 5 0 0 1 08/5/2002 7:00:00 PM 3 545 130 1 7 1 0 5 6 0 0 0 08/5/2002 8:00:00 PM 2 453 119 1 9 0 0 3 5 0 1 0 08/5/2002 9:00:00 PM 6 402 66 1 8 1 0 1 7 0 0 0 08/5/2002 10:00:00 PM 0 274 51 0 3 2 0 1 5 0 0 0 08/5/2002 11:00:00 PM 0 164 25 0 1 0 0 0 0 0 0 0 08/6/2002 12:00:00 AM 0 101 21 0 1 0 0 0 0 0 0 0 08/6/2002 1:00:00 AM 0 63 15 0 2 2 0 1 3 0 1 0 08/6/2002 2:00:00 AM 1 66 19 0 4 0 0 2 7 0 0 0 08/6/2002 3:00:00 AM 1 137 50 2 4 1 0 1 1 0 0 0 08/6/2002 4:00:00 AM 3 421 135 2 12 2 0 3 3 0 0 0 08/6/2002 5:00:00 AM 5 814 210 3 29 0 0 2 7 0 0 0 08/6/2002 6:00:00 AM 6 807 220 4 26 4 0 6 4 0 0 1 08/6/2002 7:00:00 AM 5 874 242 3 25 1 0 4 8 0 0 0 08/6/2002 8:00:00 AM 3 589 163 8 17 4 0 3 7 0 0 0 08/6/2002 9:00:00 AM 4 562 148 5 30 3 0 3 12 0 0 0 08/6/2002 10:00:00 AM 6 561 134 5 23 4 0 7 10 0 0 1 08/6/2002 11:00:00 AM 4 613 163 5 24 4 0 6 8 0 0 0 0
12-APPENDIX B02-FOFHCICHW1-WB 1 WB 10/1/2003

City of Fontana EB curb+median
File Name: C:\Program Files\JAMAR\TraxPro\Trip Generation\FOVAWOCH.TWFStart Date: 7/30/2002Start Time: 12:00:00 AMSite Code: 43106355Station ID: FOVAWOCHCITY OF FONTANAVALLEY BOULEVARDWEST OF CHERRY AVENUE24 HR DIRECTIONAL CLASSIFICATION COUNT
Date Time Bike
s
Car
s &
Trlrs
2 Ax
le L
ong
Buse
s
2 Ax
le 6
Tire
3 Ax
le S
ingl
e
4 Ax
le S
ingl
e
<5 A
xle
Dou
ble
5 Ax
le D
oubl
e
>5 A
xle
Dou
ble
<6 A
xle
Mul
ti
6 Ax
le M
ulti
>6 A
xl M
ulti
7/30/2002 12:00:00 AM 0 47 15 0 5 3 0 0 18 0 2 0 27/30/2002 1:00:00 AM 1 27 11 0 3 6 0 0 18 0 1 0 27/30/2002 2:00:00 AM 0 26 10 0 3 1 0 1 13 0 2 0 07/30/2002 3:00:00 AM 1 19 6 2 1 7 0 0 16 0 1 0 07/30/2002 4:00:00 AM 2 30 7 1 3 7 0 1 18 1 1 2 07/30/2002 5:00:00 AM 2 48 13 2 6 5 0 2 24 1 1 0 17/30/2002 6:00:00 AM 2 100 37 4 12 5 0 3 30 1 1 0 07/30/2002 7:00:00 AM 1 140 48 6 18 9 0 0 26 0 2 0 07/30/2002 8:00:00 AM 3 116 52 7 19 11 0 7 31 0 1 1 17/30/2002 9:00:00 AM 3 125 59 5 34 12 0 3 51 0 2 0 07/30/2002 10:00:00 AM 3 135 64 7 22 15 0 7 51 1 0 3 17/30/2002 11:00:00 AM 3 161 81 10 36 10 0 7 36 0 1 0 17/30/2002 12:00:00 PM 2 196 90 11 37 16 1 8 58 1 1 2 07/30/2002 1:00:00 PM 5 245 99 17 31 18 0 7 48 0 1 0 07/30/2002 2:00:00 PM 3 313 126 8 50 13 1 8 58 0 0 2 07/30/2002 3:00:00 PM 6 446 132 6 53 19 0 7 59 1 2 1 17/30/2002 4:00:00 PM 3 430 130 9 43 14 1 5 77 0 0 1 07/30/2002 5:00:00 PM 6 381 117 11 42 5 0 5 61 0 0 0 27/30/2002 6:00:00 PM 1 197 57 4 21 9 0 4 53 0 1 0 17/30/2002 7:00:00 PM 0 133 51 4 15 5 0 2 27 0 2 0 17/30/2002 8:00:00 PM 2 105 41 5 12 5 0 2 33 0 2 0 07/30/2002 9:00:00 PM 1 92 23 2 9 5 0 0 27 0 1 0 07/30/2002 10:00:00 PM 1 78 18 1 3 5 0 1 9 0 2 0 07/30/2002 11:00:00 PM 1 64 16 3 5 5 0 0 16 0 1 0 0
12-APPENDIX B03-FOVAWOCHE-2EB 2 EB 10/1/2003

City of Fontana Cherry N-O Valley
CITY OF FONTANAVisual Classification Count
From a turning movement count request by the city on 2/20/2002
Cherry Ave N/O Valley BlvdInterval Northbound Southbound
Beginning Pass Veh Lge 2-3 Ax 4+ Axle Total Pass Veh Lge 2-3 Ax 4+ Axle Total6:00 111 10 12 133 109 18 17 1446:15 112 11 19 142 130 19 24 1736:30 211 22 17 250 173 28 26 2276:45 172 7 17 196 153 27 18 1987:00 158 15 22 195 211 24 16 2517:15 176 10 21 207 182 15 22 2197:30 140 13 16 169 173 22 25 2207:45 182 12 26 220 141 29 24 1948:00 101 16 15 132 132 38 22 1928:15 116 25 29 170 140 38 34 2128:30 92 28 27 147 134 41 21 1968:45 103 20 25 148 130 38 34 202Total 1674 189 246 2109 1808 337 283 2428
11:00 132 23 38 193 112 40 36 18811:15 129 16 32 177 114 43 32 18911:30 117 16 35 168 117 42 26 18511:45 116 20 25 161 95 36 20 15112:00 118 21 27 166 138 43 29 21012:15 121 27 17 165 135 29 27 19112:30 126 25 25 176 123 27 26 17612:45 120 10 24 154 125 38 17 180Total 979 158 223 1360 959 298 213 1470
15:00 136 18 12 166 142 19 19 18015:15 132 16 13 161 152 20 12 18415:30 138 8 12 158 170 23 14 20715:45 139 18 7 164 164 26 21 21116:00 147 10 6 163 224 12 17 25316:15 145 9 11 165 186 9 23 21816:30 113 12 7 132 147 11 13 17116:45 117 4 10 131 179 8 18 20517:00 121 6 6 133 165 14 14 19317:15 126 4 12 142 175 11 15 20117:30 115 3 6 124 177 9 11 19717:45 113 4 9 126 181 12 11 20418:00 93 5 6 104 156 18 14 18818:15 113 2 4 119 117 8 5 13018:30 104 1 5 110 134 3 16 15318:45 123 3 10 136 107 3 7 117Total 1975 123 136 2234 2576 206 230 3012
12-APPENDIX B04-Fontana-Cherry N-O Valley Blvd Visual Class-33 10/1/2003

City of Fontana Combined
File Name: C:\Program Files\JAMAR\TraxPro\Data Files\FOSBWOBE.TWFStart Date: 7/24/2002Start Time: 7:00:00 AMSite Code: 43107858CITY OF FONTANASAN BERNARDINO AVENUEW/O BEECH AVE24 HR DIRECTIONAL CLASSIFICATION COUNT
Date Time Bike
s
Car
s &
Trlrs
2 Ax
le L
ong
Buse
s
2 Ax
le 6
Tire
3 Ax
le S
ingl
e
4 Ax
le S
ingl
e
<5 A
xle
Dou
ble
5 Ax
le D
oubl
e
>5 A
xle
Dou
ble
<6 A
xle
Mul
ti
6 Ax
le M
ulti
>6 A
xl M
ulti
7/24/2002 7:00:00 AM 0 274 47 7 20 1 0 2 0 0 0 0 07/24/2002 8:00:00 AM 2 265 49 11 7 5 0 0 0 0 0 0 07/24/2002 9:00:00 AM 0 234 31 9 14 3 0 2 6 0 0 0 07/24/2002 10:00:00 AM 2 261 58 13 11 3 0 1 12 0 0 0 07/24/2002 11:00:00 AM 1 243 71 10 13 4 0 1 5 0 0 0 17/24/2002 12:00:00 PM 3 329 65 13 22 2 0 0 2 0 0 0 17/24/2002 1:00:00 PM 5 380 76 9 13 1 0 3 4 0 1 0 07/24/2002 2:00:00 PM 2 424 101 6 14 5 0 3 7 0 0 0 17/24/2002 3:00:00 PM 1 571 129 11 14 2 0 3 4 1 1 0 07/24/2002 4:00:00 PM 1 559 111 12 22 3 0 4 3 0 0 0 07/24/2002 5:00:00 PM 3 556 99 7 21 4 1 4 5 0 0 0 07/24/2002 6:00:00 PM 0 523 95 7 7 1 1 1 2 0 0 0 07/24/2002 7:00:00 PM 0 439 91 3 2 1 0 0 2 0 0 0 07/24/2002 8:00:00 PM 3 326 61 3 12 0 0 0 2 0 0 0 07/24/2002 9:00:00 PM 0 263 43 4 1 0 0 0 0 0 0 0 07/24/2002 10:00:00 PM 0 179 25 2 0 0 0 0 1 0 0 0 07/24/2002 11:00:00 PM 1 98 22 0 0 0 0 0 0 0 0 0 07/25/2002 12:00:00 AM 0 42 6 0 0 0 0 0 0 0 0 0 07/25/2002 1:00:00 AM 0 17 3 0 0 0 0 0 1 0 0 0 07/25/2002 2:00:00 AM 0 26 3 0 1 0 0 0 0 0 0 0 07/25/2002 3:00:00 AM 0 34 7 0 0 1 0 0 1 0 0 0 07/25/2002 4:00:00 AM 0 67 13 1 1 0 0 0 2 0 0 0 07/25/2002 5:00:00 AM 0 149 39 2 6 0 0 0 3 0 0 0 07/25/2002 6:00:00 AM 0 227 50 5 11 2 0 2 2 0 1 0 0
12-APPENDIX B05-FOSBWOBE-4 4 10/1/2003
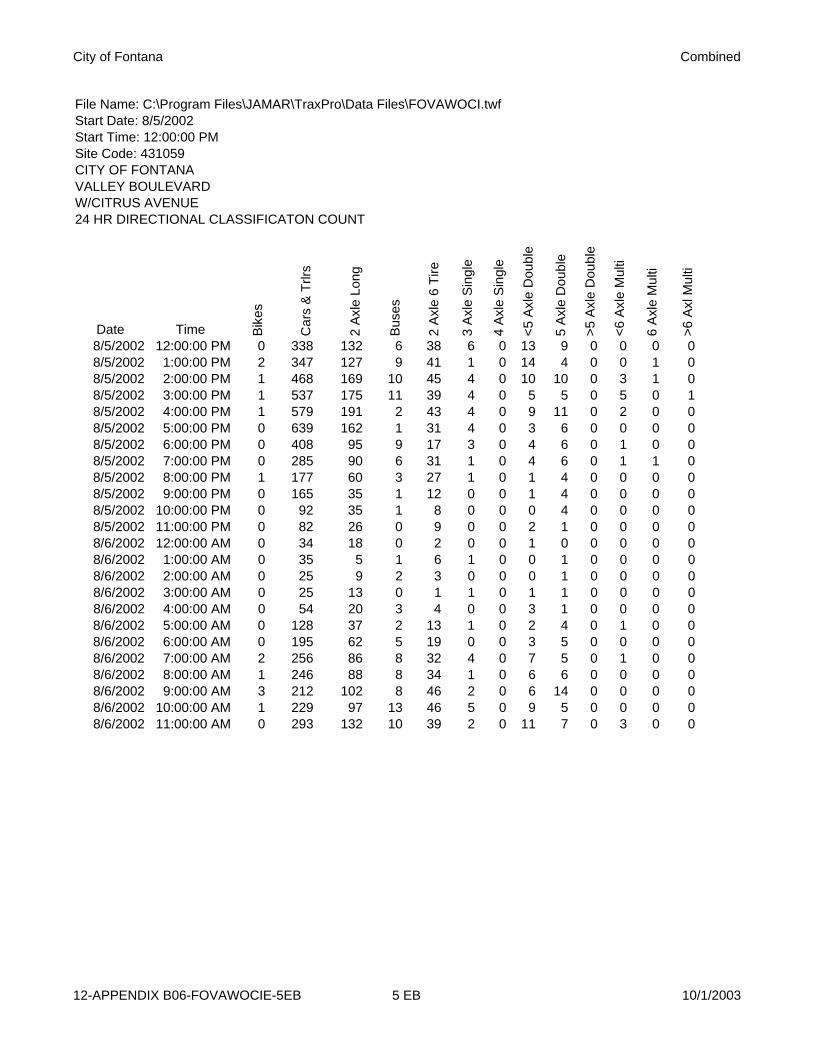
City of Fontana Combined
File Name: C:\Program Files\JAMAR\TraxPro\Data Files\FOVAWOCI.twfStart Date: 8/5/2002Start Time: 12:00:00 PMSite Code: 431059CITY OF FONTANAVALLEY BOULEVARDW/CITRUS AVENUE24 HR DIRECTIONAL CLASSIFICATON COUNT
Date Time Bike
s
Car
s &
Trlrs
2 Ax
le L
ong
Buse
s
2 Ax
le 6
Tire
3 Ax
le S
ingl
e
4 Ax
le S
ingl
e
<5 A
xle
Dou
ble
5 Ax
le D
oubl
e
>5 A
xle
Dou
ble
<6 A
xle
Mul
ti
6 Ax
le M
ulti
>6 A
xl M
ulti
8/5/2002 12:00:00 PM 0 338 132 6 38 6 0 13 9 0 0 0 08/5/2002 1:00:00 PM 2 347 127 9 41 1 0 14 4 0 0 1 08/5/2002 2:00:00 PM 1 468 169 10 45 4 0 10 10 0 3 1 08/5/2002 3:00:00 PM 1 537 175 11 39 4 0 5 5 0 5 0 18/5/2002 4:00:00 PM 1 579 191 2 43 4 0 9 11 0 2 0 08/5/2002 5:00:00 PM 0 639 162 1 31 4 0 3 6 0 0 0 08/5/2002 6:00:00 PM 0 408 95 9 17 3 0 4 6 0 1 0 08/5/2002 7:00:00 PM 0 285 90 6 31 1 0 4 6 0 1 1 08/5/2002 8:00:00 PM 1 177 60 3 27 1 0 1 4 0 0 0 08/5/2002 9:00:00 PM 0 165 35 1 12 0 0 1 4 0 0 0 08/5/2002 10:00:00 PM 0 92 35 1 8 0 0 0 4 0 0 0 08/5/2002 11:00:00 PM 0 82 26 0 9 0 0 2 1 0 0 0 08/6/2002 12:00:00 AM 0 34 18 0 2 0 0 1 0 0 0 0 08/6/2002 1:00:00 AM 0 35 5 1 6 1 0 0 1 0 0 0 08/6/2002 2:00:00 AM 0 25 9 2 3 0 0 0 1 0 0 0 08/6/2002 3:00:00 AM 0 25 13 0 1 1 0 1 1 0 0 0 08/6/2002 4:00:00 AM 0 54 20 3 4 0 0 3 1 0 0 0 08/6/2002 5:00:00 AM 0 128 37 2 13 1 0 2 4 0 1 0 08/6/2002 6:00:00 AM 0 195 62 5 19 0 0 3 5 0 0 0 08/6/2002 7:00:00 AM 2 256 86 8 32 4 0 7 5 0 1 0 08/6/2002 8:00:00 AM 1 246 88 8 34 1 0 6 6 0 0 0 08/6/2002 9:00:00 AM 3 212 102 8 46 2 0 6 14 0 0 0 08/6/2002 10:00:00 AM 1 229 97 13 46 5 0 9 5 0 0 0 08/6/2002 11:00:00 AM 0 293 132 10 39 2 0 11 7 0 3 0 0
12-APPENDIX B06-FOVAWOCIE-5EB 5 EB 10/1/2003

City of Fontana Combined
File Name: C:\Program Files\JAMAR\TraxPro\Data Files\FOVAWOCI.twfStart Date: 8/5/2002Start Time: 12:00:00 PMSite Code: 431059CITY OF FONTANAVALLEY BOULEVARDW/CITRUS AVENUE24 HR DIRECTIONAL CLASSIFICATON COUNT
Date Time Bike
s
Car
s &
Trlrs
2 Ax
le L
ong
Buse
s
2 Ax
le 6
Tire
3 Ax
le S
ingl
e
4 Ax
le S
ingl
e
<5 A
xle
Dou
ble
5 Ax
le D
oubl
e
>5 A
xle
Dou
ble
<6 A
xle
Mul
ti
6 Ax
le M
ulti
>6 A
xl M
ulti
8/5/2002 12:00:00 PM 0 421 126 8 37 7 0 11 10 1 1 0 08/5/2002 1:00:00 PM 0 400 102 7 18 5 0 7 23 1 1 0 08/5/2002 2:00:00 PM 0 407 107 6 32 7 0 4 21 1 1 0 08/5/2002 3:00:00 PM 1 443 96 6 27 7 0 6 16 0 0 0 08/5/2002 4:00:00 PM 2 421 95 3 17 6 0 2 11 0 0 0 18/5/2002 5:00:00 PM 2 417 83 4 16 1 0 1 10 1 0 0 18/5/2002 6:00:00 PM 0 370 61 1 13 2 0 0 6 0 0 1 08/5/2002 7:00:00 PM 2 322 53 2 7 2 0 1 9 0 0 0 08/5/2002 8:00:00 PM 1 308 51 1 2 2 0 0 5 0 1 0 08/5/2002 9:00:00 PM 0 234 48 2 9 0 0 0 8 0 0 0 08/5/2002 10:00:00 PM 0 140 26 2 3 0 0 0 5 0 0 0 08/5/2002 11:00:00 PM 0 88 11 0 3 0 0 1 1 0 0 0 08/6/2002 12:00:00 AM 0 52 5 0 2 0 0 0 4 0 1 0 08/6/2002 1:00:00 AM 1 43 7 0 0 1 0 0 1 0 0 0 08/6/2002 2:00:00 AM 0 32 7 0 2 0 0 0 2 0 0 0 08/6/2002 3:00:00 AM 0 34 4 0 4 0 0 0 2 0 0 0 08/6/2002 4:00:00 AM 0 100 28 0 3 0 0 0 2 0 0 0 08/6/2002 5:00:00 AM 4 250 35 1 7 1 0 3 6 0 1 1 08/6/2002 6:00:00 AM 3 303 85 4 17 5 0 0 8 0 0 1 08/6/2002 7:00:00 AM 3 372 77 1 13 1 0 1 8 0 0 0 08/6/2002 8:00:00 AM 1 275 63 9 31 4 0 3 12 1 1 0 08/6/2002 9:00:00 AM 1 282 91 6 32 5 0 5 12 0 0 0 08/6/2002 10:00:00 AM 1 281 94 7 39 3 0 4 18 1 0 0 08/6/2002 11:00:00 AM 2 351 92 8 42 7 0 5 15 0 0 0 0
12-APPENDIX B07-FOVAWOCIW-5WB 5 WB 10/1/2003

City of Fontana Combined
File Name: C:\Program Files\JAMAR\TraxPro\Data Files\FOETSOSL.TWFStart Date: 7/30/2002Start Time: 5:00:00 PMSite Code: 43106361CITY OF FONTANAETIWANDA AVENUESOUTH OF SLOVER AVENUE24 HR DIRECTIONAL CLASSIFICATION COUNT
Date Time Bike
s
Car
s &
Trlrs
2 Ax
le L
ong
Buse
s
2 Ax
le 6
Tire
3 Ax
le S
ingl
e
4 Ax
le S
ingl
e
<5 A
xle
Dou
ble
5 Ax
le D
oubl
e
>5 A
xle
Dou
ble
<6 A
xle
Mul
ti
6 Ax
le M
ulti
>6 A
xl M
ulti
7/30/2002 5:00:00 PM 9 484 79 4 26 13 0 19 60 1 4 0 27/30/2002 6:00:00 PM 6 284 67 4 11 15 0 10 54 1 4 1 27/30/2002 7:00:00 PM 5 304 49 1 7 11 0 11 39 2 3 0 17/30/2002 8:00:00 PM 3 258 32 2 2 11 0 4 33 3 2 1 17/30/2002 9:00:00 PM 4 233 27 2 4 6 0 5 49 0 1 0 07/30/2002 10:00:00 PM 1 225 23 0 1 6 0 1 39 2 1 1 07/30/2002 11:00:00 PM 2 131 18 0 3 8 0 3 36 0 3 0 07/31/2002 12:00:00 AM 2 89 9 1 2 6 0 1 31 0 9 0 17/31/2002 1:00:00 AM 2 82 12 0 0 5 0 0 25 1 2 0 07/31/2002 2:00:00 AM 1 95 10 0 7 6 0 1 23 0 3 0 17/31/2002 3:00:00 AM 0 166 25 0 3 10 0 9 31 0 3 1 07/31/2002 4:00:00 AM 2 390 58 0 5 11 0 14 30 0 2 1 27/31/2002 5:00:00 AM 5 747 110 2 20 9 0 19 45 5 10 1 07/31/2002 6:00:00 AM 4 588 115 6 7 12 0 17 52 2 8 2 27/31/2002 7:00:00 AM 4 515 119 9 13 16 0 25 68 5 10 3 17/31/2002 8:00:00 AM 0 330 83 9 31 12 0 23 83 4 9 0 17/31/2002 9:00:00 AM 0 295 69 8 30 9 0 14 100 1 9 1 17/31/2002 10:00:00 AM 1 267 94 7 45 12 0 22 77 2 4 3 17/31/2002 11:00:00 AM 2 284 92 12 29 27 0 16 82 2 8 2 27/31/2002 12:00:00 PM 1 336 89 6 34 29 0 16 95 2 4 1 17/31/2002 1:00:00 PM 0 451 122 15 33 28 0 21 81 1 5 1 17/31/2002 2:00:00 PM 3 593 103 12 34 26 0 24 87 1 7 1 27/31/2002 3:00:00 PM 1 484 111 3 36 21 0 15 70 0 3 0 07/31/2002 4:00:00 PM 0 446 81 5 27 14 0 17 56 4 0 1 0
12-APPENDIX B08-FOETSOSL-6 6 10/1/2003

City of Fontana Combined
File Name: C:\Program Files\JAMAR\TraxPro\Data Files\FOMUSOSLNC.twfStart Date: 7/30/2002Start Time: 4:00:00 PMSite Code: 431084CITY OF FONTANAMULBERRRY AVENUES/SLOVER AVENUE24 HR DIRECTIONAL CLASSIFICATION COUNT
Date Time Bike
s
Car
s &
Trlrs
2 Ax
le L
ong
Buse
s
2 Ax
le 6
Tire
3 Ax
le S
ingl
e
4 Ax
le S
ingl
e
<5 A
xle
Dou
ble
5 Ax
le D
oubl
e
>5 A
xle
Dou
ble
<6 A
xle
Mul
ti
6 Ax
le M
ulti
>6 A
xl M
ulti
7/30/2002 4:00:00 PM 1 141 33 4 11 8 1 7 22 0 3 0 07/30/2002 5:00:00 PM 0 120 26 3 6 3 0 7 21 0 3 0 27/30/2002 6:00:00 PM 0 93 23 3 4 1 0 5 8 0 4 0 07/30/2002 7:00:00 PM 1 74 13 1 3 4 0 3 7 0 1 0 07/30/2002 8:00:00 PM 0 41 9 0 2 1 0 2 8 0 1 0 07/30/2002 9:00:00 PM 0 44 6 0 1 1 0 1 4 0 3 0 07/30/2002 10:00:00 PM 0 22 6 0 0 1 0 0 6 0 8 0 07/30/2002 11:00:00 PM 1 38 4 0 0 0 0 0 6 0 9 0 07/31/2002 12:00:00 AM 0 31 8 0 0 1 0 0 6 0 11 0 07/31/2002 1:00:00 AM 0 14 3 0 1 3 0 0 0 0 3 0 07/31/2002 2:00:00 AM 0 18 3 0 1 4 0 0 2 0 3 0 07/31/2002 3:00:00 AM 1 41 8 0 0 3 0 2 2 0 6 0 07/31/2002 4:00:00 AM 0 59 10 0 2 2 0 0 1 0 6 0 07/31/2002 5:00:00 AM 1 99 22 1 5 3 0 4 4 0 3 0 07/31/2002 6:00:00 AM 1 154 40 0 9 8 0 3 6 1 15 1 27/31/2002 7:00:00 AM 2 232 55 3 16 3 0 6 9 0 6 0 37/31/2002 8:00:00 AM 1 82 33 2 11 7 0 2 18 0 2 0 17/31/2002 9:00:00 AM 0 77 21 3 9 8 0 8 17 0 7 0 27/31/2002 10:00:00 AM 0 86 30 3 11 2 1 6 26 0 2 0 07/31/2002 11:00:00 AM 1 99 45 2 15 5 0 8 16 0 4 0 27/31/2002 12:00:00 PM 0 118 54 3 17 2 0 5 18 0 2 1 07/31/2002 1:00:00 PM 1 112 34 1 10 7 0 5 29 1 3 1 07/31/2002 2:00:00 PM 2 111 31 9 10 6 0 12 20 0 5 2 27/31/2002 3:00:00 PM 1 136 48 7 12 3 0 8 16 2 1 1 2
12-APPENDIX B09-FOMUSOSLNC-7 7 10/1/2003

City of Fontana Combined
File Name: C:\Program Files\JAMAR\TraxPro\Data Files\FOMUSOSLSC.twfStart Date: 7/30/2002Start Time: 4:00:00 PMSite Code: 431055CITY OF FONTANAMULBERRY AVENUES/SLOVER AVENUE24 HR DIRECTIONAL CLASSIFICATION COUNT
Date Time Bike
s
Car
s &
Trlrs
2 Ax
le L
ong
Buse
s
2 Ax
le 6
Tire
3 Ax
le S
ingl
e
4 Ax
le S
ingl
e
<5 A
xle
Dou
ble
5 Ax
le D
oubl
e
>5 A
xle
Dou
ble
<6 A
xle
Mul
ti
6 Ax
le M
ulti
>6 A
xl M
ulti
7/30/2002 4:00:00 PM 1 137 41 4 24 3 0 6 10 0 0 1 07/30/2002 5:00:00 PM 1 119 61 0 20 4 0 2 8 0 4 0 07/30/2002 6:00:00 PM 1 92 27 0 10 1 0 10 6 0 3 0 07/30/2002 7:00:00 PM 1 61 17 2 9 1 0 7 4 0 3 0 07/30/2002 8:00:00 PM 0 52 11 0 1 3 0 1 2 0 1 0 07/30/2002 9:00:00 PM 0 33 15 0 2 1 0 1 2 0 2 0 07/30/2002 10:00:00 PM 0 33 17 0 4 0 0 0 3 0 2 0 07/30/2002 11:00:00 PM 0 31 9 0 1 1 0 0 5 0 3 0 07/31/2002 12:00:00 AM 0 23 8 0 3 2 0 2 2 0 1 0 07/31/2002 1:00:00 AM 0 12 0 0 1 0 0 1 2 0 2 0 07/31/2002 2:00:00 AM 0 14 2 0 2 0 0 0 3 0 2 0 07/31/2002 3:00:00 AM 0 31 12 0 4 1 0 0 4 0 3 0 07/31/2002 4:00:00 AM 1 52 14 0 4 3 0 1 4 0 2 0 07/31/2002 5:00:00 AM 2 129 35 2 5 3 0 4 6 0 3 0 07/31/2002 6:00:00 AM 0 102 41 6 12 1 0 8 13 0 4 0 07/31/2002 7:00:00 AM 2 126 38 3 14 1 0 12 12 0 2 0 07/31/2002 8:00:00 AM 1 89 27 2 21 2 0 10 15 0 0 0 07/31/2002 9:00:00 AM 1 94 34 7 16 6 0 9 15 0 1 0 07/31/2002 10:00:00 AM 0 66 26 3 17 3 0 9 14 1 4 0 07/31/2002 11:00:00 AM 0 81 26 3 22 5 0 8 9 0 0 0 07/31/2002 12:00:00 PM 0 84 35 2 25 5 0 14 17 0 0 0 07/31/2002 1:00:00 PM 0 96 31 3 15 7 0 4 18 0 4 1 07/31/2002 2:00:00 PM 1 82 44 3 24 4 0 4 9 0 6 0 07/31/2002 3:00:00 PM 0 131 48 3 24 4 0 7 9 1 5 0 0
12-APPENDIX B10-FOMUSOSLSC-7SB 7 SB 10/1/2003

City of Fontana WB curb + median
File Name: C:\Program Files\JAMAR\TraxPro\Data Files\FOVAWOCH.twfStart Date: 7/30/2002Start Time: 12:00:00 AMSite Code: 43106355CITY OF FONTANAVALLEY BOULEVARDWEST OF CHERRY AVENUE24 HR DIRECTIONAL CLASSIFICATION COUNT
Date Time Bike
s
Car
s &
Trlrs
2 Ax
le L
ong
Buse
s
2 Ax
le 6
Tire
3 Ax
le S
ingl
e
4 Ax
le S
ingl
e
<5 A
xle
Dou
ble
5 Ax
le D
oubl
e
>5 A
xle
Dou
ble
<6 A
xle
Mul
ti
6 Ax
le M
ulti
>6 A
xl M
ulti
7/30/2002 12:00:00 AM 0 60 17 1 3 3 0 4 11 1 0 0 17/30/2002 1:00:00 AM 0 32 9 0 1 3 0 3 15 0 2 0 07/30/2002 2:00:00 AM 0 25 6 4 1 5 0 1 18 0 1 0 07/30/2002 3:00:00 AM 2 31 7 0 4 6 1 0 18 0 0 0 17/30/2002 4:00:00 AM 0 53 19 4 3 9 0 1 14 0 1 1 07/30/2002 5:00:00 AM 2 152 55 3 6 16 0 1 12 0 1 1 07/30/2002 6:00:00 AM 2 352 107 7 28 27 0 4 23 0 4 0 07/30/2002 7:00:00 AM 4 363 120 10 31 21 0 5 24 0 3 0 07/30/2002 8:00:00 AM 4 391 112 15 51 11 0 5 32 0 3 1 07/30/2002 9:00:00 AM 0 209 80 14 26 5 0 4 31 0 0 0 07/30/2002 10:00:00 AM 2 193 86 18 42 6 0 7 31 0 0 2 17/30/2002 11:00:00 AM 3 213 100 18 24 10 0 5 41 0 3 0 07/30/2002 12:00:00 PM 1 239 93 16 36 10 1 4 45 0 1 0 17/30/2002 1:00:00 PM 2 248 110 17 26 11 0 10 30 0 0 1 27/30/2002 2:00:00 PM 4 300 116 19 32 7 0 8 51 2 0 0 07/30/2002 3:00:00 PM 4 329 103 18 42 9 0 8 52 0 0 2 17/30/2002 4:00:00 PM 2 295 109 13 35 10 1 1 34 0 0 2 07/30/2002 5:00:00 PM 4 246 93 12 31 7 0 3 37 1 0 1 07/30/2002 6:00:00 PM 19 222 81 8 25 6 1 7 36 0 0 0 07/30/2002 7:00:00 PM 11 131 50 12 7 2 0 4 25 0 2 0 17/30/2002 8:00:00 PM 7 116 34 4 12 2 0 2 24 0 0 0 07/30/2002 9:00:00 PM 6 129 49 4 6 3 1 3 16 0 0 0 07/30/2002 10:00:00 PM 4 84 26 2 3 7 0 3 14 0 0 0 07/30/2002 11:00:00 PM 8 56 25 1 4 4 0 3 16 0 2 0 0
12-APPENDIX B11-FOVAWOCHW-7WB 2 WB 10/1/2003

City of Fontana Combined
File Name: C:\Program Files\JAMAR\TraxPro\Data Files\FOCHSOSL.twfStart Date: 8/6/2002Start Time: 1:00:00 PMSite Code: 36099012CITY OF FONTANACHERRY AVENUES/SLOVER AVE24 HR DIRECTIONAL CLASSIFICATION COUNT
Date Time Bike
s
Car
s &
Trlrs
2 Ax
le L
ong
Buse
s
2 Ax
le 6
Tire
3 Ax
le S
ingl
e
4 Ax
le S
ingl
e
<5 A
xle
Dou
ble
5 Ax
le D
oubl
e
>5 A
xle
Dou
ble
<6 A
xle
Mul
ti
6 Ax
le M
ulti
>6 A
xl M
ulti
8/6/2002 1:00:00 PM 5 608 107 7 29 13 6 9 21 0 3 0 08/6/2002 2:00:00 PM 10 528 104 2 30 15 0 12 33 0 1 2 18/6/2002 3:00:00 PM 4 547 98 4 30 19 2 15 24 0 0 0 08/6/2002 4:00:00 PM 6 538 98 8 21 13 3 12 28 1 1 2 08/6/2002 5:00:00 PM 4 615 90 4 13 10 3 9 20 1 1 3 18/6/2002 6:00:00 PM 6 656 89 4 10 5 0 13 21 0 3 0 08/6/2002 7:00:00 PM 9 629 84 4 12 10 0 9 9 0 0 0 08/6/2002 8:00:00 PM 0 646 72 2 7 8 1 2 10 0 0 0 08/6/2002 9:00:00 PM 3 497 54 2 12 4 2 8 10 1 5 1 28/6/2002 10:00:00 PM 4 396 45 3 2 5 0 5 10 1 6 1 08/6/2002 11:00:00 PM 2 273 29 0 2 4 0 5 10 0 4 2 18/7/2002 12:00:00 AM 1 175 20 0 2 3 0 0 10 0 7 3 78/7/2002 1:00:00 AM 2 118 13 0 1 5 0 2 8 0 3 0 28/7/2002 2:00:00 AM 1 73 7 0 2 9 0 0 4 0 2 1 08/7/2002 3:00:00 AM 2 98 18 1 4 3 0 4 6 0 0 0 18/7/2002 4:00:00 AM 1 229 43 0 6 3 0 2 14 0 5 0 08/7/2002 5:00:00 AM 1 391 74 1 14 8 0 6 18 1 4 0 08/7/2002 6:00:00 AM 3 472 106 5 33 17 1 5 8 0 6 1 08/7/2002 7:00:00 AM 4 585 108 8 34 13 2 6 15 1 3 2 08/7/2002 8:00:00 AM 5 466 99 4 36 16 1 8 26 1 2 0 28/7/2002 9:00:00 AM 7 462 98 7 40 16 2 7 23 1 3 0 48/7/2002 10:00:00 AM 7 438 102 5 31 16 0 12 23 2 1 0 48/7/2002 11:00:00 AM 6 465 116 7 27 18 2 22 30 1 1 2 08/7/2002 12:00:00 PM 3 539 116 2 36 4 1 10 38 2 0 0 1
12-APPENDIX B12-FOCHSOSL-8 8 10/1/2003

City of Fontana Combined
File Name: C:\Program Files\JAMAR\TraxPro\Data Files\FOSLWOCI.TWFStart Date: 7/24/2002Start Time: 7:00:00 AMSite Code: 43108079CITY OF FONTANASLOVER AVENUEWEST OF CITRUS AVENUE24 HR DIRECTIONAL CLASSIFICATION COUNT
Date Time Bike
s
Car
s &
Trlrs
2 Ax
le L
ong
Buse
s
2 Ax
le 6
Tire
3 Ax
le S
ingl
e
4 Ax
le S
ingl
e
<5 A
xle
Dou
ble
5 Ax
le D
oubl
e
>5 A
xle
Dou
ble
<6 A
xle
Mul
ti
6 Ax
le M
ulti
>6 A
xl M
ulti
7/24/2002 7:00:00 AM 3 481 88 6 25 3 0 10 42 1 7 0 17/24/2002 8:00:00 AM 2 412 104 10 26 10 0 11 43 2 4 2 27/24/2002 9:00:00 AM 1 356 109 1 24 6 0 14 42 1 6 1 27/24/2002 10:00:00 AM 0 390 102 6 30 16 0 15 46 3 9 0 17/24/2002 11:00:00 AM 1 544 154 5 30 17 0 12 49 1 6 1 17/24/2002 12:00:00 PM 2 525 129 9 35 12 0 16 47 4 6 2 137/24/2002 1:00:00 PM 2 526 130 7 16 15 0 17 48 2 8 2 97/24/2002 2:00:00 PM 3 640 123 7 19 11 0 14 20 4 4 0 57/24/2002 3:00:00 PM 2 637 114 13 25 9 0 21 30 5 1 1 57/24/2002 4:00:00 PM 2 564 98 10 17 10 0 11 25 5 3 3 157/24/2002 5:00:00 PM 1 601 94 4 14 10 0 11 24 2 3 0 07/24/2002 6:00:00 PM 1 353 44 2 8 5 0 9 21 0 3 0 07/24/2002 7:00:00 PM 3 284 57 2 6 8 0 9 18 0 2 0 07/24/2002 8:00:00 PM 1 230 38 3 9 6 0 9 9 0 0 0 17/24/2002 9:00:00 PM 2 185 26 1 8 4 0 8 6 1 2 0 27/24/2002 10:00:00 PM 1 147 28 0 3 1 0 6 2 0 1 0 07/24/2002 11:00:00 PM 1 93 11 0 2 0 0 2 5 0 2 0 07/25/2002 12:00:00 AM 1 53 6 1 0 3 0 6 7 0 7 0 07/25/2002 1:00:00 AM 0 31 7 1 0 2 0 6 2 0 9 0 07/25/2002 2:00:00 AM 0 32 8 0 0 2 0 2 5 0 4 0 07/25/2002 3:00:00 AM 1 87 17 2 1 1 0 4 4 0 3 0 07/25/2002 4:00:00 AM 3 173 37 2 2 4 0 6 6 0 7 1 07/25/2002 5:00:00 AM 3 394 71 3 8 6 0 5 20 1 8 1 17/25/2002 6:00:00 AM 3 451 71 8 22 5 0 14 22 3 8 1 0
12-APPENDIX B13-FOSLWOCI-9 9 10/1/2003

City of Fontana Combined
File Name: C:\Program Files\JAMAR\TraxPro\Data Files\FOJUWOMU.TWFStart Date: 7/24/2002Start Time: 12:00:00 AMSite Code: 43103235CITY OF FONTANAJURUPA AVENUEWEST OF MULBERRY AVENUE24 HR DIRECTIONAL CLASSIFICATION COUNT
Date Time Bike
s
Car
s &
Trlrs
2 Ax
le L
ong
Buse
s
2 Ax
le 6
Tire
3 Ax
le S
ingl
e
4 Ax
le S
ingl
e
<5 A
xle
Dou
ble
5 Ax
le D
oubl
e
>5 A
xle
Dou
ble
<6 A
xle
Mul
ti
6 Ax
le M
ulti
>6 A
xl M
ulti
7/24/2002 12:00:00 AM 0 117 32 1 3 2 0 1 8 0 4 0 07/24/2002 1:00:00 AM 2 86 19 1 8 1 0 3 2 0 2 0 07/24/2002 2:00:00 AM 0 62 13 2 4 1 0 0 4 0 1 0 07/24/2002 3:00:00 AM 2 83 30 2 5 2 0 3 7 0 4 0 07/24/2002 4:00:00 AM 1 183 57 4 11 6 0 3 14 0 4 0 07/24/2002 5:00:00 AM 2 435 89 7 19 9 0 6 19 0 6 1 07/24/2002 6:00:00 AM 5 575 139 5 38 6 0 16 15 0 16 0 07/24/2002 7:00:00 AM 4 603 176 10 45 7 0 18 18 1 4 0 07/24/2002 8:00:00 AM 5 462 122 11 39 4 0 25 37 0 5 1 07/24/2002 9:00:00 AM 5 386 102 16 48 11 0 22 28 0 1 1 07/24/2002 10:00:00 AM 2 359 116 11 70 11 0 31 34 0 2 1 17/24/2002 11:00:00 AM 1 429 111 19 67 10 0 22 31 0 3 0 07/24/2002 12:00:00 PM 7 508 154 21 52 7 0 28 33 0 1 0 07/24/2002 1:00:00 PM 1 498 148 17 54 7 0 29 35 0 3 0 07/24/2002 2:00:00 PM 4 649 192 19 65 7 0 36 34 0 7 0 27/24/2002 3:00:00 PM 8 829 205 30 82 3 0 38 40 0 15 0 07/24/2002 4:00:00 PM 5 863 224 18 56 10 0 42 21 1 6 0 07/24/2002 5:00:00 PM 8 921 215 5 58 5 0 47 20 0 8 1 07/24/2002 6:00:00 PM 2 639 178 7 49 4 0 42 17 0 7 0 07/24/2002 7:00:00 PM 0 470 109 2 24 5 0 31 12 0 11 0 17/24/2002 8:00:00 PM 2 372 72 2 21 2 0 19 3 0 4 0 07/24/2002 9:00:00 PM 1 337 81 4 11 6 1 6 4 0 5 0 07/24/2002 10:00:00 PM 0 260 63 4 11 4 0 9 6 0 0 0 07/24/2002 11:00:00 PM 0 160 35 2 5 5 0 7 4 0 6 0 0
12-APPENDIX B14-FOJUWOMU-10 10 10/1/2003

Truck Trip Generation Study
APPENDIX C – Peak Arterial Locations
1. Foothill Blvd. between Citrus and Cherry. 2. Valley Blvd. West of Cherry. 3. Cherry Ave North of Valley Blvd. 4. San Bernardino Ave. West of Beech Ave. 5. Valley Blvd. West of Citrus. 6. Etiwanda Ave. South of Slover. 7. Mulberry Avenue South of Slover Avenue. 8. Cherry Ave. South of Slover. 9. Slover Ave. West of Citrus and 10. Jurupa Avenue West of Mulberry Avenue.


