Prepared by Kenth Lumsden Professor Department of Logistics and Transportation, Chalmers University of Technology 8 8 TH ACEA SAG Workshop | Discussion Paper TRUCK MASSES AND DIMENSIONS Impact on Transport Efficiency
Transcript
Prepared by Kenth Lumsden
Professor Department of Logistics and Transportation,
Chalmers University of Technology
8
8 T H ACEA SAG Workshop | D i scuss i on Pape r
TRUCK MASSESAND DIMENSIONS
Impact on Transport Efficiency
3 | Con ten t
CONTENT
Foreword 4
Preface 5
Summary 6
1 INTRODUCTION 7
2 DEVELOPMENT IN SOCIETY,
DEMOGRAPHY AND TRANSPORT
1 SOCIETY, DEMOGRAPHY AND CITY DEVELOPMENT 8
2 TRANSPORT DEVELOPMENT 9
3 FUTURE TRANSPORT NEEDS 16
3 TRUCK MASSES AND DIMENSIONS
1 INCREASING SIZE 18
2 PRESENT MASS AND DIMENSIONS 19
3 EFFICIENCY AND ENVIRONMENT 21
4 SAFETY 22
4 CONCLUSIONS 23
Truck Masses and D imens ions – Impac t on t r anspo r t e f f i c i ency | 4
FOREWORD The participants in the workshop included the following:
Professor Kenth Lumsden| Chalmers University, Gothenburg, RapporteurMarco Monticelli| Iveco, ChairmanMassimo Fumarola| IvecoAnders Lundström| ScaniaUlf Ehrning| VolvoLiesbeth Geysels| IRULaurent Selles| European Commission, DG EnterpriseWilly Maes| European Commission, DG TRENJohn Berry| European Commission, DG TRENGiuliano Lamoni| CEMATHuub van Berlo| DAFReinhard Ball| DaimlerChryslerStefan Klatt| MANDolf Lamerigts| ACEAMichael Hollingsworth| ACEA
Special thanks must be given to:
Ulf Ehrning | Volvo 3P for his invaluable help in the compilation of this report
This report does not necessarily reflect the views of ACEAor the other participants, but is intended to provide acontribution to the discussion on the topics concerned.
The ACEA Scientific Advisory Group
To overcome the shortfall of scientific understanding offreight-related transport policy issues, the commercialvehicle manufacturer members of ACEA established aScientific Advisory Group (SAG) in 1998, to examineimportant issues relating to freight transport andcommercial vehicles.
The ACEA SAG has reported on transport infrastructure,freight transport policies and freight distribution of thefuture. Other reports have looked at e-commerce,intermodal transport and marginal social cost pricing intransport policy.
This report is the result of the eighth meeting of the SAG, on“Truck Mass and Dimensions – Impact on TransportEfficiency.”
5 | P re f ace
PREFACE
There are a number of different ways to change the massand dimensions of a truck and the combination of trailersand other equipment. This document is not intended topinpoint one particular solution, but rather, to show theimportance of the subject and, hopefully, lead to moreefficient truck use.
One essential way to increase productivity is to use longerand heavier trucks than those generally allowed within theEuropean Union (EU) today, thereby creating more space tobe commercially used without more trucks entering theroad system. This report will review the effects of suchincreased productivity and show that the issue of truckmass and dimensions is important and must be focusedupon more intensively by the logistics business and EUregulators.
The objectives of the meeting were:
| To evaluate what, from a practical standpoint, can be changed in truck weights and dimensions over the next ten years, given the trends in European goods transportation
| To establish a methodology to assess the benefits that might arise from any changes in, for example, the vehicle fleet, CO2 emissions, etc.
| To assess the potential for public acceptability of such changes
Most scenarios for the future of road transport foreseesignificant growth coupled with challenges, not the least ofwhich being the limits of road network capacity. Thischallenge has to be solved within the existing logisticsmeans due to a number of societal constraints. Thus, a waymust be found to augment the level of transport withoutincreasing the level of traffic. This will require optimisingevery aspect of increased productivity, including cost,congestion, environment, sustainability, the road networkand so on.
Within the scope of this study, there are several differentaspects to the mass and dimensions of trucks that must beevaluated, such as economy, logistics, traffic safety,environment, etc. This report will mainly focus on thelogistic effects.
Truck Masses and D imens ions – Impac t on t r anspo r t e f f i c i ency | 6
1 SUMMARY
Mass and dimensions of trucks in European internationalroad transport are regulated by Directive 96/53/EC.Discussions have started regarding the possibilities ofopening up this directive for changes, but, for the timebeing, there are no plans for that. However, sooner or laterthe time will come when this has to be done and, therefore,it is important that we are prepared for a seriousdiscussion.
Increasing the size of trucks will have an impact on severalissues, all which have to be analysed thoroughly:
| Truck efficiency, due to fewer trucks needed for a givenamount of goods, and not least since most long distancetransport is volume sensitive.
| Road utilisation, since fewer trucks will be needed for a given amount of goods.
| Environment, since fuel consumption per tonnekm will be reduced.
| Safety, both active and passive, where further analysesare needed for the impact on, eg, driving stability,overtaking, braking, swept path, collision risk and driver education.
All of these together have technical as well as politicalaspects and all have to be thoroughly investigated beforethere can be a common view on the technical solutions forthe future.
Road transport is developing fast due to developments insociety and logistics. Goods volumes are increasing, as aretransport distances. Road transport will continue to be thedominant mode in the future. The problem of congestion,thus, must be tackled and road transport efficiency must beincreased further.
There are several solutions, which should be adopted incombination:
| More efficient logistics| More efficient transport modes,
longer and heavier trucks, etc| Better infrastructure| More intelligent trucks| More combined transport
One essential issue is how to increase the load capacity oftrucks. Today, this is to a very large extent connected to themass and dimensions, which are strictly regulated. Thereis an ongoing debate on this issue, with demands fromseveral stakeholders to allow longer and heavier trucksthan permitted today.
7 | I n t r oduc t i on
1INTRODUCTION
Transport is a prerequisite for economic growth in society.Historically, there has been a correlation betweentransport growth and GDP growth. Although our politicianstry to “decouple” this correlation, there are no signs of thisbecoming reality, even if the correlation factor may changeslightly.
Over the last decades, transport growth in Europe has beenclearly focused on road transport and short sea shipping.Road transport is responsible for around 44% of Europeantransport. The EU White Paper on Transport Policy releasedin 2001 predicts a further 38% increase in road transport inthe period 1998–2010. Other prognoses from the EUCommission claim that, within the enlarged EU, roadtransport will more or less double during the period2005–2030.This increase in road transport will clearlyaggravate already existing problems of congestion incertain parts of Europe.
Logistics developments and the need for efficient logisticsolutions mean that transport modes and trucks must beoptimised for their tasks. From an “economy of scale” pointof view, trucks should be as large as possible, but there arealso a number of other factors that have a strong influenceon truck size.
An effective solution must be based on an analysis ofsupply and demand. When it comes to truck load capacity,the importance is either dimension, counted in loading arealength or volume, or load weight.
Strategy
SupplyDemand
Modules
Vehicles
Loading lenghtVolume Weight
FIG. 1 Approach for dimensioning of trucks
Truck Masses and D imens ions – Impac t on t r anspo r t e f f i c i ency | 8
2 DEVELOPMENT IN SOCIETY,DEMOGRAPHYAND TRANSPORT
The United Nations has predicted strong growth ofmegacities. Although most of the largest ones will be foundin Asia and South America, Europe will also see growingcities. According to the UN, in year 2015, 20% of the worldpopulation will live in 225 megacities, each with more than2 million inhabitants. Some 85% of the world’s populationwill live in cities with more than 50,000 inhabitants.
In Europe, due to a rather low population growth, cities arenot expected to grow too much. Nevertheless, Europe willbe even more urbanised and city structures will change tosome extent - a development that has already started.
A large city can be seen as consisting of a number ofconcentric circles surrounding the city centre:
City centres are attractive areas, often populated by smallfamilies or 1-2 person households with rather highpurchasing power. Restaurants, cafés, theatres and otherforms of entertainment are found more and more in citycentres, as are offices in less cost-sensitive businesses.Shops are often smaller, “the little shop around the corner”,7-11, etc. Shops for more expensive durables, such asclothing, jewellery, as well as “show-rooms” for largercapital goods (cars, white goods, etc) can also be foundthere. Centrally located department stores often developinto shopping malls consisting of many smaller shops. Inthese areas, consumption is less cost sensitive.
Deliveries to city centres are smaller and, thus, so are thedistribution trucks used (not only due to delivery quantitiesbut also due to the city structure with narrow streets, etc).
Outside the main city centre, there are “former centrallylocated suburbs” with lower cost profiles, populated bypeople with moderate purchasing power. This part of a cityalso holds industries, offices and shops that are morecost/price sensitive and more sensitive to distributioncosts, but still need a rather central location.
Old, large manufacturing industry is rather difficult torelocate and these kinds of companies were historicallylocated to suburbs, but not too far away from living areas,making it possible for the personnel to live within areasonable distance from their jobs.
1
SOCIETY, DEMOGRAPHY AND CITY DEVELOPMENT
Logistics and transport development, as well as transportdemands, are affected by changes in society and consumerbehaviour. Some important demographic trends in Europe,creating more transport demand and new transportpatterns, include:
| An aging population creates the need for more serviceand related transport
| Immigration and people moving for political oremployment reasons
| Increased focus on the Information Societyand Quality of Life
| Households with one or two persons are on the relative increase
| Development of cities with increasing numbers of largesupermarkets and peripheral shopping areas
| Environmental concerns| Consumer buying behaviour: growing demand for
products produced farther away, eg, Italian Parma hamis increasingly popular in northern Europe
In Europe, urbanisation is ongoing, but in a stage oftenreferred to as “desurbanisation”. Cities are growing, butthe pattern of growth is changing.
FIG. 2 Logistics Complexity – System Changeability, Implementation time differs for different kinds of changesSOURCE: LUMSDEN, 2001
Mag
nitud
e of c
hang
e (1D)
Implementation time
Ideological (Political network concepts)
Information (Abstract network components)
Mobile resources (Physical network components)
Infrastructure (Physical network)
9 | Deve lopmen t i n soc i e t y, demog raphy and t r anspo r t
2
combined with manufacturing of key components andkeeping up the contact network with their customers.Simpler forms of manufacturing, assembling, etc, havebeen outsourced to partners and sub suppliers.Manufacturing is centralised and concentrated in fewerlocations. All this has created new transport patterns andincreased transport demands.
| Increased product and goods value| Shorter commercial cycle time| Smaller shipments| Continuous goods flows| Higher frequencies| Tighter time frames| Increasing total volumes| Increasing transport distances| More international transport| Transport is carried out by
professional transport companies| Transparency in cost and environment
Transport network – definitions
A number of parameters are necessary in order to describeand calculate transport solutions and their utilisation.Traditionally, tonnekm has been the most widely usedparameter. This is sufficient for describing the physicalmaterials flow and the utilisation of a truck. In principle, theparameter tonne can be substituted or recalculated intovolume or load area length, to get “m3km” or “mkm”.
Further out, attractive areas for shopping can be found.Supermarkets, hypermarkets, larger shopping malls, etc,are located in areas outside city centres, with goodinfrastructure, high accessibility and good parkingpossibilities, since hopping often requires the use of cars.Distribution consists of larger volumes and largedistribution trucks can be used.
Suburbs are often residential areas with private houses,populated with families with normal to high purchasingpower. These areas have high accessibility and goodinfrastructure. Consumers living here use their car forshopping and often practice some kind of “weeklyshopping”, meaning that shopping volumes are rather big.These areas also attract offices and smaller industries,which are rather low cost sensitive.
City planners try to locate new industries in specificindustry areas close to extended parts of the infrastructurenetwork. This is especially valid for transport-intenseindustries.
All of these developments have a high impact on goodsdistribution.
2
TRANSPORT DEVELOPMENT
Logistics and Transport Development
The implementation time of changes in society andtransport is, in some cases, very long, such as for buildingnew infrastructure. It may take 10-15 years to decide andbuild a new motorway. Other changes may give immediateeffects, such as political decisions. Remember how quicklythe Berlin Wall came down.
Changes in logistics have had a very important impact ontransport needs. The traditional supply chain inmanufacturing industries has developed into networks. Keywords have been Outsourcing, Supply Chain Management,Vendor Managed Inventory, Third Party and Fourth PartyLogistics, etc. Manufacturing industries have concentratedtheir core business on innovation and design of products,
Truck Masses and D imens ions – Impac t on t r anspo r t e f f i c i ency | 10
2
Manufacturing systems have focused on the demand forlean production and made to order. The prerequisites forthis type of behaviour are short lead times through all kindsof production systems.
At the same time, because consumers are demandingindividualised items or articles made to order, there is aconcomitant need to identify these individual items. Thisrequirement arises very early in the supply chain for someproducts. When the customer order point is moved upstream,it becomes ever more critical. Moreover, research has shownthat the benefits of identification turn out to be morefinancially favourable the closer the freight comes to thepoint of destination, or even better, the point of consumption.
Moreover, there has been a clear tendency in thedevelopment of e-business towards inter-companybusiness - B2B. While the growth in this segment has beenhigh, the coming challenge is within the distribution to theend customer or consumer - B2C. This development willmean heavy demand on the trucks used in distribution.Trucks and loading units must be designed to be used fordifferent transport requirements, like long haul and shorthaul, and in combination.
In almost every industrial segment today there is atendency towards centralisation of the physical flow. Thischange results in two different developments. First of all,the centralisation of stocks to decrease the capital tied upin any distribution chain and to improve the level of service.Secondly, is the centralisation of distribution, in the form ofHub-and-Spoke systems, for instance. Such systems willincrease the level of service given by logistics suppliers.
Normally, a number of different actors are needed to buildup a supply chain of any kind, which requires significantinternal resources on the part of the shipper. This is why anincreasing number of companies prefer to rely on oneexternal actor: this is known as Third Party Logistics.
A disadvantage of these parameters is that they do not takethe value into account. Today, when capital tie-up is ofmuch more importance, there is a need for a parameter for“transported capital value and distance - €km”. However,even this is not enough, since capital tie-up is not related tothe transport distance, but only to transport time. Aparameter taking care of that would be “transported capitalvalue and time - €h”. But this can easily be regarded asartificial and is difficult to calculate.
Therefore, there is a need for further development of aneasy-to-use parameter to complement tonnekm as thebasic parameter for transport analysis.
Logistic Trends
There are a number of trends within transport and logistics,with new ones continuously developing. While anexhaustive list of these trends is beyond the scope of thispaper, we would like to pinpoint some particularly relevantto international transport:
| Evolution of logistics | Customer| Product| Flow| Logistic company and | Shipper
The evolution of logisticsThere has been a lot of discussion about the influence of ITsolutions on logistic performance. It was thought early onthat the introduction of IT would lead to a decentralisationof most operations in the supply chain. What we haveencountered is rather the contrary: most operations, suchas manufacturing and stock keeping, have been centralisingdue to phenomena like economies of scale. This has beensupported by the real time information created by a numberof IT systems.
11 | Deve lopmen t i n soc i e t y, demog raphy and t r anspo r t
2
This does not mean that there has to be a very rapid flow,but rather a continuous flow of resources. The flow itselfmust also stand up to the increasing obligation of securityfor freight and humans in the transport chain.
The time freight spends in any transport or supply chain isnot only moving time, but also non-moving time. Thisinactive time is, in most cases, spent in some kind ofterminal and is time that should be minimised. Today, thereis more focus on the interaction between the differentactors in moving items and terminals, such as in the conceptof Merge-in-Transit. Here the different consignments will beput together in a continuous flow through the terminal. Thisrequires modular system solutions to be effective.
Environmental impacts on individuals and society will, infuture, play an even more important role in the logisticssector as well. The solutions to these requirements willalso be perceived as interesting business opportunities.
The distribution networkTraditionally, networks for distribution of goods have, to alarge extent, been built up by direct transport between theproducer and the consumer. This kind of distribution
Also, because a supply chain consists of many actors, thefreight often has to be moved from one mode of transport toanother mode – known as intermodality. This transfercreates problems, such as increased handling costs anddelays. It is an appropriate political approach to supportintermodality to reduce the heavy load on the roads. Theoutcome of this is that the use of modular units that can bemoved between modes will increase in importance.
The customerWith the increasing trend towards focus on the customer,the demand structure will be the base of all distributionstructures and requirements. The time to the customer fromorder being placed - fulfilment time - is of utmostimportance, as it is directly connected to time to cash.
In the future, demand will increasingly be identified earlierand will be for ever more customised products andindividualised items. A method used more and more toaccomplish this is postponement, which means that youwill customize a bulk product in the supply chain just beforeit goes to the customer. The outcome is, however, that thetrucks will handle a bulk flow most of, but not the entire,journey to the customer.
The productA product is not just a piece of material; it is something thatcreates value for the consumer or the buyer – and the valueof products is increasing. Moreover, most industrializedproducts are subcomponents of larger or more complexarticles. These subcomponents may perform a specificfunction, such as a power line (car engine with components),for a higher value finished component (car). Such aproduct will, in many cases, require a unit load to fulfil theidentified demand.
The flowTo fulfil the requirements of the customer, supplier andsociety as a whole, the flow of resources must be assured.
FIG. 3 Conventional terminal structure in comparison with Hub system
Conventional
Hub system
Truck Masses and D imens ions – Impac t on t r anspo r t e f f i c i ency | 12
2
For this kind of network it is especially beneficial to use aslarge trucks as possible between the central terminals inthe net. The demands on planning are higher, but withmodern logistics management systems, this is possiblewithout loss of flexibility.
The logistics companyMost logistics companies have small profit margins. As aresult, they must try to reduce their assets. The mosteffective way to do this is to have standardised resourceslike trucks, trailers or modules of load units.
The tendency towards unit standardisation also has itsorigin in the globalisation of the logistics market.International trade requires the use of standardised units,although this makes it more difficult to develop localsolutions.
The shipperThe overall tendency for the shipper is an increasedfocused on:
| Improvement of transparency for cost and environment| Reducing costs and capital| Improving time and service performance
network often results in a large number of transportrelations, which, in turn, mean that the transport units havea rather low utilisation and result in low frequencies,especially when volumes are small. This also means that alarge number of transporting units are needed and muchtime has to be spent on transport planning activities.
The need for fast and frequent distribution from amanufacturer to a number of different customers indifferent locations is the background to all distributionsystems. These systems are developing from generallydirect transport with quick but low-frequency distributiontowards hub systems, with frequent but rigid relations.
A hub system basically does not distinguish betweenproducers and consumers, but treats all equally. It alsomeans a substantial reduction in the number of relationsbetween customers and an increase in truck load factorsand utilisation.
One-terminal networks use a single hub and several localterminals. They are suitable when there is a limited amountof goods and the area to cover is large.
Multi-terminal networks are based on several terminals onthe same terminal level. To minimise complications, thebasic idea is to avoid transport between all terminals andinstead send goods between those connected to desiredterminals.
Hierarchical multi-terminal networks are based on anumber of centrally located terminals and a number of sub-terminals. This hierarchical network creates possibilitiesfor concentrated flows in local areas with high capacityutilisation, combined with short distances to customersthrough the local terminals and short distances.
FIG. 4 Hierarchical multi-terminal network
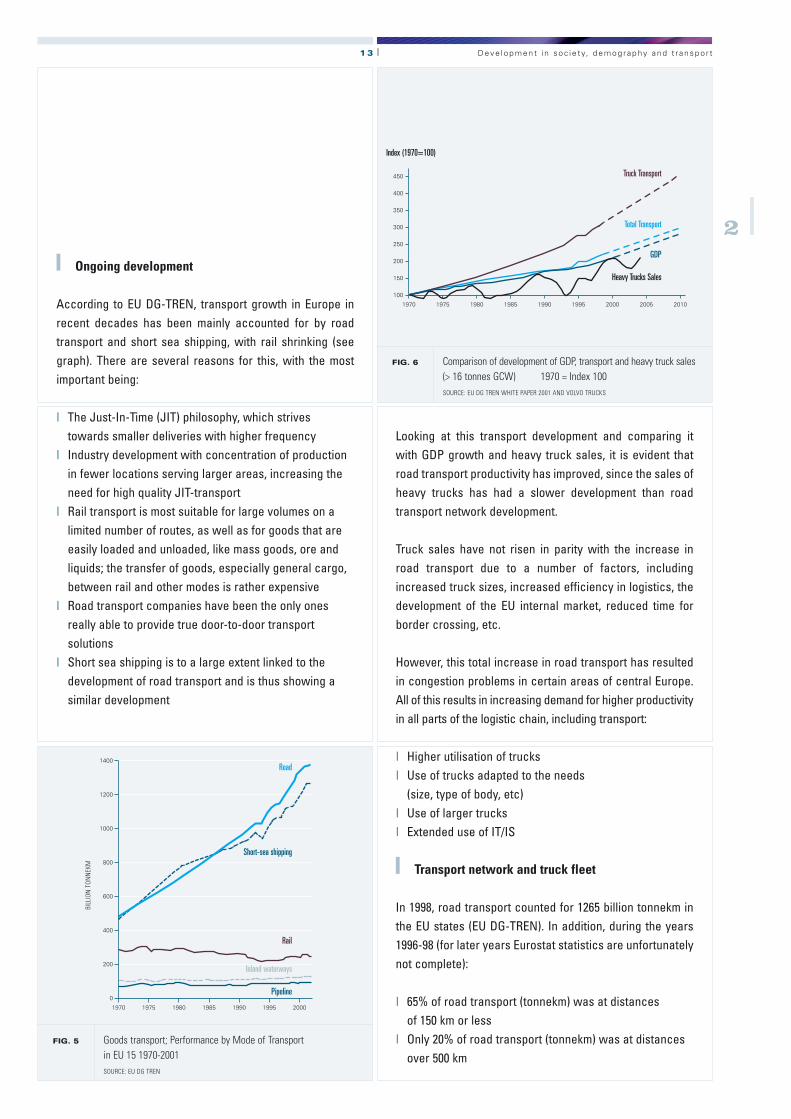
FIG. 6 Comparison of development of GDP, transport and heavy truck sales(> 16 tonnes GCW) 1970 = Index 100SOURCE: EU DG TREN WHITE PAPER 2001 AND VOLVO TRUCKS
13 | Deve lopmen t i n soc i e t y, demog raphy and t r anspo r t
2
Looking at this transport development and comparing itwith GDP growth and heavy truck sales, it is evident thatroad transport productivity has improved, since the sales ofheavy trucks has had a slower development than roadtransport network development.
Truck sales have not risen in parity with the increase inroad transport due to a number of factors, includingincreased truck sizes, increased efficiency in logistics, thedevelopment of the EU internal market, reduced time forborder crossing, etc.
However, this total increase in road transport has resultedin congestion problems in certain areas of central Europe.All of this results in increasing demand for higher productivityin all parts of the logistic chain, including transport:
| Higher utilisation of trucks| Use of trucks adapted to the needs
(size, type of body, etc)| Use of larger trucks| Extended use of IT/IS
Transport network and truck fleet
In 1998, road transport counted for 1265 billion tonnekm inthe EU states (EU DG-TREN). In addition, during the years1996-98 (for later years Eurostat statistics are unfortunatelynot complete):
| 65% of road transport (tonnekm) was at distancesof 150 km or less
| Only 20% of road transport (tonnekm) was at distancesover 500 km
Ongoing development
According to EU DG-TREN, transport growth in Europe inrecent decades has been mainly accounted for by roadtransport and short sea shipping, with rail shrinking (seegraph). There are several reasons for this, with the mostimportant being:
| The Just-In-Time (JIT) philosophy, which strivestowards smaller deliveries with higher frequency
| Industry development with concentration of productionin fewer locations serving larger areas, increasing theneed for high quality JIT-transport
| Rail transport is most suitable for large volumes on alimited number of routes, as well as for goods that areeasily loaded and unloaded, like mass goods, ore andliquids; the transfer of goods, especially general cargo,between rail and other modes is rather expensive
| Road transport companies have been the only onesreally able to provide true door-to-door transportsolutions
| Short sea shipping is to a large extent linked to thedevelopment of road transport and is thus showing asimilar development
250
200
150
19751970 1980 1985 1990 1995 2000 2005 2010
100
300
350
400
450 Truck Transport
Index (1970=100)
Total Transport
GDP
Heavy Trucks Sales
FIG. 5 Goods transport; Performance by Mode of Transport in EU 15 1970-2001SOURCE: EU DG TREN
BILL
ION
TON
NEK
M
600
400
200
0
800
1000
1200
1400
198019751970 1985 1990 1995 2000
Road
Short-sea shipping
Rail
Inland waterways
Pipeline
Truck Masses and D imens ions – Impac t on t r anspo r t e f f i c i ency | 14
2
The lower down on the list of goods above, the higher thedegree of long distance transport required.
The number of heavy trucks >16 tonnes GVW on EU roadsis around 1.8-2 million. Taking 42-45% of those would meanthat 700,000–900,000 trucks on European roads are used forlonger transport distances.
Looking at sales of new trucks, yearly volumes in Europe oftrucks used in combinations with Gross Combination Weight(GCW) > 16 tonnes is around or just above 200,000 trucks.
Out of these, roughly 130,000-140,000 trucks can beexpected to be equipped with bodies for transport ofpalletised goods of different kinds.
These two ways of calculating indicate that, out of Europe’sexisting fleet of heavy trucks, roughly 700,000–900,000trucks are used in situations where there is, from alogistics point of view, a possibility to use heavier andlonger trucks than allowed today.
Load size
Load capacity for trucks can be calculated in threedifferent ways, depending on the kind of goods and industrysegment:
| Load capacity measured by volume| Load capacity measured by load area length| Load capacity measured by weight
Moreover, goods transport can be segmented in severaldifferent ways. One way is to look at the type andcharacteristics of goods, the type of truck body needed forthe goods and the industry branch the goods belong to. Theuse of trucks regarding both type of goods and transportdistances has been studied by Volvo Trucks in differentsurveys. According to one of such survey covering fiveEuropean countries (BEL, FRA, GBR, NLD, SWE), the use oftrucks > 10 tonnes Gross Vehicle Weight (GVW) can besummarised as below (based on the industry segments forwhich new truck sales are intended):
Of these transport segments, long distance transport withinsegments 1-5 (in yellow) and partly within segments 6 and 7(in blue), consists of the type of goods and transportcharacteristics for which the use of longer and heaviertrucks than those allowed today would be best suited. Thismeans roughly 42-45% of European heavy trucks.
Another way to look at this is volume per type of goods.Eurostat statistics for EU15 present the following figures for1994-1996 (data for later years are not available):
Group of goods % of total transport (tonnekm)
Cement & building materials 21%Ore and waste of ore & steel 1%Coal & other solid mineral fuels 1%Petroleum & petroleum products 5%Chemicals, fertilizers 8%Agricultural products 31%Machinery & manufactured articles 27%Metal products 6%
T Y P E O F I N D U S T R Y T R A N S P O R T D I S T A N C E
6 Agricultural products & material 7,1% 3,4% 1,0% 11,5%
7 Building & Construction 6,4% 7,6% 5,5% 19,5%
8 Forest, Paper & Cork industry 6,4% 3,7% 1,3% 11,4%
9 Petroleum, Chemicals
10 Ore, coal, mining
11 Service transport 1,3% 2,4% 2,6% 6,3%
12 Waste & recycling
Sum 63,8% 24,2% 12,0% 100%
FIG. 7 Truck use in different industry segmentsSOURCE: VOLVO TRUCKS
* Where the content is unknown or of no interest
15 | Deve lopmen t i n soc i e t y, demog raphy and t r anspo r t
2
Adapting trucks to their use
Truck use should be adapted to the real transport needs,especially when it comes to size. For example, supply ofgoods to cities by truck can be divided into three maincategories:
| Direct transport to inner city locations| Mixed cargo transport to inner city locations| Mainly direct transport to larger suburban centres
From a distribution point of view, this means that a largepart of goods volumes serving a city goes to hypermarkets,etc, in areas outside city centres, where there are goodinfrastructure connections.
As a result, large trucks can be used even in somedistribution to urban areas and are therefore not solelyintended for long distance transport.
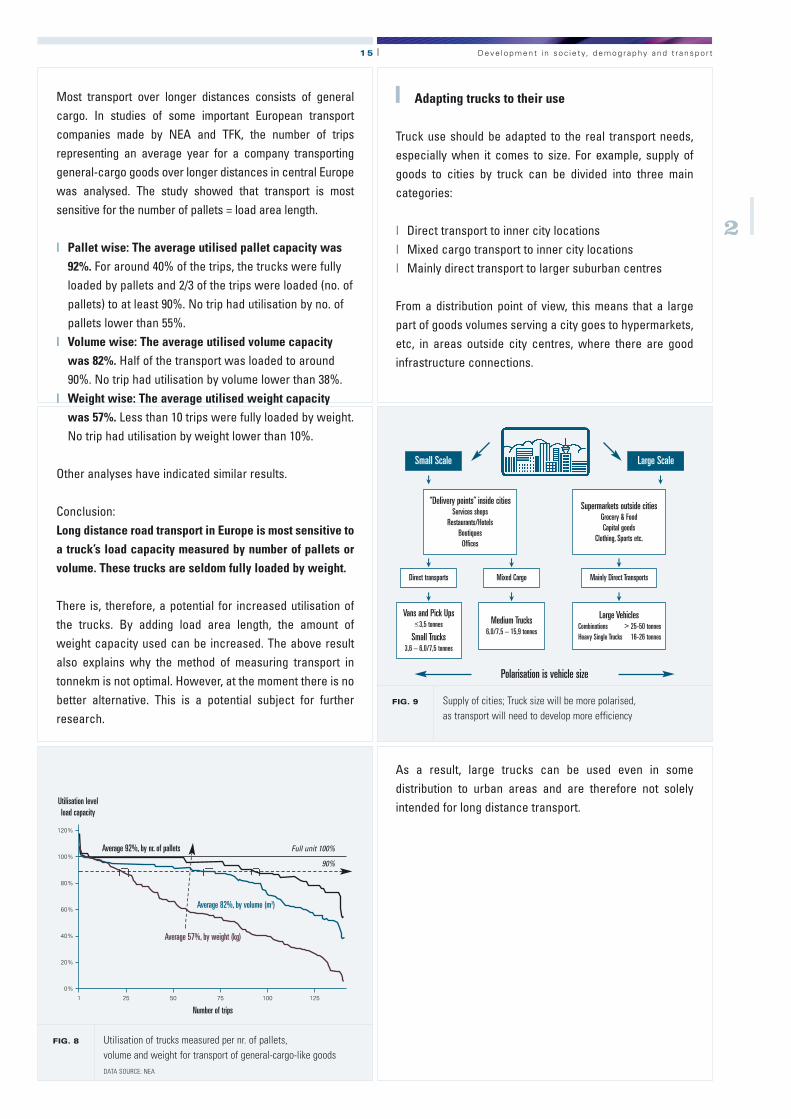
Most transport over longer distances consists of generalcargo. In studies of some important European transportcompanies made by NEA and TFK, the number of tripsrepresenting an average year for a company transportinggeneral-cargo goods over longer distances in central Europewas analysed. The study showed that transport is mostsensitive for the number of pallets = load area length.
| Pallet wise: The average utilised pallet capacity was92%. For around 40% of the trips, the trucks were fullyloaded by pallets and 2/3 of the trips were loaded (no. ofpallets) to at least 90%. No trip had utilisation by no. ofpallets lower than 55%.
| Volume wise: The average utilised volume capacitywas 82%. Half of the transport was loaded to around90%. No trip had utilisation by volume lower than 38%.
| Weight wise: The average utilised weight capacitywas 57%. Less than 10 trips were fully loaded by weight.No trip had utilisation by weight lower than 10%.
Other analyses have indicated similar results.
Conclusion:Long distance road transport in Europe is most sensitive toa truck’s load capacity measured by number of pallets orvolume. These trucks are seldom fully loaded by weight.
There is, therefore, a potential for increased utilisation ofthe trucks. By adding load area length, the amount ofweight capacity used can be increased. The above resultalso explains why the method of measuring transport intonnekm is not optimal. However, at the moment there is nobetter alternative. This is a potential subject for furtherresearch.
20%
0%
40%
60%
80%
100%
120%
FIG. 8 Utilisation of trucks measured per nr. of pallets, volume and weight for transport of general-cargo-like goods DATA SOURCE: NEA
FIG. 9 Supply of cities; Truck size will be more polarised, as transport will need to develop more efficiency
251 50 75 100 125
Average 57%, by weight (kg)
Average 82%, by volume (m3)
Average 92%, by nr. of pallets
90%
Full unit 100%
Number of trips
Utilisation levelload capacity
Small Scale
Direct transports
Vans and Pick Ups<3,5 tonnes
Small Trucks3,6 – 6,0/7,5 tonnes
Medium Trucks6,0/7,5 – 15,9 tonnes
Large VehiclesCombinations > 25-50 tonnesHeavy Single Trucks 16-26 tonnes
Truck Masses and D imens ions – Impac t on t r anspo r t e f f i c i ency | 16
2 One possible way to decrease these effects is wider use oftrucks with higher load capacity than utilised today. For agiven transport need (measured per tonnekm), increasedload capacity means:
| Increased productivity per truck| Fewer trucks per transported goods quantity| Less utilised space on road per transported goods
quantity| Lower fuel consumption per transported goods quantity| Lower emissions per transported goods quantity
Increased transport needs and impact on the number of trucks
As shown earlier, long distance road transport is normallyvolume sensitive. This might be one reason why statisticsshow a rather low utilisation of trucks, since that is countedin tonnekm.
Taking the example of the period 1998 – 2010 (EU WhitePaper) for an analysis produces the following result, basedon Eurostat figures:
| In 1998, total road transport was around 1220 billion tonnekm
| Counting 60-65% as long distance means around 770 billion tonnekm
| A long distance truck makes around 100,000 tonnekm per year
| In 2010, total road transport is estimated to be 1650 billion tonnekm (+38%), of which 750 billion tonnekm is long distance.
The following calculation shows that, to meet the extendedgoods volume requirements, some 250,000–300,000 morelong distance trucks will be required on European roads inthe period studied, if nothing is done with regard toproductivity per truck. However, if the productivity per truckis increased, for example by using longer and heaviertrucks, the need for additional trucks will be lower.
3
FUTURE TRANSPORT NEEDS
EU white paper prediction on transport development
In 2001, the EU Commission released its White Paper onTransport Policy, predicting 38% transport growth between1998 and 2010, if all measures presented by the WhitePaper are taken.
FIG. 10 Predicted goods transport development for EU-151998 - 2010DATA SOURCE: EU WHITE PAPER ON TRANSPORT POLICY
All other modes
Rail
Road
+ 38%
+ 50%
+ 50%
If measures are takentotal goods transport will be 3900 bn tonne-km instead of 4240 bn tonne-km
With measures taken,road transport will stillincrease with 38%,to 1700 bn tonne-km
Expected result on roadtransport of all EUWhite Paper measures
I
I
}
At the same time, it says that road transport may notnecessarily increase its market share during the sameperiod.
Effects of predicted transport increase and possible actions
With this 38% increase by the year 2010, road transportwould reach 1746 billion tonnekm. In addition to the goodsvolumes, this will also impact:
| The number of trucks on roads| Transport costs| Environment| Road safety
100 125
20%
0%
40%
60%
80%
100%
120%
251 50 75 100 125
Average 57%, by weight (kg)
Average 82%, by volume (m3)
Average 92%, by nr. of pallets
90%
Full unit 100%
Number of trips
Utilisation levelload capacity
17 | Deve lopmen t i n soc i e t y, demog raphy and t r anspo r t
2
An increase in truck length, or primarily load area length,even within today’s limits for GCW, will result in trucksgetting closer to the full utilisation of allowed weight, andincreased productivity. The basic idea behind thisargument is that trucks with very low loading factor byweight could be eliminated by redirecting their freight toother trucks. These other trucks can use their extra freeweight (below nominal GCW) to accommodate the freightfrom the low utilised trucks (see illustration below). This isin line with the development of hub-and-spoke systems.
The exact potential and outcome need further analysis.
Year Increased Total transport Of which long Transport work Nr. of trucks Increase inproductivity bn tonne-km distance, bn per truck, needed nr. of trucksper truck, % per year tonnekm per year tonne-km per year
Potential to reduce truck numbers within the weight limits
As shown earlier, to increase truck productivity byincreasing the length of the trucks does not automaticallymean that truck GCW must increase. The idea behindincreasing truck length is to increase the utilisation leveland thus reduce the number of truck km driven for aparticular transport run. This is the main goal sincereduced number of truck km driven reduces the risks ofcongestion. It is about moving the focus from weight toresources.
Weight => Volume => Resources
FIG. 11 The more vehicles with higher load capacity than allowed today, the fewer additional “trucks” will be demanded
FIG. 12 Truck utilisation could increase by using trucks with higher load capacity thus reducing the number of trips needed (compare fig. 8)
700 000
600 000
800 000
900 000
1 000 000
1 100 00
25 13 25 38 50 63 75 88 100
+38%new trucks
Future need of trucks, larger trucks
Future need of trucks, today’s size
+ Modularisationlarger trucks
Nr.o
f truc
ks ne
eded
Share of larger trucks
For different levels of improved productivity, this results in:
Truck Masses and D imens ions – Impac t on t r anspo r t e f f i c i ency | 18
3 TRUCK MASSES AND DIMENSIONS
Both of these solutions require changes in the present EUdirectives. There are also some technical problems tosolve, for example, steerable axles. Also, most Europeanroads do not allow higher axle loads due to road wear.
The question, then, is how large a unit can be, keeping inmind security, safety, economic, environmental andtechnical aspects.
The load unitThe focus must also include the possible expansion of theloading unit. The increasing value of articles and productstransported means that an increasing proportion will beloaded into container units, for reasons of security andsafety (Lumsden, 2004). As a consequence, there will be adecreasing density of the freight moved and an increasingneed for volume capacity of the loading units. To meet theserequirements, the physical dimensions of the containersmust be increased up to technical and societal limits.
The width of the container (8´= 2,42 m) is not adapted tosmaller modules like pallets. This results in a poor fillingrate. At the same time, there is scope to widen thecontainer up to the maximal width of the road (8_´ or
There are two main types of Regulations regarding truckmass and dimensions:| General regulations for international transport within
the EU, as presented in the Directive 96/53/EC| National and local regulations, varying by
country and area
1
INCREASING SIZE
The truckOne way to improve productivity of trucks over longdistance transport is to increase truck size for increasedload capacity.
There are several ways to increase truck size and loadcapacity:
| For volume sensitive transport, add new dimensions tothe present units such as longer semitrailers, longerswapbodies, etc– Lower the platform of the “Kingpin”– Lower the floor of the trailer– Decrease the distance between the loading units using
short couplings– Increase the width of the truck– Increase the allowed height of the truck– Increase the length of the truck
| For weight sensitive transport, add more axles and/orincrease allowed axle loads
FIG. 13 Maximum possible size of loading units, scenario(Lumsden, 2004)
19 | Truck Masses and D imens ions
3
In this discussion, the proposed new European containerdimension must be emphasised. The European Union has,of course, identified the need for an enlarged container,especially regarding the width. As a result, a new, largercontainer has been decided although not yet implemented.The “European Intermodal Load Unit” (EILU) is wider andhigher. The final dimensions are, however, not yet decidedbut lengths coordinated with Directive 96/53/EC areproposed.
2
PRESENT MASS AND DIMENSIONS
LengthWhen discussing truck size, it is sufficient to addresslength, since width and height regulations apply to alltrucks.
National regulations vary by country. General regulationsfor international transport within EU are presented in theDirective 96/53/EC. This directive gives the followingmaximum truck lengths for European internationaltransport:
| 12 m motor vehicle| 12 m trailer| 16,5 m articulated vehicle (semitrailer combination)| 18,75 m road train (rigid truck with trailer) combined
with a regulated max total load area length of 15.65 m (or 2 x 7.82 m).
Countries may, on national level and for national transport,decide on other limits.
As a result of the directive, there are two “standard units”,a short unit of max 7.82 m long (half of the 15.65 m) - and along unit of ~13.6 m (semitrailer length)1.
2,60 m). This will allow EUR-pallets to be loaded two by twoin a container. The problems with this are more related tocontainer ships.
The length of a container (40´= 12,1 m) can, for all transportmodes, be increased with rather small modifications, whilecreating an expanded volume capacity. The limitation toincreasing the length of the containers is more or lessrelated to infrastructure requirements. In some big cities(eg, New York) there are limits to the length (53´ = 16 m) toavoid traffic congestion. Today, the commercial trend is touse containers with a length of 45´ (13,72 m), 48´ (14,63 m) or49´ (14,94 m).
The height of a container is limited by tunnels and differentstructures within the infrastructure of road and rail. Roadrestrictions are the result of the connections with the railinfrastructure. The restrictions of rail are related to twophenomena: the electrification of the European railroadsand the double-stacking of containers on North Americanrailroads. In Europe, almost all the rail infrastructure iselectrified, limiting the height of the container. As long ascontainers in Europe cannot be double stacked, therestrictions created by the European railroad have noimpact. The North American double stacking of containershowever creates an important final limitation to containerheights. The American railroad infrastructure has a tunnelprofile dimension of 19´. With a double stacking, this meansa maximum container height of 9´6” (2,87 m).
Even if new containers can be enlarged in the way outlinedhere, to be wider, longer and higher, these units must behandled by unitised equipment, such as trucks, forklifts andcranes. This means that design elements like corner boxesmust keep their positions and internal distances (40´and 8´).There are two possible solutions: either to have a longintroduction time, which is linked to the investment cycle ofthe containers, or to introduce adaptable handlingequipment, like intelligent cranes that can handle allpossible dimensions.
1 Semitrailer length is defined as 12,0 m length from kingpin to the back plus 2,04 m radius from kingpin and forward, resulting in a length ~13,6 m
Truck Masses and D imens ions – Impac t on t r anspo r t e f f i c i ency | 20
3
WidthThe EU directive limits the width to 2.55 m and 2.60 m forrefrigerated trucks. There are a few national exemptionsfrom this.
HeightThe EU directive limits the height to 4.0 m. A few countries,like France, Norway, Sweden and the UK, do not regulatethe height. The 4.0 m limit sometimes creates problemssince many transport buyers require a loading area innerheight of 3 m, to be able to stack 3 pallets, and thus thesetrucks are too high.
MassesTrucks could be divided into several groups, depending onGross Vehicle Weight and Gross Combination Weight. Themost important groups are:
| > 3,5 tonnes general definition “heavy vehicle”| 7.5 tonnes limit for some driver’s licence| 12 tonnes limit for Eurovignette
and upcoming German road fees, etc| 16 tonnes limit for heavy trucks
in some official statistics| 18/19 tonnes limit for single two-axle trucks
(depending on national regulations)| 26 tonnes limit for single three-axle trucks| 40 tonnes limit for trucks generally in Europe| 44 tonnes limit for vehicles carrying
a 40 ft ISO container as a combined transport operation
In addition, there are several national limits, for instance: 44 tonnes in Belgium, Great Britain and Italy, 48 tonnes inDenmark, 50 tonnes in Norway and the Netherlands,60 tonnes in Sweden and Finland, etc.
Over time, GCW has continuously increased in Europeancountries:
Besides these, the Directive 96/53/EC also allows trucks ina “modular concept” based on use of one “short” module(max 7.82m) and one long module (13.6m). Theimplementation of the Modular Concept depends onindividual countries accepting it. So far Sweden andFinland have fully accepted the Modular Concept, while theNetherlands permits a limited number of trucks (300) forongoing tests. Discussions are underway in some othercountries as well, for example Norway and Denmark.
The Modular Concept trucks are built up by simplyrearranging present European vehicle “components” -trucks, semitrailers and trailers. Consequently, modulartrucks can simply be recoupled back to combinations ofnormal European length.
The Modular Concept trucks can be illustrated as follows:
FIG. 14 Trucks for the Modular Concept (EU Directive 96/53/EC)
7.82 m 13,6 m
13,6 m 7,82 m
Note: This part must be a semitrailer with a dolly
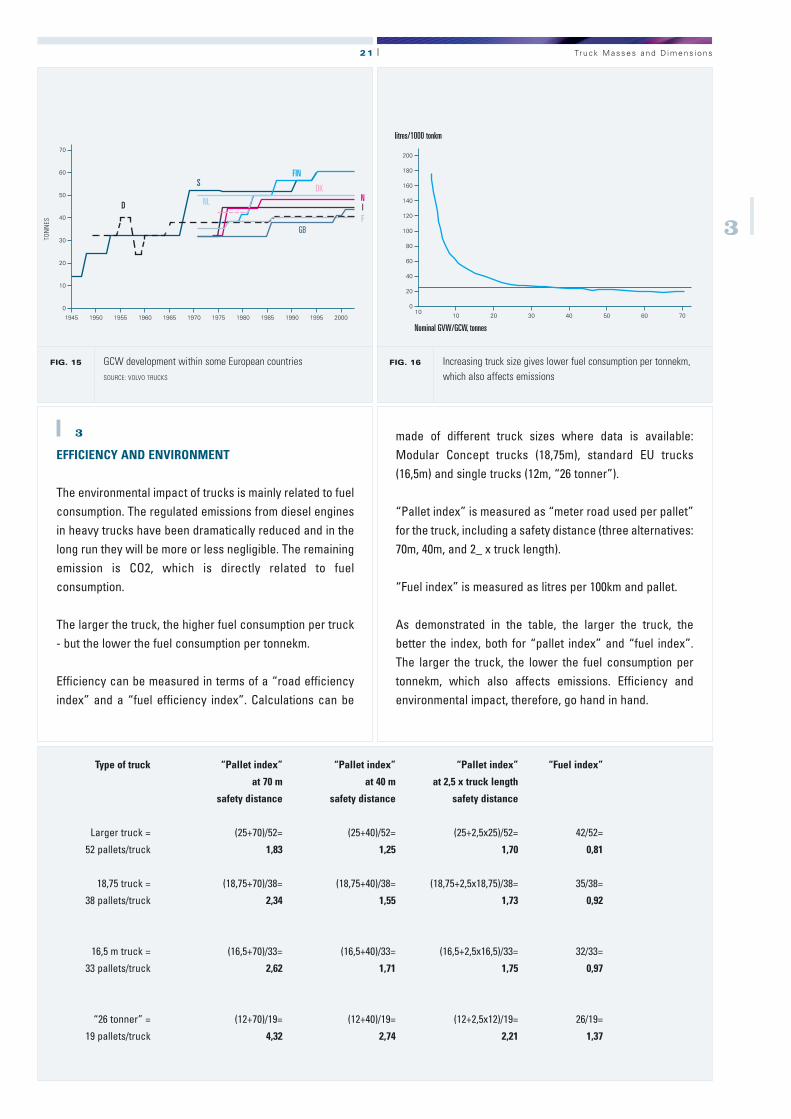
FIG. 15 GCW development within some European countries SOURCE: VOLVO TRUCKS
10
0
20
30
40
50
60
70
200019951990198519801975197019651960195519501945
S
D
GBFI
NL
FIN
NDK
21 | Truck Masses and D imens ions
3
made of different truck sizes where data is available:Modular Concept trucks (18,75m), standard EU trucks(16,5m) and single trucks (12m, “26 tonner”).
“Pallet index” is measured as “meter road used per pallet”for the truck, including a safety distance (three alternatives:70m, 40m, and 2_ x truck length).
“Fuel index” is measured as litres per 100km and pallet.
As demonstrated in the table, the larger the truck, thebetter the index, both for “pallet index” and “fuel index”.The larger the truck, the lower the fuel consumption pertonnekm, which also affects emissions. Efficiency andenvironmental impact, therefore, go hand in hand.
Type of truck “Pallet index” “Pallet index” “Pallet index” “Fuel index”
The environmental impact of trucks is mainly related to fuelconsumption. The regulated emissions from diesel enginesin heavy trucks have been dramatically reduced and in thelong run they will be more or less negligible. The remainingemission is CO2, which is directly related to fuelconsumption.
The larger the truck, the higher fuel consumption per truck- but the lower the fuel consumption per tonnekm.
Efficiency can be measured in terms of a “road efficiencyindex” and a “fuel efficiency index”. Calculations can be
FIG. 16 Increasing truck size gives lower fuel consumption per tonnekm, which also affects emissions
1010
20 30 40 50 60 70
20
0
40
60
80
100
120
140
160
180
200
Nominal GVW/GCW, tonnes
litres/1000 tonkm
TON
NES
Truck Masses and D imens ions – Impac t on t r anspo r t e f f i c i ency | 22
3
No significant differences were found between 18 m and24 m trucks. This is also affected by the fact that, today avery large portion of long distance road transport is doneon multi-lane motorways, where overtaking distance is ofless importance.
BrakingA truck combination brakes on all axles and each axlebrakes its own load. This means that trucks have the samebraking capacity per load irrespective of how the differentmodules are combined.
Swept pathIt is obvious that a longer truck combination will have alarger swept path than a shorter combination. However, theintended use of longer trucks than allowed today would beon an adapted road network only. These longer truckcombinations are not intended to be used in city centres orother high-density areas.
Collision riskThe risk of collision is difficult to quantify. Experience,however, shows that the risk is much more closelycorrelated to the number of trucks on the road than to thesize of the trucks. This means that the number of “truckfronts” exposed to other traffic is a critical factor. A goodway to reduce risks for collision is to keep the number oftrucks down.
Driver educationDriving heavy and long trucks demands a high degreedriver responsibility and skill. The need for extended drivereducation for larger trucks must be further investigated.
4
SAFETY
Although the purpose of this report is not to deal withsafety, some basic aspects of that issue should beaddressed. The use of longer combinations is one way toincrease truck productivity. In order to get a view of safetyaspects related to truck size, experience can be drawnupon from countries where longer and heavier trucks thanthose allowed in the EU, are permitted.
Truck driving stabilityThe larger the truck, the more it tends to be used on largerhighways for long distance transport. This means that themost important areas from a driving point of view aredriving stability (rollover stability and dynamic lateralstability), overtaking and swept path.
Rollover stability depends on the height of the centre ofgravity, width of track and flexibility.
Dynamic stability, measured as rearward amplification, isdependent on the design of the truck, the number andposition of articulating points, the distance betweenarticulating points, length of units, wheelbase, tyres,overhang, load distribution, etc.
Tests of dynamic stability according to ISO 14791,measured as rearward amplification at a path-followinglane change, show that among the most common Europeanvehicle combinations, a standard 16,5 m tractor-semitrailercombination has the highest stability while a standard18,75 m road train, truck and full trailer combination has byfar the lowest stability.
Driving stability in terms of rollover stability is also affectedby the height of the truck. Not least the use of doubleloading decks can heighten the centre of gravity.
OvertakingThe Swedish National Road and Transport ResearchInstitute has studied overtaking of longer combinations.The meeting margin in seconds was used as a measure.
23 | Conc lus i ons
4
Road transport is expected to increase rapidly over thecoming years. Not least, EU enlargement will have a bigimpact. This will put high demands on efficient transportand logistics solutions.
To achieve optimal efficiency, the following factors mustbe emphasised:
| Vehicle size must be adapted to local needs and circumstances.
| Flexible combinations based on modularity make iteasier to use trucks in different traffic environments. It should be possible to rearrange longer trucks into shorter units for local adaptation when shorter units are required.
| Transport must be integrated with production in widerlogistics chains; load units should be able to be used all the way into production activities.
| For a vast majority of long distance transport,dimensions are more important than weight. General cargo is normally volume-sensitive.
| Environmental impact of road transport is highly relatedto fuel consumption and land usage. However, roadefficiency and fuel efficiency go hand-in-hand. The larger the truck, the more efficient use of resources.
| Intermodality must be facilitated and standardiseddimensions of units is a prerequisite. Chosendimensions must be stable over time and it is essentialto take into account the needs of road transport, the mode by which most freight is transported.
| Safety is highly related to the number of trucks on the roads. The use of longer and heavier trucks than allowed today would mean fewer trucks for a givenamount of freight. Safety is also related to drivingstability and there is no evidence of longer trucks beingless stable than shorter ones. To the contrary, longer units even increase stability.