32
True North: Basing brand strategy on market data Paige Booth and Christie Campbell St. Edward’s University | Austin, TX
| Date post: | 06-Aug-2015 |
| Category: |
Marketing |
| Upload: | paige-booth |
| View: | 78 times |
| Download: | 2 times |
True North: Basing brand strategy on market data"Paige Booth and Christie Campbell!St. Edward’s University | Austin, TX!!
Introduction"• Our backgrounds!• St. Edward’s University Marketing and
Enrollment organization!• Finding “True North” !• Sharing experiences to start dialog!• Measurement gaps exist !!

How Is Success Measured?"Outcome Measure
Awareness Market Research Engagement Ac2vity Conversion
Por9olio Relevance Enrollment Growth Financial Health Net Tui2on Revenue
Customer Experience Reten2on
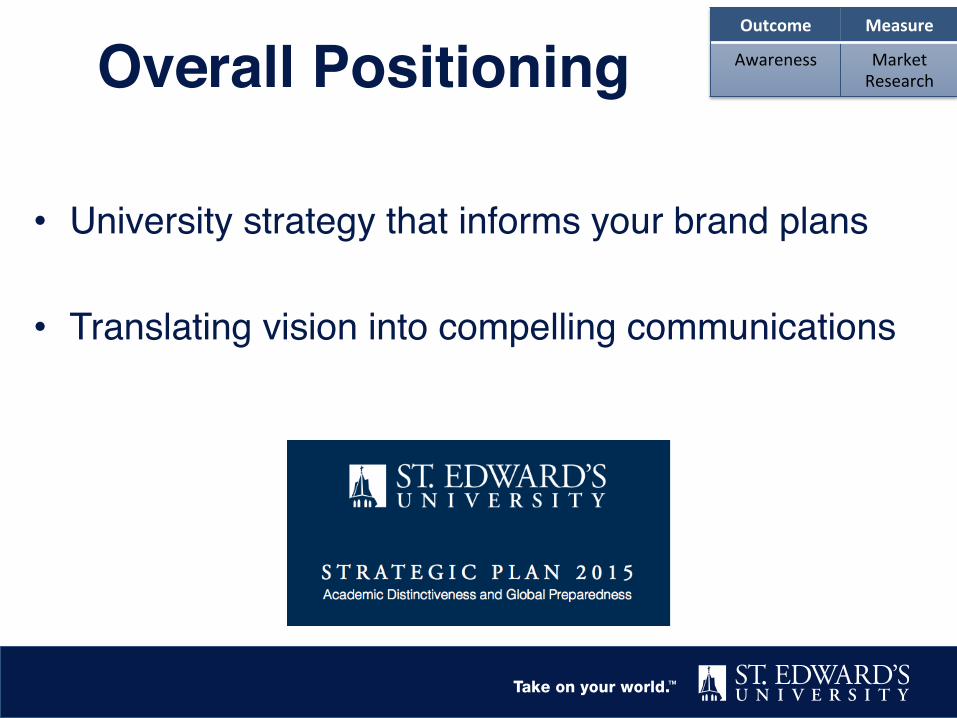
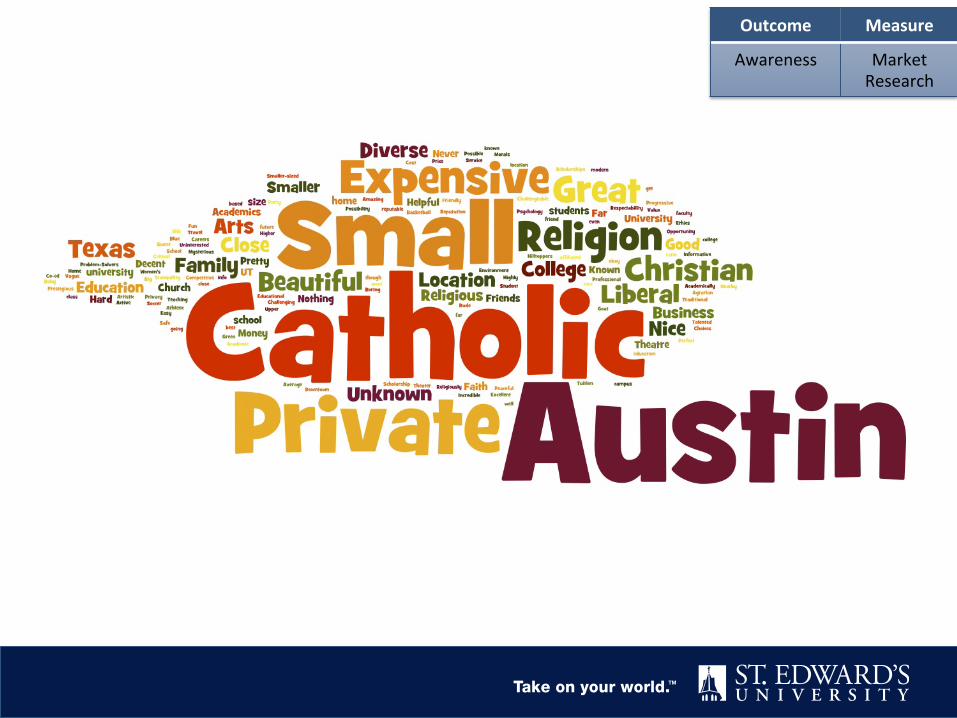
Overall Positioning"
• University strategy that informs your brand plans!!• Translating vision into compelling communications!
Outcome Measure
Awareness Market Research
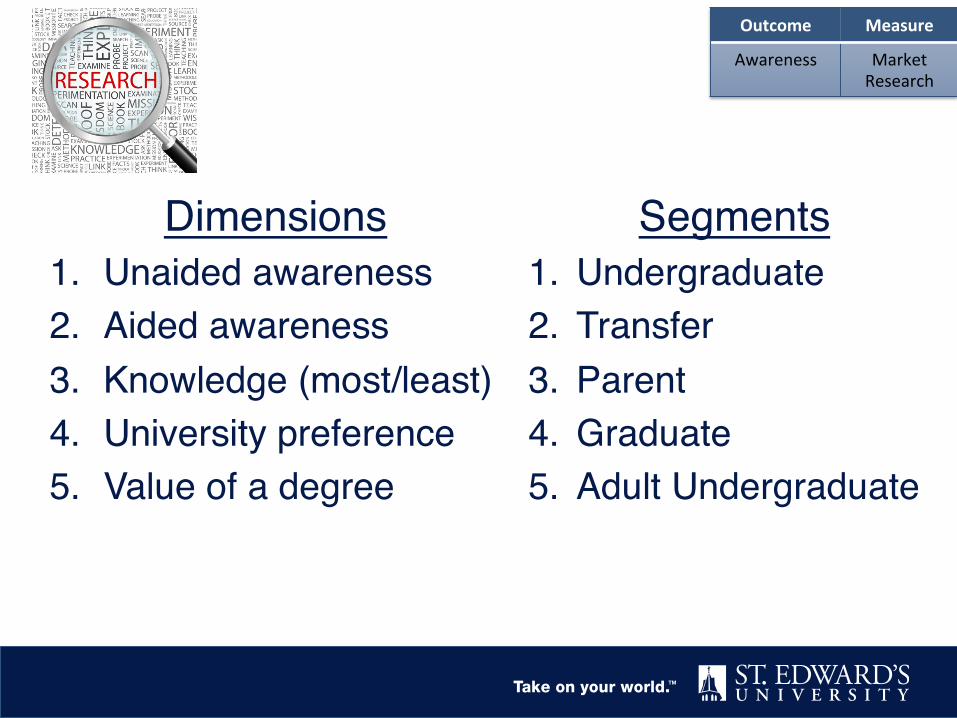
Dimensions!1. Unaided awareness!2. Aided awareness!3. Knowledge (most/least)!4. University preference !5. Value of a degree!
Outcome Measure
Awareness Market Research
Segments!1. Undergraduate!2. Transfer!3. Parent!4. Graduate!5. Adult Undergraduate!
Outcome Measure
Awareness Market Research

Positioning: Common Ground"
Interna2onal University
Liberal Arts Ins2tu2on
Academic challenge
Global perspec2ve
Prepara2on to make a difference in the world
Personalized learning
Both posi)oning concepts have strong appeal across all
response groups
Outcome Measure
Awareness Market Research

Our Brand Promise St. Edward’s is a nationally ranked university with
partner universities in 10 countries. We provide an inspiring, academically challenging environment that
emphasizes global perspective and prepares students to make a difference in their world.!


Audience Feedback"• Very positive market test !– 80% positive on likability !– 70% positive on call to action for both ad concepts !– 95% understandable/not confusing!
• Responses indicate that new brand concepts are effectively communicated through these ads!
!
Outcome Measure
Awareness Market Research

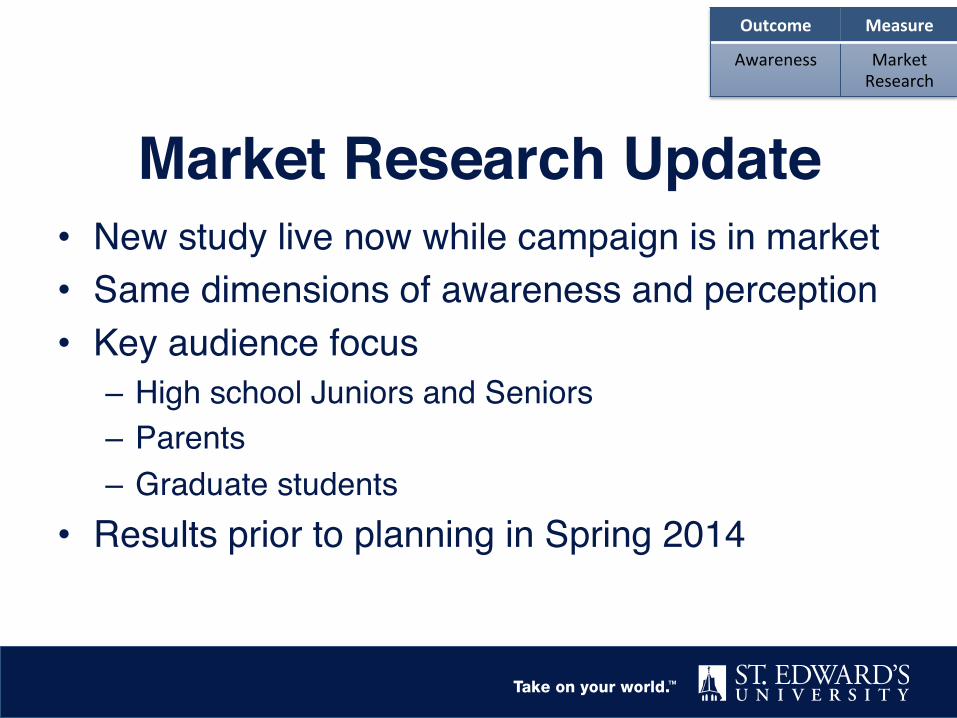
Market Research Update"• New study live now while campaign is in market!• Same dimensions of awareness and perception!• Key audience focus !– High school Juniors and Seniors!– Parents!– Graduate students!
• Results prior to planning in Spring 2014!
Outcome Measure
Awareness Market Research
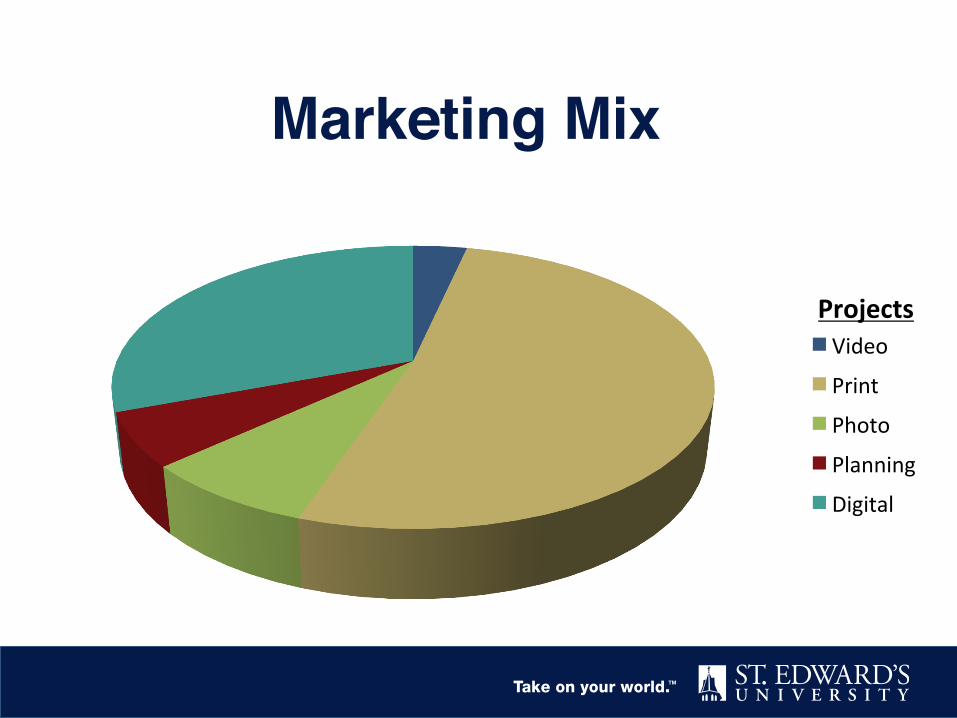
Marketing Mix"
Projects Video
Photo
Planning
Digital

Allocating Resources"• Considerations!– Digital first!– Evolving marketing vehicles!– Campus relationships and effective marketing!
• Data opportunities!– Common tools!– Program research!– Internal traffic and production role!
Outcome Measure
Awareness Market Research

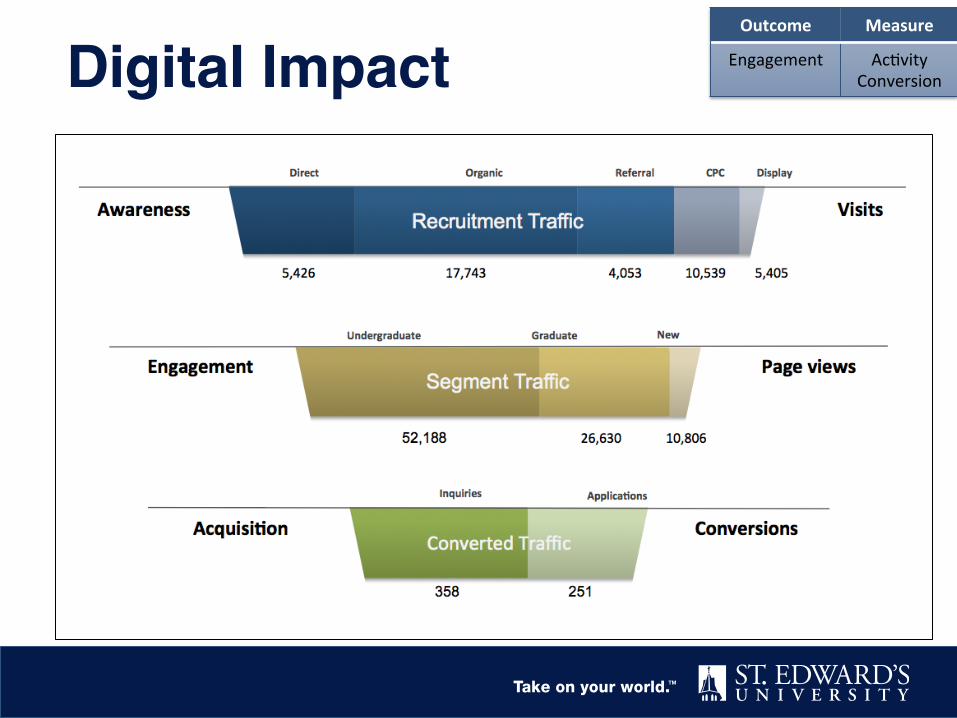
Effective Digital"Outcome Measure
Engagement Ac2vity Conversion

Content Resonance"Outcome Measure
Engagement Ac2vity Conversion
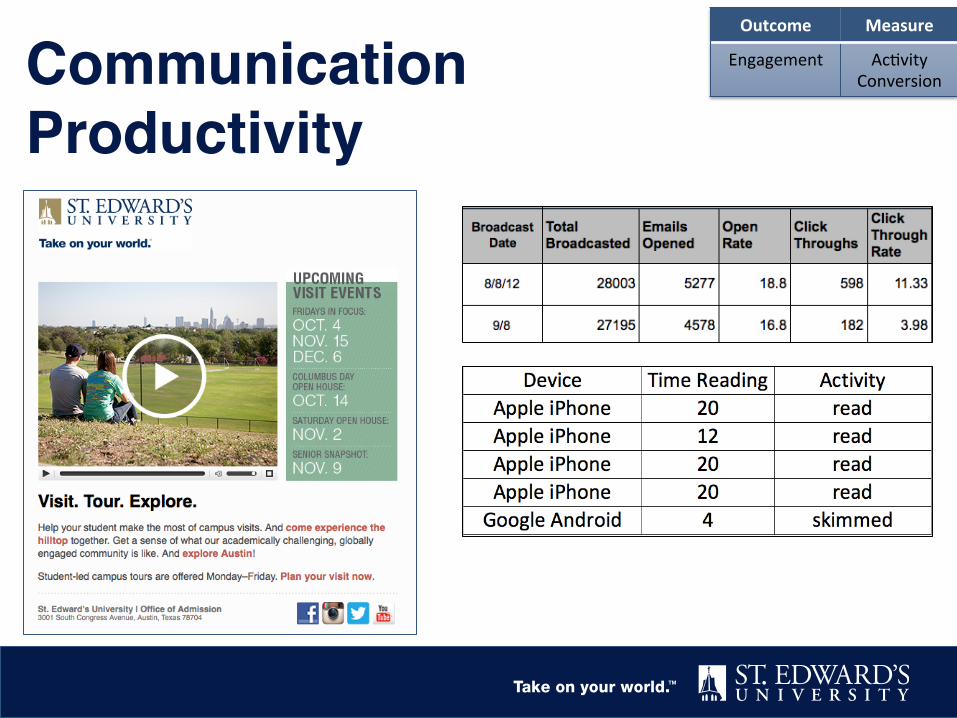
Communication Productivity"
Outcome Measure
Engagement Ac2vity Conversion

Content Conversion Rate Conversions per Source
0
10
20
30
40
50
60
70
80
90
100
0.00%
0.20%
0.40%
0.60%
0.80%
1.00%
1.20%
1.40%
1.60%
1.80%
2.00%
CPC Direct Organic Referral
Conversion Rate Inquiries
0
50
100
150
200
250
300
0.00%
2.00%
4.00%
6.00%
8.00%
10.00%
12.00%
14.00%
Academics Admission Transfer Global Life Visit Faith & Service
About Support
Conversion Rate Inquiries
Outcome Measure
Engagement Ac2vity Conversion Website Conversion"
Outcome Measure
Engagement Ac2vity Conversion Digital Impact"
Develop and Monitor New Data"• Within your team, on campus and external!• No one collecting = Opportunity for Marketing!
Academic Program Development"• Partnership with Academic Affairs!• Key components to assess market potential!– Degree conferral patterns!– Employment outlook!– Target population trends!– Competitive offerings and pricing!– Market size and market share!
Outcome Measure
Relevance Enrollment Growth

Outcome Measure
Relevance Enrollment Growth

Graduate Management Admission Council"
• Program demand!• Applicant demographics!• Starting salaries!• Employment outlook!
Outcome Measure
Relevance Enrollment Growth
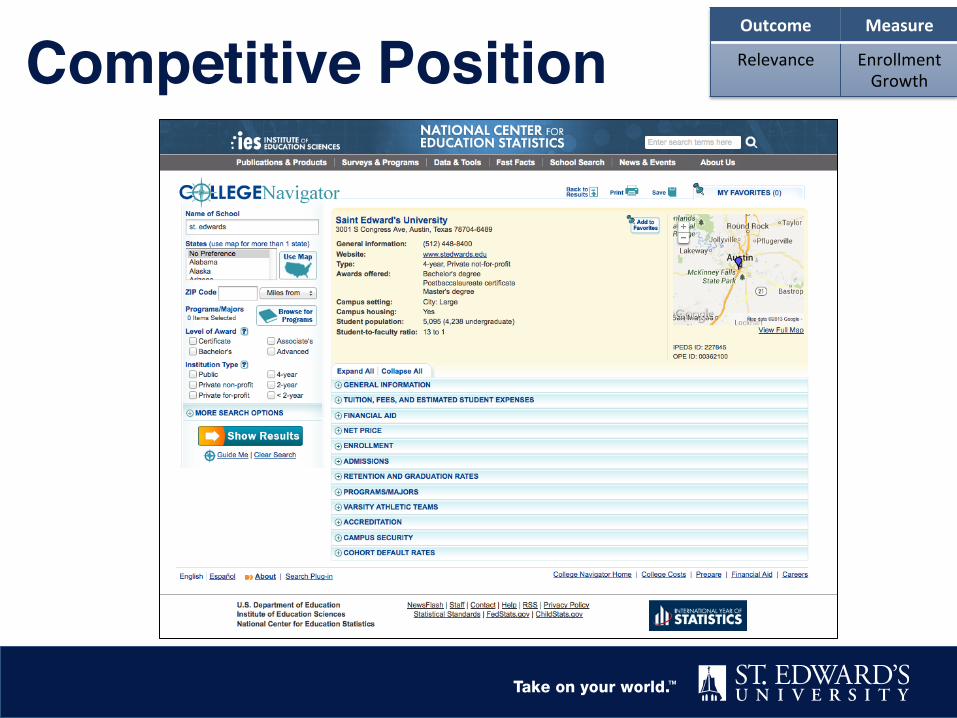
Competitive Position"Outcome Measure
Relevance Enrollment Growth

Enrollment Patterns"
FY 04-‐05 FY 05-‐06 FY 06-‐07 FY 07-‐08 FY 08-‐09 FY 09-‐10 FY 10-‐11 FY 11-‐12 FY 12-‐13 Projected
FY 13-‐14 Projected
Number FTF (Headcount) 370 348 340 334 319 413 319 359 349 356
Tui2on and Fees 19,140 20,470 23,355 24,920 26,530 27,850 29,325 31,270 32,850 34,330
Net Tui2on Revenue per FTF 9,247 10,506 12,101 13,616 11,862 10,850 13,439 14,201 15,172 16,043
-‐
50
100
150
200
250
300
350
400
450
500
$0
$5,000
$10,000
$15,000
$20,000
$25,000
$30,000
$35,000
$40,000
Dollars
College X Tui;on and Net Tui;on
Outcome Measure
Financial Health
Net Tui2on Revenue

Discounting Trends"
FY 04-‐05 FY 05-‐06 FY 06-‐07 FY 07-‐08 FY 08-‐09 FY 09-‐10 FY 10-‐11 FY 11-‐12 FY 12-‐13 Projecte
d
FY 13-‐14 Projecte
d Calculated Discount Rate (NACUBO Component
formula) 49.1% 45.8% 45.3% 42.2% 53.6% 59.2% 53.1% 56.5% 58.4% 57.4%
NACUBO Average Tui2on Discount Percentages FTF 3 -‐ 10 Yr Ins2tu2ons 38.7% 37.7% 39.9% 40.8% 44.0% 44.0% 45.6% 46.2% 47.1% 48.2%
0.0%
10.0%
20.0%
30.0%
40.0%
50.0%
60.0%
70.0%
80.0%
90.0%
100.0%
Tui;on
Discoun
t Rate
College X Discount Rates
Outcome Measure
Financial Health
Net Tui2on Revenue
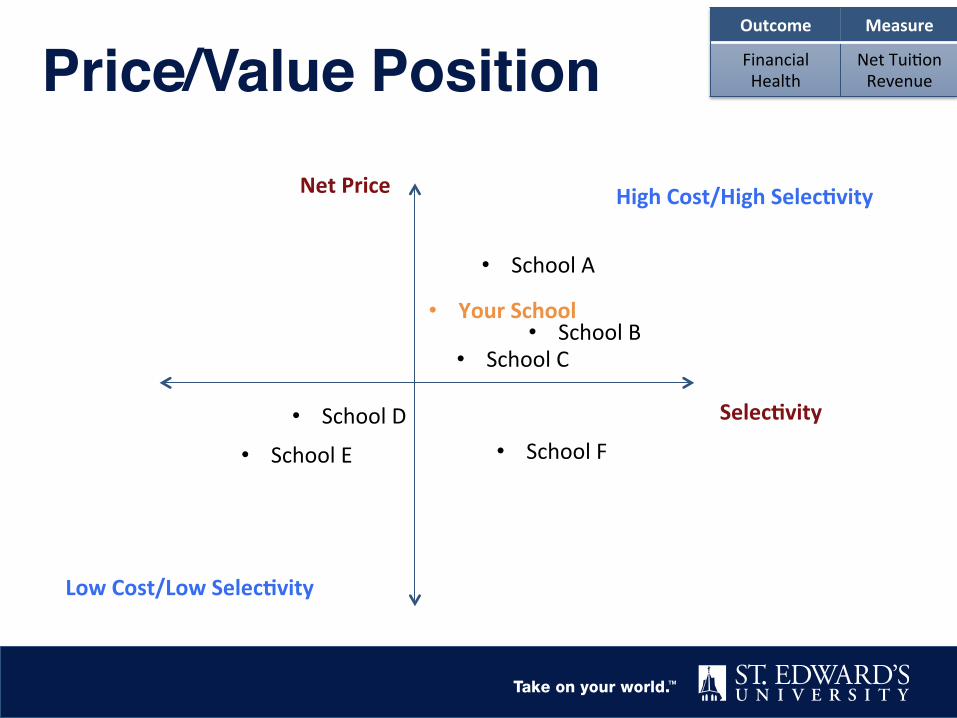
Price/Value Position"Net Price
Selec;vity
Low Cost/Low Selec;vity
High Cost/High Selec;vity
• School C • School B
• School A
• School E
• School D
• Your School
• School F
Outcome Measure
Financial Health
Net Tui2on Revenue

Customer Experience"• Institutional Research!
– Customer Satisfaction!– Net Promoter?!– Admitted Student Questionnaire (ASQ)!– National Survey of Student Engagement (NSSE)!– Classroom surveys and instructor evaluations!– Graduation surveys!
• Points of Service!– Dining, Advising!
Outcome Measure
Customer Experience
Reten2on

Student Experience"We will deliver a consistently effective and uniquely differentiated recruitment experience as students move from initial awareness of St. Edward’s to the 12th class day.!!
Campus-wide discussions!– Standard of service!– Differentiation !– Staying authentic!

Our Top 5"① Align strategically with custom market research!② Evolve measurement tools (e.g. email with Litmus)!③ Monitor competition with College Navigator !④ Use publically available data (GMAC, IPEDS)!⑤ Collaborate across campus (ASQ, NSSE)!
!What are yours?!

Additional Tools"
Questions?"Christie Campbell [email protected]!Paige Booth ! [email protected]!!


![True Colors: What Your Brand Colors Say About Your Business [Infographic]](https://static.documents.pub/doc/80x56/5590f0161a28abee378b4614/true-colors-what-your-brand-colors-say-about-your-business-infographic-5593e71c5cf54.jpg)


