1 (14) Integrated Circuits and Systems http://www.ics.isy.liu.se/en/ TSEK02 – Radio Electronics LAB 1: RADIO RECEIVER MEASUREMENTS By Fahad Qazi and Morteza Abbasi, 2013 2014-10 Updated by Duong Quoc Tai ([email protected]) 2016-12-04 Updated by Ted Johansson ([email protected]) TSEK02 Radio Electronics, HT2 2017 Electronic Devices Laboratory (EK)
Transcript
1 (14)
Integrated Circuits and Systemshttp://www.ics.isy.liu.se/en/
In this lab you will be introduced to basic RF measurement techniques and instrumentation likeoscilloscope, spectrum analyzer and RF signal generator and characterize some building blocks of anAM receiver.
Please note that the objective of this lab is not to understand how the circuits operate or how they aredesigned but rather to be able to measure their performance. You can gain more in depth knowledgeabout circuits in other courses.
Performing measurements with delicate instruments requires a certain level of responsibility andcourtesy. We are certain that you will follow the instructions of this lab carefully and ask for assistancein case something is not clear to you.
Equipment Used
The ElencoTM Superhet 108 AM/FM radio receiver board
Power Supply: SN16A
Oscilloscope: HP 54600B
Spectrum analyzer: R&S FS300
Signal generator: HP E4432B
DVM (Digital Voltmeter), cables and connectors.
The Spectrum Analyzer should be used with extreme care. It must not be used without DC blocker (already connected to RF out)and must not be exposed to power levels higher than 30 dBm. Failing to do so might permanently damage the equipment!
Please do not bring any food or beverages with you into the lab!
TSEK02 Radio Electronics, HT2 2017
3 (14)
2. Background
The function of the broadcast radio receiver is to recover the audio signal that was modulated onto the RF carrier at the radio station, and apply it to the speaker, reproducing the original sounds.
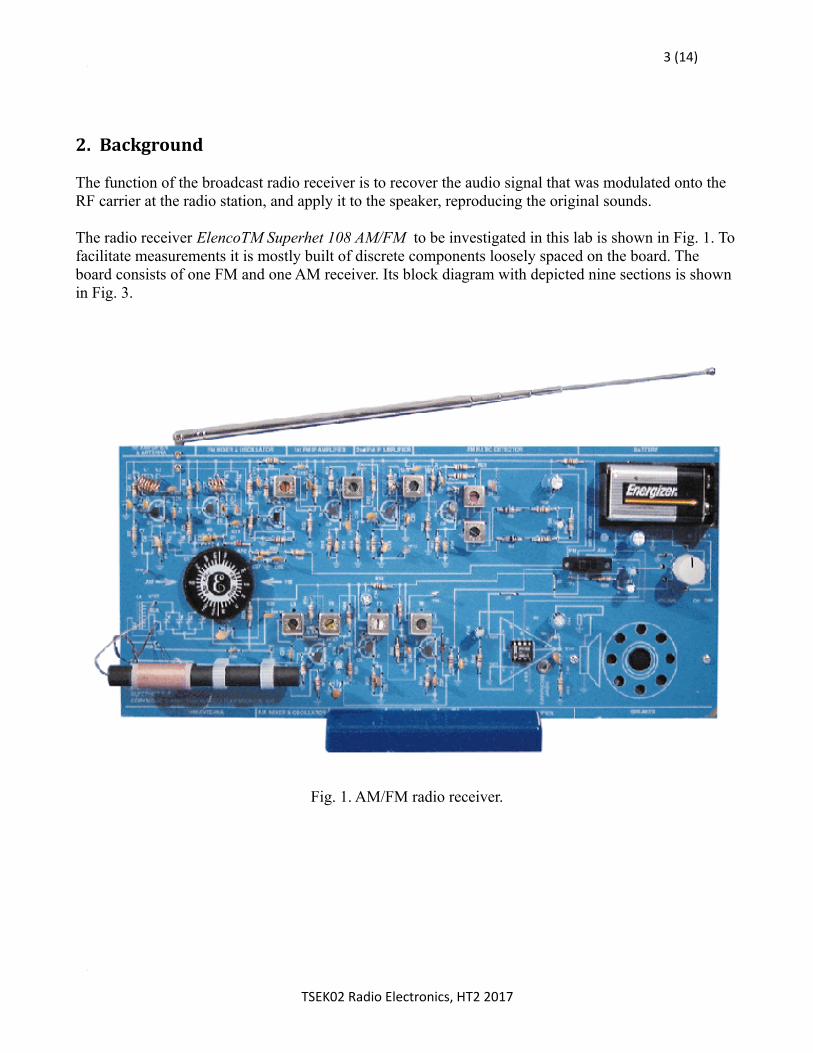
The radio receiver ElencoTM Superhet 108 AM/FM to be investigated in this lab is shown in Fig. 1. Tofacilitate measurements it is mostly built of discrete components loosely spaced on the board. The board consists of one FM and one AM receiver. Its block diagram with depicted nine sections is shown in Fig. 3.
Fig. 1. AM/FM radio receiver.
TSEK02 Radio Electronics, HT2 2017
4 (14)
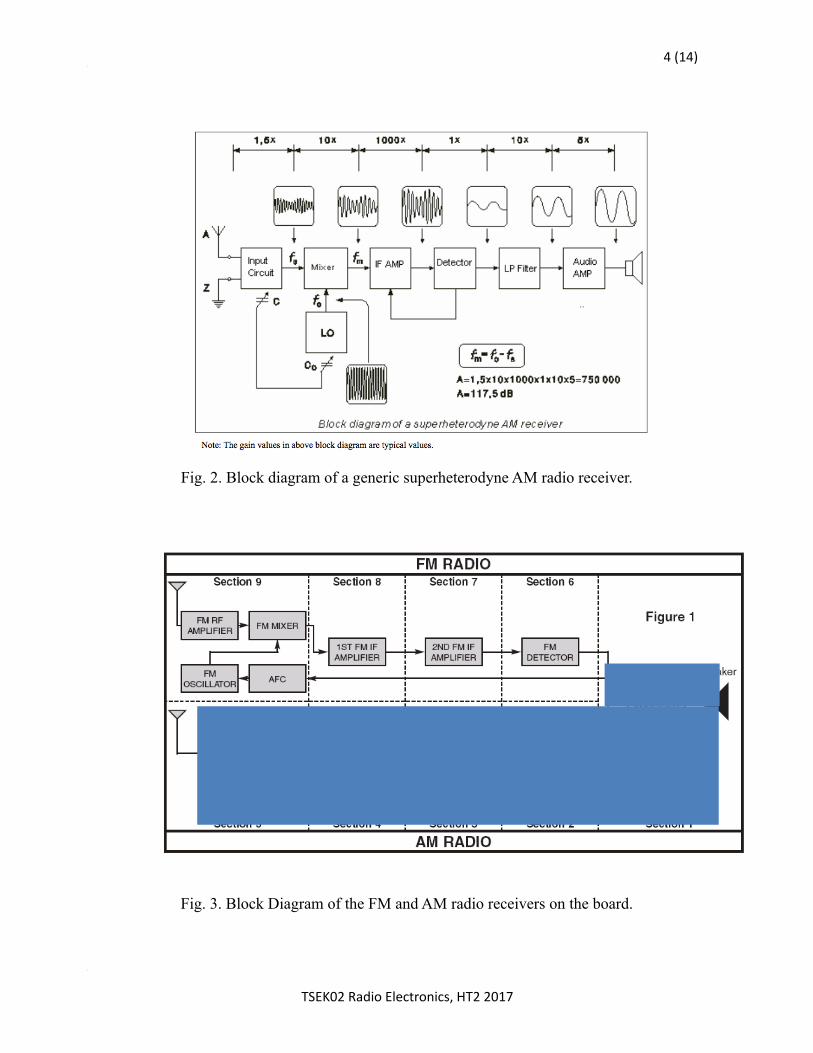
Fig. 2. Block diagram of a generic superheterodyne AM radio receiver.
Fig. 3. Block Diagram of the FM and AM radio receivers on the board.
TSEK02 Radio Electronics, HT2 2017
5 (14)
In this lab we will only characterize the AM receiver, which is highlighted in Fig. 3.
Section 1, the Audio Amplifier Stage, is used to increase the power of the audio signal received from either the AM or FM detector to a power level capable of driving the 8 Ω speaker.
Section 2 includes the AM detector circuit and the AGC (automatic gain control) stage. The AM detector converts the amplitude-modulated IF (intermediate frequency) signal to audio signal. The AGC stage feeds back a DC voltage to the first AM IF amplifier in order to maintain a near constant level of audio at the detector.
Section 3 is the second AM IF amplifier. The second AM IF amplifier is tuned to 455 kHz and has afixed gain of 50 at this center frequency.
Section 4 is the first AM IF amplifier, which has a variable gain that depends on the AGC voltage received from the AGC stage. The first AM IF amplifier is also tuned to 455 kHz.
Section 5 includes the AM mixer, AM oscillator and AM antenna stages. When the radio wave sensed by the antenna, it induces a small voltage across the antenna coil. This voltage is coupled to the mixer and is down-converted to the IF frequency of 455 kHz by mixing the radio frequency signal with the oscillator signal.
Section 6, 7, 8, and 9 are FM radio blocks. We will not measure those blocks in this lab.
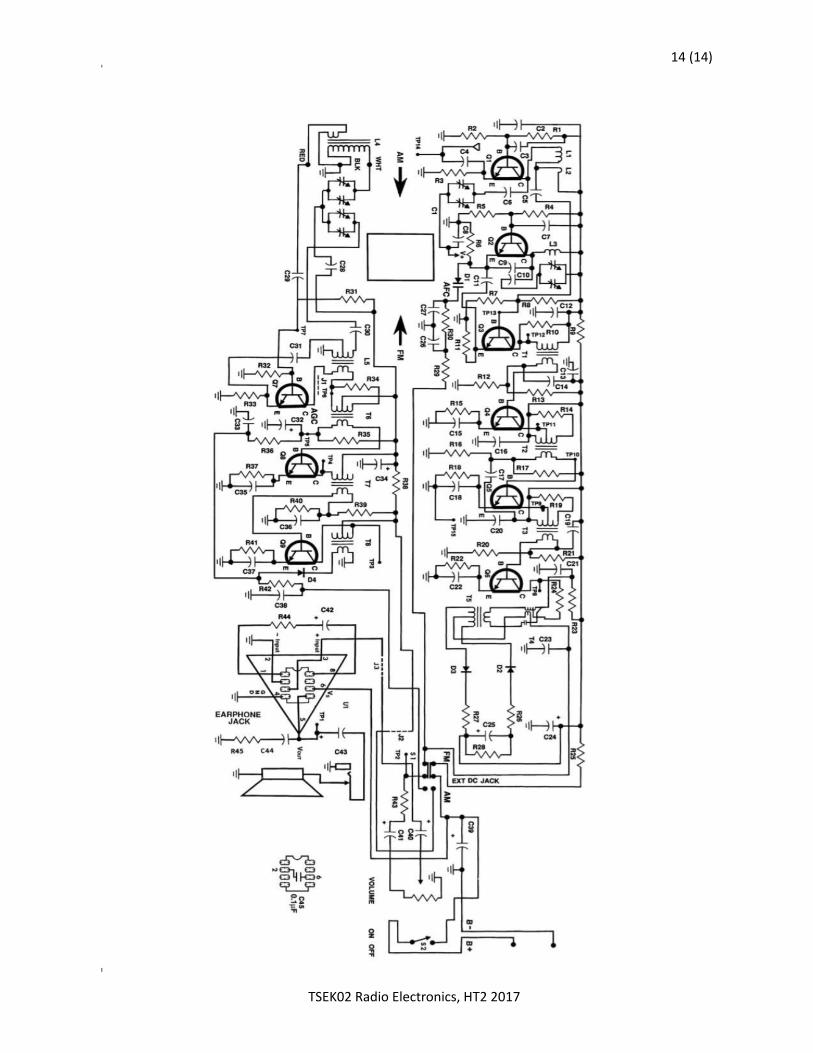
On the last page of this lab manual, you find the detailed schematics of the full PCB for reference. The AM part is the left (lower) part of the schematics.
TSEK02 Radio Electronics, HT2 2017
6 (14)
3. Preparatory Exercises
a. What portions of the frequency spectrum are allocated for typical AM and FM broadcasts?
b. Why is the IF fixed in the superheterodyne receiver, when we tune to the certain radio station by tuning its RF stage?
c. Draw a simplified diagram of an AM envelope detector and illustrate its working principle in the time domain.
TSEK02 Radio Electronics, HT2 2017
7 (14)
4. Measurement Tasks
4.1. DC Power Consumption
Power and current measurement of the AM receiver: use a DVM.
Fix the supply voltage to 9 V and measure the current and calculate the power.
Supply current (receiver off) ___________ mA
Supply current (with moderate volume, FM/AM switch on AM position)
__________ mA calculated power = _____________________ mW
4.2. Audio Amplifier Gain and BW (Section 1)
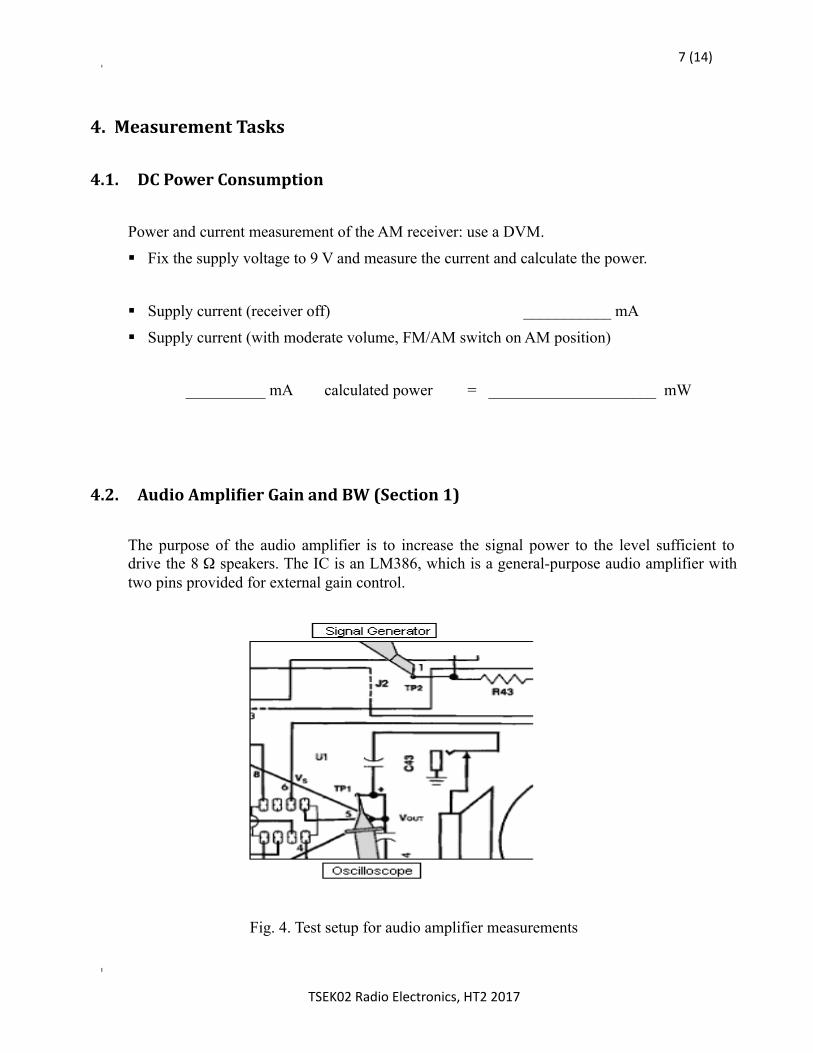
The purpose of the audio amplifier is to increase the signal power to the level sufficient todrive the 8 speakers. The IC is an LM386, which is a general-purpose audio amplifier withtwo pins provided for external gain control.
Fig. 4. Test setup for audio amplifier measurements
TSEK02 Radio Electronics, HT2 2017
8 (14)
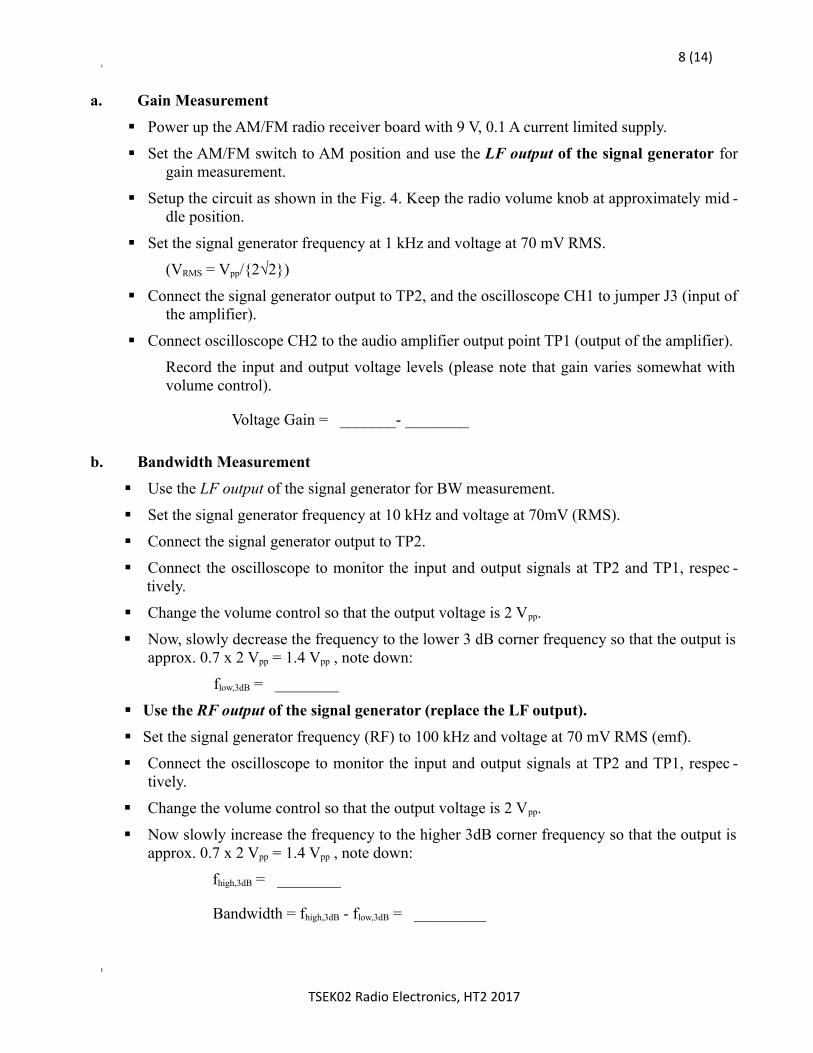
a. Gain Measurement
Power up the AM/FM radio receiver board with 9 V, 0.1 A current limited supply.
Set the AM/FM switch to AM position and use the LF output of the signal generator forgain measurement.
Setup the circuit as shown in the Fig. 4. Keep the radio volume knob at approximately mid -dle position.
Set the signal generator frequency at 1 kHz and voltage at 70 mV RMS.
(VRMS = Vpp/2√2)
Connect the signal generator output to TP2, and the oscilloscope CH1 to jumper J3 (input ofthe amplifier).
Connect oscilloscope CH2 to the audio amplifier output point TP1 (output of the amplifier).
Record the input and output voltage levels (please note that gain varies somewhat withvolume control).
Voltage Gain = _______- ________
b. Bandwidth Measurement
Use the LF output of the signal generator for BW measurement.
Set the signal generator frequency at 10 kHz and voltage at 70mV (RMS).
Connect the signal generator output to TP2.
Connect the oscilloscope to monitor the input and output signals at TP2 and TP1, respec -tively.
Change the volume control so that the output voltage is 2 Vpp.
Now, slowly decrease the frequency to the lower 3 dB corner frequency so that the output isapprox. 0.7 x 2 Vpp = 1.4 Vpp , note down:
flow,3dB = ________
Use the RF output of the signal generator (replace the LF output).
Set the signal generator frequency (RF) to 100 kHz and voltage at 70 mV RMS (emf).
Connect the oscilloscope to monitor the input and output signals at TP2 and TP1, respec -tively.
Change the volume control so that the output voltage is 2 Vpp.
Now slowly increase the frequency to the higher 3dB corner frequency so that the output isapprox. 0.7 x 2 Vpp = 1.4 Vpp , note down:
fhigh,3dB = ________
Bandwidth = fhigh,3dB - flow,3dB = _________
TSEK02 Radio Electronics, HT2 2017
9 (14)
4.3. AM Detector and AGC (Section 2)
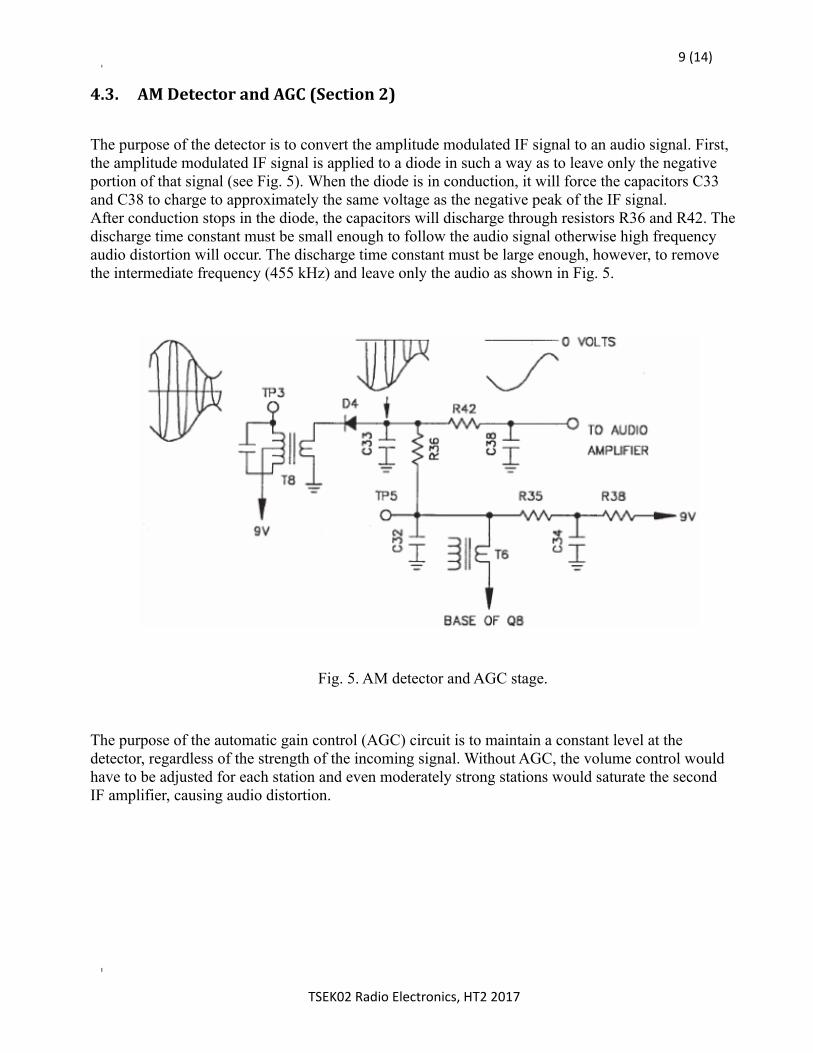
The purpose of the detector is to convert the amplitude modulated IF signal to an audio signal. First, the amplitude modulated IF signal is applied to a diode in such a way as to leave only the negative portion of that signal (see Fig. 5). When the diode is in conduction, it will force the capacitors C33 and C38 to charge to approximately the same voltage as the negative peak of the IF signal. After conduction stops in the diode, the capacitors will discharge through resistors R36 and R42. Thedischarge time constant must be small enough to follow the audio signal otherwise high frequency audio distortion will occur. The discharge time constant must be large enough, however, to remove the intermediate frequency (455 kHz) and leave only the audio as shown in Fig. 5.
Fig. 5. AM detector and AGC stage.
The purpose of the automatic gain control (AGC) circuit is to maintain a constant level at the detector, regardless of the strength of the incoming signal. Without AGC, the volume control would have to be adjusted for each station and even moderately strong stations would saturate the second
IF amplifier, causing audio distortion.
TSEK02 Radio Electronics, HT2 2017
10 (14)
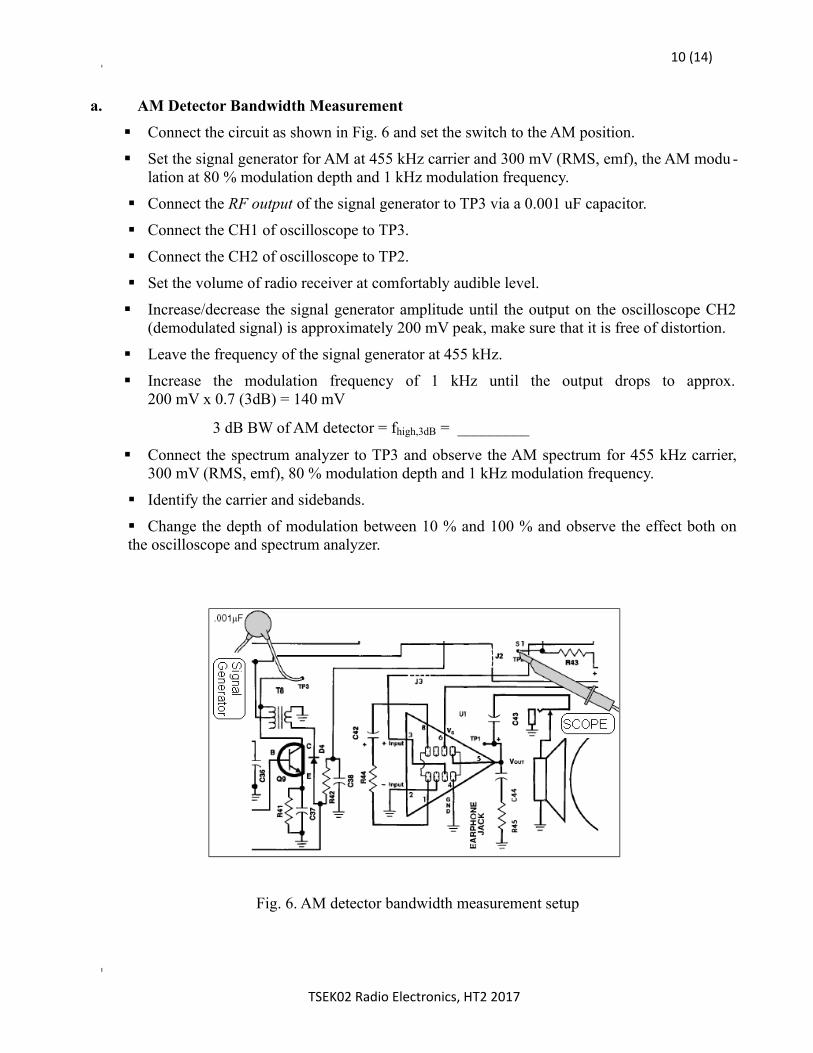
a. AM Detector Bandwidth Measurement
Connect the circuit as shown in Fig. 6 and set the switch to the AM position.
Set the signal generator for AM at 455 kHz carrier and 300 mV (RMS, emf), the AM modu -lation at 80 % modulation depth and 1 kHz modulation frequency.
Connect the RF output of the signal generator to TP3 via a 0.001 uF capacitor.
Connect the CH1 of oscilloscope to TP3.
Connect the CH2 of oscilloscope to TP2.
Set the volume of radio receiver at comfortably audible level.
Increase/decrease the signal generator amplitude until the output on the oscilloscope CH2(demodulated signal) is approximately 200 mV peak, make sure that it is free of distortion.
Leave the frequency of the signal generator at 455 kHz.
Increase the modulation frequency of 1 kHz until the output drops to approx.200 mV x 0.7 (3dB) = 140 mV
3 dB BW of AM detector = fhigh,3dB = _________
Connect the spectrum analyzer to TP3 and observe the AM spectrum for 455 kHz carrier,300 mV (RMS, emf), 80 % modulation depth and 1 kHz modulation frequency.
Identify the carrier and sidebands.
Change the depth of modulation between 10 % and 100 % and observe the effect both onthe oscilloscope and spectrum analyzer.
Fig. 6. AM detector bandwidth measurement setup
TSEK02 Radio Electronics, HT2 2017
11 (14)
4.4. 1st IF Amplifier (Section 3 and 4) Gain and Bandwidth Measurement
The operation of the 1st IF amplifier is the same as the second IF amplifier with one important differ-ence. The gain of the first IF amplifier decreases after the AGC threshold is crossed to keep the audiooutput constant at the detector and prevent overload of the second IF amplifier.
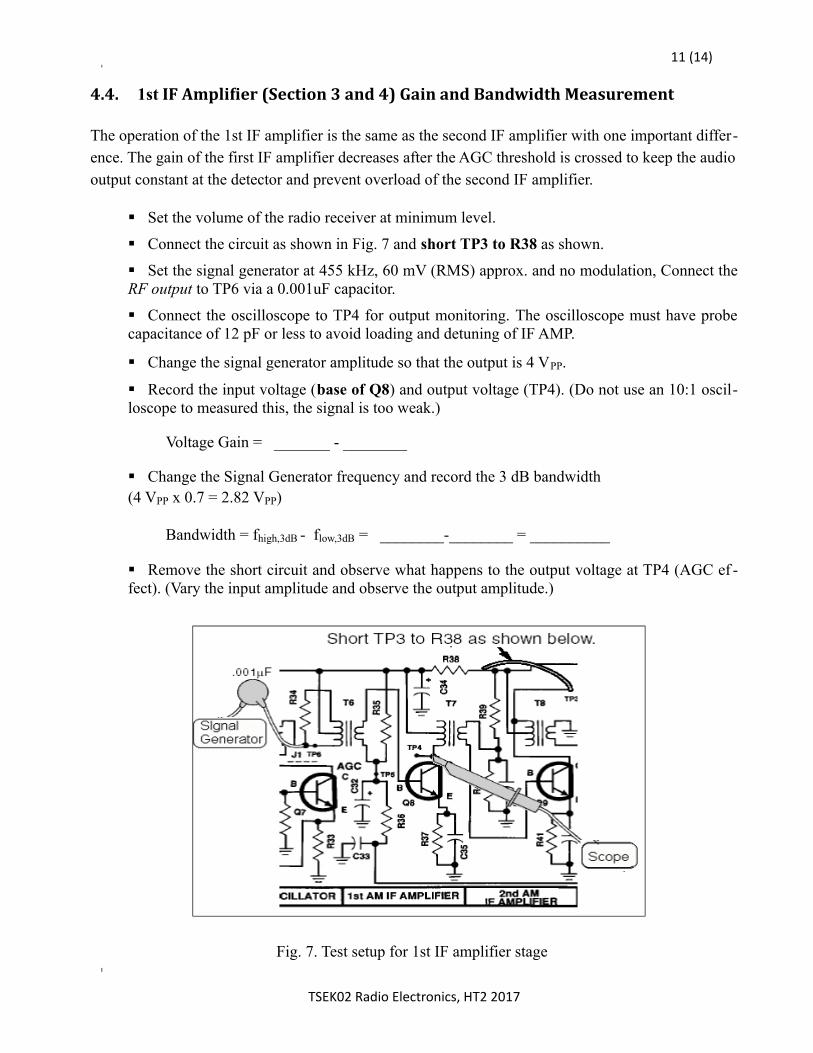
Set the volume of the radio receiver at minimum level.
Connect the circuit as shown in Fig. 7 and short TP3 to R38 as shown.
Set the signal generator at 455 kHz, 60 mV (RMS) approx. and no modulation, Connect theRF output to TP6 via a 0.001uF capacitor.
Connect the oscilloscope to TP4 for output monitoring. The oscilloscope must have probecapacitance of 12 pF or less to avoid loading and detuning of IF AMP.
Change the signal generator amplitude so that the output is 4 VPP.
Record the input voltage (base of Q8) and output voltage (TP4). (Do not use an 10:1 oscil-loscope to measured this, the signal is too weak.)
Voltage Gain = _______ - ________
Change the Signal Generator frequency and record the 3 dB bandwidth (4 VPP x 0.7 = 2.82 VPP)
Remove the short circuit and observe what happens to the output voltage at TP4 (AGC ef -fect). (Vary the input amplitude and observe the output amplitude.)
Fig. 7. Test setup for 1st IF amplifier stage
TSEK02 Radio Electronics, HT2 2017
12 (14)
4.5. AM Mixer and Oscillator (Section 5)
In a superheterodyne receiver, the radio waves at the antenna are amplified and then mixed with thelocal oscillator to produce the intermediate frequency (IF). Transistor Q7 amplifies the RF signal,and simultaneously oscillates at a frequency 455 kHz (AM IF frequency) above the desired radiostation frequency. So the RF amplifier, local oscillator, and mixer are in one circuit here.
To make the oscillator a positive feedback from the collector to the emitter of Q7 is provided by coilL5 and capacitor C31. During the mixing process the following four frequencies are present at thecollector of Q7:
1. The local oscillator frequency: LO.
2. The RF carrier or radio station frequency: RF.
3. The sum of these two frequencies: LO + RF.
4. The difference of these two frequencies: LO – RF.
The “difference frequency” is used as the IF in AM radios. The collector of Q7 also contains an IF transformer (T6) tuned to the difference frequency. This transformer rejects all frequencies except those near 455 kHz. T6 also couples the 455 kHz signal to the base of Q8 to be processed by the IF amplifiers.
The antenna and the oscillator coils are the only two resonant circuits that change when the radio is tuned for different stations. Since a radio station may exist 455 kHz above the oscillator frequency, itis important that the antenna filter rejects this station and selects only the station 455 kHz below the oscillator frequency that we refer to as the image problem. If the selectivity of the antenna (Q factor) is high, the image will be reduced sufficiently. The oscillator circuit must also change when the radiois tuned in order to remain 455 kHz above the tuning of the desired radio station. The degree of accuracy in keeping the oscillator frequency exactly 455 kHz above the tuning of the antenna is called tracking accuracy.
The tuning device is a variable capacitor, which consists of several plates that are moved in/out ofeach other. If you look carefully at the back of the printed circuit board, you can see them movewhen you rotate the tuning wheel.
a. Measurement of Tracking Range of Local Oscillator
Connect the circuit as shown in Fig. 8.
Connect the Oscilloscope to the collector of Q7.
Turn the Tuning Knob from one extreme to another extreme and note the oscillator fre-quency.
fmin ___________ , fmax ____________.
Tracking Range: _________________________ Calculate the AM frequency band reception possible for an IF of 455 kHz.
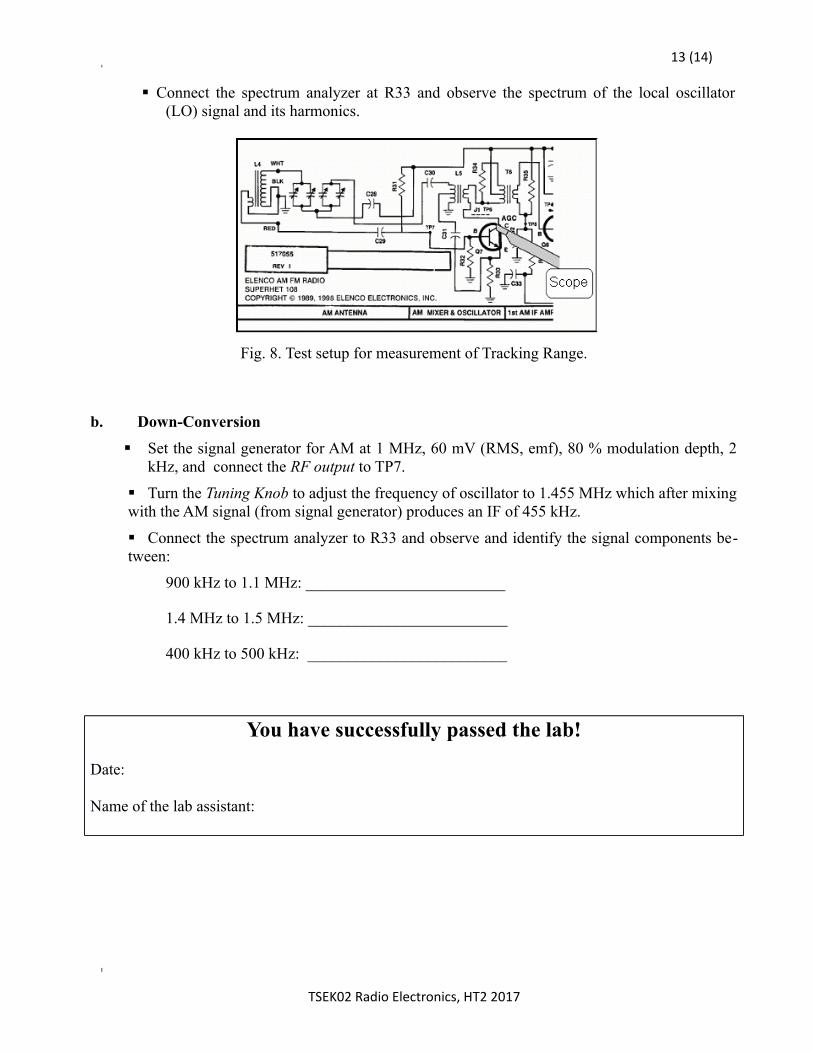
Connect the spectrum analyzer at R33 and observe the spectrum of the local oscillator(LO) signal and its harmonics.
Fig. 8. Test setup for measurement of Tracking Range.
b. Down-Conversion
Set the signal generator for AM at 1 MHz, 60 mV (RMS, emf), 80 % modulation depth, 2kHz, and connect the RF output to TP7.
Turn the Tuning Knob to adjust the frequency of oscillator to 1.455 MHz which after mixingwith the AM signal (from signal generator) produces an IF of 455 kHz.
Connect the spectrum analyzer to R33 and observe and identify the signal components be-tween: