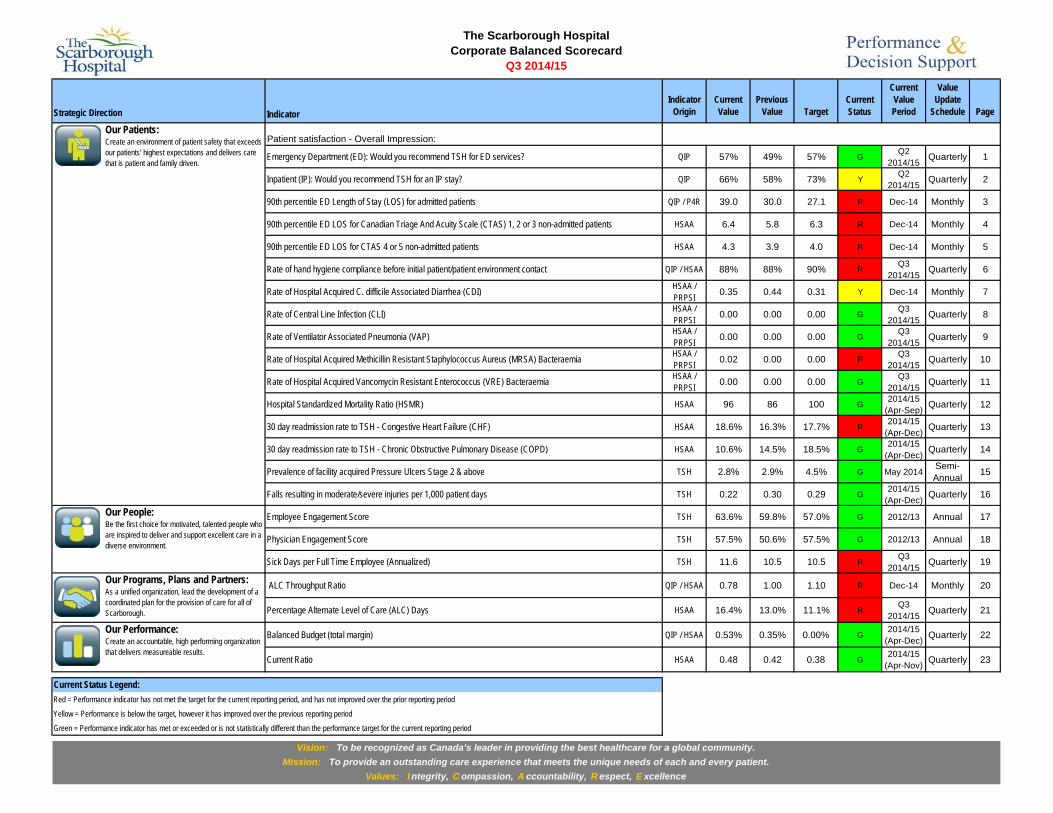
Indicator Indicator Origin Current Value Previous Value Target Current Status Current Value Period Value Update Schedule Page Patient satisfaction - Overall Impression: Emergency Department (ED): Would you recommend TSH for ED services? QIP 57% 49% 57% G Q2 2014/15 Quarterly 1 Inpatient (IP): Would you recommend TSH for an IP stay? QIP 66% 58% 73% Y Q2 2014/15 Quarterly 2 90th percentile ED Length of Stay (LOS) for admitted patients QIP / P4R 39.0 30.0 27.1 R Dec-14 Monthly 3 90th percentile ED LOS for Canadian Triage And Acuity Scale (CTAS) 1, 2 or 3 non-admitted patients HSAA 6.4 5.8 6.3 R Dec-14 Monthly 4 90th percentile ED LOS for CTAS 4 or 5 non-admitted patients HSAA 4.3 3.9 4.0 R Dec-14 Monthly 5 Rate of hand hygiene compliance before initial patient/patient environment contact QIP / HSAA 88% 88% 90% R Q3 2014/15 Quarterly 6 Rate of Hospital Acquired C. difficile Associated Diarrhea (CDI) HSAA / PRPSI 0.35 0.44 0.31 Y Dec-14 Monthly 7 Rate of Central Line Infection (CLI) HSAA / PRPSI 0.00 0.00 0.00 G Q3 2014/15 Quarterly 8 Rate of Ventilator Associated Pneumonia (VAP) HSAA / PRPSI 0.00 0.00 0.00 G Q3 2014/15 Quarterly 9 Rate of Hospital Acquired Methicillin Resistant Staphylococcus Aureus (MRSA) Bacteraemia HSAA / PRPSI 0.02 0.00 0.00 R Q3 2014/15 Quarterly 10 Rate of Hospital Acquired Vancomycin Resistant Enterococcus (VRE) Bacteraemia HSAA / PRPSI 0.00 0.00 0.00 G Q3 2014/15 Quarterly 11 Hospital Standardized Mortality Ratio (HSMR) HSAA 96 86 100 G 2014/15 (Apr-Sep) Quarterly 12 30 day readmission rate to TSH - Congestive Heart Failure (CHF) HSAA 18.6% 16.3% 17.7% R 2014/15 (Apr-Dec) Quarterly 13 30 day readmission rate to TSH - Chronic Obstructive Pulmonary Disease (COPD) HSAA 10.6% 14.5% 18.5% G 2014/15 (Apr-Dec) Quarterly 14 Prevalence of facility acquired Pressure Ulcers Stage 2 & above TSH 2.8% 2.9% 4.5% G May 2014 Semi- Annual 15 Falls resulting in moderate/severe injuries per 1,000 patient days TSH 0.22 0.30 0.29 G 2014/15 (Apr-Dec) Quarterly 16 Employee Engagement Score TSH 63.6% 59.8% 57.0% G 2012/13 Annual 17 Physician Engagement Score TSH 57.5% 50.6% 57.5% G 2012/13 Annual 18 Sick Days per Full Time Employee (Annualized) TSH 11.6 10.5 10.5 R Q3 2014/15 Quarterly 19 ALC Throughput Ratio QIP / HSAA 0.78 1.00 1.10 R Dec-14 Monthly 20 Percentage Alternate Level of Care (ALC) Days HSAA 16.4% 13.0% 11.1% R Q3 2014/15 Quarterly 21 Balanced Budget (total margin) QIP / HSAA 0.53% 0.35% 0.00% G 2014/15 (Apr-Dec) Quarterly 22 Current Ratio HSAA 0.48 0.42 0.38 G 2014/15 (Apr-Nov) Quarterly 23 Current Status Legend: Red = Performance indicator has not met the target for the current reporting period, and has not improved over the prior reporting period Yellow = Performance is below the target, however it has improved over the previous reporting period Green = Performance indicator has met or exceeded or is not statistically different than the performance target for the current reporting period Our Programs, Plans and Partners: As a unified organization, lead the development of a coordinated plan for the provision of care for all of Scarborough. Values: I ntegrity, C ompassion, A ccountability, R espect, E xcellence Vision: To be recognized as Canada’s leader in providing the best healthcare for a global community. Mission: To provide an outstanding care experience that meets the unique needs of each and every patient. Our Performance: Create an accountable, high performing organization that delivers measureable results. The Scarborough Hospital Corporate Balanced Scorecard Q3 2014/15 Strategic Direction Our People: Be the first choice for motivated, talented people who are inspired to deliver and support excellent care in a diverse environment. Our Patients: Create an environment of patient safety that exceeds our patients' highest expectations and delivers care that is patient and family driven.
Transcript
IndicatorIndicator
OriginCurrent Value
Previous Value Target
Current Status
Current Value Period
Value Update
Schedule Page
Patient satisfaction - Overall Impression:
Emergency Department (ED): Would you recommend TSH for ED services? QIP 57% 49% 57% GQ2
2014/15 Quarterly 1
Inpatient (IP): Would you recommend TSH for an IP stay? QIP 66% 58% 73% YQ2
2014/15 Quarterly 2
90th percentile ED Length of Stay (LOS) for admitted patients QIP / P4R 39.0 30.0 27.1 R Dec-14 Monthly 3
90th percentile ED LOS for Canadian Triage And Acuity Scale (CTAS) 1, 2 or 3 non-admitted patients HSAA 6.4 5.8 6.3 R Dec-14 Monthly 4
90th percentile ED LOS for CTAS 4 or 5 non-admitted patients HSAA 4.3 3.9 4.0 R Dec-14 Monthly 5
Rate of hand hygiene compliance before initial patient/patient environment contact QIP / HSAA 88% 88% 90% RQ3
2014/15 Quarterly 6
Rate of Hospital Acquired C. difficile Associated Diarrhea (CDI) HSAA / PRPSI 0.35 0.44 0.31 Y Dec-14 Monthly 7
Rate of Central Line Infection (CLI) HSAA / PRPSI 0.00 0.00 0.00 G
Q3 2014/15 Quarterly 8
Rate of Ventilator Associated Pneumonia (VAP) HSAA / PRPSI 0.00 0.00 0.00 G
Q3 2014/15 Quarterly 9
Rate of Hospital Acquired Methicillin Resistant Staphylococcus Aureus (MRSA) Bacteraemia HSAA / PRPSI 0.02 0.00 0.00 R
Q3 2014/15 Quarterly 10
Rate of Hospital Acquired Vancomycin Resistant Enterococcus (VRE) Bacteraemia HSAA / PRPSI 0.00 0.00 0.00 G
Q3 2014/15 Quarterly 11
Hospital Standardized Mortality Ratio (HSMR) HSAA 96 86 100 G2014/15
(Apr-Sep) Quarterly 12
30 day readmission rate to TSH - Congestive Heart Failure (CHF) HSAA 18.6% 16.3% 17.7% R2014/15
(Apr-Dec) Quarterly 13
30 day readmission rate to TSH - Chronic Obstructive Pulmonary Disease (COPD) HSAA 10.6% 14.5% 18.5% G2014/15
(Apr-Dec) Quarterly 14
Prevalence of facility acquired Pressure Ulcers Stage 2 & above TSH 2.8% 2.9% 4.5% G May 2014 Semi-Annual 15
Falls resulting in moderate/severe injuries per 1,000 patient days TSH 0.22 0.30 0.29 G2014/15
Current Status Legend:Red = Performance indicator has not met the target for the current reporting period, and has not improved over the prior reporting period
Yellow = Performance is below the target, however it has improved over the previous reporting period
Green = Performance indicator has met or exceeded or is not statistically different than the performance target for the current reporting period
Our Programs, Plans and Partners: As a unified organization, lead the development of a coordinated plan for the provision of care for all of Scarborough.
Values: I ntegrity, C ompassion, A ccountability, R espect, E xcellence
Vision: To be recognized as Canada’s leader in providing the best healthcare for a global community.Mission: To provide an outstanding care experience that meets the unique needs of each and every patient.
Our Performance: Create an accountable, high performing organization that delivers measureable results.
The Scarborough HospitalCorporate Balanced Scorecard
Q3 2014/15
Strategic Direction
Our People: Be the first choice for motivated, talented people who are inspired to deliver and support excellent care in a diverse environment.
Our Patients: Create an environment of patient safety that exceeds our patients' highest expectations and delivers care that is patient and family driven.
Performance Measurement Summary
Action Plan
N. Veloso, J. Miller
SignificanceThis indicator is a measure of patient's overall impression of the quality of care received.
TargetTSH target is 73% for IP. The target is based on GTA average.
AnalysisTSH inpatient satisfaction scores continue to be below other Greater Toronto Area hospitals. TSH has made positive changes such as Code of Conduct, and faster response time to patient complaint by Patient Relations department; however, we cannot see any consistent trend that could be directly linked to these strategies.
The Scarborough HospitalCorporate Balanced Scorecard
Indicator Patient satisfaction - Overall Impression- IP: Would you recommend TSH for an In-patient stay?
YStrategic Direction Our Patients
Source NRC PickerIndicator Lead M. Fryers
Time Frame Q2 2014/15
DefinitionResponse to Overall Impression questions in NRC Picker survey administered to a sample of discharged inpatients:- Inpatients: Would you recommend TSH for an In-patient stay?
CHART PLACEHOLDER
Date Initiated Current Status
Expand virtual ward program to support patients in the transition home upon discharge with a navigator link
Incorporate patient/family rounds with unit leaders to seek feedback on care or concerns as well as daily stat sheet discussions with staff re: compliments or concerns from families to ensure timely resolution of issues
N. Veloso, L. Kane, M. DePaulsen, S. Johnson, T. Early
Sep-14 Ongoing
Jan-15 In Progress
SMART Initiative (Specific, Measureable, Attainable, Realistic, Time-Bound) Lead
59% n=336
62% n=313
66% n=325
59% n=344
62% n=311
63% n=323
62% n=298
62% n=296
58% n=293
61% n=247
69% n=254
60% n=273
63% n=254
57% n=225
62% n=230
59% n=242
58% n=211
66% n=201
0%
10%
20%
30%
40%
50%
60%
70%
80%
90%
100%
IP Score Target
Page 2
Performance Measurement Summary
Action PlanSMART Initiative (Specific, Measureable, Attainable, Realistic, Time-Bound) Lead Date Initiated Current Status
AnalysisTSH wait time for admitted patients was up in most months of 2014 compared to 2013 with the exception of September and October. Regardless, TSH moved up in the performance ranking among P4R hospitals to 9 (Birchmount) and 27 (General) among the 74 P4R hospitals for 2014, a large improvement over 2013 (14 and 29). Performance with admit wait time will remain a significant interest for the Clinical Operations group through 2015/16.
The Scarborough HospitalCorporate Balanced Scorecard
Indicator 90th percentile ED LOS for admitted patients
RIndicator Lead M. Fryers
Strategic Direction Our PatientsTime Frame December 2014Source NACRS
Definition90th percentile length of stay in hours for admitted patients at General Campus Emergency Department, measured from registration to leaving General Campus Emergency Department.
CHART PLACEHOLDER
SignificanceThis is to meet Pay-for-Results expectations. There could be funding impact if targets are not met.
TargetCELHIN Target (HSAA) - 27.1 General, 29.5 Birchmount
Hire Physician Assistants (PA) to extend the Medical Consultants capacity in ED N. Veloso, Dr. S. Finklestein
Summer 2014 Two PAs joined the Medical Team in November 2014 with an evaluation of impact commencing in January 2015
17.9
22.7
16.9 19
.8
19.7
22.8
21.2
25.9
24.1
34.2
26.8 27.9
28.5
25.6
19.6 21
.5 23.4
21.1
21.3
35.8
41.4
23.7
12.3 15
.0
23.6
22.9
28.8
28.1
27.0
27.8
33.2
30.6
40.6
29.2
22.3
15.5
23.7 25.5
20.2 21.0
24.4
35.2
20.7
19.1
16.4
21.6
21.3
26.1
25.4 26.4
26.3
34.0
28.6 31
.5
28.9
24.0
17.6
22.4 24
.4
20.7
21.2
30.0
39.0
0
5
10
15
20
25
30
35
40
45
General Birchmount TSH General Target Birchmount Target
Page 3
Performance Measurement Summary
Action Plan
Recruit Physician Assistants (PA) to "extend" the ED physician capacity and reduce treat and release wait times
S. Engels, Dr. N. Chu Nov-14 Three new PAs joined ED in November 2014 with the fourth and final recruit joining in January 2015. The impact of this addition will be measured on key performance indicators beginning in January 2015.
Current Status
Definition90th percentile length of stay in hours for non-admitted patients triaged at CTAS 1, 2 or 3 at General Campus Emergency Department, measured from registration to leaving General Campus Emergency Department.
CHART PLACEHOLDER
SignificanceThis is to meet Pay-for-Results expectations. There could be funding impact if targets are not met.
Fishbone root cause analysis complete. Survey of physicians pending.
Investigate physician reassessment times and determine root cause S. Marroquin Sep-14
SMART Initiative (Specific, Measureable, Attainable, Realistic, Time-Bound) Lead Date Initiated
AnalysisTSH is achieving consistent results well below the CELHIN HSAA target of 6.33 hours (with exception of December 2014) and we continue to strive towards our very aggressive internal target of 5.6 hours.
The Scarborough HospitalCorporate Balanced Scorecard
Indicator 90th percentile ED LOS for CTAS 1, 2 or 3 non-admitted patients
RStrategic Direction Our PatientsTime Frame December 2014Source NACRSIndicator Lead M. Fryers
5.4 5.6
5.4 5.5
5.3 5.
7
5.7
5.7
6.3 6.3
5.7 5.9 6.1
6.1
5.7 5.8 6.1
6.1 6.2
6.1
6.8
5.3
5.2
5.1
5.0
5.5
5.0 5.1
4.9 5.
3
5.3
5.0
5.4
5.4
5.1
4.9
4.7 4.9 5.0 5.2
5.2 5.
6
5.3 5.5
5.3 5.3 5.4 5.4
5.4
5.4
5.9
5.9
5.4 5.7 5.8
5.7
5.5
5.5 5.6
5.6 5.9
5.8
6.4
0
1
2
3
4
5
6
7
8
General Birchmount TSH General Target Birchmount Target
Page 4
Conduct holiday surge review ED Managers Jan-15 Review of operational performance completed and presented to Clinical Operations leads. Separate review with focus on quality of care and professional risk completed and will be tabled at March 2015 meeting of the Quality of Care Committee.
Page 4
Performance Measurement Summary
Action Plan
Definition90th percentile length of stay in hours for non-admitted patients triaged at CTAS 4 or 5 at General Campus Emergency Department, measured from registration to leaving General Campus Emergency Department.
Current Status
CHART PLACEHOLDER
SignificanceThis is to meet Pay-for-Results expectations. There could be funding impact if targets are not met.
TargetCELHIN Target (HSAA) - 4.0
SMART Initiative (Specific, Measureable, Attainable, Realistic, Time-Bound) Lead Date Initiated
AnalysisEmergency Department has an internal target that is much more aggressive. There has been a sustained unanticipated increase in volumes at the General ED with the additional patients flowing through the Rapid Assessment Zone (RAZ). The ED experience 4,200 new visits this year and managed this volume within existing resources. If growth continues, the impact on financial performance may be substantive.
The Scarborough HospitalCorporate Balanced Scorecard
Indicator 90th percentile ED LOS for CTAS 4 or 5 non-admitted patients
RStrategic Direction Our PatientsTime Frame December 2014Source NACRSIndicator Lead M. Fryers
Fishbone root cause analysis complete. Survey of physicians pending.
S. Marroquin Investigate physician reassessment times and determine root cause Sep-14
Recruit Physician Assistants (PA) to "extend" the ED physician capacity and reduce treat and release wait times
S. Engels, Dr. N. Chu Nov-14 Three new PAs joined ED in November 2014 with the fourth and final recruit joining in January 2015. The impact of this addition will be measured on key performance indicators beginning in January 2015.
3.9 3.9
3.7 3.9
3.7 3.8 3.8
3.7
4.2
4.2
3.9
3.9
3.7
3.7
3.7 3.7 3.8 3.9 4.0
4.3
4.7
3.5
3.3 3.4
3.2
3.5
3.3
3.3
3.3 3.
5
3.4
3.3 3.4
3.4
3.7
3.3
3.2 3.4
3.3
3.4
3.2
3.9
3.7
3.7
3.6 3.6
3.6
3.6
3.6
3.5
3.9
3.9
3.7
3.6
3.5 3.
7
3.5
3.5 3.6
3.7 3.8 3.9
4.3
0.0
0.5
1.0
1.5
2.0
2.5
3.0
3.5
4.0
4.5
5.0
General Birchmount TSH Target
Page 5
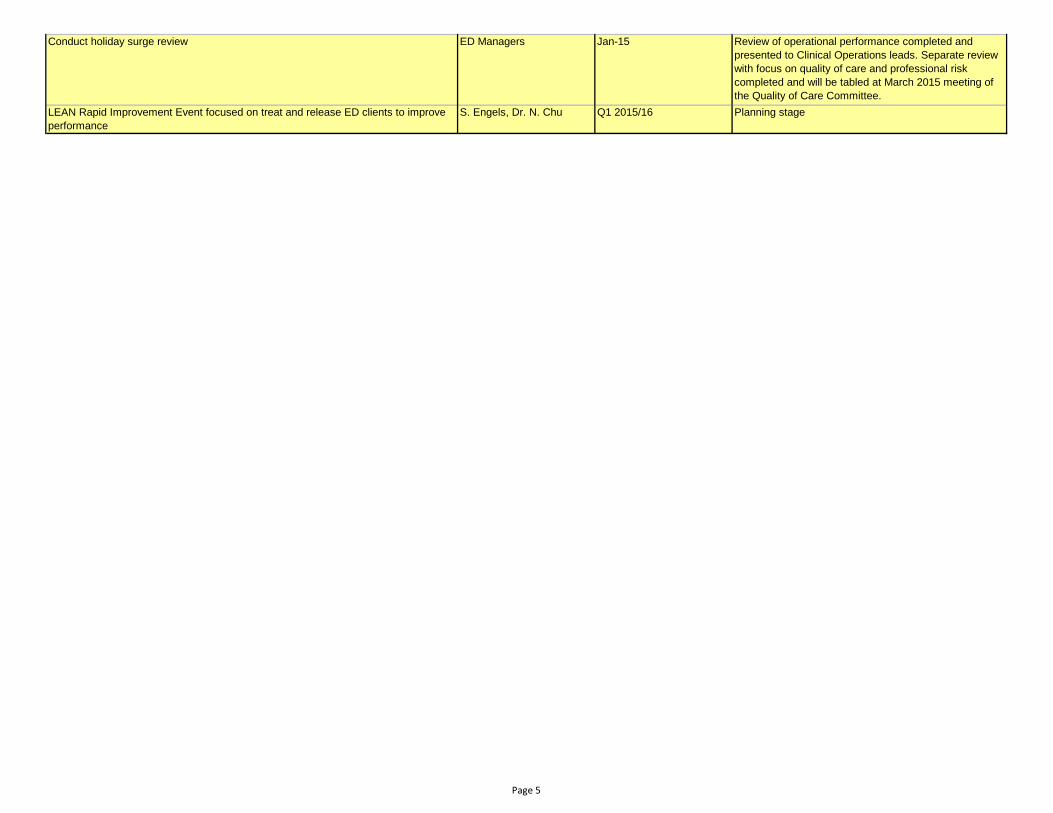
Conduct holiday surge review ED Managers Jan-15 Review of operational performance completed and presented to Clinical Operations leads. Separate review with focus on quality of care and professional risk completed and will be tabled at March 2015 meeting of the Quality of Care Committee.
LEAN Rapid Improvement Event focused on treat and release ED clients to improve performance
S. Engels, Dr. N. Chu Q1 2015/16 Planning stage
Page 5
Before R
Performance Measurement Summary
Action PlanDate Initiated Current StatusSMART Initiative (Specific, Measureable, Attainable, Realistic, Time-Bound) Lead
Encourage Directors to continue the effort in increasing the number of opportunities for hand hygiene
OngoingNov-13Infection Control & Prevention
GIndicator Lead M. FryersSource Surveillance and Case Finding After
CHART PLACEHOLDER
Definition Overall rate of hospital for point of care for hand hygiene. Percentage of compliance for "Before initial patient/patient enviroment contact" and "After initial patient/patient enviroment contact" opportunities for the transmission of organisms on hands that can cause infections.
SignificanceProper hand hygiene protects patients and providers and will reduce the spread of infections and the associated treatment costs, reduce hospital lengths of stay and readmissions, reduce wait times, and prevent deaths.
Target.TSH Target - 90% Before and 90% After.Ontario Average - 80.52% Before and 88.23% After.
AnalysisPublicly posted QIP uses January to December 2014 rate, only for before patient contact. A new hand hygiene product has been chosen and was implemented in August. This is the first time in 12 years. Staff input on product placement was a focus of implementation.
Strategic Direction Our Patients
The Scarborough HospitalCorporate Balanced Scorecard
Indicator QIP - Rate of hand hygiene compliance before initial patient/patient environment contact / Rate of hand hygiene compliance after patient/patient environment contact
Time Frame Q3 2014/15
Engage areas of low compliance in terms of Health Care Provider categories Jul-14 Ongoing
Implement new hand hygiene product chosen by staff. The new product will be installed at high risk areas. TSH is moving to automatic dispensers in high risk areas.
Infection Control & PreventionInfection Control & Prevention
Action PlanCurrent StatusSMART Initiative (Specific, Measureable, Attainable, Realistic, Time-Bound) Lead
The Birchmount Campus ICU was closed in December 2014 due to an outbreak of C. difficile associated diarrhea. When outbreak measures were implemented, the outbreak quickly resolved.
Scheduled an A3 on C. difficile associated diarrhea prevention and management PlanningV. Nankoosingh Apr-15Date Initiated
Definition Overall rate of hospital acquired C. difficile associated diarrhea. Rate is based on total number of patients with confirmed infection per 1,000 patient days.
CHART PLACEHOLDER
SignificanceC. difficile rates are monitored in order to identify and implement infection control measures to prevent nosocomial spread. While C. difficile does not usually present a big problem for reasonably healthy adults, it can be quite serious for those who are frail or have other health challenges. C. difficile is communicable. It can live in the environment and on other surfaces for months. Rigorous cleaning regimes, patient isolation and hand washing are some of the strategies used to combat C. difficile.
Strategic DirectionTime FrameSource
Y
Rate of Hospital Acquired C. difficile Associated Diarrhea (CDI)Our PatientsDecember 2014Surveillance and Case FindingM. Fryers
Analysis
TargetCELHIN Target (HSAA) - General 0.31 and Birchmount 0.49
The Scarborough HospitalCorporate Balanced Scorecard
Indicator
Indicator Lead
0.53
, n=7,568
0.49
, n=8,121
0.80
, n=7,465
0.53
, n=7,528 0.
81, n=7,410 1.
20, n=7,516
0.78
, n=7,689
0.13
, n=7,869
0.52
, n=7,728
0.48
, n=8,301
0.55
, n=7,226
0.24
, n=8,274
0.38
, n=7,882
1.02
, n=7,841
0.41
, n=7,317
0.00
, n=7,569
0.41
, n=7,339
0.28
, n=7,193
0.65
, n=7,736
0.62
, n=8,111
0.12
, n=8,379
1.19
, n=5,869
0.35
, n=5,690
0.18
, n=5,663
0.34
, n=5,939
0.68
, n=5,914
0.33
, n=6,031
0.00
, n=6,066
0.34
, n=5,874
0.16
, n=6,215
0.00
, n=6,470
0.18
, n=5,576
0.17
, n=5,974
0.17
, n=5,796
0.86
, n=5,791
0.77
, n=5,194
0.53
, n=5,691
0.53
, n=5,691
0.18
, n=5,468
0.00
, n=5,670
0.18
, n=5,488
0.67
, n=5,989
0.82
, n=13,43
7
0.43
, n=13,81
1
0.53
, n=13,12
8
0.45
, n=13,46
7 0.75
, n=13,32
4
0.81
, n=13,54
7
0.44
, n=13,75
5
0.22
, n=13,74
3
0.36
, n=13,94
3
0.27
, n=14,77
1
0.39
, n=12,80
2
0.21
, n=14,24
8
0.29
, n=13,67
8
0.95
, n=13,63
2
0.56
, n=12,51
1
0.23
, n=13,26
0
0.46
, n=13,03
0
0.24
, n=12,66
1
0.37
, n=13,40
6
0.44
, n=13,59
9
0.35
, n=14,36
8
‐
0.20
0.40
0.60
0.80
1.00
1.20
1.40
General Birchmount TSH General Target Birchmount Target
Page 7
Performance Measurement Summary
Action Plan
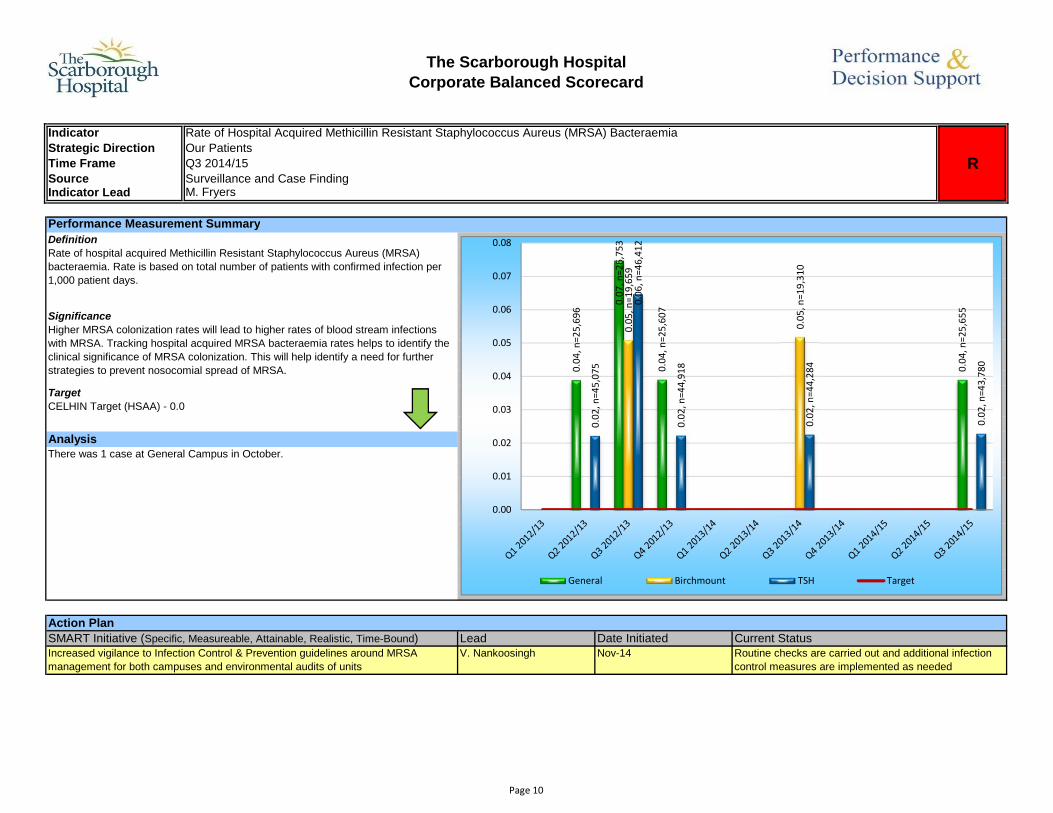
AnalysisThere was 1 case at General Campus in October.
The Scarborough HospitalCorporate Balanced Scorecard
Indicator
Indicator Lead
Time FrameStrategic Direction
SourceM. Fryers
R
Rate of Hospital Acquired Methicillin Resistant Staphylococcus Aureus (MRSA) Bacteraemia Our PatientsQ3 2014/15Surveillance and Case Finding
SMART Initiative (Specific, Measureable, Attainable, Realistic, Time-Bound) Increased vigilance to Infection Control & Prevention guidelines around MRSA management for both campuses and environmental audits of units
V. Nankoosingh Nov-14 Routine checks are carried out and additional infection control measures are implemented as needed
Definition Rate of hospital acquired Methicillin Resistant Staphylococcus Aureus (MRSA) bacteraemia. Rate is based on total number of patients with confirmed infection per 1,000 patient days.
CHART PLACEHOLDER
TargetCELHIN Target (HSAA) - 0.0
Lead
SignificanceHigher MRSA colonization rates will lead to higher rates of blood stream infections with MRSA. Tracking hospital acquired MRSA bacteraemia rates helps to identify the clinical significance of MRSA colonization. This will help identify a need for further strategies to prevent nosocomial spread of MRSA.
Current StatusDate Initiated
0.04
, n=25,69
6
0.07
, n=26,75
3
0.04
, n=25,60
7
0.04
, n=25,65
5
0.05
, n=19,65
9
0.05
, n=19,31
0
0.02
, n=45,07
5
0.06
, n=46,41
2
0.02
, n=44,91
8
0.02
, n=44,28
4
0.02
, n=43,78
0
0.00
0.01
0.02
0.03
0.04
0.05
0.06
0.07
0.08
General Birchmount TSH Target
Page 10
Performance Measurement Summary
Action Plan
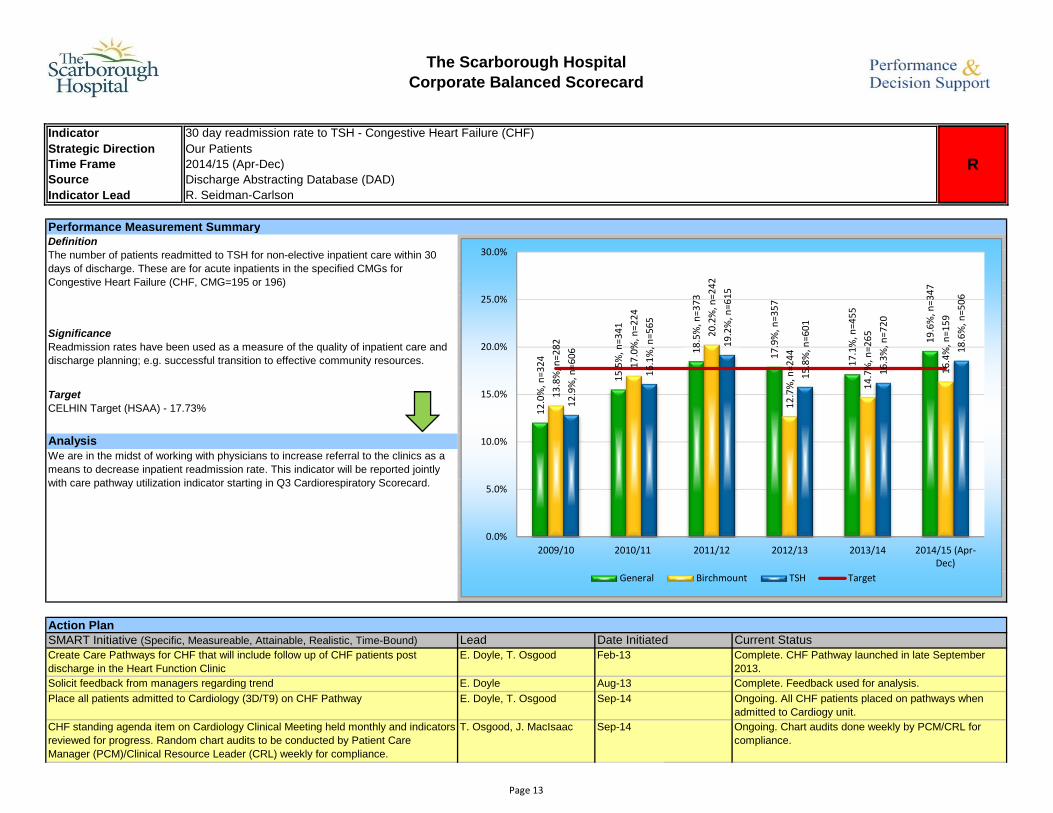
T. Osgood, J. MacIsaac Sep-14 Ongoing. Chart audits done weekly by PCM/CRL for compliance.
Place all patients admitted to Cardiology (3D/T9) on CHF Pathway E. Doyle, T. Osgood Sep-14 Ongoing. All CHF patients placed on pathways when admitted to Cardiogy unit.
CHART PLACEHOLDER
Solicit feedback from managers regarding trend E. Doyle Aug-13 Complete. Feedback used for analysis.
Create Care Pathways for CHF that will include follow up of CHF patients post discharge in the Heart Function Clinic
E. Doyle, T. Osgood Feb-13 Complete. CHF Pathway launched in late September 2013.
SignificanceReadmission rates have been used as a measure of the quality of inpatient care and discharge planning; e.g. successful transition to effective community resources.
TargetCELHIN Target (HSAA) - 17.73%
Current Status
DefinitionThe number of patients readmitted to TSH for non-elective inpatient care within 30 days of discharge. These are for acute inpatients in the specified CMGs for Congestive Heart Failure (CHF, CMG=195 or 196)
CHF standing agenda item on Cardiology Clinical Meeting held monthly and indicators reviewed for progress. Random chart audits to be conducted by Patient Care Manager (PCM)/Clinical Resource Leader (CRL) weekly for compliance.
The Scarborough HospitalCorporate Balanced Scorecard
Time Frame 2014/15 (Apr-Dec)
Indicator 30 day readmission rate to TSH - Congestive Heart Failure (CHF)
RStrategic Direction Our Patients
Source Discharge Abstracting Database (DAD)Indicator Lead R. Seidman-Carlson
AnalysisWe are in the midst of working with physicians to increase referral to the clinics as a means to decrease inpatient readmission rate. This indicator will be reported jointly with care pathway utilization indicator starting in Q3 Cardiorespiratory Scorecard.
SMART Initiative (Specific, Measureable, Attainable, Realistic, Time-Bound) Lead Date Initiated
Weekly CHF discussions during huddles and bullet rounds E. Doyle, T. Osgood Sep-14 Ongoing. CHF discussions ongoing and communication provided to staff during bullet rounds, huddles and staff meetings.
Review CHF handbook for Clinical Indicators (daily weights, Dietician Consult, Pharmacy consult, Referral to Heart Function Clinic [General Campus only])
T. Osgood, J. MacIsaac Jan-15 In progress. CHF Clinical indicators measured weekly for compliance and progress.
Page 13
Performance Measurement Summary
Action Plan
Review Human Resources indicators on a monthly basis K. Dobbie Apr-14 OngoingConduct holiday surge review ED Managers Jan-15
The Scarborough HospitalCorporate Balanced Scorecard
Findings shared with staff
CHART PLACEHOLDER
DefinitionThe indicator measures sick days per full time employee over a full year. Sick hours is divided by 7.5 to convert to sick days which is divided by full time headcount to calculate sick days per full time employee in a quarter. This is multiplied by 4 to annualized the rate.
Enforce Attendance Management Program
SignificanceIndicator provides insight to any financial strain. The quarterly data provide a trend of sick time performance over a period of time.
TargetTSH Target - 10.5, OHA average.
SMART Initiative (Specific, Measureable, Attainable, Realistic, Time-Bound) LeadOngoingCurrent Status
Indicator Sick Days per Full Time Employee (Annualized)
RStrategic Direction
Finance
Our PeopleTime Frame Q3 2014/15
Indicator Lead R. LewisSource
Date Initiated
AnalysisAlthough the rate was slightly above the OHA average, the sick days per employee shows a general downward trend since 2010/11. The holiday surge impacted certain areas such as Emergency Department in Q3 2014/15. Specific action plans are being developed between the PSGs and their Human Resources Business Partner to increase the monitoring of individual staff performance. Human Resources is implementing additional supports for staff i.e. educational sessions and wellness initiatives.
Apr-14Patient Care Managers
13.2
13.2 14
.0
11.8
11.3 12
.4
11.2
10.1
9.6
11.1
10.4
9.3
9.1 9.
8
12.4
11.0
10.5 11
.6
0
2
4
6
8
10
12
14
16
TSH Target
Page 19
Performance Measurement Summary
Action PlanDate Initiated Current Status
Source Cancer Care Ontario (CCO) - Access To Care (ATC)Indicator Lead M. Fryers
DefinitionAlternative Level of Care (ALC) Throughput Ratio calculation is based on the number of ALC patients discharged in a given time period divided by the number of ALC patients designated in a given time period. Throughput ratio above 1 indicates reduction in number of ALC patients.
CHART PLACEHOLDER
SignificanceThis indicator identifies barriers to alternative placement and monitor the prevalence of conditions treated with Alternate Level of Care (ALC) status.
TargetCELHIN Target (HSAA) - 1.1
AnalysisPublicly posted QIP uses January to December 2014 data. Root cause analysis revealed increasing limitations in Long Term Care (LTC) capacity, patient/family expectations on waiting in hospital for LTC placement and application process gaps. Further analysis has identified particular patient populations (i.e. surgical and mental health patients) that are experiencing greater challenges in discharge to LTC facilities. Closure of several nursing homes to admissions due to infection control reasons reduced the number of ALC discharges in December 2014.
The Scarborough HospitalCorporate Balanced Scorecard
Indicator QIP - ALC Throughput Ratio
RStrategic Direction Our Programs, Plans, and PartnersTime Frame Dec 2014
SMART Initiative (Specific, Measureable, Attainable, Realistic, Time-Bound) LeadStrengthen transitions to ambulatory services (i.e. COPD clinic, stroke clinic, Geriatric Assessment and Intervention Network clinic,…) to optimize the transition of patients to return home upon discharge and divert ALC
N. Veloso, L. Kane, A. Sideris
Sep-14 Ongoing
Initiate ALC rehab rounds in collaboration with external rehab facilities to identify patients for timely transfers in care
N. Veloso, N. Rahim Jan-15 In progress
Collaboration with ED, Community Care Access Centre (CCAC) and Medicine to divert admission for patients identified as failure to cope at home and are requiring LTC placement
Explore partnerships with long term care facilities to transition patients to vacant beds N. Veloso Feb-15 Planning
Expand partnerships in the community to support palliative patients to return home for care in alignment with CELHIN priority goals (ie Scarborough Centre for Healthy Communities partnership with Palliative Care Community Team PCCT)
S. Johnson, L. Krinsky, G. Brookes-DosSantos
Jan-15 Planning
Expand Assess and Restore program as an integrated care model with community partners to provide reactivation services for patients upon discharge
N. Veloso, T. Bowers Feb-15 Planning
Explore transition pathways to enhance flow to convalescent care program for orthopaedic patient groups
N. Veloso, N. Rahim Feb-15 In progress
Cohort stroke patients to stroke unit at the General Campus to optimize specialized care and flow within QBP guidelines to enhance discharges to rehab in collaboration with Providence Healthcare.
M. DePaulsen Jan-15 Ongoing
Explore further cohorting ALC patients together to enhance care coordination and focused alternate discharge planning
N. Veloso Mar-15 Planning
Initiate Resource Matching and Referral (RMR) system to support timely transfer of information and flow of patients to rehab and complex continuing care beds.
N. Veloso, J. Miller Mar-15 Planning
Page 20
Performance Measurement Summary
Action Plan
Initiate ALC rehab rounds in collaboration with external rehab facilities to identify patients for timely transfers in care
N. Veloso, N. Rahim Jan-15 In progress
Ongoing
Collaboration with ED, Community Care Access Centre (CCAC) and Medicine to divert admission for patients identified as failure to cope at home and are requiring LTC placement
N. Veloso, S. Engels Nov-14 Ongoing
SMART Initiative (Specific, Measureable, Attainable, Realistic, Time-Bound) Lead Date InitiatedStrengthen transitions to ambulatory services (i.e. COPD clinic, stroke clinic, Geriatric Assessment and Intervention Network clinic,…) to optimize the transition of patients to return home upon discharge and divert ALC
N. Veloso, L. Kane, A. Sideris
Sep-14
Health Records - DADIndicator Lead M. Fryers
DefinitionThe percentage of patient days awaiting alternative care in acute bed, excluding newborns.
CHART PLACEHOLDER
SignificanceThis indicator identifies barriers to alternative placement and monitor the prevalence of conditions treated with Alternate Level of Care (ALC) status.
TargetCELHIN Target (HSAA) - General Campus 11.1% and Birchmount Campus 11.3%
AnalysisRoot cause analysis revealed increasing limitations in Long Term Care (LTC) capacity, patient/family expectations on waiting in hospital for LTC placement and application process gaps. Further analysis has identified particular patient populations (i.e. surgical and mental health patients) that are experiencing greater challenges in discharge to LTC facilities. Closure of several nursing homes to admissions due to infection control reasons reduced the number of ALC discharges in December 2014.
The Scarborough HospitalCorporate Balanced Scorecard
Indicator Percentage Alternate Level of Care (ALC) Days
RStrategic Direction Our Programs, Plans, and PartnersTime Frame Q3 2014/15
Current Status
Source
15.0%
13.6%
12.3%
15.8%
12.5%
10.9%
15.0%
9.9%
9.5% 10
.1%
12.9%
12.2%
12.7%
12.1% 13.1%
16.8%
14.5%
13.0%
16.4%
0%
2%
4%
6%
8%
10%
12%
14%
16%
18%
ALC% Target
Page 21
Cohort stroke patients to stroke unit at the General Campus to optimize specialized care and flow within QBP guidelines to enhance discharges to rehab in collaboration with Providence Healthcare.
M. DePaulsen Jan-15 Ongoing
N. Veloso, N. Rahim In progressExplore transition pathways to enhance flow to convalescent care program for orthopaedic patient groups
Feb-15
Expand Assess and Restore program as an integrated care model with community partners to provide reactivation services for patients upon discharge
N. Veloso, T. Bowers Feb-15 Planning
Expand partnerships in the community to support palliative patients to return home for care in alignment with CELHIN priority goals (ie Scarborough Centre for Healthy Communities partnership with Palliative Care Community Team PCCT)
S. Johnson, L. Krinsky, G. Brookes-DosSantos
Jan-15 Planning
Explore partnerships with long term care facilities to transition patients to vacant beds N. Veloso Feb-15 PlanningExplore further cohorting ALC patients together to enhance care coordination and focused alternate discharge planning
N. Veloso Mar-15 Planning
Initiate Resource Matching and Referral (RMR) system to support timely transfer of information and flow of patients to rehab and complex continuing care beds.