150
TSQ 8000 Evo Mass Spectrometer User Guide 1R120586-0002 Revision C December 2015

TSQ 8000 EvoMass Spectrometer
User Guide
1R120586-0002 Revision C December 2015

© 2015 Thermo Fisher Scientific Inc. All rights reserved.
TSQ, TRACE 1300, TRACE 1310, TriPlus, and TraceFinder are trademarks, and Xcalibur is a registered trademark of Thermo Fisher Scientific in the United States.
The following are registered trademarks in the United States and other countries: Microsoft, Windows, and Excel are registered trademarks of Microsoft. Adobe and Acrobat are registered trademarks of Adobe Systems Incorporated. SilTite is a registered trademark of SGE Analytical Science in the United States. McAfee is a registered trademark of McAfee, Inc. in the United States and other countries. Vespel is a registered trademark of E.I. du Pont de Nemours and Company in the United States and other countries.
Thermo Fisher Scientific Inc. provides this document to its customers with a product purchase to use in the product operation. This document is copyright protected and any reproduction of the whole or any part of this document is strictly prohibited, except with the written authorization of Thermo Fisher Scientific Inc.
The contents of this document are subject to change without notice. All technical information in this document is for reference purposes only. System configurations and specifications in this document supersede all previous information received by the purchaser.
This document is not part of any sales contract between Thermo Fisher Scientific Inc. and a purchaser. This document shall in no way govern or modify any Terms and Conditions of Sale, which Terms and Conditions of Sale shall govern all conflicting information between the two documents.
Release history: Revision A, July 2014; Revision B, February 2015; Revision C, December 2015.
Software version: Thermo Foundation 3.1 SP1, Xcalibur 4.0 or later
For Research Use Only. Not for use in diagnostic procedures.

Thermo Scientific TSQ 8000 Evo User Guide iii
C
Preface . . . . . . . . . . . . . . . . . . . . . . . . . . . . . . . . . . . . . . . . . . . . . . . . . . . . . . . . . . . . . . ixAbout Your System. . . . . . . . . . . . . . . . . . . . . . . . . . . . . . . . . . . . . . . . . . . . . . .ixRelated Documentation . . . . . . . . . . . . . . . . . . . . . . . . . . . . . . . . . . . . . . . . . . . xSystem Requirements . . . . . . . . . . . . . . . . . . . . . . . . . . . . . . . . . . . . . . . . . . . . .xiSafety and Special Notices . . . . . . . . . . . . . . . . . . . . . . . . . . . . . . . . . . . . . . . . .xi
Special Notices . . . . . . . . . . . . . . . . . . . . . . . . . . . . . . . . . . . . . . . . . . . . . . . .xiSafety Symbols and Signal Words . . . . . . . . . . . . . . . . . . . . . . . . . . . . . . . . . .xi
Hydrogen Safety Precautions . . . . . . . . . . . . . . . . . . . . . . . . . . . . . . . . . . . . . .xiiiUsing Hydrogen with a GC-MS/MS System. . . . . . . . . . . . . . . . . . . . . . . . .xivHydrogen Connection Guidelines . . . . . . . . . . . . . . . . . . . . . . . . . . . . . . . . . xvPurchasing Hydrogen . . . . . . . . . . . . . . . . . . . . . . . . . . . . . . . . . . . . . . . . . .xviProperly Storing Hydrogen . . . . . . . . . . . . . . . . . . . . . . . . . . . . . . . . . . . . . xviiHydrogen Safety Codes, Standards and References . . . . . . . . . . . . . . . . . . . .xix
Hazardous Substances Precautions . . . . . . . . . . . . . . . . . . . . . . . . . . . . . . . . . . xxBiological Hazard Warning Note. . . . . . . . . . . . . . . . . . . . . . . . . . . . . . . . . . xxVenting Toxic Gases . . . . . . . . . . . . . . . . . . . . . . . . . . . . . . . . . . . . . . . . . . .xxi
Contacting Us . . . . . . . . . . . . . . . . . . . . . . . . . . . . . . . . . . . . . . . . . . . . . . . . .xxi
Chapter 1 Introduction . . . . . . . . . . . . . . . . . . . . . . . . . . . . . . . . . . . . . . . . . . . . . . . . . . . . . . . . . . .1Confirming Your Instrument is Working . . . . . . . . . . . . . . . . . . . . . . . . . . . . . . 1
Checking Power to the System . . . . . . . . . . . . . . . . . . . . . . . . . . . . . . . . . . . . 1Verifying the Carrier Gas Flow Rate . . . . . . . . . . . . . . . . . . . . . . . . . . . . . . . . 2Checking Your Carrier Gas Tank Pressure. . . . . . . . . . . . . . . . . . . . . . . . . . . . 4Verify Collision Gas Tank Pressure . . . . . . . . . . . . . . . . . . . . . . . . . . . . . . . . . 4Checking the Vacuum and Temperature . . . . . . . . . . . . . . . . . . . . . . . . . . . . . 4
Cleaning the Exterior of Your Instrument . . . . . . . . . . . . . . . . . . . . . . . . . . . . . . 6Configuring Your Instrument . . . . . . . . . . . . . . . . . . . . . . . . . . . . . . . . . . . . . . . 6
Chapter 2 Changing the Column . . . . . . . . . . . . . . . . . . . . . . . . . . . . . . . . . . . . . . . . . . . . . . . . . .15Determining the Column Type. . . . . . . . . . . . . . . . . . . . . . . . . . . . . . . . . . . . . 15Replacing the Factory Installed Column . . . . . . . . . . . . . . . . . . . . . . . . . . . . . . 16Connecting the Column to the Transfer Line . . . . . . . . . . . . . . . . . . . . . . . . . . 21
Chapter 3 Tuning . . . . . . . . . . . . . . . . . . . . . . . . . . . . . . . . . . . . . . . . . . . . . . . . . . . . . . . . . . . . . . .31Accessing Auto Tune . . . . . . . . . . . . . . . . . . . . . . . . . . . . . . . . . . . . . . . . . . . . . 31
Contents

Contents
iv TSQ 8000 Evo User Guide Thermo Scientific
Tuning the Mass Spectrometer . . . . . . . . . . . . . . . . . . . . . . . . . . . . . . . . . . . . . 32Updating Tunes for New RF Lens. . . . . . . . . . . . . . . . . . . . . . . . . . . . . . . . . . . 40
Chapter 4 Creating a Method. . . . . . . . . . . . . . . . . . . . . . . . . . . . . . . . . . . . . . . . . . . . . . . . . . . . .45Accessing the Method Editor. . . . . . . . . . . . . . . . . . . . . . . . . . . . . . . . . . . . . . . 45Creating an Autosampler Method . . . . . . . . . . . . . . . . . . . . . . . . . . . . . . . . . . . 47Creating a MS Instrument Method . . . . . . . . . . . . . . . . . . . . . . . . . . . . . . . . . . 50 . . . . . . . . . . . . . . . . . . . . . . . . . . . . . . . . . . . . . . . . . . . . . . . . . . . . . . . . . . . . . 75Creating a GC Method . . . . . . . . . . . . . . . . . . . . . . . . . . . . . . . . . . . . . . . . . . . 78Validating and Troubleshooting Methods . . . . . . . . . . . . . . . . . . . . . . . . . . . . . 85
Chapter 5 Optimizing Your Method . . . . . . . . . . . . . . . . . . . . . . . . . . . . . . . . . . . . . . . . . . . . . . .89Changing the Chromatographic Separation. . . . . . . . . . . . . . . . . . . . . . . . . . . . 89Finding the Best Way to Make an Injection . . . . . . . . . . . . . . . . . . . . . . . . . . . 90Improving the Way You Prepare Samples . . . . . . . . . . . . . . . . . . . . . . . . . . . . . 90Changing the Dwell Time or Scan Rate . . . . . . . . . . . . . . . . . . . . . . . . . . . . . . 90Narrowing the Mass Range . . . . . . . . . . . . . . . . . . . . . . . . . . . . . . . . . . . . . . . . 91Adjusting the Transfer Line and Ion Source Temperature . . . . . . . . . . . . . . . . . 91Optimizing an SRM Method . . . . . . . . . . . . . . . . . . . . . . . . . . . . . . . . . . . . . . 92Optimizing an NCI Tune . . . . . . . . . . . . . . . . . . . . . . . . . . . . . . . . . . . . . . . . . 92Modifying an Automatic Tune . . . . . . . . . . . . . . . . . . . . . . . . . . . . . . . . . . . . . 96
Chapter 6 Computer Settings. . . . . . . . . . . . . . . . . . . . . . . . . . . . . . . . . . . . . . . . . . . . . . . . . . . .111System Requirements . . . . . . . . . . . . . . . . . . . . . . . . . . . . . . . . . . . . . . . . . . . 111Computer Settings . . . . . . . . . . . . . . . . . . . . . . . . . . . . . . . . . . . . . . . . . . . . . 111Excluding the Xcalibur Directory from Virus Scan . . . . . . . . . . . . . . . . . . . . . 114
Chapter 7 Troubleshooting. . . . . . . . . . . . . . . . . . . . . . . . . . . . . . . . . . . . . . . . . . . . . . . . . . . . . .115Diagnostics Checks . . . . . . . . . . . . . . . . . . . . . . . . . . . . . . . . . . . . . . . . . . . . . 116How to Know When Your System Needs Maintenance . . . . . . . . . . . . . . . . . 117Investigating Baseline Issues . . . . . . . . . . . . . . . . . . . . . . . . . . . . . . . . . . . . . . 119Investigating Peak Issues . . . . . . . . . . . . . . . . . . . . . . . . . . . . . . . . . . . . . . . . . 121Investigating Results Issues . . . . . . . . . . . . . . . . . . . . . . . . . . . . . . . . . . . . . . . 124
Index . . . . . . . . . . . . . . . . . . . . . . . . . . . . . . . . . . . . . . . . . . . . . . . . . . . . . . . . . . . . . . .127

DeclarationManufacturer: Thermo Fisher Scientific
Thermo Fisher Scientific is the manufacturer of the instrument described in this manual and, as such, is responsible for the instrument safety, reliability and performance only if:
• installation,
• recalibration, and
• changes and repairs
have been carried out by authorized personnel and if:
• the local installation complies with local law regulations,
• the instrument is used according to the instructions provided, and
• if its operation is only entrusted to qualified trained personnel.
Thermo Fisher Scientific is not liable for any damages derived from the non-compliance with the aforementioned recommendations.
Regulatory ComplianceThermo Fisher Scientific performs complete testing and evaluation of its products to ensure full compliance with applicable domestic and international regulations. When the system is delivered to you, it meets all pertinent electromagnetic compatibility (EMC) and safety standards as described in the next section or sections by product name.
Changes that you make to your system may void compliance with one or more of these EMC and safety standards. Changes to your system include replacing a part or adding components, options, or peripherals not specifically authorized and qualified by Thermo Fisher Scientific. To ensure continued compliance with EMC and safety standards, replacement parts and additional components, options, and peripherals must be ordered from Thermo Fisher Scientific or one of its authorized representatives.
EMC and Safety Standards• ITQ, and Ion Trap Series standards: EMC: EN 61326-1:2006. Safety: IEC 61010-1:2001, IEC 61010-2-081:2001
• Direct Probe Controller (DPC) standards: EMC: EN 61326-1:2013. Safety: IEC 61010-1:2001, IEC 61010-2-081:2001
• ISQ Series standards: EMC: EN 61326-1:2013. Safety: IEC 61010-1:2010 (ed. 3); IEC 61010-2-081:2015 (ed. 2); IEC 61010-2-010:2014 (ed. 3); IECEE CB SCHEME CERT NO. DE 3-30000
• TSQ 8000 Evo and TSQ Duo standards: EMC: EN 61326-1:2013. Safety: IEC 61010-1:2010 (ed. 3); IEC 61010-2-081:2015 (ed. 2); IEC 61010-2-010:2014 (ed. 3); IECEE CB SCHEME CERT NO. DE 3-30034

Low Voltage Safety ComplianceThis device complies with Low Voltage Directive 2011/95/EC.
FCC Compliance Statement
Notice on Lifting and Handling ofThermo Scientific Instruments
For your safety, and in compliance with international regulations, the physical handling of this Thermo Fisher Scientific instrument requires a team effort to lift and/or move the instrument. This instrument is too heavy and/or bulky for one person alone to handle safely.
Notice on the Proper Use ofThermo Scientific Instruments
In compliance with international regulations: Use of this instrument in a manner not specified by Thermo Fisher Scientific could impair any protection provided by the instrument.
Notice on the Susceptibility to Electromagnetic Transmissions
Your instrument is designed to work in a controlled electromagnetic environment. Do not use radio frequency transmitters, such as mobile phones, in close proximity to the instrument.
THIS DEVICE COMPLIES WITH PART 15 OF THE FCC RULES. OPERATION IS SUBJECT TO THE FOLLOWING TWO CONDITIONS: (1) THIS DEVICE MAY NOT CAUSE HARMFUL INTERFERENCE, AND (2) THIS DEVICE MUST ACCEPT ANY INTERFERENCE RECEIVED, INCLUDING INTERFERENCE THAT MAY CAUSE UNDESIRED OPERATION.
CAUTION Read and understand the various precautionary notes, signs, and symbols contained inside this manual pertaining to the safe use and operation of this product before using the device.

For manufacturing location, see the label on the instrument.
WEEE ComplianceThis product is required to comply with the European Union’s Waste Electrical & Electronic Equipment (WEEE) Directive 2002/96/EC. It is marked with the following symbol:
Thermo Fisher Scientific has contracted with one or more recycling or disposal companies in each European Union (EU) Member State, and these companies should dispose of or recycle this product. See www.thermoscientific.com/rohsweee for further information on Thermo Fisher Scientific’s compliance with these Directives and the recyclers in your country.
WEEE KonformitätDieses Produkt muss die EU Waste Electrical & Electronic Equipment (WEEE) Richtlinie 2002/96/EC erfüllen. Das Produkt ist durch folgendes Symbol gekennzeichnet:
Thermo Fisher Scientific hat Vereinbarungen mit Verwertungs-/Entsorgungsfirmen in allen EU-Mitgliedsstaaten getroffen, damit dieses Produkt durch diese Firmen wiederverwertet oder entsorgt werden kann. Mehr Information über die Einhaltung dieser Anweisungen durch Thermo Fisher Scientific, über die Verwerter, und weitere Hinweise, die nützlich sind, um die Produkte zu identifizieren, die unter diese RoHS Anweisung fallen, finden sie unter www.thermoscientific.com/rohsweee.

Conformité DEEECe produit doit être conforme à la directive européenne (2002/96/EC) des Déchets d'Equipements Electriques et Electroniques (DEEE). Il est marqué par le symbole suivant:
Thermo Fisher Scientific s'est associé avec une ou plusieurs compagnies de recyclage dans chaque état membre de l’union européenne et ce produit devrait être collecté ou recyclé par celles-ci. Davantage d'informations sur la conformité de Thermo Fisher Scientific à ces directives, les recycleurs dans votre pays et les informations sur les produits Thermo Fisher Scientific qui peuvent aider la détection des substances sujettes à la directive RoHS sont disponibles sur www.thermoscientific.com/rohsweee.

Thermo Scientific TSQ 8000 Evo User Guide ix
P
Preface
This guide contains detailed information about how to use your Thermo Scientific TSQ 8000™ Evo triple-quadrupole GC/MS system. The TSQ 8000 Evo system provides the selectivity and sensitivity of a triple-quadrupole GC/MS while also functioning as a high-performance single quadrupole instrument. The system is designed to stay cleaner longer to maximize your instrument’s uptime and improve your lab’s productivity. The need to break vacuum, cool off your system, and spend hours cleaning, reassembling, and restoring the system is greatly reduced. The extractable source incorporates a cartridge that contains the repeller, source lenses, and RF lens, all of which can be removed from the instrument without breaking vacuum. What once took hours, or even an entire day, is now accomplished in minutes.
In addition, the TSQ 8000 Evo system includes innovative Thermo Scientific software that will help users new to triple-quadrupole GC/MS/MS systems develop selected reaction monitoring (SRM) methods.
About Your SystemThermo Scientific systems provide the highest caliber gas chromatography/mass spectrometry (GC/MS) instrumentation available on today’s market.
Contents
• About Your System
• Related Documentation
• System Requirements
• Safety and Special Notices
• Hydrogen Safety Precautions
• Hazardous Substances Precautions
• Contacting Us

PrefaceRelated Documentation
x TSQ 8000 Evo User Guide Thermo Scientific
GC/MS represents a combination of two powerful analytical techniques: GC, which acts as a separation technique, and MS, which acts as a detection technique. Complex mixtures of individual compounds can be injected into the GC, either manually or by an autosampler and then separated for presentation to the MS. The MS will generate a mass spectrum of the GC eluate and its components. The mass spectrum can then be used for qualitative identification as well as accurate and precise quantification of the individual compounds present in the sample.
A triple-quadrupole GC/MS/MS system provides the extra selectivity required for trace analysis of compounds in complex matrices.
Related DocumentationThe TSQ 8000 Evo system includes Help and these manuals as PDF files:
• TSQ 8000 Evo Preinstallation Guide, PN 1R120586-0001
• TSQ 8000 Evo User Guide, PN 1R120586-0002
• TSQ 8000 Evo Hardware Manual, PN 1R120586-0003
• TSQ 8000 Evo Spare Parts Guide, PN 1R120586-0004
• TSQ 8000 Evo Auto SRM User Guide, PN 1R120586-0005
• Q Exactive GC, ISQ Series and TSQ 8000 Evo Direct Probe System User Guide, PN 1R120505-0006
To view product manuals
Open the desktop folder Manuals.
To open Help
• From the TSQ Series window, choose Help > TSQ Series Help.
• If available for a specific window or dialog box, click Help or press the F1 key for information about setting parameters.
For more information, visit www.thermoscientific.com.
WARNING Thermo Scientific systems operate safely and reliably under carefully controlled environmental conditions. If the equipment is used in a manner not specified by the manufacturer, the protections provided by the equipment might be impaired. If you maintain a system outside the specifications listed in this guide, failures of many types, including personal injury or death, might occur. The repair of instrument failures caused by operation in a manner not specified by the manufacturer is specifically excluded from the standard warranty and service contract coverage.

PrefaceSystem Requirements
Thermo Scientific TSQ 8000 Evo User Guide xi
System RequirementsYour data system must meet these minimum requirements.
Safety and Special NoticesMake sure you follow the precautionary statements presented in this guide. The safety and other special notices appear in boxes.
Special Notices
Special notices include the following:
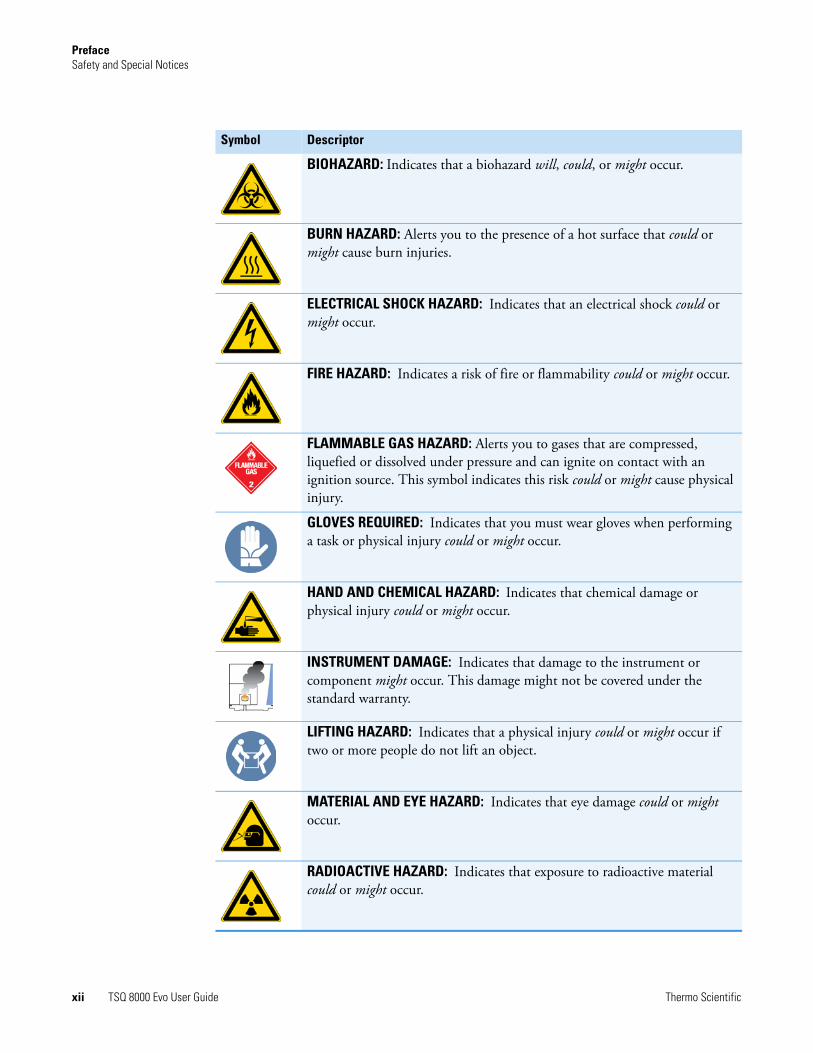
Safety Symbols and Signal Words
All safety symbols are followed by WARNING or CAUTION, which indicates the degree of risk for personal injury, instrument damage, or both. Cautions and warnings are following by a descriptor. A WARNING is intended to prevent improper actions that could cause personal injury. A CAUTION is intended to prevent improper actions that might cause personal injury or instrument damage. You can find the following safety symbols on your instrument or in this guide.
System Requirements
Hardware • 4.6 GHz processor with 16 GB RAM• CD/R-Rom or DVD drive• 1000 GB or hard drive• Video card and monitor capable of 1680 × 1050 resolution• Quad core processor
Software • Microsoft™ Windows™ 7 SP1 Operating System (64-bit)• Microsoft Office™ 2013• Thermo Foundation 3.1 SP1 (Thermo Scientific software)• Xcalibur™ 4.0
IMPORTANT Highlights information necessary to prevent damage to software, loss of data, or invalid test results; or might contain information that is critical for optimal performance of the system.
Note Highlights information of general interest.
Tip Highlights helpful information that can make a task easier.
PrefaceSafety and Special Notices
xii TSQ 8000 Evo User Guide Thermo Scientific
Symbol Descriptor
BIOHAZARD: Indicates that a biohazard will, could, or might occur.
BURN HAZARD: Alerts you to the presence of a hot surface that could or might cause burn injuries.
ELECTRICAL SHOCK HAZARD: Indicates that an electrical shock could or might occur.
FIRE HAZARD: Indicates a risk of fire or flammability could or might occur.
FLAMMABLE GAS HAZARD: Alerts you to gases that are compressed, liquefied or dissolved under pressure and can ignite on contact with an ignition source. This symbol indicates this risk could or might cause physical injury.
GLOVES REQUIRED: Indicates that you must wear gloves when performing a task or physical injury could or might occur.
HAND AND CHEMICAL HAZARD: Indicates that chemical damage or physical injury could or might occur.
INSTRUMENT DAMAGE: Indicates that damage to the instrument or component might occur. This damage might not be covered under the standard warranty.
LIFTING HAZARD: Indicates that a physical injury could or might occur if two or more people do not lift an object.
MATERIAL AND EYE HAZARD: Indicates that eye damage could or might occur.
RADIOACTIVE HAZARD: Indicates that exposure to radioactive material could or might occur.

PrefaceHydrogen Safety Precautions
Thermo Scientific TSQ 8000 Evo User Guide xiii
Hydrogen Safety PrecautionsHydrogen is a colorless, odorless, highly flammable gas with the molecular formula H2 and an atomic weight of 1.00794, making it the lightest element. Hydrogen gas presents a hazard as it is combustible over a wide range of concentrations: at ambient temperature and pressure, this ranges from about 4% to 74.2% by volume.
Hydrogen has a flash point of - 423 °F (- 253 °C) and an auto-ignition temperature of 1,040 °F (560 °C). It has a very low ignition energy and the highest burning velocity of any gas. If hydrogen is allowed to expand rapidly from high pressure, it can self-ignite. Hydrogen burns with a flame that can be invisible in bright light.
Before you begin using hydrogen, you should conduct a risk assessment based on the quantity of hydrogen to be used and the conditions of your laboratory. You should ask yourself:
“What hydrogen hazards associated with this project are most likely to occur?”
“What hydrogen hazards associated with this project have the potential to result in the worst consequences?”
• Try to reduce or eliminate the higher risks by using the proper ventilation to remove hydrogen gas before an ignitable concentration can accumulate. You should also consider purging the hydrogen to further reduce hazards and ensure anyone who will be working with hydrogen has basic hydrogen safety training.
READ MANUAL: Alerts you to carefully read your instrument’s documentation to ensure your safety and the instrument’s operational ability. Failing to carefully read the documentation could or might put you at risk for a physical injury.
TOXIC SUBSTANCES HAZARD: Indicates that exposure to a toxic substance could occur and that exposure could or might cause personal injury or death.
For the prevention of personal injury, this general warning symbol precedes the WARNING safety alert word and meets the ISO 3864-2 standard. In the vocabulary of ANSI Z535 signs, this symbol indicates a possible personal injury hazard exists if the instrument is improperly used or if unsafe actions occur. This symbol and another appropriate safety symbol alerts you to an imminent or potential hazard that could cause personal injury.
Symbol Descriptor
WARNING FIRE HAZARD: The use of hydrogen as a carrier gas is dangerous. Hydrogen is potentially explosive and must be used with extreme care. Any use of hydrogen gas must be reviewed by appropriate health and safety staff and all installations of hydrogen systems must be performed to applicable codes and standards. Thermo Fisher Scientific assumes no liability for the improper use of hydrogen as a carrier gas.
PrefaceHydrogen Safety Precautions
xiv TSQ 8000 Evo User Guide Thermo Scientific
• As with laboratory safety in general, be sure to wear safety glasses, laboratory coats, gloves, etc. Typically there are no specific requirements for gaseous hydrogen, other than eye protection when working with a compressed gas. If working with liquid (cryogenic) hydrogen, insulated gloves and protective shoes should be worn in addition to eye protection.
• You should post “No Smoking” and “No Open Flames” signs to identify hydrogen sources and cylinders. Maintain, inspect and leak-test all hydrogen sources regularly.
• All hydrogen shutoff valves should be clearly marked and permanent hydrogen piping should be labeled as such at the supply or discharge point and at regular intervals along its length. Where hydrogen gas piping passes through a wall, the piping should be labeled on both sides of the wall.
• There should also be contingency plans in place should an incident occur.
• The site emergency response team, as well as the local fire department, should know the location of all hydrogen storage tanks.
Using Hydrogen with a GC-MS/MS System
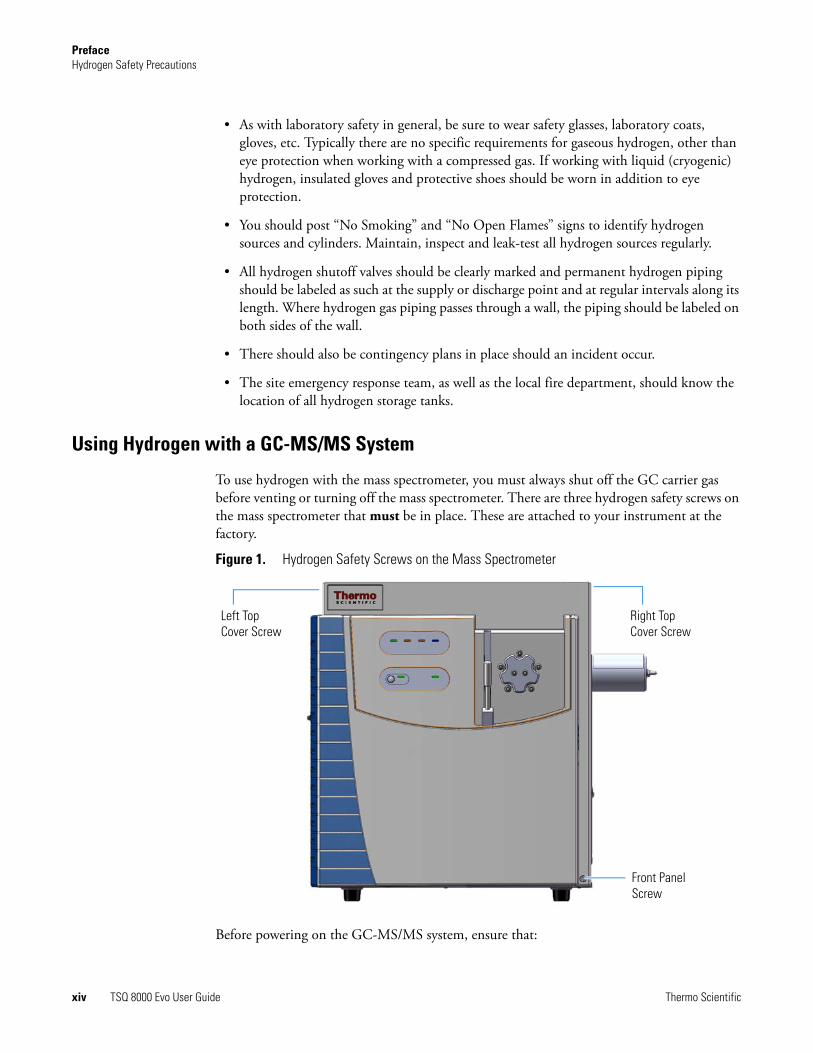
To use hydrogen with the mass spectrometer, you must always shut off the GC carrier gas before venting or turning off the mass spectrometer. There are three hydrogen safety screws on the mass spectrometer that must be in place. These are attached to your instrument at the factory.
Figure 1. Hydrogen Safety Screws on the Mass Spectrometer
Before powering on the GC-MS/MS system, ensure that:
Left Top Cover Screw
Right Top Cover Screw
Front Panel Screw

PrefaceHydrogen Safety Precautions
Thermo Scientific TSQ 8000 Evo User Guide xv
• All the covers and panels of the GC-MS/MS system are firmly attached.
• The vent valve is tightly closed if you vented the system.
• All fittings, ferrules, and o-rings are sealed.
Hydrogen Connection Guidelines
Use the following guidelines to safely connect hydrogen to your system:
• Piping—Hydrogen must be delivered to equipment using appropriate piping and be done in such a way as to pose essentially no hazard to end-users. Piping systems for the delivery of hydrogen should be designed and installed by a person qualified by specific training and experience with hydrogen piping systems.
Stainless steel is usually recommended because it is a safe, cost-effective material. Piping of black iron or copper must not be used, as the pipe can become brittle with age. Elastomeric/plastic tubing of various plastics and polymers should not be used, unless the tubing is approved for use with hydrogen. If elastomeric/plastic tubing is used for hydrogen gas delivery, the tubing should be tested for hydrogen permeability to minimize leakage.
The hydrogen piping system must be flexible enough to endure routine thermal expansion and contraction. The system should also include considerations for the most severe condition of temperature and pressure expected during service. Piping and supports must be able to withstand static loading introduced by such things as ice and snow; and dynamic loading from high wind and earthquake.
Caution should be used if burying hydrogen piping. Proper controls should be used to protect against damage and corrosion, and also to prevent Hydrogen from entering a building if there is any leakage.
• Fittings—All fittings must be of the proper type approved or designed for use with hydrogen gas. Use as few fittings as possible to minimize the potential for leaks. After installation, ensure that leak testing is carried out prior to system use, and on a regular basis.
There must be no PTFE tape or other things like plumber's putty used to enhance a seal, as this actually is a detriment to a good seal. Ideally the best installation would use stainless steel tubing with appropriate gas-tight fittings.
Welding is usually preferred for joints in hydrogen piping systems since welding provides a better connection and reduces the potential for leaks compared to mechanical fittings. Soft solder joints are not permitted for hydrogen systems (due to the low melting point of soft solder and its potential for brittle failure at cryogenic temperatures). Brazed joints are permitted, but such joints should be protected against the possibility of external fire.
Tubing connections should be clamped to barbed or press-fit type connections. Hose clamps or jubilee clamps must not be used.

PrefaceHydrogen Safety Precautions
xvi TSQ 8000 Evo User Guide Thermo Scientific
• Valves—All valves must be suitable for hydrogen service and for the specific operating conditions. Valves, including regulators, must not be used for hydrogen, unless they are designed and identified for such a use. Ball valves are often chosen because of their superior leak tightness through the valve seat. Pneumatic operators are usually chosen for remotely operated valves so that potential ignition sources (electricity) are remote from the valve.
Manual shutoff valves should be provided near each point of use, within immediate reach. If a hydrogen cylinder or hydrogen generation system is located within immediate reach, a separate point-of-use shutoff valve is usually not necessary.
Line regulators that have their source away from the point of use should have a manual shutoff valve near the point of use.
An emergency gas shutoff device in an accessible location outside the use area should be provided in addition to the manual point-of-use valve in each educational and instructional laboratory space that has a piped gas supply system.
If necessary, the piping system should have uninterruptible pressure relief. The pressure relief system should be designed to provide a discharge rate sufficient to avoid further pressure increase and should vent to a safe location outside or to a ventilation system exhaust.
Purchasing Hydrogen
Use the following guidelines when purchasing hydrogen:
• Hydrogen Generator—Because it minimizes the amount of hydrogen present and reduces the degree of hazard, a hydrogen generator (also called an electrolyzer) is the safest way to purchase hydrogen in the quantity used in GC/MS.
However, to minimize the degree of hazard, the hydrogen generator must only be operated in a non-explosive environment because hydrogen buildup can be ignitable. This means that your ventilation system for the room or lab hood must maintain an air exchange rate that is at least two orders of magnitude greater than the maximum hydrogen production rate of the hydrogen generator. Be sure to follow the manufacturers' directions about proper use and maintenance of the regulator.
To prevent the possibility of releasing hydrogen, the hydrogen generator should be set to shut down if:
– There is a loss of flow to the ventilation system
– A hydrogen detector alarms at 25% of the lower flammable limit of hydrogen in air.
The oxygen exhausted by the electrolyzer should be vented to the outside as well.

PrefaceHydrogen Safety Precautions
Thermo Scientific TSQ 8000 Evo User Guide xvii
• Hydrogen Cylinder—Hydrogen can be delivered in standard laboratory gas bottles or cylinders. These cylinders have a limited amount of hydrogen in them and are a safe way to transport and store hydrogen. However, compressed hydrogen gas cylinders, like all compressed gas cylinders, must be secured in an upright position, ideally with a non-combustible chain or cable. If the cylinder falls over, the valve can be knocked off and the pressurized cylinder can take off like a rocket, which leads to the release of hydrogen and possibly an explosion, severe injury, or death. Never crack a hydrogen cylinder valve to remove dust or dirt from fittings prior to attaching a regulator, as there is a risk of self-ignition.
Properly Storing Hydrogen
Storing and handling compressed hydrogen gas and cryogenic liquid hydrogen present potential health and safety hazards. Using proper storage and handling techniques is essential to maintaining a safe work environment.
Use the following guidelines when storing hydrogen:
• Store spare hydrogen gas cylinders outside and away from doors, windows, building air intake vents, structures, and vehicle routes. This precaution applies when the hydrogen is or is not in use. Indoor storage of spare hydrogen cylinders has special requirements, which is beyond the scope of this document. Documentation for each vessel should include a description of the vessel, a list of available drawings or other documents, the most recent inspection results, and the responsible person's name.
• Prevent spare cylinders from toppling by wrapping them with chains. The chains should also be protected against corrosion and excessive heat.
• Separate spare hydrogen cylinders from oxidizing gases (such as oxygen) with a 5 ft (1.5 m) tall fire barrier with a half-hour fire rating or place the cylinders at least 20 ft (6 m) apart.
• When moving hydrogen cylinders:
– Remove the regulator and replace the cylinder valve cap before moving.
– Move cylinders on cylinder carts or with other appropriate transport devices.
– Never roll or drop a cylinder and never lift a cylinder by its protective cap.
• Bulk hydrogen systems include either gaseous or liquid hydrogen in fixed installations; in some gas systems a semi-permanent trailer (tube trailer) can be used. Storage vessels for compressed hydrogen gas or liquid hydrogen should be designed, constructed, tested, and maintained in accordance with applicable codes and standards. Bulk hydrogen systems represent a level of complexity again which is beyond the scope of this document; however some general guidelines are provided.

PrefaceHydrogen Safety Precautions
xviii TSQ 8000 Evo User Guide Thermo Scientific
• The bulk hydrogen storage system should not be located beneath electric power lines, close to other flammable gases/liquids, or close to public areas. It should be readily accessible to authorized personnel and delivery equipment, but protected from physical damage or tampering.
• As liquid hydrogen systems also have a cryogenic hazard, additional safety considerations for the use of cryogenic liquids might be necessary.

PrefaceHydrogen Safety Precautions
Thermo Scientific TSQ 8000 Evo User Guide xix
Hydrogen Safety Codes, Standards and References
The following list of safety codes, standards and references is in no way an exhaustive list. In fact, there might be federal, state or local codes that apply to your specific location. Check with all appropriate agencies with jurisdiction before installing or using a hydrogen system.
• Air Products Safetygram #4 Gaseous Hydrogen
• ANSI/AIAA standard for hydrogen safety guidelines is AIAA G-095-2004, Guide to Safety of Hydrogen and Hydrogen Systems
• ASME B31.1, Power Piping Code
• ASME B31.3, Process Piping Code
• ASME B31.8, Gas Transmission and Distribution Systems
• BCGA Code Of Practice CP4 Industrial Gas Cylinder Manifolds and Gas Distribution Pipework
• BCGA Code Of Practice CP33 The Bulk Storage of Gaseous Hydrogen at Users' Premises
• CGA G-5, Hydrogen
• CGA G-5.4, Standard for Hydrogen Piping Systems at Consumer Locations
• CGA G-5.5, Hydrogen Vent Systems
• CGA G-5.6, Hydrogen Pipeline Systems
• CGA G-5.8, High Pressure Hydrogen Piping Systems at Consumer Locations.
• FM Global Property Loss Prevention Data Sheets 7-50: Compressed Gases in Cylinders
• FM Global Property Loss Prevention Data Sheets 7-91: Hydrogen
• IGC Doc 121/04/E, Hydrogen Transportation Pipelines System Design Features
• NASA
• NSS 1740.16 Safety Standard For Hydrogen And Hydrogen Systems Guidelines for Hydrogen System Design, Materials Selection, Operations, Storage, and Transportation
• NFPA 52, Vehicular Fuel Systems Code
• NFPA 55, Standard for the Storage, Use, and Handling of Compressed Gases and Cryogenic Fluids in Portable and Stationary Containers, Cylinders, and Tanks, 2005 Edition
• NFPA 68, Standard on Explosion Protection by Deflagration Venting
• NFPA 70, National Electrical Code

PrefaceHazardous Substances Precautions
xx TSQ 8000 Evo User Guide Thermo Scientific
• NFPA 497, Recommended Practice for the Classification of Flammable Liquids, Gases, or Vapors and of Hazardous (Classified) Locations for Electrical Installations in Chemical Process Areas
• NFPA 13, Standard for the Installation of Sprinkler Systems
• NFPA 45, Standard on Fire Protection for Laboratories Using Chemicals
• NFPA 55, Standard for the Storage, Use, and Handling of Compressed Gases and Cryogenic Fluids in Portable and Stationary Containers, Cylinders, and Tanks
• NFPA 68, 2007 Standard on Explosion Protection by Deflagration Venting
• NFPA 69, Standard on Explosion Prevention Systems
• NFPA 91, Standard for Exhaust Systems for Air Conveying of Vapors
• NFPA 255, Standard Method of Test of Surface Burning Characteristics of Building Materials
• OSHA 29CFR1910.103 1910.103 Hydrogen
Hazardous Substances Precautions
Biological Hazard Warning Note
In laboratories where samples with potential biological hazards are handled, the user must label any equipment or parts which might become contaminated with biohazardous material.
The appropriate warning labels are included with the shipment of the instrument. It is the user’s responsibility to label the relevant parts of the equipment.
When working with biohazardous materials, you are responsible for fulfilling the following mandatory requirements:
• Providing instructions on how to safely handle biohazardous material.
• Training operators to be aware of potential hazards.
WARNING Before using hazardous substances (toxic, harmful, and so on), please read the hazard indications and information reported in the applicable Material Safety Data Sheet (MSDS). Use personal protective equipment according to the safety requirements.

PrefaceContacting Us
Thermo Scientific TSQ 8000 Evo User Guide xxi
• Providing personal protective equipment.
• Providing instructions for what to do if operators are exposed to aerosols or vapors during normal operation (within the intended use of the equipment) or in case of single fault situations such as a broken vial. The protective measures must consider potential contact with the skin, mouth, nose (respiratory organs), and eyes.
• Providing instructions for decontamination and safe disposal of relevant parts.
Venting Toxic Gases
When analyzing toxic compounds, be aware that during the normal operation of the GC some of the sample might be vented outside the instrument through the split and purge flow vents; therefore, be sure to vent the exhaust gases to a fume hood. Consult local environmental and safety regulations for instructions in exhausting fumes from your system.
Contacting UsThere are several ways to contact Thermo Fisher Scientific for the information you need.
To find out more about our products
Go to www.thermoscientific.com/en/products/mass-spectrometry.html for information about our products.
To get local contact information for sales or service
Go to www.thermoscientific.com/en/support-landing/support.html.
To suggest changes to documentation or to Help
• Fill out a reader survey online at www.surveymonkey.com/s/PQM6P62.
• Send an e-mail message to the Technical Publications Editor at [email protected].
WARNING The user or operator is responsible for the safe handling of hazardous chemicals or biological compounds including (but not limited to) bacterial or viral samples and the associated waste, according to international and local regulations.

Thermo Scientific TSQ 8000 Evo User Guide 1
1
Introduction
Use the information in this chapter to determine whether your TSQ 8000 Evo system is working properly and to check its basic systems.
Confirming Your Instrument is WorkingAfter installing a new column, confirm that your GC/MS-MS system has power, the carrier gas flow and collision gas delivery pressure are correct, the gas tanks have enough pressure, and the system is leak-free and has reached vacuum and temperature.
Checking Power to the System
To confirm that the TSQ 8000 Evo system is powered on, check that the power light on the front panel is lit and solid green. See Figure 1. If it is not, the instrument is not powered on.
IMPORTANT You will likely want to change the GC column before setting up a method. See Chapter 2, “Changing the Column,” for instructions on changing the column.
Contents
• Confirming Your Instrument is Working
• Checking Power to the System
• Verifying the Carrier Gas Flow Rate
• Checking Your Carrier Gas Tank Pressure
• Verify Collision Gas Tank Pressure
• Checking the Vacuum and Temperature
• Cleaning the Exterior of Your Instrument
• Configuring Your Instrument

1 IntroductionConfirming Your Instrument is Working
2 TSQ 8000 Evo User Guide Thermo Scientific
To power on the TSQ 8000 Evo instrument
Lift up the power switch located on the upper left side panel of the instrument near the back.
Figure 1. Front Panel of the TSQ 8000 Evo Instrument
To power on the TRACE 1300/1310 GC
Reach over the top right of the instrument and pull up on the large plastic ribbed power switch on the back.
To confirm that a TRACE 1300 is powered on
Confirm that the power light on the status panel is solid green.
To confirm that a TRACE 1310 is powered on
Confirm that the touchscreen main menu has appeared.
Verifying the Carrier Gas Flow Rate
Once you confirm that the system is powered on, verify that the carrier gas rate is correct.
To check the carrier gas flow rate on the TRACE 1310 GC
1. Choose Instrument Control and then Front/Back inlet.
2. Display the column flow.

1 IntroductionConfirming Your Instrument is Working
Thermo Scientific TSQ 8000 Evo User Guide 3
If the actual and set point amounts in Col. Flow are the same, then you have good carrier gas flow. If the amounts are different, refer the Troubleshooting section of the TRACE 1300/1310 GC Series User Guide.
To check the carrier gas flow rate on a TRACE 1300
1. Open the TraceFinder software by clicking the TraceFinder icon on the computer desktop.
2. Click Real Time Status in the top right-hand menu to open the Real Time Status pane.
3. On the Real Time Status pane roadmap, select the TRACE 1300 from the instrument list at the top of the pane.
4. The TRACE 1300 status pane opens.
Figure 2. Status Pane in TraceFinder Software
5. Verify the column flow rate under the Flow tab in the Real Time Status pane.
Real Time Status
Real Time Status Pane

1 IntroductionConfirming Your Instrument is Working
4 TSQ 8000 Evo User Guide Thermo Scientific
Checking Your Carrier Gas Tank Pressure
Make sure you have enough pressure in the carrier gas tank to accommodate the number of samples you plan to run. If the pressure is too low, you might run out of gas in the middle of a run, which could compromise the results of your data.
To check your carrier gas tank pressure
1. Locate your carrier gas tank. It might be in a different room, depending on how your lab is set up.
2. Look at the pressure gauge on the tank.
3. Ensure the pressure is more than 100 psi at the primary (or first) regulator stage. If it is not, you may want to replace the tank if you have to run a lot of samples.
Verify Collision Gas Tank Pressure
Check that the input pressure of your collision gas is at 59–61 psig for Argon or 56–58 psig for Nitrogen and that the tank is connected to the mass spectrometer.
Checking the Vacuum and Temperature
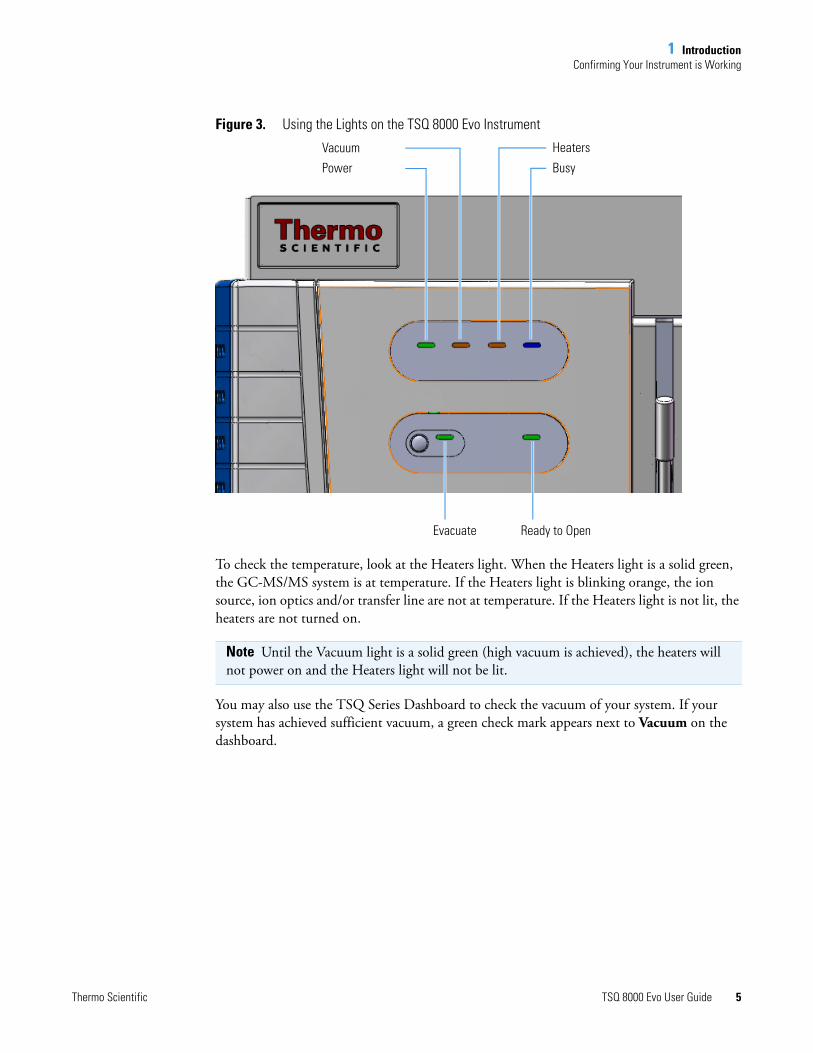
Use the lights on the front of your TSQ 8000 Evo system to check the vacuum and temperature of the instrument.
To check the vacuum, look at the Vacuum light. See Figure 3. When the light is a solid green, the mass spectrometer is under sufficient vacuum. If the Vacuum light is slowly blinking orange, you have not yet achieved vacuum. If the Vacuum light is blinking orange quickly, you have a large leak that has prevented the instrument from achieving vacuum. In this case, you must turn the power off and find and fix the leak. Most likely, the column nut must be tightened, the column was not installed correctly, or the vent valve was not completely closed. See Troubleshooting for more information.
CAUTION Collision gas input pressure must remain constant for proper instrument performance. The regulator used to supply the collision gas must be able to deliver 60 ± 1 psig. Ensure that the regulator is marked clearly at 60 psig and is stable enough to supply constant pressure at 60 ± 1 psig.
1 IntroductionConfirming Your Instrument is Working
Thermo Scientific TSQ 8000 Evo User Guide 5
Figure 3. Using the Lights on the TSQ 8000 Evo Instrument
To check the temperature, look at the Heaters light. When the Heaters light is a solid green, the GC-MS/MS system is at temperature. If the Heaters light is blinking orange, the ion source, ion optics and/or transfer line are not at temperature. If the Heaters light is not lit, the heaters are not turned on.
You may also use the TSQ Series Dashboard to check the vacuum of your system. If your system has achieved sufficient vacuum, a green check mark appears next to Vacuum on the dashboard.
Note Until the Vacuum light is a solid green (high vacuum is achieved), the heaters will not power on and the Heaters light will not be lit.
Heaters
Busy
Vacuum
Power
Evacuate Ready to Open

1 IntroductionCleaning the Exterior of Your Instrument
6 TSQ 8000 Evo User Guide Thermo Scientific
Figure 4. Checking System Vacuum on the Dashboard
Cleaning the Exterior of Your InstrumentWhen the exterior of your instrument gets dirty, wipe it with a clean, dry, lint-free cloth.
Configuring Your InstrumentInitially, the field service engineer will configure your TSQ 8000 Evo instrument. However, if you have reinstalled Xcalibur or you have a new computer or device, follow these instructions to reconfigure it.
To configure your TSQ 8000 Evo instrument
1. Close the Dashboard and any open Xcalibur windows.
2. From the Start menu on your computer desktop, choose Start | All Programs | Thermo Foundation 3.0 | Instrument Configuration.
Vacuum

1 IntroductionConfiguring Your Instrument
Thermo Scientific TSQ 8000 Evo User Guide 7
3. When the Instrument Configuration window opens, you will see icons of all connected instruments.
4. Select the TSQ Series icon in the Available Devices column and click Add to move it into the Configured Devices column.
Figure 5. Finding Available Devices
5. Select the icon for each instrument you want to configure (See Figure 6) and click Add.

1 IntroductionConfiguring Your Instrument
8 TSQ 8000 Evo User Guide Thermo Scientific
Figure 6. Configuring a Device
6. Select the TSQ Series from the list of configured devices.
7. Click Configure to open the TSQ Series Configuration dialog box.
8. On the General page, set the pressure units.

1 IntroductionConfiguring Your Instrument
Thermo Scientific TSQ 8000 Evo User Guide 9
Figure 7. Setting the Pressure Units
9. Set the remote start, which tells the TSQ 8000 Evo system when the GC has started a run. When you configure the GC, you can tell it what to send out to the instrument. Make sure the value in this dialog box matches what you set on the GC. The default is Active Low. See Figure 8.
Note You only need to set up the pressure units if you have an ion gauge or convectron gauge installed on your system. The readbacks from these components will display in the units set in this dialog box.

1 IntroductionConfiguring Your Instrument
10 TSQ 8000 Evo User Guide Thermo Scientific
Figure 8. Setting the Remote Start
10. Check Always Show Method Portability Between Instrument Methods if you need to create methods for older model TSQ 8000 or TSQ Duo systems.
Figure 9. Enabling Method Portability
11. Click Communications to reset the network IP address and assign a TCP port. See Figure 10. This tells the instrument method how to find the TSQ 8000 Evo system if you

1 IntroductionConfiguring Your Instrument
Thermo Scientific TSQ 8000 Evo User Guide 11
changed the IP address using Instrument Configuration. For security purposes, you may also want to modify the TCP port. Consult your local IT Department for help.
Figure 10. Setting up the Network
12. Click the Maintenance Intervals tab to set the number of days until you plan to perform maintenance on certain components of your GC/MS system. See Figure 11.
Figure 11. Setting the Maintenance Intervals
13. Select the Foreline Pump Oil check box to enable the maintenance intervals. Then set the number of days after which you want to be reminded to check the oil. The manufacturer recommends changing the oil every 125 days. Select the Turbo Pump Oil/Bearing check box to enable the maintenance reminder. Then set the number of days after which you want to be reminded to check the oil. Refer to the Turbo Pump manual for the manufacturer's recommended maintenance intervals.
14. Select the Filament 1 check box to enable the maintenance reminder. In a leak-free system, expect the filament to last between 30-360 days, depending on usage.

1 IntroductionConfiguring Your Instrument
12 TSQ 8000 Evo User Guide Thermo Scientific
15. Select the Filament 2 check box to enable the maintenance reminder. Then set the number of days after which you want to be reminded to check filament 2. In a leak-free system, expect the filament to last between 30-360 days, depending on usage.
16. Select the Ion source check box to enable the maintenance reminder. Then set the number of days after which you want to be reminded to check the ion source. The time between cleaning depends very strongly on your analysis. You will have to determine the correct length of time between source cleanings.
17. Select the Multiplier check box to enable the maintenance reminder. Then set the number of days after which you want to be reminded to check the electron multiplier.
18. Click OK to return to the main Instrument Configuration window. See Figure 12.
Figure 12. Main Instrument Configuration Window
19. Select the TRACE 1300 or TRACE 1310 icon to configure the GC handshaking parameters.
20. Under the General tab, set the handshaking parameters as shown in Table 1.

1 IntroductionConfiguring Your Instrument
Thermo Scientific TSQ 8000 Evo User Guide 13
Figure 13. GC Handshaking Parameter Configuration
21. Click OK once you have entered the correct GC handshaking parameters.
Table 1. GC Handshaking Parameters
Remote Start In High to Low
Inhibit Ready In When High
End of Run Out High to Low
Start of Run Out High to Low
GC Ready Out When Low
Prep Run Out When Low
Note For the remainder of the GC configuration settings, refer to the TRACE 1300 and TRACE 1310 Series GC User Guide. Refer to your autosampler user documentation for the correct autosampler configuration settings.
Note If you are running samples with a Direct Probe System, you do not have to configure the GC.

1 IntroductionConfiguring Your Instrument
14 TSQ 8000 Evo User Guide Thermo Scientific
22. Click Done to close the Instrument Configuration window.
23. Check the status of the configured instruments in the Status Pane of the TSQ Series Dashboard.
Figure 14. TSQ Series Dashboard
Status Pane

Thermo Scientific TSQ 8000 Evo User Guide 15
2
Changing the Column
The TSQ 8000 Evo GC-MS/MS system ships with a factory-tested 15 m × 0.25 mm ID TR-SQC column, which the field service engineer uses to qualify the instrument. However, once it gets dirty, you cannot purchase a new one, so you must install a column that accommodates the type and quantity of samples that you will be running. For best results, choose a column that will give you the best possible resolution, analysis speed, and quantitation.
Determining the Column TypeWhen determining the type of column for your particular needs, here are a few things to consider:
• Column Material—Columns made out of fused silica are economical and widely used. Columns made out of this material have a wide range of stationary phases and are available in many sizes that can be used with a mass spectrometer.
Large diameter columns made of steel are widely used in process gas analysis, but they are not typically used on mass spectrometers. There are also metal-clad, fused silica columns, which have the advantages of fused silica, but the metal makes them resistant to breakage. These columns are less common and more expensive.
• Stationary Phase—The stationary phase is the most important consideration when selecting a column. The interaction between the stationary phase and the analyte determines how well the analytes separate from each other (resolution) and also affects how quickly the separation occurs (analysis time). Choose a stationary phase that is compatible with the nature of your analytes and the maximum GC oven temperature that you will use.
Contents
• Determining the Column Type
• Replacing the Factory Installed Column
• Connecting the Column to the Transfer Line

2 Changing the ColumnReplacing the Factory Installed Column
16 TSQ 8000 Evo User Guide Thermo Scientific
• Internal Diameter—The smaller the diameter of the column, the better the separation. However, smaller diameter columns do not have as much capacity for matrix or analytes. As a result, smaller diameter columns are subject to overloading, which leads to retention time shifts and peak shape changes. Larger diameter columns can accept larger concentrations of material, but will require longer columns or slower GC oven temperature ramps (which increase the analysis time) to match the separation power of smaller-diameter columns. Typical column sizes for GC/MS have inside diameters (ID) of 0.25 mm. Smaller ID columns, such as the 0.18 and 0.10 mm, are becoming increasingly popular. Additionally, 0.32 and 0.53 mm ID columns are commonly used.
• Film Thickness—With larger film thicknesses, there is more capacity for the analyte. This capacity can aid in the separation of high concentration samples and in the separation of very volatile samples because thicker stationary phases allow more opportunities for the analytes to interact with the stationary phase. The optimal film thickness depends on the internal diameter of the column, and the maximum total capacity needed for sample analysis.
Thick films with small internal diameters give very strong interactions with the analytes, which can result in longer analysis time and peak tailing. Large ID columns with thin films have very little interaction with the analytes, which will result in very fast analysis times with little separation. Typical film thicknesses are 0.25 μm for a column with an ID of 0.25 mm. Other common film thicknesses are 0.1, 0.5, and 1.0 μm.
Be careful when selecting columns for mass spectrometers. Some columns with large inner diameters that work fine with other GC detectors may need lower head pressure when operated with vacuum at the outlet. This lower head pressure can allow air diffusion into the column through the carrier gas flow module's split and purge valves.
• Length—The length of the column affects how much time the analyte has to interact with the stationary phase. Longer columns typically have better resolutions and higher capacities, but longer analysis times. Longer columns are also more expensive. Typical column lengths are 15 or 30 m for GC/MS, but 100 m columns may be needed for very complex mixtures like gasoline. Very short columns (2.5, 5, and 10 m) are also available.
Replacing the Factory Installed Column To replace the factory-installed column in the TSQ 8000 Evo system
1. Cool down the GC oven and injector. See the GC documentation for information.
2. Open the TSQ Series Dashboard and click Shut Down.
Note Contact your local sales representative to order a Thermo Scientific column. You can also refer to our catalog or visit our Web site at www.thermoscientific.com/columns.
Note If you are running samples, stop the acquisition before powering off the system.

2 Changing the ColumnReplacing the Factory Installed Column
Thermo Scientific TSQ 8000 Evo User Guide 17
During the shutdown procedure the vacuum and heaters lights will remain off. Once the procedure is complete and the instrument is ready to be powered off, the power light will turn amber and start blinking rapidly. At this point it is safe to power off the TSQ 8000 Evo system.
3. On the left side of the instrument, push down on the power switch to power-off the TSQ 8000 Evo system.
Figure 15. Powering Off the TSQ 8000 Evo Instrument
4. Open the front door of the instrument.
5. Look behind the right side of the vacuum interlock shield and twist the vent valve knob one and a half times in a counterclockwise direction to open the vent.
6. Remove the current column:
a. Make sure the heated zones of the GC are cooled down. Refer to the GC documentation for instructions.
b. Turn off the carrier gas and if used, the detector gas. See the GC documentation for information about using detector gases.
c. Open the front door of the GC.
d. Unscrew the transfer line nut and remove the column from the transfer line.
e. Unscrew the injector and detector nuts and remove the column.
Vacuum Interlock Shield Power Switch
Vent Valve Knob
WARNING BURN HAZARD: The injector, oven, and transfer line may be hot. Allow them to cool to room temperature before touching them.

2 Changing the ColumnReplacing the Factory Installed Column
18 TSQ 8000 Evo User Guide Thermo Scientific
f. Remove the column from the column rack and from the GC.
7. Connect the new column to the injector inside the GC.
a. Unwind the column enough to easily connect its ends to the injector and detector.
b. Wipe about 100 mm (4 in.) of the column with a tissue soaked in methanol.
c. Insert the column through the injector retaining nut and ferrule (larger end up). If the M4 retaining nut is used, slide it on the column through the side cut. Wipe the column again with a tissue soaked in methanol.
d. Use a scoring wafer to score and break the column about 1 cm (0.4 in.) from the end. Use a magnifying glass to check for an even, flat cut. Repeat if necessary.
e. Insert a notched septum on the column to hold the retaining nut at this position. Thread the retaining nut into the injector but do not tighten.
f. Ensure that the end of the column is the proper distance (splitless = 5 mm, split = 10 mm, PTV and PTVBKF = 30 mm) from the back of the injector nut.
g. Adjust the column position so that the septum contacts the bottom of the retaining nut. Use your fingers to tighten the retaining nut until it starts to grip the column.
h. Tighten the column nut finger-tight until it starts to grip the column plus a quarter turn.
i. Remove the notched septum from the column.
8. Set up the GC parameters:
a. Set the oven and injector temperature to 50 °C (122 °F).
b. Set the carrier gas flow to 1.0 mL/min.
c. Turn off vacuum compensation, which is located on the Carrier menu of the GC.
d. Use the column flowmeter connector to verify that there is flow through the column. If you do not have a flowmeter, dip the column outlet in a small vial of methanol. Bubbles indicate there is flow through the column. If there is no flow, check that the carrier gas is on, the GC inlet is pressurized, and the column is not plugged. If there is still no flow, consult the GC documentation or contact Technical Support.
e. Allow the column to purge for at least 10 minutes. If you used methanol to detect column flow, remove column from methanol during purge time.
f. Insert the column into the fitting of the column flowmeter connector that blocks the column flow.
Note Wear clean, lint- and powder-free gloves when you handle the column and injector ferrule.
Tip Slide a notched septum on the column before the injector retaining nut to make it easier to measure the proper distance between the nut and end of the column.

2 Changing the ColumnReplacing the Factory Installed Column
Thermo Scientific TSQ 8000 Evo User Guide 19
9. Perform a column leak check:
a. On the TRACE 1310, select the Leak Check icon in the Maintenance menu. Otherwise, perform the leak check through the Chromatography Data System. Refer to the TRACE 1300 and TRACE 1310 Series GC User Guide for instructions.
b. Start the leak check.
The split and purge valves of the selected channel are automatically closed, and the channel is pressurized with carrier gas to the leak check setpoint.
The system monitors the pressure for one minute. If the pressure does not drop more than the maximum allowed sensitivity value, then the leak check will pass. If the leak check does not pass, use the leak detector to find and fix any leaks.
c. Repeat the leak check until no leaks are indicated.
10. Calibrate the carrier gas flow (column evaluation):
a. Carefully push the capillary column end into the flowmeter section of the column flowmeter connector.
Figure 16. Column Flowmeter Connector
b. Connect the flowmeter to the dedicated fitting on the column flowmeter connector.
c. If you have a TRACE 1310, select the Back or Front Column icon in the Configuration menu. Otherwise, perform the column evaluation through the Chromatography Data System. See the TRACE 1300 and TRACE 1310 User Guide for instructions.
Tip Leaks can be caused by not tightening the fitting on the column flowmeter connector. Check the fitting before looking for the leak elsewhere.
CAUTION INSTRUMENT DAMAGE: Do not allow the column flowmeter connector to exceed 80 °C (176 °F). Otherwise, it will melt and damage the instrument.
A B C
To flowmeter

2 Changing the ColumnReplacing the Factory Installed Column
20 TSQ 8000 Evo User Guide Thermo Scientific
d. Select Column and input the column’s physical characteristics.
e. If a pre-/post column is present, set the length and nominal internal diameter of the pre-/post column in the same valid ranges for the column. The following two lines are added to the menu.
f. Start the column evaluation. According to the physical characteristics of the column, the system calculates and displays the relevant column K-factor. At the end of the routine, a message will indicate that the evaluation was successful.
g. Expect a K-factor of approximately 0.7 – 0.9 for a 15 m, 0.25 mm i.d. column (1.3 – 2.0 for a 30 m, 0.25 mm i.d. column). If the column does not report a K-factor within this range or within 0.1 units of the previous stored value, check for a leak or broken column using the leak detector. The K-factor is a measured resistance for the column. A K-factor that is too low may indicate a leak in the system, while a K-factor that is too high may indicate a blockage.
Fix any issues found and rerun column evaluation until an appropriate K-factor is achieved.e a leak in the system, while a K-factor that is too high might indicate a blockage.
11. Disconnect the column flowmeter:
a. Disconnect the column from the column flowmeter connector.
b. Remove the clear plastic component, including its fittings, from the oven and set them aside.
c. Close the GC door.
12. Condition the column before inserting it into the TSQ 8000 system. Column conditioning consists of passing a carrier gas flow through the column heated to a programmed temperature as described in the column manufacturer’s instructions.
a. If there are no conditioning instructions, perform the column conditioning by setting a final temperature 10 °C–20 °C below the column’s recommended maximum temperature.
Note For the most reproducible results, you should conduct a more detailed column evaluation. However, the following steps, while recommended, are not required.
CAUTION INSTRUMENT DAMAGE: The material released from the column (column bleed) during conditioning may contaminate the ion source if the column is inserted into the transfer line during the high-temperature stage of conditioning.
WARNING FIRE HAZARD: Do not use hydrogen as the carrier gas for conditioning your column. It could vent into the oven and present an explosion hazard.

2 Changing the ColumnConnecting the Column to the Transfer Line
Thermo Scientific TSQ 8000 Evo User Guide 21
b. Run the slow temperature program that is recommended by the manufacturer. A typical program would hold the column at 40 °C (104 °F) for 15 minutes, and then ramp at 10 °C/min (50 °F/min) up to 10–20 °C below the maximum allowed column temperature. Hold the column at this temperature for two hours.
Connecting the Column to the Transfer LineWhen connecting the column to the transfer line, you may use either the spring loaded transfer line nut with the graphite Vespel™ ferrule or the regular transfer line nut.
To connect the column using the spring loaded transfer line nut
1. Lower the oven temperature and allow it to cool.
2. If the TSQ 8000 Evo system is running, shut down and vent it. See the instrument’s hardware manual for instructions.
3. Unwind about one turn of the column from the column outlet end.
4. Wipe approximately 300 mm (12 in.) of the column with a tissue soaked in methanol.
5. Choose an appropriate ferrule for the outer diameter of your column.
6. Insert the column through the spring loaded transfer line nut and ferrule, entering through the tapered end of the ferrule.
7. Wipe the column again with a tissue soaked in methanol.
CAUTION INSTRUMENT DAMAGE: Never exceed the column manufacturer’s maximum operating temperature.
Note For best results, we recommend you use the spring loaded transfer line nut.
Note If you use a graphite Vespel ferrule with your column, Thermo Fisher Scientific recommends using the spring loaded transfer line nut with it. See the spare parts guide for ordering information.
CAUTION BURN HAZARD: The injector, detectors, oven, and transfer line may be hot. Allow them to cool before touching them.
Note Wear clean, lint- and powder-free gloves when you handle the column and transfer line ferrule.

2 Changing the ColumnConnecting the Column to the Transfer Line
22 TSQ 8000 Evo User Guide Thermo Scientific
Figure 17. Transfer Line Nut and Graphite Vespel Ferrule Orientation
8. Insert the column into the measuring tool, which is in the MS Toolkit (See Figure 18), so that it is even with the lines at the end of the column. Figure 19 indicates proper positioning of the column in the tool for accurate measuring.
9. Use a scoring wafer to score and break the column. Use a magnifying glass to check for an even, flat cut. Repeat if necessary.
10. Use a 5/16 in. wrench to hold the column measuring tool steady.
Figure 18. Column Measuring Tool
11. While holding the column measuring tool steady, tighten the spring loaded transfer line nut with a 1/4” wrench until the column just stops moving in the ferrule.
12. Turn the spring loaded transfer line nut 1 flat backward so the column is able to move in the ferrule with slight resistance.
13. Line up the outlet of the column with the arrows on the end of the column measuring tool.
Spring Loaded Transfer Line NutFerrule
Flat on the Transferline Nut

2 Changing the ColumnConnecting the Column to the Transfer Line
Thermo Scientific TSQ 8000 Evo User Guide 23
Figure 19. Lining Up the Column in the Column Measuring Tool
14. Place a septum with a notch cut into it behind the transfer line nut. The septum marks the place on the column where it should exit the nut.
Figure 20. Positioning the Septum
15. Pull the column back from the spring loaded transfer line nut. Do not move the septum from its position on the column.
Figure 21. Pulling the Column Back from the Spring Loaded Transfer Line Nut
Column Outlet
Spring Loaded Transfer Line Nut
Septum
Column Measuring Tool
Column
ColumnSpring Loaded Transfer Line Nut
Septum

2 Changing the ColumnConnecting the Column to the Transfer Line
24 TSQ 8000 Evo User Guide Thermo Scientific
16. Loosen the transfer line nut from the column measuring tool.
17. Remove the column, transfer line nut and ferrule from the column measuring tool, making sure not to move the septum from its location on the column.
18. Insert the column into the transfer line.
Figure 22. Inserting the Column into the Transfer Line
19. Tighten the spring loaded transfer line nut until it is just secure enough so that you cannot move it.
20. Loosen the nut by turning it exactly 1 flat backward.
21. Position the column in the transfer line using the cut septum to measure the correct length you should insert the column.
Note The ferrule should still be able to move on the column. Use the septum to mark the correct location where the column should exit the nut.
Transfer Line
ColumnSpring Loaded Transfer Line Nut
Septum

2 Changing the ColumnConnecting the Column to the Transfer Line
Thermo Scientific TSQ 8000 Evo User Guide 25
Figure 23. Positioning the Column in the Transfer Line
22. Tighten the spring loaded transfer line nut 1 flat forward—back to where it is secure enough in the transfer line that you cannot move it.
23. Tighten the spring loaded transfer line nut 1 additional quarter turn.
24. Remove the cut septum.
25. Condition the graphite Vespel ferrule:
a. Raise the oven temperature to the maximum temperature you will operate the GC.
b. Wait 10 minutes.
c. Lower the oven temperature to 40 °C (104 °F) and allow it to cool before continuing.
26. Close the front door of the GC.
27. Restore working conditions.
a. Raise the oven temperature to the initial temperature that you will use.
b. Turn on vacuum compensation on the GC.
28. Power on the TSQ 8000 Evo instrument. See Chapter 1, “Introduction,” for instructions.
29. Once the instrument is pumped down and able to scan, view air water spectra and look for evidence of leaks with a large m/z 28 signal. If you observe a leak, stop scanning and gently tighten the nut in small increments until no leaks appear when scanning.
ColumnTransfer Line
Spring Loaded Transfer Line Nut
Septum
WARNING BURN HAZARD: The oven may be hot. Allow it to cool to room temperature before opening it. The injector will still be hot, so do not touch it.

2 Changing the ColumnConnecting the Column to the Transfer Line
26 TSQ 8000 Evo User Guide Thermo Scientific
To connect the column using the regular transfer line nut
1. Lower the oven temperature and allow it to cool.
2. If the TSQ 8000 Evo system is running, shut down and vent it. See the instrument’s hardware manual for instructions.
3. Unwind about one turn of the column from the column outlet end.
4. Wipe approximately 300 mm (12 in.) of the column with a tissue soaked in methanol.
5. Choose an appropriate ferrule for the outer diameter of your column.
6. Insert the column through the transfer line nut and ferrule, entering through the tapered end of the ferrule. Wipe the column again with a tissue soaked in methanol.
Figure 24. Transfer Line Nut and SilTite Ferrule Orientation
Note For best results, we recommend you use the spring loaded transfer line nut. See “To connect the column using the spring loaded transfer line nut” on page 21.
CAUTION BURN HAZARD: The injector, detectors, oven, and transfer line may be hot. Allow them to cool before touching them.
Note Wear clean, lint- and powder-free gloves when you handle the column and transfer line ferrule.
Note If the maximum oven temperature in your method is ≥ 290 °C (554 °F), Thermo Fisher Scientific recommends using a spring loaded transfer line nut with a graphic Vespel ferrule or a SilTite™ nut and ferrule. By cycling the oven at and above this temperature, expansion and contraction of the graphite Vespel material can cause leaks in the transfer line.
Transfer Line Nut
SilTite Ferrule
Flat on the Transferline Nut

2 Changing the ColumnConnecting the Column to the Transfer Line
Thermo Scientific TSQ 8000 Evo User Guide 27
7. Insert the column into the measuring tool, which is in the MS Toolkit (See Figure 25), so that it is even with the lines at the end of the column. Figure 26 indicates proper positioning of the column in the tool for accurate measuring.
8. Use a scoring wafer to score and break the column. Use a magnifying glass to check for an even, flat cut. Repeat if necessary.
9. Use a 5/16 in. wrench to hold the column measuring tool steady.
Figure 25. Column Measuring Tool
10. While holding the column measuring tool steady, tighten the transfer line nut with a 1/4” wrench until the column just stops moving in the ferrule.
11. Turn the transfer line nut 1 flat backward so the column is able to move in the ferrule with slight resistance.
12. Line up the outlet of the column with the arrows on the end of the column measuring tool.
Figure 26. Lining Up the Column in the Column Measuring Tool
13. Place a septum with a notch cut into it behind the transfer line nut. The septum marks the place on the column where it should exit the nut.
Column Outlet

2 Changing the ColumnConnecting the Column to the Transfer Line
28 TSQ 8000 Evo User Guide Thermo Scientific
Figure 27. Positioning the Septum
14. Pull the column back from the transfer line nut. Do not move the septum from its position on the column.
Figure 28. Pulling the Column Back from the Transfer Line Nut
15. Loosen the transfer line nut from the column measuring tool.
16. Remove the column, transfer line nut and ferrule from the column measuring tool, making sure not to move the septum from its location on the column.
17. Insert the column into the transfer line.
Transfer Line Nut
Septum
Column Measuring Tool
Transfer Line Nut Septum
Column Measuring Tool
Column

2 Changing the ColumnConnecting the Column to the Transfer Line
Thermo Scientific TSQ 8000 Evo User Guide 29
Figure 29. Inserting the Column into the Transfer Line
18. Tighten the transfer line nut until it is just secure enough so that you cannot move it.
19. Loosen the nut by turning it exactly 1 flat backward.
20. Position the column in the transfer line. Use the septum as a guide to measure the correct length you should insert the column. Be careful not to change the location of the septum on the column.
Figure 30. Positioning the Column in the Transfer Line
21. Tighten the nut 1 flat forward—back to where it is secure enough in the transfer line that you cannot move it.
22. Tighten the nut 1 additional quarter turn.
23. Remove the cut septum.
Transfer Line
ColumnTransfer Line Nut
Ferrule
Septum
Transfer Line Column
Septum
2 Changing the ColumnConnecting the Column to the Transfer Line
30 TSQ 8000 Evo User Guide Thermo Scientific
24. Condition the graphite Vespel ferrule:
a. Raise the oven temperature to the maximum temperature you will operate the GC.
b. Wait 10 minutes.
c. Lower the oven temperature to 40 °C (104 °F) and allow it to cool before continuing.
d. Retighten the transfer line nut.
25. Close the front door of the GC.
26. Restore working conditions.
a. Raise the oven temperature to the initial temperature that you will use.
b. Turn on vacuum compensation on the GC.
c. Power on the TSQ 8000 Evo instrument. See Chapter 1, “Introduction,” for instructions.
d. Once the TSQ 8000 Evo instrument is pumped own and able to scan, view air water spectra and look for evidence of leaks with a large m/z 28 signal. If you observe a leak, stop scanning and gently tighten the nut in small increments until no leaks appear when scanning.
Note If you are using a SilTite ferrule, follow the instructions that come with SilTite ferrules. If you are using a graphite Vespel ferrule, they require conditioning to ensure a leak-tight seal. See the spare parts guide for information about ordering these ferrules.
WARNING BURN HAZARD: The oven may be hot. Allow it to cool to room temperature before opening it. The injector will still be hot, so do not touch it.

Thermo Scientific TSQ 8000 Evo User Guide 31
3
Tuning
Tuning will improve the performance of your TSQ 8000 Evo system. For optimum stability, you must wait until the power, vacuum, and heaters lights on the front of the instrument are a solid green. These lights indicate that the instrument has reached vacuum and that it is at the last set temperature. If the system has been powered off for a period of time (that is, a cold system), the system components take up to 4 hours to thermally stabilize after reaching the temperature setpoint. If you did not vent the instrument (that is, the system is hot), the components take approximately 10 minutes to thermally stabilize after reaching the temperature setpoint. If you exchanged the ion source without venting, the source components take approximately 30 minutes to stabilize temperature.
You can tune the TSQ 8000 Evo system by using the TSQ Series Dashboard.
Accessing Auto Tune To access Auto Tune choose one of these two methods
• Double-click the TSQ Series Dashboard shortcut on your desktop to open the TSQ Series Dashboard and then click Auto Tune. See Figure 31.
Contents
• Accessing Auto Tune
• Tuning the Mass Spectrometer
• Updating Tunes for New RF Lens
IMPORTANT Be sure to give the TSQ 8000 Evo system enough time to stabilize. Otherwise, you may see mass drift, mass spectral changes, or changes in the fragmentation of your data.
Note If you are running samples with heavy matrix, running the samples before the source has had time to stabilize at high temperature will prematurely dirty the ion volume and optics.

3 TuningTuning the Mass Spectrometer
32 TSQ 8000 Evo User Guide Thermo Scientific
Figure 31. TSQ Series Dashboard
Tuning the Mass Spectrometer To tune your mass spectrometer
1. In the Tune Types field, select EI, CI, or Both, depending upon which ionization mode you are using.
2. Select a tuning category. See Figure 32.

3 TuningTuning the Mass Spectrometer
Thermo Scientific TSQ 8000 Evo User Guide 33
Figure 32. Tuning Categories
3. Select the tune type you want to use:
Figure 33. Tune Types
a. EI Standard Tune—Provides EI tuning and is used to completely retune the system. It takes the longest amount of time to run, but it has the advantage of reoptimizing nearly all the parameters affecting the signal. This type of tune performs a mass calibration, tunes the lenses and resolution, and performs a leak check. It adjusts the detector sensitivity to generate a m/z 219 ion with an intensity of 20,000,000 counts. Unless your SOP requires it, this is not the best tune to use on a daily basis because of the length of time required to run it.

3 TuningTuning the Mass Spectrometer
34 TSQ 8000 Evo User Guide Thermo Scientific
b. EI Standard Quick Tune—A shortened version of the EI Standard Tune recommended for use when subsequent maintenance tuning is needed after an EI Standard Tune. This tunes the repeller in conjunction with Q3 to overcome the effects of matrix buildup in the source. It starts with the last saved tune and sets the detector sensitivity to generate a m/z 219 ion with an intensity of 20,000,000 counts.
c. EI SRM Tune—Provides EI tuning and completely retunes the system. This tune reoptimizes nearly all the parameters affecting the signal. This type of tune performs a mass calibration, tunes the lenses and resolution, and performs a leak check. Unless your SOP requires it, this is not the best tune to use on a daily basis because of the length of time required to run it. This tune is more sensitive for high mass than the EI Standard Tune, making it more sensitive to many SRM transitions. It sets the detector sensitivity to generate a m/z 219 ion with an intensity of 20,000,000 counts and verifies the correct mass calibration.
d. EI SRM Quick Tune—A shortened version of the EI SRM Tune that is recommended for use when subsequent maintenance tuning is needed after an EI SRM Tune. This tunes the repeller in conjunction with Q3 to overcome the effects of buildup in the source. It starts with the last saved tune and sets the detector sensitivity to generate a m/z 219 ion with an intensity of 20,000,000 counts.
e. EI Tune Check—Used to check how well your last tune is performing. As it is the fastest tune type, it allows you to quickly update the detector sensitivity as the system gets dirty. This allows the sample intensity to remain constant for longer periods without running a full retune of the instrument.The daily tune check performs a leak check, makes sure the mass calibration is correct, and sets the detector sensitivity to generate a m/z 219 ion with an intensity of 20,000,000 counts. If your SOP allows it, you can use this tune to rapidly verify that the previous lens tune is still generating good spectra.
f. EI Diagnostics Only—Runs a complete set of diagnostics, including a leak check, and generate a report. No tuning is performed. Uses the parameters from the last saved tune.
g. EI Target Tune—Starts with the last saved tune and adjusts the ion ratios of the calibration gas to those expected of classic single quadrupole MS analysis. This tune is intended to be run after full calibration using an EI Standard Tune. If your SOP was developed in response to regulatory requirements for classic single-quadrupole MS analysis, or you require classic single quadrupole spectra for spectral library matching, use this tune. It also sets the detector sensitivity to generate a m/z 219 ion with an intensity of approximately 20,000,000 counts and verifies correct mass calibration.
h. EI Initial Tune—Creates a default tune file. It requires a clean instrument, and it sets the repeller to 5 V and the quadrupole voltages to low values. This tune is used to reset parameters for all the other tunes after cleaning the ion source. As a result, use this tune only when the ion source is clean. The EI initial tune should also be used when changing from an SRM tune to a standard tune. The EI initial tune has higher resolution and lower sensitivity than the EI standard tune. This tune starts with the tune file stored in the instrument at the factory. It then performs a mass calibration and leak check, sets the repeller to 0 V, and tunes the lenses. The quadrupole offset

3 TuningTuning the Mass Spectrometer
Thermo Scientific TSQ 8000 Evo User Guide 35
voltage is set to a low value to improve resolution, which is also tuned. The detector gain is calibrated to generate 300,000 electrons for every ion that strikes the detector. Additionally, this tune generates spectra that are the closest in appearance to the factory tune.
i. Fast Scan Tune—This tune retunes the system with fixed Q1 voltages necessary for fast scanning. By increasing the ion energies and shortening ion flight times through the mass analyzer, this tune provides increased ion signal required to tune resolution and perform mass calibration at a high scan rate. This tune may cause high mass ions to exhibit more fronting than the other built-in tune types. This tune performs a leak check and sets the detector gain to 300,000. It does not tune the detector gain. Run a fast scan tune when scanning above 10,000 amu/s to improve the mass calibration for high mass ions.
j. CI- Tune—Used to analyze samples with negative CI. The standard NCI tune performs a mass calibration, then tunes the lenses and sets the resolution. This type of tune assumes you are using methane as the CI reagent gas and tunes the system with a 1.0 mL/min flow. This tune does not set the detector gain. The built-in CI- tune will start with the most recent AutoTune_NCI tune file, so have an appropriate tune file saved on the instrument's PC.
k. CI+ Tune—Used to analyze samples with positive CI. The standard PCI tune performs a mass calibration, then tunes the lenses and sets the resolution. This type of tune assumes you are using methane as the CI reagent gas and tunes the system with a 1.5 mL/min flow. This tune does not set the detector gain. The built-in CI+ tune will start with the most recent AutoTune_PCI tune file, so have an appropriate tune file saved on the instrument's PC.
4. Select the Display Report When Complete check box so that you can view the tune report after running the tune.
Note If you are starting with a clean source, first run the EI Initial Tune as a reset tune. After this tune is complete, follow it with your preferred tune.
Note Chemical ionization tunes are very different from the electron ionization tunes. Do not use a CI tune unless your instrument has a CI ion volume and CI reagent gas installed.
Note If the instrument was last used in EI mode and tuned with a high repeller voltage before switching to a clean CI ion Source, a tune file with a low repeller voltage should be loaded in manual tune and saved to the instrument before tuning in CI mode.
Note To add a tune type to the list, see Modifying an Automatic Tune.

3 TuningTuning the Mass Spectrometer
36 TSQ 8000 Evo User Guide Thermo Scientific
Figure 34. Displaying a Report
5. Select the Show Spectra check box to show the spectra while the system is tuning.
6. Click the Start button to begin tuning.
Once the tune completes, your tune report opens in the Tune Results Viewer. If you did not select the Display Report When Complete check box, you can click View Tune Report on the dashboard and view the report.
Note Make sure the power options on your computer are not set to go into Standby mode while you are acquiring data for your tune. Otherwise, it will interrupt your tune.

3 TuningTuning the Mass Spectrometer
Thermo Scientific TSQ 8000 Evo User Guide 37
Figure 35. Sample Tune Report
7. Click Report Options. In the dialog box, select the charts and reports you want to display and change the name of your instrument.
8. Select a mass for Calculate Relative Abundance Using. The default is mass 69, which will reference all masses to mass 69. Some masses may have over 100% abundance. If you do not wish to have a relative abundance above 100%, select Base Peak. This option will select the reference mass as the highest abundance mass in the tune.
9. Click OK.

3 TuningTuning the Mass Spectrometer
38 TSQ 8000 Evo User Guide Thermo Scientific
Figure 36. Tune Report Options
10. To print your tune report, click Print Report to open a print dialog box and print your report.

3 TuningTuning the Mass Spectrometer
Thermo Scientific TSQ 8000 Evo User Guide 39
Figure 37. Printing a Tune Report
In the Tune Results window, you can open tune results, print reports, or change the way you view the report.
11. To save the report, click the Save icon and save it as a Microsoft Excel™ file or an Adobe™ Acrobat™ PDF file.
You may find it useful to compare this tune with a previous tune report of the same tune type. Some changes in peak height are normal, but if the difference is significant, see Troubleshooting.
12. To browse to another tune report on your computer, click Open Tune Results in the top of the window.
13. Click Open to open a previously saved tune report.

3 TuningUpdating Tunes for New RF Lens
40 TSQ 8000 Evo User Guide Thermo Scientific
Figure 38. Loading Tune Results
If the sensitivity and resolution are adequate for running your samples, you are ready to develop or run a method.
Updating Tunes for New RF LensIf you have purchased a new lens 3/RF lens (PN 1R120574-0103), you must update the ion guide frequency in the Manual Tune utility and retune your instrument.
To update the ion guide frequency using the Manual Tune utility
1. Open the TSQ Series Dashboard.
2. Click Manual Tune on the dashboard. See Figure 39.

3 TuningUpdating Tunes for New RF Lens
Thermo Scientific TSQ 8000 Evo User Guide 41
Figure 39. Opening Manual Tune on the TSQ Series Dashboard
3. The Manual Tune utility opens.
4. Select Frequency Tune on the top menu. See Figure 40.
Figure 40. Accessing Frequency Tune
5. From the Device drop-down menu, select Ion Guide. See Figure 41.
Manual Tune
Frequency Tune

3 TuningUpdating Tunes for New RF Lens
42 TSQ 8000 Evo User Guide Thermo Scientific
Figure 41. Locating the Device Menu
6. Click Start. The system will detect the ion guide frequency.
7. When the instrument has finished detecting the ion guide frequency, go to Save | To Instrument on the top menu. A dialog box confirming that the tune settings have been saved to the instrument will open. See Figure 42.
Figure 42. Saving the New Ion Guide Frequency to the Instrument
8. To confirm that the intensities are still correct, select Mass & Resolution Tune on the top menu to go back to the Manual Tune home page.
Device Menu

3 TuningUpdating Tunes for New RF Lens
Thermo Scientific TSQ 8000 Evo User Guide 43
9. Choose 3 from the Spectra drop-down menu. See Figure 43.
Figure 43. Selecting the Correct Number of Spectra to Scan
10. Select EI from the Cal. Gas Level menu. See Figure 44.
Figure 44. Setting the Calibration Gas Level to EI
11. Click Start Scan. Check the intensities for the masses 69, 219, and 502. Set the masses using the Mass drop-down menu below each spectrum. See Figure 45.

3 TuningUpdating Tunes for New RF Lens
44 TSQ 8000 Evo User Guide Thermo Scientific
Figure 45. Checking the Mass Intensities
12. Once you have confirmed the intensities are sufficient for tuning, retune the system.
Note The intensities might be lower than they were at the previous frequency set for the ion guide until the lenses are tuned in AutoTune.

Thermo Scientific TSQ 8000 Evo User Guide 45
4
Creating a Method
Once you have tuned the TSQ 8000 Evo system, you can create a method for each of its components. Use these methods to indicate to the GC/MS system how to collect your data.
Accessing the Method EditorTo create a method for the TSQ 8000 Evo mass spectrometer, the TRACE 1300 or 1310 GC, and your autosampler, open the Method Editor.
Contents
• Accessing the Method Editor
• Creating an Autosampler Method
• Creating a MS Instrument Method
• Creating a GC Method
• Validating and Troubleshooting Methods
Note For information about creating a method for other instruments and software, refer to the appropriate documentation.
Note All of the configured instruments are shown in the left pane of the Instrument Setup window. If your instruments are not shown, you must configure them. See “Configuring Your Instrument” for instructions.

4 Creating a MethodAccessing the Method Editor
46 TSQ 8000 Evo User Guide Thermo Scientific
To access the method editor
• Click Method Editor on the Dashboard.
The Method Editor window opens. See Figure 46. Icons of all connected instruments appear in the left pane. You may only configure one instrument at a time. The bright green arrow on the lower right corner of the instrument icon indicates the active instrument. The current instrument name also appears in the main menu.
Figure 46. Method Editor Window
Instrument Name
Icon Arrow

4 Creating a MethodCreating an Autosampler Method
Thermo Scientific TSQ 8000 Evo User Guide 47
Creating an Autosampler MethodUse the method editor to create a method for the autosampler if you have one.
To create a method for the autosampler
1. In the left pane, select the icon for the autosampler.
The method view opens. See Figure 47.
Figure 47. Autosampler Method
2. Choose one of these three options: GC Liquids, GC Headspace, or SPME.
3. Enter the ID information for your samples. You must fill in any field with an asterisk (*)
a. Injectors—Enter the injection ID into the corresponding injector port.
b. Syringes—Enter the syringe ID information.
c. Wash Station—Enter the wash station ID information.
d. (Optional) Internal Standard/Solvent Stations—Enter ID information for your solvent station or interval standard station.
Note Instructions for setting the most common parameters for the TriPlus RSH Sampling System follow. Refer to your autosampler documentation for more detailed information about settings.

4 Creating a MethodCreating an Autosampler Method
48 TSQ 8000 Evo User Guide Thermo Scientific
e. (Optional) Cooled/Heated Trays—Enter ID information for your primary and, if used, secondary trays.
4. Click Create New Method.
5. Use these instructions to configure the GC Liquids general method settings (see Figure 48):
Figure 48. General GC Liquids Settings on the TriPlus RSH Sampling System
a. Injector Type—Choose Single or Double for each injector.
b. Injection Mode—Choose Basic, Enrichment, Enrichment Needle Solvent Option, Internal Standard Double, Internal Standard Post, Needle Solvent Wash, Solvent Flush Double, or Solvent Flush Post.
c. Rapid Mode—Choose Disable, After Sample Rinse, After Bubble Elimination, or After Sample Asp. in Home.
d. Syringe Type—Enter your syringe volume in μL. Enter the syringe needle length in mm.
e. Sample Volume—Enter the sample volume to be injected into the GC. Typical values are between 0.5 and 5 μL.
f. Plunger Strokes—Select the number of plunger strokes to use when drawing up the sample. Air bubbles in the syringe change the amount of sample injected, which can cause signal variation in different runs. To prevent this from occurring, increase the

4 Creating a MethodCreating an Autosampler Method
Thermo Scientific TSQ 8000 Evo User Guide 49
number of plunger strokes to reduce the chance of an air pocket in your syringe. Typical values are between 3 and 10.
g. Air and filling mode—Choose Auto to use the default or Custom to change the parameters.
h. Sample Viscosity—Select Viscous if your sample is viscous or Non Viscous if your sample is non-viscous. With a viscous sample, the syringe is filled more slowly than if it was non-viscous. Since the amount of time saved is so small, setting this option to Yes might be easier.
i. Sampling Depth in Vial—Select the Bottom Sense check box and enter the height from the bottom of the vial (in mm) at which the tip of the syringe needle will be placed in the sample vial when it is being filled.
j. Injection Depth—Select Standard or Minimum to indicate how the sample is introduced into the GC. If you select Standard, the autosampler inserts the needle all the way into the injection port. If you select Minimum, the autosampler barely enters the injection port.
k. Pre-inj Dwell Time(s)—Use this field to enter the time (in seconds) that the needle will be in the injection port before the plunger injects the sample.
l. Post-inj Dwell Time(s)—Use this field to enter the time (in seconds) that the needle will be in the injection port after the plunger injects the sample.
6. Configure the settings under the Washes tab (see Figure 49):
Figure 49. GC Liquids Washes Settings

4 Creating a MethodCreating a MS Instrument Method
50 TSQ 8000 Evo User Guide Thermo Scientific
a. Number of Solvents—Choose Single or Multiple depending on the number of solvents you will use for your method. You may choose up to four solvents: A, B, C, or D.
b. Wash Station—Choose Standard Wash Station or Large Wash Station. Refer to the autosampler documentation for more information about the wash stations.
c. Pre-injection—Use the Solvent and Cycles fields to set the number of solvent purges that will occur before the autosampler touches your sample. Always include some sample rinses, either before or after injection, to make sure you do not have sample carryover from one injection to the next. Configure the settings so that the syringe is purged with the same solvent that was used in location A, B, C, or D or with solvents A and B or C and D. Typically, there is 0 or 1 cycles of pre-injection purges.
d. Rinse—Use the Rinses list to select the number of times the syringe is rinsed with your sample before each injection. Rinses help ensure the sample being injected is not diluted by the residual rinse solvents. By purging the syringe with your sample before injection, the dilution is minimal. The standard setting is between 1 and 3 rinses. If you have a very limited amount of sample, however, you may want to set this field to 0 to conserve the sample.
e. Post-injection—Use the Solvent and Cycles fields to set the number of solvent purges that will occur after the autosampler touches your sample. You should always have some sample rinses, either before or after injection, to make sure you do not have sample carryover from one injection to the next. You can have the syringe purged with the same solvent that was used in location A, B, C, or D or with solvents A and B or C and D. Typically, there are 1 to 5 cycles of post-injection purges.
Creating a MS Instrument MethodUse the Method Editor to create an acquisition or maintenance method for the TSQ 8000 Evo mass spectrometer.
To create a method for the TSQ 8000 Evo mass spectrometer
1. Click the TSQ Series icon in the left pane to open the method view for this instrument.
2. From the Method Type list, select Acquisition-General or Acquisition-Timed. See Figure 50. An Acquisition method is used to collect data.

4 Creating a MethodCreating a MS Instrument Method
Thermo Scientific TSQ 8000 Evo User Guide 51
Figure 50. TSQ Series Method Type Setup
3. Use the Method Setup pane to set the temperatures and acquisition threshold in General Acquisition mode. See Figure 51 on page 52.
Note The Maintenance method is used to bake out or cool down the instrument during a sequence. This can be useful if you know you want to perform these tasks and you want to do them in an automated way as part of your sequence.

4 Creating a MethodCreating a MS Instrument Method
52 TSQ 8000 Evo User Guide Thermo Scientific
Figure 51. General Acquisition: Setting Temperatures and Acquisition Threshold
a. Set the MS Transfer Line Temperature. This field represents the temperature of the transfer line, which is the tube that contains the column as it leaves the GC oven and enters the TSQ 8000 Evo system. The maximum allowable temperature is 350 °C.
b. Set the Ion Source Temperature. You can enter a value between 0 and 350 °C. The optimal temperature depends on the analyte. Higher temperatures will keep the ion source cleaner, but will lead to increased fragmentation, which may reduce sensitivity.
c. (Optional) Select the Acquisition Threshold check box and enter a value for the minimum peak height for the data file, if needed. If your peak has an intensity that is below this threshold, it will not be stored. This setting may help reduce noise, but it may also alter the reported isotope ratios because the smaller isotope signals will be preferentially reduced.
Method Setup Pane
CAUTION You will damage the column and contaminate the TSQ 8000 Evo instrument if you set the transfer line temperature above the maximum allowed temperature for the column.

4 Creating a MethodCreating a MS Instrument Method
Thermo Scientific TSQ 8000 Evo User Guide 53
d. Select EI or CI from the Ionization Mode pull-down menu.
e. To assign gases to the CI gas ports, open the TSQ 8000 Evo Dashboard and click Instrument Control in the Status tab.
f. Set CI Gas Port A or CI Gas Port B to the appropriate CI gas attached to that port. You may only use one CI Gas Port per method.
Figure 52. Setting the CI Gas Ports
Note Only use CI if you have installed a CI ion volume in the MS and connected CI reagent gas to your system. If you have CI, select a CI Gas Type from the pull-down menu and set the CI Gas Flow. Typical values for Methane CI for NCI are 1.0–1.5 mL/min. For Methane CI for PCI, the gas flows are typically 1.5–2.0 mL/min. Click the Apply to All Groups Button at the top of the method editor. The single value at the top of the method is sent when initializing the MS with the method. See Figure 53.

4 Creating a MethodCreating a MS Instrument Method
54 TSQ 8000 Evo User Guide Thermo Scientific
Figure 53. Acquisition-General CI Settings
4. For Acquisition-General methods only, do the following:
a. In the Run Completion group, select the condition under which the run will end.
– GC Run Time—Select this option if you want the MS run to end when the GC run is complete.
– Probe Run Time—Select this option if you have a probe controller installed and you want the MS run to end with the probe run is complete.
– Stop After—Select this option to set the number of minutes you want the MS to run. The end of the run can be between 0 and 1000 minutes. With this option you can stop the acquisition when all the compounds of interest have eluted, but the GC is still at an elevated temperature to keep the column clean. Thermo Fisher Scientific recommends that you select this option to save burn time on the filament.
b. In the Scans pane, click a scan row to enter scan information under each column. See Figure 54.
Note The following parameters apply only to the Acquisition-General method type only. Acquisition-General is the recommend setting for full-scan only MS methods, or simple SIM or SRM methods. If you need to develop a complex SIM or SRM method with a large compound list or overlapping retention times, refer to the instructions for Acquisition-Timed.

4 Creating a MethodCreating a MS Instrument Method
Thermo Scientific TSQ 8000 Evo User Guide 55
Figure 54. Setting Acquisition-General Scan Information
i. Use the Time (min) column to set the time that the MS begins to acquire the scan group. Set the time for the first group late enough to allow the solvent to move through the system, and early enough to ensure the first analyte will be captured in the segment. Set subsequent segment times so that the start time will occur between compounds of interest. You may set up different types of scans in a single group. The scans will occur in descending order.
Your method may allow sequential full scans and SIM scans of a compound. As an example, in this method, the mass range of 50–300 will be scanned in 0.2 seconds. Immediately after the full scan finishes, the SIM scans begin. The SIM scans occur sequentially. Two different SIM masses, at 43 and 44, will be looked at for 0.05 and 0.08 seconds, sequentially. These simultaneous full scan and SIM scans will begin 2.5 minutes into the GC run. You will get a complete set of scans every 0.342 seconds. At 5 minutes into the GC run, the scans change to a set of SRM scans. The first SRM transition is 292.9 to 257.91 with a collision energy of 20 eV. The second SRM transition is 262.91 to 192.93 with a collision energy of 32 eV. Both SRM scans have a dwell time of 0.05 seconds. You will get a complete set of scans every 0.108 seconds.
Note If some of the following columns are not shown in the Scan pane, you can right-click and display them. You can also reorganize the columns by clicking the heading of a column and dragging it to the left or right.
Note The faster the MS scans, the more data points across a peak it will acquire. However, the precision of individual scans may be reduced.

4 Creating a MethodCreating a MS Instrument Method
56 TSQ 8000 Evo User Guide Thermo Scientific
All of these scans use the most recent AutoTune_EI file. You can also use a specific tune file for each of the scans.
ii. Use the SRM, SIM, or Scan Masses column to tell the MS which masses to scan.
– In full-scan mode, enter the start and end mass separated by a dash. You must put each full-scan range on a separate line.
– For SRM methods, enter precursor masses, product masses, and collision energies of the ions you wish to monitor. Separate scan filters will be created for each SRM transition during acquisition.
– If you would like to combine multiple SRM transitions in a single scan filter, highlight the rows you want to combine and then right-click and select Group SRM Scans | Replace Selected Scans. See Figure 55. You can also use this function to ungroup a group of SRM scans into individual rows.
Figure 55. Grouping SRM Scans
iii. Enter the product ion mass (for SRM methods) in the Product Mass column. The product ion mass is the result of fragmenting the precursor ion with collision gas. If you want to perform a precursor ion scan, enter the mass of the target precursor ion into this column.
Note Each line in a scan must only contain a full-scan range, individual SIM masses, or an SRM transition. Scan types cannot be mixed in a single line. Set up simultaneous scans by giving them the same time in the Time (min) column.
Note Entering a product ion mass changes a scan to SRM.
4 Creating a MethodCreating a MS Instrument Method
Thermo Scientific TSQ 8000 Evo User Guide 57
iv. Use the Neutral Loss Mass column when you want to perform a neutral loss scan. Enter the mass of the target precursor ion in this column. The scan mass range must be at least 2.5 amu wide and must begin at 1 + the precursor ion mass.
v. In the Collision Energy column, enter the collision energy (for SRM methods) in eV. The collision of a precursor ion with the collision gas at a particular energy fragments the precursor ions into product ions. By varying the collision energy, a single precursor ion can be fragmented into several product ions. An SRM transition is defined by a precursor ion being fragmented into a particular product ion mass using a certain collision energy. The Collision Energy column is unusable unless you define a precursor and product ion mass.
vi. In SIM or SRM mode, use the Dwell or Scan Times column to define the amount of time (in seconds) that the MS will look at your SIM ion mass or your SRM product ion mass. If you are in full-scan mode, the Dwell or Scan Times column determines the amount of time to scan across the designated range. Set this value to have 5–20 scans across your GC peak. If you have too few scans, the GC peak area is inaccurate. If you have too many scans, the MS signal becomes less precise. This column must be set to a value between 0.0005 and 5 s for SRM and SIM methods. The default is 0.2 s. For full scan methods, the minimum scan time depends on the mass range so that the scan rate does not exceed 13,000 amu/s.
vii. Use the Tune File Name to select a tune file to be used for this scan. Select the autotune file you created in Chapter 3, “Tuning,” . If you wish to use the same tune file for multiple scans, you can fill down this column by right-clicking on a tune file name.
viii. (Optional) Use the Scan Name column to enter a description of the scan. You may use the name as a label to indicate the compound used with the scan.
ix. Use the SIM Widths column to set the width range of the SIM window. The range of values can be between 0.01 and 10. The default is 1 amu, which means the MS will collect all the ions from your SIM mass ±0.5 amu.
Note The system controls the collision gas so it will be ready when an MS/MS scan is requested.
Note Selecting a tune file to open without a date-time stamp opens the most recent tune of the tune type selected. To use a specific tune file, select a tune file of that prefix with the date-time stamp that you want.
Tip Use a tune file without the date-time stamp to create your method.
Note Scan Name, SIM Widths, Data Type, and Q1 Resolution columns are not shown by default. To view them, right-click one of the column headers to pull up the menu to display the hidden columns

4 Creating a MethodCreating a MS Instrument Method
58 TSQ 8000 Evo User Guide Thermo Scientific
x. Use the Ion Polarity column if you are using CI mode to tell the instrument to generate positive or negative ions. Only use this column if you are using CI mode. In EI mode, this column should always be set to Positive.
xi. Use the Data Type column to select whether you want to collect Profile, Centroid, or Nominal mass spectra. Centroided mass spectra are the most common because they are used by most of the libraries and provide the smallest data files. Profile mass spectra provide detailed mass spectral peaks, which result in large data files. Profile mass spectra are not available for SRM scans. when you want to perform fast scanning (up to 20,000 amu/s), select Nominal from the drop-down list under Data Type.
xii. Use the Precursor (Q1) Resolution column to open the peak width of the precursor mass for SRM scans. The options are Normal, Wide (1.5 at 50%), or Widest (2.5 at 50%). The default setting is Normal, which uses the tuned resolution values from the tune file specified in the Tune File Name column. Selecting Wide or Widest increases the precursor peak width to 1.5 and 2.5 amu (at 50%) respectively. Opening the precursor peak width will increase the ion signal into the collision cell and may improve the sensitivity of your method; however, it may also increase the background noise level.
xiii. Use the Product (Q3) Resolution column to open the peak width of the precursor mass for SRM scans. The options are Normal, Wide (1.5 at 50%), or Widest (2.5 at 50%). The default setting is Normal, which uses the tuned resolution values from the tune file specified in the Tune File Name column. Selecting Wide or Widest increases the precursor peak width to 1.5 and 2.5 amu (at 50%) respectively.
c. In the Groups pane on the right, review the information in each row. See Figure 56. As you create scans in the Scans pane, information in the groups pane is automatically displayed.
Note By default not all columns are displayed in the Groups pane. Right-click a heading to display them. You can also reorganize the columns by clicking the heading of a column and dragging it to the left or right.

4 Creating a MethodCreating a MS Instrument Method
Thermo Scientific TSQ 8000 Evo User Guide 59
Figure 56. Accessing the Groups Pane
i. The Time (min) column indicates the time that the MS begins to acquire data after the GC starts for that group. It is typical to have enough of a time delay for the start of the first group to allow the solvent to get through the column before starting acquisition. The Time column in the group pane cannot be modified. If necessary, modify the scan time in the Scans pane.
ii. The Total Scan Time (sec) column indicates the sum of all the scans in each segment. See Figure 57. The total scan time also contains the stabilization time that occurs between each scan. This method, beginning 2.5 minutes into the GC run, gives you a complete set of scans every 0.342 seconds. At 5 minutes into the GC run, the scanning completely changes. Now the scans will repeat every 0.108 seconds until the GC run is complete. As the total scan time is a calculated value, it is not editable.

4 Creating a MethodCreating a MS Instrument Method
60 TSQ 8000 Evo User Guide Thermo Scientific
Figure 57. Determining Groups Total Scan Time
iii. Use the Chrom Filter On column to enable the chromatographic filter. This filter smooths spectral data as it is acquired, which may increase the signal-to-noise ratio by a factor of two or more. The chromatographic filter is most useful when at least four full scans are acquired across a GC peak. This setting is typically left on.
iv. Use the Chrom Filter Peak Width column to set the peak width to match the width of the GC peak (in seconds). If the peak width is set too large, signal intensity may be reduced. The default value is 1 s.
v. Use the Filament On column to turn the filament on and off in the selected segment. Turning off the filament increases the lifetime of the filament and keeps the ion source clean longer. However, no data is collected. Use this column if you had analytes eluting before the solvent peak. You can create a segment to turn off the filament during the solvent peak to preserve the filament.
vi. Use the Emission Current column to set the emission current used during the acquisition. For optimal analytical performance and stability, use the emission current at which the system was tuned. However, if you want to use a different emission current, clear the Use Tune File Emission Current check box and enter a value in the Emission Current (μA) column. A high emission current will lead to the production of more ions, but the interaction of too many ions in the source can cause a degradation in the resolution and signal. The margin of error is ± 0.5 μA.
vii. Use the Use Last Tuned Detector Gain column to indicate that you want to use the detector gain set in Auto Tune. If you do not need to use the gain set in Auto Tune or saved to the instrument in Manual Tune, then you can set the gain manually. Higher gains give larger signals, but may shorten the lifetime of the detector when concentrated samples are detected.

4 Creating a MethodCreating a MS Instrument Method
Thermo Scientific TSQ 8000 Evo User Guide 61
viii. Use the CI Gas Flow column to set the flow rate of your reagent gas. Click the Apply to All Groups Button at the top of the method editor. The single value at the top of the method is sent when initializing the MS with the method.
Figure 58. Acquisition-General CI Settings
ix. The MS/MS Gain Multiplier column only applies to groups with MS/MS events. The MS/MS gain multiplier only applies if the Use Last Tuned Detector Gain column is selected. The default MS/MS Gain Multiplier is 7 and is intended to give similar signal levels as a SIM scan on the precursor ion. If you enter a specific gain, the MS will use that gain for the SRM scan without the multiplier.
5. The following settings apply to Acquisition-Timed methods only.

4 Creating a MethodCreating a MS Instrument Method
62 TSQ 8000 Evo User Guide Thermo Scientific
Figure 59. Acquisition-Timed Method Settings
a. In the Scans pane above list of scans, select SIM or SRM from the Scan Type list. If you want to link to an external method, click Link to External File. You may link to a .csv or .xml method file.
b. After clicking Link to External File, the SIMBridge dialog box opens. Choose the language of your method file from the Source Locale drop-down menu. See Figure 60.
Note In order to edit the scans within the TSQ 8000 Evo method editor, clear the Link to External File.

4 Creating a MethodCreating a MS Instrument Method
Thermo Scientific TSQ 8000 Evo User Guide 63
Figure 60. Setting the Source Language of Method Files using SIMBridge
c. Browse to your file. See Figure 61.
Figure 61. Linking to an External File using SIM Bridge
d. Click Open to open the method in SIMBridge.
e. If necessary, change the method headings in your original file to match those in the method editor. A green check mark appears when your method is validated. See Figure 62.

4 Creating a MethodCreating a MS Instrument Method
64 TSQ 8000 Evo User Guide Thermo Scientific
Figure 62. Changing Method Headings in SIMBridge
f. Click Open and the external method will be opened in the method editor. See Figure 63.
Figure 63. Viewing a Linked File in the Method Editor
g. If you open an older model TSQ 8000 or a TSQ Duo (if you have a TSQ 8000 Evo system) method, the Instrument Model for Method box appears.
h. Select your model from the drop-down menu in Instrument Model for Method in order to make the imported method compatible with your model.

4 Creating a MethodCreating a MS Instrument Method
Thermo Scientific TSQ 8000 Evo User Guide 65
i. In the Name column, enter the analyte name. If you have linked to an external file, the analyte name located in the first column of your linked file will appear in the first cell in the Name column. Right-click this window to search for an analyte within your method. See Figure 64. This function is useful if you need to edit an analyte in a complex method.
Figure 64. Finding an Analyte in a Method
j. In the RT column, enter retention times for SRM methods. The retention time is the time it takes an analyte to pass from the column inlet to the detector.
k. In the Window (min) column, set the acquisition times. Smaller acquisition windows increase sensitivity but can cause you to miss your peak if set too small. Changing the window size only affects sensitivity if it reduces the number of compounds analyzed in a segment. If the windows do not overlap, you will not notice an improvement by reducing the acquisition window.
l. In the Mass column, enter the precursor ion mass for SRM methods. For SIM methods, enter the mass of the ion you wish to monitor.
m. In the Product Mass column, enter the product ion mass (for SRM methods). The product ion mass is the result of fragmenting the precursor ion with collision gas.
n. In the Collision Energy column, enter the collision energy (for SRM methods) in eV. The collision of a precursor ion with the collision gas at a particular energy fragments the precursor ions into product ions. By varying the collision energy, a single precursor ion can be fragmented into several product ions. An SRM transition is defined by a precursor ion being fragmented into a particular product ion mass using a certain collision energy.
Note The Window (min) column does not appear by default. The Method Editor displays it only when the window optimizer is not active.
Right-click theName Column
to Find anAnalyte in a
Method

4 Creating a MethodCreating a MS Instrument Method
66 TSQ 8000 Evo User Guide Thermo Scientific
o. Use the Ion Polarity column if you are using CI mode to tell the instrument to generate positive or negative ions. Only use this column if you are using CI mode. In EI mode, this column should always be set to Positive.
p. Click the Show Analysis arrow (see Figure 65) to validate your method. A chart appears with all your analytes by name and in order of their retention times. See Figure 66.
Figure 65. Accessing the Show Analysis Feature
Show Analysis Button

4 Creating a MethodCreating a MS Instrument Method
Thermo Scientific TSQ 8000 Evo User Guide 67
Figure 66. Validating a Method
q. Use the scrolling window at the bottom of the screen to view all your analytes’ expected retention times. Resize the window to view more analytes by dragging one side of the window out. As the scrolling window is decreased in size, fewer analytes are shown in the analytes chart. Increasing the size of the scrolling window allows you to view more analytes in your method. If the number of analytes retention times being viewed exceeds 50, an evenly spaced sample of the analytes shows through the window.
You may also click the ladder icon walk your analytes: have the software automatically run through your list of analytes. Click the ladder icon again to stop the process at any time.
r. Open the options menu to select the information you want made available in the analytes window.
Scrolling WindowAnalytes Chart

4 Creating a MethodCreating a MS Instrument Method
68 TSQ 8000 Evo User Guide Thermo Scientific
Figure 67. Choosing Display Options for Analytes
6. Use the right-side panel in Acquisition-Timed mode to make the following adjustments to your method.
a. Use the Scan Settings panel to adjust the following settings. See Figure 68 on page 69.
Tip If your SRM or SIM windows are too congested to achieve the total scan time at the minimum dwell time, the event will be highlighted in orange or red. The orange warning indicates that you might get fewer scans across the peak than you want. The red error indicates that the instrument cannot complete the scans in the time allotted in your method. To correct this, reduce the desired scans across the peak, reduce the acquisition windows, or reduce the minimum dwell time to correct.
AnalytesDisplay Options

4 Creating a MethodCreating a MS Instrument Method
Thermo Scientific TSQ 8000 Evo User Guide 69
Figure 68. Acquisition-Timed Scan Settings
i. The Window Optimization pane allows access to the window optimizer settings. When the optimize button is checked, acquisition windows will be set automatically based on the acquisition window and dwell time targets set in this pane. For complex SRM or SIM methods, such as a method containing more than three hundred SRM transitions, this option will help ensure a method is created that can achieve the requested scans per peak.
Algorithm Details: If the Optimize checkbox is checked, the SRM acquisition windows in the method are set to the Desired Window unless the Desired Min Dwell Time cannot be met with the number of Requested Scans Per Peak. If this occurs, then the acquisition windows are reduced until either the Desired Min Dwell Time is met, or the Minimum Window is reached. If the Minimum Window is reached first, the Minimum Dwell Time is reduced until the Requested Scans Per Peak is achievable. If the absolute minimum dwell time on the instrument, which is 0.5 ms, is reached before the requested points across the peak are achieved, the Minimum Window is lowered until the Desired Scans Per Peak criteria are met or until the absolute allowed minimum window on the instrument is reached, which is 0.24 min. In this very rare case you must reduce the number of Desired Scans Per Peak, increase the Min Baseline Peak Width, or reduce the number of transitions contained in your method before you will be allowed to save your method (see Chapter 7, “Troubleshooting.” ).
Scan Settings

4 Creating a MethodCreating a MS Instrument Method
70 TSQ 8000 Evo User Guide Thermo Scientific
Settings: Optimize is checked by default. When Optimize is checked, you can adjust the settings in the pane to optimize your method. See Figure 68 on page 69. Remove the check from the box if you want to manually input your acquisition windows. The default values for the window optimizer should give reasonable results for normal methods. The default values are:
Desired Min Dwell Time—10 ms
Desired Window—0.6 min
Minimum Window—0.3 min
– Change the minimum dwell time using the Desired Min Dwell Time combo box. If your method has many transitions, you may want to reduce the desired minimum dwell time. Note that the wider the acquisition windows in your method, the shorter the average dwell time will be.
– Change the desired acquisition window in the Desired Window combo box. The desired window is the amount of time to scan for a transition around a given retention time to ensure that compound will be observed. The desired window can be set from 0.24–5 min. Set the window wide enough so that a retention time shift will not cause you to miss any compounds. Include extra time in this window if there is any uncertainty in compound retention times in the method. Note that the longer the dwell time for your compounds, the narrower your acquisition windows will be.
– Change the minimum acquisition window in the Minimum Window combo box. The minimum window can be set from 0.24–5 min. This is the smallest amount of time that should be scanned for a transition around a given retention time so that you are confident the compound will be observed. Set the minimum window to the lowest safe value to prevent compound retention times from drifting outside the acquisition window.
ii. The Time Summary section reports the resulting total scan time, the SRM/SIM time, and lowest dwell time for you method. These values are for information only and not editable.
– The Resulting Total Scan Time is the baseline peak width divided by the number of points desired across the peak. These values should be updated if your method requirements are different from the defaults.
– The SIM/SRM time is the total length of all SIM or SRM scans for each compound in your list. This will match the total scan time unless the method also has a full scan event.
Note If the dwell time limit is reached and the minimum acceptable window is forced below the 0.24 min limit, the method will fail, and a smaller list must be used.

4 Creating a MethodCreating a MS Instrument Method
Thermo Scientific TSQ 8000 Evo User Guide 71
– The Lowest Dwell Time is the actual lowest dwell time achieved by the method settings. When the Optimize check box is selected, if the actual lowest dwell time is considerably lower than the requested dwell time, then the minimum window has been reached, and if the actual lowest dwell time is considerably higher than the requested dwell time, then the requested window has been reached.
iii. Under Peak Width, you can change the minimum baseline peak width and desired scans per peak. These values are used to calculate the SRM/SIM Time. The minimum baseline peak width should be set roughly to the shortest chromatographic peak time in your analysis.
iv. Under SRM Resolution, check the Set Resolution for Each Unique Transition Scan checkbox if you want to adjust the Precursor (Q1) Resolution or Product (Q3) Resolution for individual analytes. If this box is not checked, the settings apply to all compounds in the method.
– Use the Precursor (Q1) Resolution column to set the full width at 50% (FWHM) of the precursor mass for SRM scans. The combo-box options are Normal, Wide (1.5 FWHM), or Widest (2.5 FWHM) for each scan after a precursor mass has been entered. The default setting is Normal, which uses the tuned resolution values from the tune file specified in the Tune File Name column. Opening the precursor peak width increases the ion signal into the collision cell, which might improve the sensitivity of your method; however, it may also increase the background noise level.
– Use the Product (Q3) Resolution column to set the full width at 50% (FWHM) of the product mass for SRM scans. The combo box options are Normal, Wide (1.5 FWHM), or Widest (2.5 FWHM) for each scan after a product mass has been entered. If the product mass is removed from a scan to run a SIM or FS scan event, the Product (Q3) Resolution column returns to the default value of Normal, which uses the tuned peak width at 10% or 50% as specified in the Tune File Name column. Selecting Wide (1.5 FWHM) or Widest (2.5 FWHM) increases the product ion peak width to 1.5 and 2.5 amu FWHM respectively, resulting in an increase of ions reaching the detector. The increase in ions at the detector may improve the sensitivity of your method; however, it may also increase the background noise level, as well as introduce isotopic interference from +/- 1 amu ions.
Note To achieve the highest transition speeds capable on the instrument, the resolution of all transitions must be set to Wide or Widest for both Q1 and Q3 resolution.
Note When the window optimizer is activated the Window, Pre-width, and Post-width columns are no longer available in the compound list editor. If your method is linked to a file or imported from a file with values in these columns, the values are stored in memory and can be recovered by deactivating the window optimizer.

4 Creating a MethodCreating a MS Instrument Method
72 TSQ 8000 Evo User Guide Thermo Scientific
v. Under Acquisition Options, select the Allow for Asymmetric Acquisitions check box to add extra time to the beginning or end of an acquisition window without affecting other timing in your scan. When you select this option, Pre-width and Post-width columns are added to your method. Enter the extra times in these columns.
Select the Allow Dwell Time Prioritization check box to increase the dwell times for selected scans. The choices for each scan are Normal or High. Giving a scan high priority increases its dwell time by the value you set in the High Priority Multiplier box.
vi. Under Full Scan, you indicate if a Full Scan is to be run along with SIM and SRM. The Mass Range, Scan Time, Start and End Time can be set after the Use Full Scan box is checked. The full scan time will reduce the SRM/SIM time without increasing the total scan time. If you only want to use full scan for part of your method, you can enter full-scan start and end times.
b. Use the options in the Instrument Settings panel to further adjust your method.
i. Use Tune File to select a tune file or files to be used for this scan. If you are using EI, only the Tune File(+) pull-down menu is available. If you are using negative CI, select a tune file from the Tune File(-) pull-down menu. Choose AutoTune_NCI to use the most recent negative CI automatic tune file you created in Chapter 3, “Tuning.” If you are using positive CI, select a tune file from the Tune File(+) pull-down menu. Choose AutoTune_PCI to use the most recent positive CI automatic tune file you created in Chapter 3, “Tuning.” The software defaults to the most recent AutoTune_NCI or AutoTune_PCI tune file you created.
ii. In the Detector Gain area, set the detector gain. Select the Use Last Tuned Detector Gain option to indicate that you want to use the detector gain set in Auto Tune. If you do not need to use the gain set in Auto Tune, then you can set the gain manually. Higher gains give larger signals, but may shorten the lifetime of the detector when concentrated samples are detected. To manually set the detector gain, select the Use Specified Detector Gain radio button and enter the desired value in the Detector gain box.
iii. Use the Emission Current box to set the emission current used during the acquisition. For optimal analytical performance and stability, use the emission current at which the system was tuned. However, if you want to use a different emission current, select the Use Specified Emission Current radio button and enter a value in the Emission Current (μA) box. A high emission current will lead to the production of more ions, but the interaction of too many ions in the source can cause a degradation in the resolution and signal. The margin of error is ± 0.5 μA.
Note This option is only available when the method optimizer is not active.
Tip Click the arrow at the top right of the Scan Settings panel to collapse or expand the panel.

4 Creating a MethodCreating a MS Instrument Method
Thermo Scientific TSQ 8000 Evo User Guide 73
Figure 69. Acquisition-Timed Instrument Settings
7. To import a Thermo Scientific™ ISQ™ Series or TSQ Quantum™ Series MS method, choose TSQ Series | Import MS Method. See Figure 70.
Tip Click the arrow at the top right of the Instrument Settings panel to collapse or expand the panel.
Note This will only import the MS part of the method. You must set the GC and autosampler parameters.
Instrument Settings

4 Creating a MethodCreating a MS Instrument Method
74 TSQ 8000 Evo User Guide Thermo Scientific
Figure 70. Importing Methods
8. Choose TSQ Series | Import Timed Scans to import .csv or .xml files of previous methods or from AutoSRM. The software will only load files in valid formats.
9. Choose TSQ Series | Append Timed Scan from File to add scans from previous methods to the end of your open scan list. As above, you may import .csv or .xml files.
10. Choose TSQ Series | Export Timed Scans to export your method as a .csv file. If you prefer editing your methods in spreadsheet applications, you may want to use this option.
11. Choose TSQ Series | Create Compound Data Store Export File to prepare your file for the compound database in the TraceFinder application.
a. To create a new target ion from the list of confirming ions with identical retention times for a compound, select the confirming ion of interest.
Tip Export a timed scan list to see an example of a valid format.

4 Creating a Method
Thermo Scientific TSQ 8000 Evo User Guide 75
Figure 71. Creating a New Target Ion
b. Drag the confirming ion to the compound name at the top of the list.
Figure 72. Moving the Confirming Ion to the Compound Name
c. The confirming ion now appears in the list as a target ion. See Figure 73.
ConfirmingIon
CompoundName
CompoundName

Figure 73. Locating the New Target Ion
d. To add a new confirming ion to a target ion in the list, select the confirming ion of interest. See Figure 74.
Figure 74. Adding a New Confirming Ion to a Target Ion
e. Drag the confirming ion under the target ion of interest. See Figure 75.
New Target Ion
Confirming Ion

4 Creating a Method
Thermo Scientific TSQ 8000 Evo User Guide 77
Figure 75. Moving the Confirming Ion to the Target Ion of Interest
f. The confirming ion appears in the list under the selected target ion. See Figure 76.
Figure 76. Locating the New Confirming Ion
g. Click Create Export File when you are through creating your ion list to export the list to the TraceFinder software compound database.
12. Choose TSQ Series | Create Segment List From Timed Scan List to import a general acquisition method.
13. Choose TSQ Series | View Tune Report to view the latest tune report the method will use. Choose Report Options to open the Report Options dialog box (see Figure 77) and add identifying information to the tune report.
Target Ion
NewConfirming Ion

4 Creating a MethodCreating a GC Method
78 TSQ 8000 Evo User Guide Thermo Scientific
Figure 77. Configuring the Tune Report Options
Creating a GC MethodYou can create a method for the TRACE 1300/1310 Series GC from the Method Editor window.
To create a method for the TRACE 1300/1310 Series GC
1. Click the GC icon in the left pane.
2. Click the Oven tab to set the oven temperatures. See Figure 78. There is always at least one temperature and time in any GC temperature program. In the Initial row, enter the initial temperature, which must be 4 °C (7 °F) above room temperature and less than the maximum operating temperature of your GC column. If you set the initial temperature to a value below this limit, the GC will not reach the initial temperature. If you set the temperature above the limit, the GC column will be damaged. You can set the initial hold time to a value between 0 and 999.99 minutes. The typical initial temperature is at least 10 °C (18 °F) above the boiling point of your sample solvent, and the initial time is usually long enough for the solvent to move through the column.
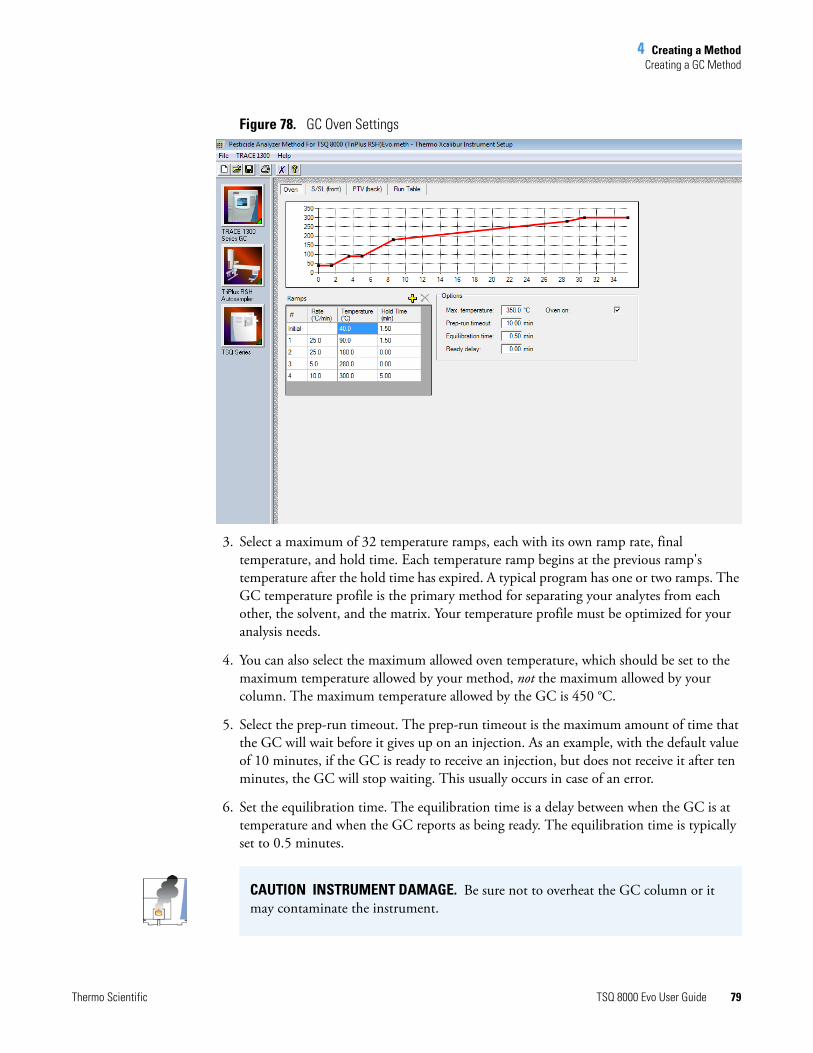
4 Creating a MethodCreating a GC Method
Thermo Scientific TSQ 8000 Evo User Guide 79
Figure 78. GC Oven Settings
3. Select a maximum of 32 temperature ramps, each with its own ramp rate, final temperature, and hold time. Each temperature ramp begins at the previous ramp's temperature after the hold time has expired. A typical program has one or two ramps. The GC temperature profile is the primary method for separating your analytes from each other, the solvent, and the matrix. Your temperature profile must be optimized for your analysis needs.
4. You can also select the maximum allowed oven temperature, which should be set to the maximum temperature allowed by your method, not the maximum allowed by your column. The maximum temperature allowed by the GC is 450 °C.
5. Select the prep-run timeout. The prep-run timeout is the maximum amount of time that the GC will wait before it gives up on an injection. As an example, with the default value of 10 minutes, if the GC is ready to receive an injection, but does not receive it after ten minutes, the GC will stop waiting. This usually occurs in case of an error.
6. Set the equilibration time. The equilibration time is a delay between when the GC is at temperature and when the GC reports as being ready. The equilibration time is typically set to 0.5 minutes.
CAUTION INSTRUMENT DAMAGE. Be sure not to overheat the GC column or it may contaminate the instrument.
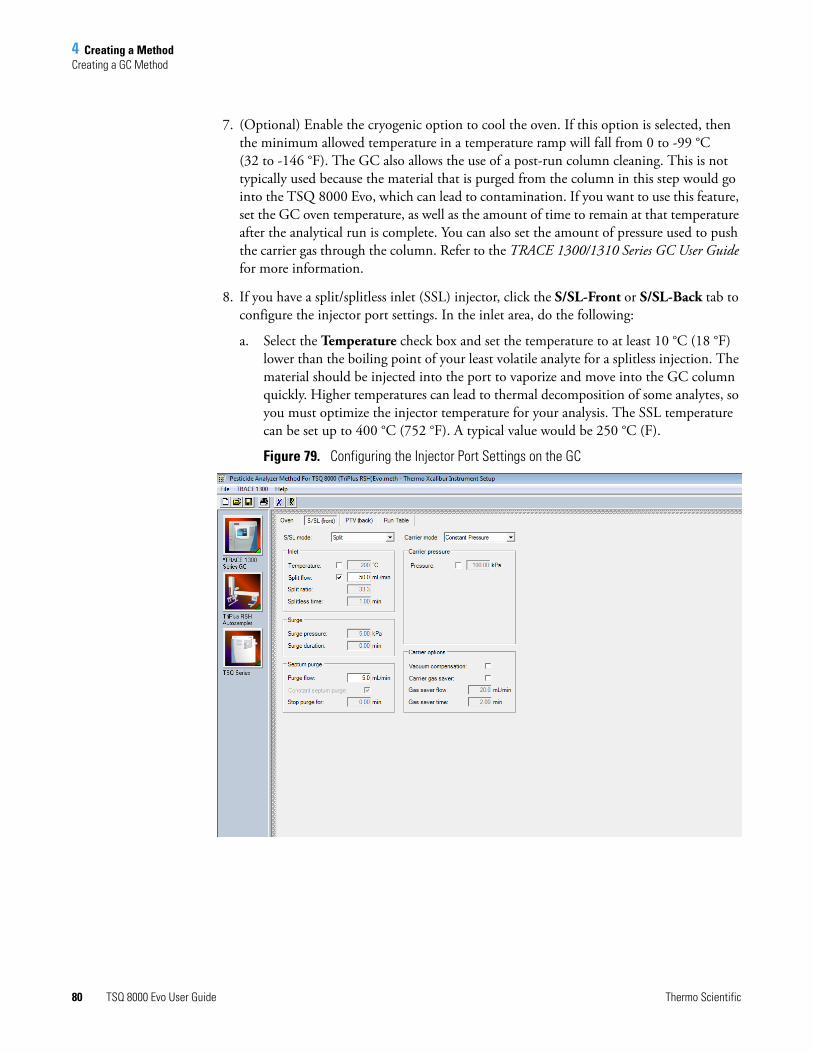
4 Creating a MethodCreating a GC Method
80 TSQ 8000 Evo User Guide Thermo Scientific
7. (Optional) Enable the cryogenic option to cool the oven. If this option is selected, then the minimum allowed temperature in a temperature ramp will fall from 0 to -99 °C (32 to -146 °F). The GC also allows the use of a post-run column cleaning. This is not typically used because the material that is purged from the column in this step would go into the TSQ 8000 Evo, which can lead to contamination. If you want to use this feature, set the GC oven temperature, as well as the amount of time to remain at that temperature after the analytical run is complete. You can also set the amount of pressure used to push the carrier gas through the column. Refer to the TRACE 1300/1310 Series GC User Guide for more information.
8. If you have a split/splitless inlet (SSL) injector, click the S/SL-Front or S/SL-Back tab to configure the injector port settings. In the inlet area, do the following:
a. Select the Temperature check box and set the temperature to at least 10 °C (18 °F) lower than the boiling point of your least volatile analyte for a splitless injection. The material should be injected into the port to vaporize and move into the GC column quickly. Higher temperatures can lead to thermal decomposition of some analytes, so you must optimize the injector temperature for your analysis. The SSL temperature can be set up to 400 °C (752 °F). A typical value would be 250 °C (F).
Figure 79. Configuring the Injector Port Settings on the GC

4 Creating a MethodCreating a GC Method
Thermo Scientific TSQ 8000 Evo User Guide 81
b. Select the Split Flow check box to dilute high concentrations of sample. The split flow is the amount of gas that is swept through the injector to the exhaust port. Higher values will give more dilution. The split flow reduces the amount of contamination that builds up in your system. The split flow ratio is the ratio of the split flow to the carrier gas flow. It is effectively the dilution ratio of the sample. This setting is typically turned on and set to a flow of 50 mL/min. However, more carrier gas is used, so for your analysis, lower split flows may be more acceptable. If you set the split ratio, the software calculates the correct split flow. The reverse is true also.
c. For best results, use the septum purge, which means additional carrier gas will go through the injector. The default purge flow value is 5 mL/min. This reduces the buildup of contaminants in the injector, on the column, and in the TSQ 8000 instrument. If you perform a splitless injection, even if the split flow is set, the split flow turns off for the splitless time. The septum purge turns off for the stop purge time. After these times, the split flow and septum purge are reactivated.
d. Set the carrier mode to Constant Flow, Constant Pressure, Programmed Flow, or Programmed Pressure. The gas flow and the oven temperature work together to determine how well the analytes are separated and how long the analysis will take. If you use constant pressure, as the column is heated in the oven, the flow rate will fall as the viscosity of the carrier gas increases. If you use constant flow, the carrier gas pressure will increase as the column temperature increases to keep the flow constant. Constant flow is more common. Typical flow rates are 1-3 mL/min. The pressure depends on the column length and internal dimensions, so there is not a typical value. Because the outlet of the column is in the TSQ 8000 Evo instrument, which is under vacuum, be sure the vacuum compensation is on to ensure accurate flow rates.
e. (Optional) Under Carrier Pressure, select the check box to use programmed flow or programmed pressure modes. In these modes, you may have up to three flow rates or pressures to use during an analytical run. This feature is not commonly used, but may be necessary if you have a particularly challenging separation.
f. In an effort to reduce the amount of carrier gas used, select the Carrier Gas Saver option under Carrier Gas Options. When used, the split flow is reduced to the gas saver flow after the gas saver time. It is not recommended to use a flow of less than 20 mL/min because contaminants can build up in the injector, column, and TSQ 8000 instrument, which can affect the system performance.
g. Finally, if your analysis requires a higher flow to quickly sweep the analytes into the column, which may be needed with high temperature injectors and thermally labile compounds, use the surge pressure to increase the column flow for the surge duration time.
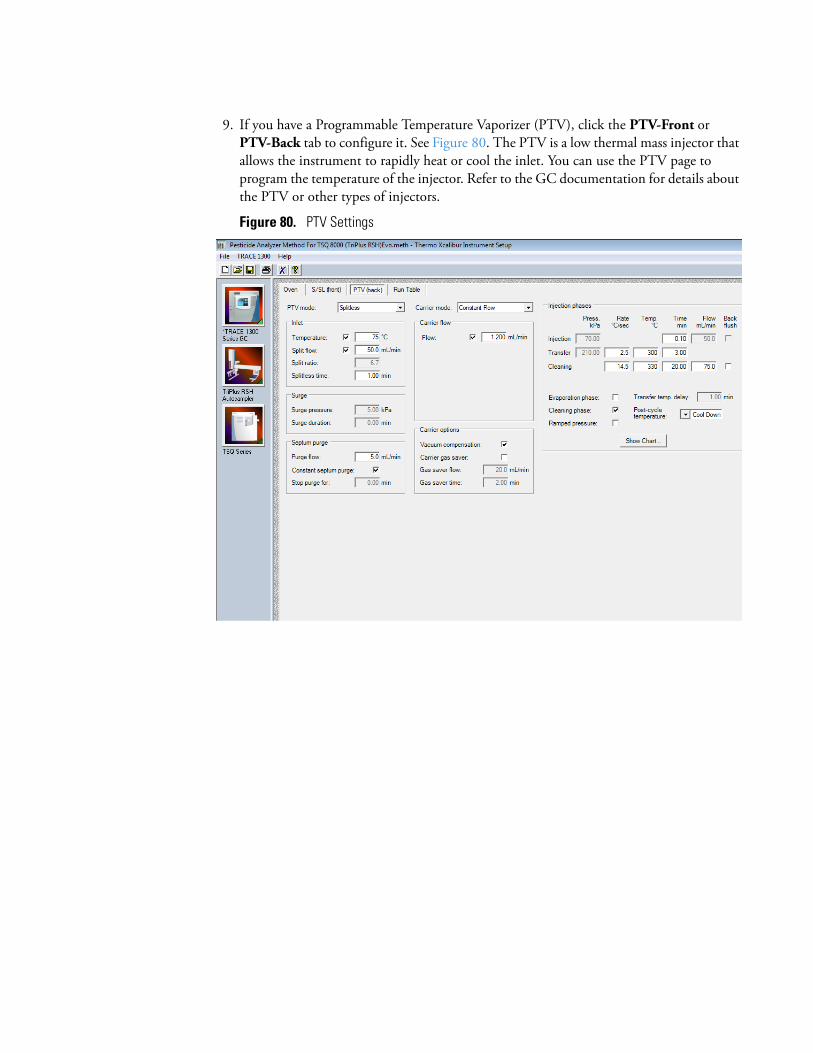
9. If you have a Programmable Temperature Vaporizer (PTV), click the PTV-Front or PTV-Back tab to configure it. See Figure 80. The PTV is a low thermal mass injector that allows the instrument to rapidly heat or cool the inlet. You can use the PTV page to program the temperature of the injector. Refer to the GC documentation for details about the PTV or other types of injectors.
Figure 80. PTV Settings

4 Creating a MethodCreating a GC Method
Thermo Scientific TSQ 8000 Evo User Guide 83
10. Click the Run Table tab to configure how to control external valves and devices. Refer to the GC documentation for more detailed information.
Figure 81. Configuring the GC Run Table.
11. To add an inlet or detector to the Method Editor user interface:
a. Attach the inlet or detector to the GC. Refer to the GC documentation for instructions.
b. Add the inlet or detector to the current instrument configuration. Choose Start | All Programs | Thermo Foundation 3.1 | Instrument Configuration.
c. In the Configured Devices pane, click the TRACE 1300 or TRACE 1310 icon. Click Configure.
Note The user interface reflects the current configuration of your GC. If you add, remove, or change inlets or detectors, redo your instrument method according to the new GC configuration.

Figure 82. Adding a GC Inlet or Detector to the Method Editor
d. In the TRACE 1300/1310 GC Configuration dialog box, select the Inlets or Detectors tab as appropriate.
e. Click Get. The software automatically detects the attached modules. Select the gases as appropriate for your setup. The default Channel names are Channel 1 and Channel 2. You may want to change them to something more descriptive. Your hardware is now configured.

4 Creating a MethodValidating and Troubleshooting Methods
Thermo Scientific TSQ 8000 Evo User Guide 85
12. When you are finished creating methods for each component in your GC/MS-MS system, choose File | Save As... from the main menu or click the button.
Figure 83. Saving a Method
Validating and Troubleshooting MethodsThe window optimizer was created in part to avoid cases where the number of compounds and the width of SRM acquisition windows requested are incompatible with the number of points requested per peak. Although using the window optimizer will avoid most of these problems, extreme cases still exist where your method will fail to validate. In these cases, you can fix this by reducing the desired scans across the peak, reducing the number of scan events, or, if the window optimizer is not selected, by reducing the acquisition windows.
If your method will not validate, a red error icon appears in the Scans pane and an error message that reads Contains Segments with Insufficient Time for All Scans Required appears if you try to save the method. Figure 84 illustrates an unvalidated method.

4 Creating a MethodValidating and Troubleshooting Methods
86 TSQ 8000 Evo User Guide Thermo Scientific
Figure 84. Viewing the Analytes
If orange bars are present, you will get less than the desired scans across the peaks. You can fix this by reducing the desired scans across the peak, reducing the number of scan events, or reducing the acquisition windows. and the resolution will be lower than expected from your method.
To decrease the desired scans per peak
• In the Scan Settings area, reduce the number of scans in the Desired Scans Per Peak box. See Figure 85.
Warning IconMethod Setup

4 Creating a MethodValidating and Troubleshooting Methods
Thermo Scientific TSQ 8000 Evo User Guide 87
Figure 85. Reducing the Desired Scans Per Peak
The method optimizer allows the acquisition window to be reduced by reducing the desired window or the minimum acceptable window. If you see a yellow warning icon, the optimizer is at the minimum acceptable window. Deactivating the method optimizer and reducing this value may resolve the issue.
If you see a red error icon, the window will be at the absolute minimum limit and the only way to resolve the error is to remove transitions, reduce the number of points across the peak, and/or ensure that the baseline peak width is set appropriately.
To reduce the acquisition windows
1. In the Scans pane, go to the first problem analyte and click on the Window (min) column. See Figure 86.
2. Decrease the time.
3. While holding down the shift key, click the last problem analyte in the list.
4. Go back to the first analyte you selected, right-click, and choose Fill Down.
5. If the red error icon still appears, and your method allows it, reduce the acquisition windows further.
Note The method optimizer must be deactivated to perform the following troubleshooting activities.

4 Creating a MethodValidating and Troubleshooting Methods
88 TSQ 8000 Evo User Guide Thermo Scientific
Figure 86. Reducing the Acquisition Windows
When your method validates, the warning icon and the red bars disappear from the method editor. See Figure 87.
Figure 87. Validated Method
You may now save the method as described earlier.
Acquisition Windows

Thermo Scientific TSQ 8000 Evo User Guide 89
5
Optimizing Your Method
If you are not getting the expected results from your method, you can modify it using the following procedures for better results.
Changing the Chromatographic SeparationPeak shapes are defined by the chromatographic conditions. If your peak is too wide, too narrow, or not symmetrical enough, then changing the chromatographic conditions are the best way to improve your method. Start by changing the GC carrier gas flow or oven temperatures (the initial temperature, initial hold time, ramp temperature, final temperature for that ramp, and hold time at that final temperature). These temperatures can be adjusted for each ramp.
Oven changes are strongly dependent on the nature of the compounds you are analyzing. At some point, the GC oven has to be above the boiling point of the compounds you are looking for. If the GC oven is not at the boiling point, the compounds will not volatilize and they will become immobilized. You can change ramp rates to separate coeluting peaks. Refer to the GC user documentation for further suggestions on optimizing chromatographic separation.
Contents
• Changing the Chromatographic Separation
• Finding the Best Way to Make an Injection
• Improving the Way You Prepare Samples
• Changing the Dwell Time or Scan Rate
• Narrowing the Mass Range
• Adjusting the Transfer Line and Ion Source Temperature
• Optimizing an SRM Method
• Optimizing an NCI Tune
• Modifying an Automatic Tune

5 Optimizing Your MethodFinding the Best Way to Make an Injection
90 TSQ 8000 Evo User Guide Thermo Scientific
Finding the Best Way to Make an InjectionAdjusting the way you get the sample from the needle into the column can sometimes improve the results of your data. Try modifying the autosampler method, injecting a different amount of liquid, adjusting the injector port temperature or flow, or changing the speed of your injection. You can also try using a hot or cold needle injection. In some cases, adjusting your injection port liners may give you better results. (For detailed instructions, refer to the user guide for your autosampler.)
Improving the Way You Prepare SamplesAlthough sample preparation adds time and expense to the overall analysis, a more focused method can give you better results. Try extracting your sample in a solvent that increases the solubility of the analytes of interest, but does not increase the solubility of the other compounds. If your method allows it, try switching solvents.
You can also use or change the phase of a solid phase extraction cartridge, which gives you similar results as changing a solvent. You can affect the way you prepare samples by changing the type of cartridge you are using.
Changing the Dwell Time or Scan RateThe precision of your data depends on how well you define your chromatographic peak. Typically, you get good precision when sampling ten times across the chromatographic peak. In a full scan analysis, increasing the scan rate increases the number of times you have sampled across the peak. However, increasing the scan rate too much results in mass spectral noise, which decreases your analytical precision.
In a SIM or SRM analysis, reducing the dwell time will have a similar effect to increasing the scan rate in full scan. The dwell time is a measure of how long the instrument will average a SIM or SRM event.To optimize your scan rate or dwell time, select a value that gives you 8-12 points across a chromatographic peak. In timed acquisition mode this optimization is done automatically, providing you with the longest dwell time or slowest scan rates possible such that all compounds receive the desired scans across a chromatographic peak.
To prioritize the dwell times of the problem analytes
1. In the Acquisition Options area, check Allow Dwell Time Prioritization. See Figure 88.
2. Set the High Priority Multiplier to the desired value.
3. A new Dwell Time Priority option appears in your scan list. The choice are Normal or High. Choosing High multiplies the dwell times by the value set in the previous step.

5 Optimizing Your MethodNarrowing the Mass Range
Thermo Scientific TSQ 8000 Evo User Guide 91
Figure 88. Setting the Dwell Time Prioritization
Narrowing the Mass RangeIn a full scan analysis, by narrowing your mass range, you can look directly at the compounds of interest. However, if you are looking at a large number of compounds that have a broad range of mass fragments, a wide mass range makes sense. To narrow the mass range, refine your scan parameters to a smaller number. A narrower mass range also allows you to decrease the scan rate and get the same chromatographic peak sampling. By breaking your MS method into groups, you can create compound-specific MS settings to optimize your data.
Adjusting the Transfer Line and Ion Source TemperatureIf your transfer line temperature is set too low, the less volatile compounds may get stuck in the transfer line and never make it into the ion source. On the other hand, if your transfer line is too hot, you could damage the column or cause a thermal breakdown in the compounds you are analyzing. Typically, aim for the transfer line temperature to be 10 °C (18 °F) over the highest boiling point of the compounds of interest, but no higher than the maximum safe operating temperature of the column.
Note The total scan time does not change. If prioritizing some dwell times reduces others to less the lowest allowed dwell time for your method, try increasing the acquisition windows.

5 Optimizing Your MethodOptimizing an SRM Method
92 TSQ 8000 Evo User Guide Thermo Scientific
Use the highest ion source temperature setting that allows adequate response for targeted analytes in order to improve response for high-boiling compounds and prevent column bleed and matrix compounds from dirtying the ion source.
Optimizing an SRM MethodThe following actions might improve your results when using an SRM method:
• Use timed SRM to optimize segments automatically and possibly improve dwell time and number of points across the peak.
• Reduce the Retention Time window if possible. If your sample's retention time is well known the scan window can be reduced. If this is in a high-density compound area it can dramatically improve the ion signal and number of points across the peak.
• Use AutoSRM to optimize collision energy and retention times. This can reduce errors in collision energy and improve confidence in retention times to allow shorter windows.
• Choose the optimum fragment ion for study if allowed by your method. Some fragments are higher in intensity and have less interference associated with their transition.
Optimizing an NCI TuneUse the following workflow to adjust the low mass when you create an NCI tune.
1. Click Manual Tune button on the TSQ Series Dashboard.
Figure 89. Finding Manual Tune on the TSQ Series Dashboard
Note The transfer line temperature and ion source temperature should be similar to avoid contaminating the ion source.

5 Optimizing Your MethodOptimizing an NCI Tune
Thermo Scientific TSQ 8000 Evo User Guide 93
2. Go to Load | Tune File to access the manual tune files.
Figure 90. Accessing Manual Tune Files
3. The Manual Tune Files dialog box opens. Select a PCI Tune file.
Figure 91. Loading a PCI Tune File
4. Select the Low Mass tab on the right. Note the ion guide voltage value.

5 Optimizing Your MethodOptimizing an NCI Tune
94 TSQ 8000 Evo User Guide Thermo Scientific
Figure 92. Finding the Ion Guide Voltage Value
5. Load an NCI tune file from Manual Tune.
6. Click the Ion Guide Voltage box under the Low Mass tab to activate it.
Figure 93. Activating the Ion Guide Voltage in a NCI Tune File
7. If the ion guide voltage value is positive, change it to the PCI value you recorded earlier, which should be negative. You may also optimize the ion guide voltage value to any other negative value.
8. Save the changes to the tune file or rename it and save it as a new file.
Ion Guide Voltage Value

5 Optimizing Your MethodOptimizing an NCI Tune
Thermo Scientific TSQ 8000 Evo User Guide 95
Figure 94. Saving a New NCI Tune File
9. Click Save.
10. Close Manual Tune.
To optimize the CI ion volume position using methane
Ion volume placement is the most important setting for CI. Your instrument’s sensitivity is maximized when the ion volume electron hole is properly cleaned inside and outside, but this sensitivity rapidly decays until the hole gets an ion burn. This is normal behavior for your instrument. Lower emission currents cause this decay to happen less rapidly.
1. Scan reagent gas ions in methane PCI in manual tune, making note of the reagent gas intensities for ions at m/z 29 and 41. To do this, select Air for the spectra or one SIM mass 35, width 50.
2. Remove the source and rotate the ion volume in the sleeve and reinsert, repeating until you get the highest m/z 29 for the current flow and filament settings.
3. Once the orientation of the ion volume is optimized, if you are tuning in PCI, adjust the methane flow so that the m/z 41 greater than 20% of 29 at 50 μA and 70 eV. If you are tuning in NCI, use a flow between 1 and 1.5 mL/min methane for most analytes.
4. Perform full scan NCI with the calibration gas on and optimize the repeller voltage. On some instruments a value of 0.5 to 1 V will generate good ion flux while almost no ions will be observed at 0 V. This is due to a possible positive offset of a few tenths of a volt on the repeller electronics.
5. Save the tune file with the appropriate name or save the tune file to the instrument to begin the automated tune.
Note You may also adjust the emission current for the ionization mode and samples. The higher emission currents often work better in NCI, and the lower emission currents often work better in PCI but the optimal emission currents are typically between 25-100 μA.

5 Optimizing Your MethodModifying an Automatic Tune
96 TSQ 8000 Evo User Guide Thermo Scientific
Modifying an Automatic TuneThe MS instrument control software includes a utility that uses certain parameters in the tune types to optimize system performance when generating a tune file. Follow these procedures:
• To modify an automatic tune
• To modify advanced tune settings
To modify an automatic tune
1. Open the TSQ Series Dashboard and click Tune Types.
2. In the Tune Types dialog box, select a tune type to edit and click Copy. See Figure 95.
Figure 95. Tune Types Dialog Box
3. The Tune Type Editor opens. Configure the parameters under the General tab in the Tune Type Editor.
Figure 96. Configuring General Tuning Parameters
a. Name—Enter a name for your tune type.

5 Optimizing Your MethodModifying an Automatic Tune
Thermo Scientific TSQ 8000 Evo User Guide 97
b. Description—Enter details or notes about your tune type.
c. Categories—This is an optional field that allows you to display a subset of tunes under Auto Tune on the dashboard. This is convenient for separating your most frequently used tunes.
d. Type—Select the Tune and Diagnostics option to run a tune with diagnostics or select the Diagnostics Only option if you are creating a diagnostics test.
e. Output Tune Filename Prefix—Enter a prefix to be added to the title of your tune report. It is a good idea to use a descriptive prefix for your tune type. For example, if you are always running BFB reports, you could enter BFB here to distinguish it from other reports you are generating.
f. Starting Tune File—Select a tune file that your tune type will be based on:
• Select Factory to use a default factory-made file on the instrument that can be used to begin tuning an instrument with a clean ion source.
• Select Last Saved to use a tune file saved on the instrument by the most recent successful automatic tune.
• Select a specific tune file if you have a reliable tune file you want to use as a starting point for a new tune file.
g. Perform Mass Calibration—Select this to enable the system to recalibrate all of the masses during a tune.
h. Check Mass Calibration—Select this to enable the system to confirm that your mass calibration is correct rather than performing a mass calibration.
4. Select the Ion Source tab to configure the ion source as follows:
Note Create the new tune type name now. You will not be able to edit the tune type name later. Also, you will not be able to save new parameters to a built-in tune.
Note If you select a tune file with a prefix-only name rather than a tune file with a date-time stamp, the most recent tune file of with that prefix name will be loaded at the start of each tune.
Note If Tune and Diagnostics is selected, you can select only one Mass Calibration option.

5 Optimizing Your MethodModifying an Automatic Tune
98 TSQ 8000 Evo User Guide Thermo Scientific
Figure 97. Configuring the Ion Source Parameters
a. Ionization Mode & Ion Polarity—Use this pull-down menu to select a mode:
• Select EI + to run a tune in Electron Ionization (EI) mode.
• Select CI+ to run a tune in Chemical Ionization (CI) mode and positive ions.
• Select CI- to run a tune in CI mode and negative ions.
b. CI Gas Type (only enabled if you select CI+ or CI-)—Use this pull-down menu to select a gas type, but make sure your selection is the reagent gas attached to your system and that the correct gas port is selected. Methane is commonly used for CI+. Other gases will change the efficiency and energy of the ionization process.
c. Emission Current—Defines the emission current that you use to run subsequent tunes, but not the emission current that is used for data acquisition.
• Tune File—Select this option to use the value in the tune file that you selected on the General tab.
• Default—Select this option to use the default emission current, which is 50 μA.
• Custom—Select this option if you want to use a value other than 50 μA when increasing or decreasing the sensitivity of the instrument. For the emission current, the default is 50 μA. Tune with the same value you are planning to use for your analysis. The use of emission currents above 100 μA may lead to the generation of too many ions in the source and a degradation in resolution.
Note When changing CI gas types or gas port, there is a two minute delay while the reagent gas is purging. During this time, the Busy light will be lit and you have to wait until the light goes off before using the software.

5 Optimizing Your MethodModifying an Automatic Tune
Thermo Scientific TSQ 8000 Evo User Guide 99
d. Electron Energy—Indicates the energy of the electrons that come off the filament.Lowering the electron energy will extend the lifetime of your filament.
• Default—Select this option to use the default electron energy, which is 70 eV.
• Tune File—Select this option to use the value in the tune file you selected in the General tab.
• Custom—Select this option to set the energy of the electrons emitted by the filament. For example, you could change the voltage if you wanted to change the ionization efficiency and fragmentation of the sample. This is typically set to 70 V because the standard EI libraries are based on 70 eV electron beams.
e. Electron Lens Positive Voltage—Allows the electrons to enter the ion volume.
• Default—Select this option to use the default electron lens positive voltage, which is 15 V.
• Tune File—Select this option to use the value used in the tune file that you selected on the General tab.
• Custom—Select this option if you do not want to use the default value for the tune. For the electron lens positive voltage, the default is 15 V. You should tune with the same value you are planning to use for your analysis. This value affects the focusing of the electron beam into the source. If you change your electron energy from 70 eV, this value also changes. This voltage must always be at least 45 V above the voltage applied to the filament. The voltage applied to the filament is the same number, but the opposite sign, of the electron energy.
f. Electron Lens Negative Voltage.
• Default—Select this option to use the default electron lens negative voltage, which is –75 V.
• Tune File—Select this option to use the value used in the tune file that you selected on the General tab.
• Custom—Select this option if you do not want to use the default value for the tune. For the electron lens negative voltage, the default is –75 V. Tune with the same value you are planning to use for your analysis. This value affects how well the electrons are kept from entering the ion source when they are not supposed to. If you change your electron energy from 70 eV, this value also changes. Ensure this voltage is at least 5 V below the voltage applied to the filament.
Note Avoid reducing the electron energy to less than 70 eV. The calibration compound will not be sufficiently ionized for tuning or calibrating at low electron energies.
Note A custom electron energy can be selected in the instrument acquisition method even if it is not used for tuning.

5 Optimizing Your MethodModifying an Automatic Tune
100 TSQ 8000 Evo User Guide Thermo Scientific
g. Set Ion Source Temperature—Select this check box to enable the temperature field. Then enter a value between 0 and 350 °C. The default is 200 °C. The optimal temperature is determined by the molecular structure and weight of the compounds you are analyzing. Heavier compounds require a higher temperature. Tune at the same temperature you will use to run your samples. You should set the temperature as high as possible to keep the ion source clean and maintain the right amount of sensitivity.
5. Click the Targets tab to configure how you want to tune your targets. Target tuning is used to adjust the way the mass spectrometer tunes to meet regulatory requirements. Otherwise, this is an optional setting.
Figure 98. Configuring Tuning Targets
Tune Target Ion Ratios—Select this check box to adjust the ratios based on the results from an injection of tuning compound.
6. Click the Detector tab to configure the detectors. See Figure 99.
Tip If you tune regularly between running sample sets, you can save time waiting for the temperatures to equilibrate by setting the tune temperatures to the same temperature used in your acquisition method.

5 Optimizing Your MethodModifying an Automatic Tune
Thermo Scientific TSQ 8000 Evo User Guide 101
Figure 99. Configuring the Detectors
a. Set Initial Detector Gain—Select this option to set the electron multiplier gain that will be used in tuning the instrument. The gain is the number of electrons generated for every ion that strikes the detector. This is typically set at 3 × 10⁵ electrons per ion. Gains larger than this will generate more electrons per ion, but both the analyte ion and the noise ion signals will be larger. You can also tune to lower gain values, which decreases the signal strength. Lower values also increase the chance that an ion will not be detected.
b. Tune Detector—Select this check box to tune the detector. As the electron multiplier ages, the voltage required for a given gain increases. Depending on your sample load and if your system is leak tight (oxygen is bad for the detector), you should not have to perform this tune very often. Limit to 1–2 times a year.
c. Adjust Detector Sensitivity—Select this check box to tune the detector to generate a consistent area count of a calibration gas ion for the tune report. Because the intensity of the cal gas varies depending on the atmospheric pressure and temperature of the lab, this option results in larger variation in the analytical runs, as compared to using a fixed detector gain. If you use this function, set the initial detector gain to 3 × 10⁵ electrons per ion.
• Mass—Select the calibration gas mass you want to use.
• Intensity—Enter the intensity you want to see on the tune report.
7. Click the Diagnostics tab and select a test to confirm the operational ability of the system. See Figure 100.

5 Optimizing Your MethodModifying an Automatic Tune
102 TSQ 8000 Evo User Guide Thermo Scientific
Figure 100. Setting Diagnostics
8. Click the Report tab configure how you want to view your data
Figure 101. Selecting Data Report Options.
a. Acquire Full-Scan Spectrum—Select this check box to display the full spectrum on your tune report.

5 Optimizing Your MethodModifying an Automatic Tune
Thermo Scientific TSQ 8000 Evo User Guide 103
b. Acquisition Threshold—Enter a minimum peak height for the full scan spectrum on the tune report. If your peak has an intensity that is below this threshold, it will not be stored.
c. SIM Masses—Select masses to be displayed on your tune report. You can select a maximum of five masses, one from each list. At least one mass must be displayed on the report.
9. Once you are finished configuring all the tabs, click Save to save the tune type. Your new tune type appears in the Tune Types window.
10. Click Close to return to the dashboard. You can select the tune type in the automatic tune window.
11. If you want to rename a tune you created, open the Tune Types dialog box by clicking Tune Types on the TSQ Series Dashboard.
a. Select Rename in the Tune Types dialog box.
Figure 102. Renaming a Tune Type
b. The Rename Tune Type dialog box opens. Assign a valid new name to your tune. You will not be able enter a name that is an invalid file name or already in use. See Figure 103.
Tip Factory tunes cannot be altered. If a newly created tune does not perform as expected, you can always go back to a factory tune, copy it, and change the settings as described above. Save the new tune with a new name before closing the Edit Tune Type dialog box.
Note You cannot rename a factory tune.

5 Optimizing Your MethodModifying an Automatic Tune
104 TSQ 8000 Evo User Guide Thermo Scientific
Figure 103. Changing a Tune File Name
c. Click OK.
To modify advanced tune settings
1. To configure the Q1 Lenses, you must select the Show Advanced Settings check box. The lens tune is the main portion of the tune algorithm. In this section you can choose which components to tune, which mass to optimize for the tune, what the range of allowed values is, how to move through the range, how much the signal must change for a new value to be selected, and what (if anything) can be done about the resolution of the peak and any errors that occur. Select the Tune Lenses check box to access the data table. See Figure 104.
Figure 104. Tuning the Q1 Lenses
a. Device—Click in this box to select the component you want to tune according to the settings in the other columns.
Note The following instructions refer to advanced tuning settings that most users will never need to access. Contact your local Thermo Fisher Scientific service organization before adjusting these settings.

5 Optimizing Your MethodModifying an Automatic Tune
Thermo Scientific TSQ 8000 Evo User Guide 105
i. Repeller—Controls how the repeller pushes the ions out of the ionization region. The voltage applied to this component has a very strong effect on the energy of the ion beam, which has a strong effect on the resolution and the intensity. The lower the voltage, the better the resolution. However, higher voltages will prevent ions from striking the repeller surface, which leads to better robustness. A clean system typically tunes from 3 to 8 V, although a dirty system may have the repeller climb as high as 12.5 V. Do not set the repeller any higher.
ii. Lens 1—Controls Lens 1, which is the first of three lenses that the ions see as they leave the ionization region. These three lenses act as a focusing element to maximize the ion beam intensity that is entering the ion guide. This field is typically set between –35 and –50 V.
iii. Lens 2—Controls Lens 2, which is the second of three lenses that the ions see as they leave the ionization region. These three lenses act as a focusing element to maximize the ion beam intensity that is entering the ion guide. This field is typically set between 0 and –15 V.
iv. Lens 3—Controls Lens 3, which is the last of three lenses that the ions see as they leave the ionization region. These three lenses act as a focusing element to maximize the ion beam intensity that is entering the ion guide. This field is typically set between -30 and -35 V.
v. Ion Guide Voltage—Controls the ion guide’s DC offset voltage. It can potentially help focus the ions into the quadrupole while ensuring that neutral noise is eliminated. The voltage on this component is mass dependent and should be set at several different masses. This field is typically set between +1 and –15 V, depending on the mass of the ion.
vi. Ion Guide RF q—Controls the ion guide's RF q (amplitude). This device is mass dependent and should be set at several different masses. This field can be tuned between 0 and 2. This device determines the ion guide RF amplitude tune value which is given as the RF q * (m/z).
vii. Ion Guide RF—(This setting is maintained for compatibility with legacy tune types. For new tune types, Ion Guide RF q is the recommended setting.) Controls the ion guide’s RF voltage. It can potentially help focus the ions into the quadrupole while ensuring that neutral noise is eliminated. The voltage on this component is mass dependent and should be set at several different masses. This field is typically set between 0 and +5 V, depending on the mass of the ion.
viii. Q1 Voltage—Controls the voltage that pulls the ions into the quadrupole. The voltage applied to this component has a very strong effect on the energy of the ion beam, which has a strong effect on the resolution and the intensity. The lower the voltage, the better the resolution. However, higher voltages will pull more ions into the quads, which leads to better signal. This field is typically set between 0 and –5 V.
ix. Q1 Resolution—Adjusts the ratio of the quadrupole DC and RF voltages to create the resolution required for your analysis. You can set the desired peak width at a given mass and whether you measure the width at 10% or 50% of the

peak height. Because there is no static DC voltage involved, the start, stop, and step values are not used.
b. Mass—Click in this box to select the ion to be used for tuning.
c. Start—Enter the starting voltage for the tune. The start voltage must always be less than the stop voltage. For example, –35 is smaller than 0.
d. Stop—Enter the final voltage for the tune.
e. Step—Enter the increment for the tuning range. For example, if you tune from 0-50 in increments of 10 V, then you would set the Step field to 10.
f. Max Width—Enter the maximum allowable width of the ion during the tune.
g. Measure at %—Click in this box to select the location on the peak where you want to measure the maximum width.
• 10—Measures the width at 10% of the peak height.
• 50—Measures the width at 50% of the peak height.
h. Threshold—Enter the change in intensity that has to occur when the tune selects a new voltage. For example, if you set this field to 1.1, the tune will not select a new voltage for that component unless the intensity is 110% of the old intensity. If you set this field to 1, anytime the new voltage has an intensity larger than the old intensity, the tune will select the new intensity.
i. On Error—Click in this box to select how to handle an error in the tune.
• Fail—Stops the tune when an error occurs or if no tune points are found meeting the tune criteria.
• Continue—Allows the tune to continue on to the next device when an error occurs.
j. Entrance lens offset and Exit lens offset—Changing these voltages affects ion acceleration. The default levels will give the best performance; changing the voltages will affect peak resolution.
2. Click the Q1 Resolution tab to configure the resolution of your tune. You must select the Show Advanced Settings check box to access this tab. Selecting this option tunes the
Note If the start and stop values are the same value, the device will be set to that value and ignore the step size. In some tunes, devices are set to a value before tuning them in another line. This presetting is done because ramping devices do not allow the tune to run at values higher than those chosen for higher masses for the same device.
Note If you choose a value less than 1 for ramped devices, the tune steps back in energy until the lower intensity is detected. For example, if you choose 0.8, the device value lower in energy than the device value with the maximum response that gives an intensity closest to 80% of the maximum intensity is chosen.

5 Optimizing Your MethodModifying an Automatic Tune
Thermo Scientific TSQ 8000 Evo User Guide 107
resolution of Quadrupole 1 by itself. This resolution tunes the system at 100 and 1000 amu/s scan rates. You can tune the resolution during a lens tune or you can tune the resolution by itself.
Figure 105. Configuring Q1 Resolution
a. Mass—Click in this box to select the ion to be used for tuning.
b. Peak Width—Enter the target peak width.
c. Measure at %—Click in this box to select the location on the peak where you want to measure the target peak width.
• 10—Measures the width at 10% of the peak height.
• 50—Measures the width at 50% of the peak height.
d. Lens Tune Relation—Click in this box to set the occurrence of the resolution tune parameters before or after a lens tune.
• Before and After—Uses the same resolution parameters before and after a lens tune.
• Before—Uses the resolution parameters before a lens tune.
• After—Uses the resolution parameters after a lens tune.
3. Select the Q3 Lenses tab to configure the Q3 lenses. You must select the Show Advanced Settings check box to access this tab. The lens tune is the main portion of the tune algorithm. In this section you can choose which components to tune, which mass to optimize for the tune, what the range of allowed values are, how to move through the range, how much the signal must change for a new value to be selected, and what (if anything) must be done about the resolution of the peak and any errors that occur.
Note Changing the Q1 lenses or resolution affects the Q3 lenses and resolution.

5 Optimizing Your MethodModifying an Automatic Tune
108 TSQ 8000 Evo User Guide Thermo Scientific
Figure 106. Tuning the Q3 Lenses
a. Q3 Voltage—Controls the voltage that pulls the ions into the quadrupole. The voltage applied to this component will have a very strong effect on the energy of the ion beam, which will have a strong effect on the resolution and the intensity. The lower the voltage, the better the resolution. However, higher voltages will pull more ions into the quads, which leads to better signal. This field is typically set between 0 and –5 V.
b. Resolution—Adjusts the ratio of the quadrupole DC and RF voltages to create the resolution required for your analysis. You can set the desired peak width at a given mass and whether you measure the width at 10% or 50% of the peak height. Because there is no static DC voltage involved, the start, stop, and step values are not used.
c. Mass—Click in this box to select the ion to be used for tuning.
d. Start—Enter the starting voltage for the tune. The start voltage must always be less than the stop voltage. For example, –35 is smaller than 0.
e. Stop—Enter the final voltage for the tune.
f. Step—Enter the increment for the tuning range. For example, if you tune from 0-50 in increments of 10 V, then you would set the Step field to 10.
g. Max Width—Enter the maximum allowable width of the ion during the tune.

5 Optimizing Your MethodModifying an Automatic Tune
Thermo Scientific TSQ 8000 Evo User Guide 109
h. Measure at %—Click in this box to select the location on the peak at which you want to measure the maximum width.
• 10—Measures the width at 10% of the peak height.
• 50—Measures the width at 50% of the peak height.
i. Threshold—Enter the change in intensity that has to occur when the tune selects a new voltage. For example, if you set this field to 1.1, the tune will not select a new voltage for that component, unless the intensity is 110% of the old intensity. If you set this field to 1, anytime the new voltage has an intensity larger than the old intensity, the tune will select the new intensity.
j. On Error—Click in this box to select how to handle an error in the tune.
• Fail—Stops the tune when an error occurs.
• Continue—Allows the tune to continue on to the next device when an error occurs.
k. Entrance lens offset and Exit lens offset—Changing these voltages affects ion acceleration. The default levels will give the best performance; changing the voltages will affect peak resolution.
l. MS/MS Voltages—These overwrite the Q3 voltage tune values when the instrument is in SRM mode. These values are not tuned and are added to the collision energy used in the SRM scan.
4. Click the Q3 Resolution tab to configure the resolution of your tune. You must select the Show Advanced Settings check box to access this tab. Select this option to tune the resolution of Quadrupole 3 by itself. This resolution will tune the system at 100 and 1000 amu/s scan rates. You may also tune at a higher scan rate. You can tune the resolution during a lens tune or you can tune the resolution by itself. See Figure 107.

5 Optimizing Your MethodModifying an Automatic Tune
110 TSQ 8000 Evo User Guide Thermo Scientific
Figure 107. Configuring the Q3 Resolution
a. Mass—Click in this box to select the ion to be used for tuning.
b. Peak Width—Enter the target peak width.
c. Measure at %—Click in this box to select the location on the peak at which you want to measure the target peak width.
• 10—Measures the width at 10% of the peak height.
• 50—Measures the width at 50% of the peak height.
d. Lens Tune Relation—Click in this box to set the occurrence of the resolution tune parameters before or after a lens tune.
• Before and After—Uses the same resolution parameters before and after a lens tune.
• Before—Uses the resolution parameters before a lens tune.
• After—Uses the resolution parameters after a lens tune.
5. Tune High Scan Rate—Select this check box to tune the resolution at a scan rate in addition to the 100 and 1000 amu/s default scan rates.

Thermo Scientific TSQ 8000 Evo User Guide 111
6
Computer Settings
Your TSQ 8000 Evo system includes a computer with all the software needed to operate the instrument.
If you replace the computer in the future, use the information in this chapter to change the computer settings so your TSQ 8000 Evo system and the associated Thermo Scientific software will run correctly. Instructions for installing Thermo Scientific software are included on the software CD shipped with your instrument.
System RequirementsThe TSQ 8000 Evo system requires a Windows 7 32-bit or 64-bit operating system. See “System Requirements” on page xi for a complete list of system requirements.
Computer SettingsThe following computer settings will help prevent communication interruptions in your TSQ 8000 Evo system.
To use the power save feature
1. From the Start menu choose Control Panel | System and Security | Power Options.
2. On the left side, click Change When the Computer Sleeps.
3. For Put the Computer to Sleep, select Never. See Figure 108. You may set the display to turn off at any time. It will not affect the performance of your TSQ 8000 Evo system.
Contents
• System Requirements
• Computer Settings
• Excluding the Xcalibur Directory from Virus Scan

6 Computer SettingsComputer Settings
112 TSQ 8000 Evo User Guide Thermo Scientific
Figure 108. Power Settings for the Computer
To use the virtual memory feature
1. From the Start menu, choose Control Panel | System and Security | System.
2. On the left side of the window, click Advanced System Settings.
3. In the System Properties dialog box, click Settings.
4. In the Performance Options dialog box, click the Advanced tab, and then click Change to open the Virtual Memory window.
5. Confirm that Automatically Manage Paging File Size for All Drives check box is selected. See Figure 109.
Figure 109. Virtual Memory Settings

6 Computer SettingsComputer Settings
Thermo Scientific TSQ 8000 Evo User Guide 113
To confirm the network card firewall settings
1. From the Start menu, choose Control Panel | Network and Internet | System and Security | Windows Firewall | Advanced Settings.
2. In the Actions Panel on the right, (see Figure ), select Properties.
3. In the Windows Firewall with Advanced Security on Local Computer Properties window, select Domain Profile | State | Customize.
Figure 110. Firewall Settings for the TSQ 8000 Evo System Computer
4. In the Protected Connections for the Domain Profile window, make sure that any instrument checkboxes are not checked.
Figure 111. Setting the Network Connections
Actions Panel

6 Computer SettingsExcluding the Xcalibur Directory from Virus Scan
114 TSQ 8000 Evo User Guide Thermo Scientific
Excluding the Xcalibur Directory from Virus ScanIf you are using anti-virus software on your computer, exclude the following folders from scanning:
• C:\Program Files\Thermo\
• C:\Thermo\
• C:\Xcalibur\
Failure to exclude these folders might cause interruptions in data acquisition. If you must, for security reasons, scan all system files, set the virus scans so that they occur when you are not using the instrument to acquire data.

Thermo Scientific TSQ 8000 Evo User Guide 115
7
Troubleshooting
This section contains information to help you diagnose problems within your data. Sometimes, your experience as a scientist will enable you to look at your data and detect that something is wrong either with the instrument or your sample. This chapter describes the most common indications of a problem with a baseline, peak or result.
If there is an issue with the hardware, see the troubleshooting section of the hardware manual.
You can begin troubleshooting by running a tune with diagnostics on the instrument. If you have good ion intensities, good peak shapes, and no air leak, you might want to look first at the GC, autosampler, or carrier gas.
If you have air leaks, locate and address them. Pay particular attention to the transfer line ferrule, vent valve knob, front panel, gas quality, carrier gas vacuum compensation, and vacuum interlock on the mass spectrometer, as well as the inlet on the GC.
If your intensities are too low, make sure carrier vacuum compensation is turned on.
Contents
• Diagnostics Checks
• How to Know When Your System Needs Maintenance
• Investigating Baseline Issues
• Investigating Peak Issues
• Investigating Results Issues
CAUTION ELECTRICAL SHOCK HAZARD: When troubleshooting any issue that requires removing a cover on the instrument, power-off and vent the instrument to avoid possible injury.

7 TroubleshootingDiagnostics Checks
116 TSQ 8000 Evo User Guide Thermo Scientific
If you have no ions in full-scan or SIM mode, do the following:
• Switch filaments.
• Confirm the starting tune file is appropriate for ionization mode or source cleanliness level.
• Confirm the correct ion volume is inserted (EI or CI).
• Verify the ion source is correctly installed.
• Run diagnostic checks (Diagnostics Only tune type)
• Clean the ion source.
If you do not see ions in CI mode:
• Confirm that the CI ion volume is installed.
• Confirm that the reagent gas is connected and turned on.
If you do not see any peaks in SRM scans, do the following:
• Verify the collision gas supply.
• Run diagnostics checks (Diagnostics Only tune type).
• Run a full-scan method to check if your system is functional.
Diagnostics ChecksThe following table provides you with possible corrective actions you can take after failing a diagnostics check on your system.
IMPORTANT When inserting a cold ion source cartridge such as after cleaning or when switching between EI and CI modes, the ion source and lens stack will expand as the source cartridge heats, often pushing the ion volume and lenses away from the rear of the instrument where they are firmly held by the RF Lens spring contacts. To avoid intermittent electrical contacts to the lenses, you should insert the ion source cartridge, wait 30 min for it to get to temperature, then remove and reinsert it. See the hardware manual for instructions on cleaning and inserting the ion source cartridge.
Note If you are unsure about what to do if your system fails a diagnostic, please contact your field service engineer.

7 TroubleshootingHow to Know When Your System Needs Maintenance
Thermo Scientific TSQ 8000 Evo User Guide 117
How to Know When Your System Needs MaintenanceTypically, you will notice that your instrument needs maintenance when you are analyzing your data on the computer. Some of the most common reasons and indications are as follows:
• Contamination—Excessive background in your mass spectra usually indicates that your instrument is contaminated. Use the mass spectrum in the table below to understand the origin of the contamination. Cleaning solvent peaks usually indicate that the ion source cartridge was installed before it completely dried.
• Fingerprints—A series of mass peaks in your data that are 14 amu apart usually indicates fingerprint or other hydrocarbon contamination. To avoid fingerprints, wear clean, lint-free gloves when performing any type of maintenance on a component in the vacuum manifold of the instrument.
• Air Leaks—Higher than normal vacuum pressure or poor sensitivity usually indicates an air leak. Check the last o-ring or ferrule that you installed.
Table 2. Diagnostics and Corrective Actions
Diagnostic Cause of Failure Corrective Action
Communication Check
Unknown Contact your Field Service Engineer.
Frequency Check RF Dip is not correct Run a full tune that will correct for any RF dip problems.
Ensure source cartridge is installed.
Contact your Field Service Engineer.
SRM Efficiency Check
Collision gas is not supplied correctly
Check collision gas tank and pressure.
Q1 is poorly tuned Run an EI SRM tune (not a quick tune).
Lens Continuity Check
Ion source not inserted properly
Remove and reinsert ion source.
Lens plate and/or springs are damaged
Contact your Field Service Engineer.
A wire is disconnected or shorted inside the manifold
Contact your Field Service Engineer.

7 TroubleshootingHow to Know When Your System Needs Maintenance
118 TSQ 8000 Evo User Guide Thermo Scientific
Table 3. Common Contaminants
Ions (m/z) To Monitor Compound Possible Source
13, 14, 15, 16, 17, 29, 41, 57
Methane CI gas
18, 28, 32, 44 or 14, 16, 19 H2O, N2, O2, CO2 or N, O Residual air and water, air leaks, outgassing from Vespel ferrules
69, 100, 119, 131, 169, 181, 214, 219, 264, 376, 414, 426, 464, 502, 576, 614
PFTBA and related ions PFTBA (tuning compound)
31 Methanol Cleaning solvent
43, 58 Acetone Cleaning solvent
78 Benzene Cleaning solvent
91, 92 Toluene or xylene Cleaning solvent
105, 106 Xylene Cleaning solvent
151, 153 Trichloroethane Cleaning solvent
149 Plasticizer (phthalates) Use of vinyl or plastic gloves
Peaks spaced 14 amu apart Hydrocarbons Fingerprints, foreline pump oil, or other hydrocarbons

7 TroubleshootingInvestigating Baseline Issues
Thermo Scientific TSQ 8000 Evo User Guide 119
Investigating Baseline IssuesBehavior Characteristic Cause Remedy
Drifting Baseline General Stationary phase has accumulated in column
Replace the column or cut off the end of the column.
Chromatographic baseline is high
Replace the column or cut off the end of the column.
Carrier gas pressure is too low
Check for leaks in injector or flow path. Replace the carrier gas cylinder if it is empty or low. Increase the pressure if maximum injector pressure in method is greater than carrier line pressure set by regulator. Make sure the vacuum compensation is on.
Carrier gas flow is drifting Check for leaks in injector or flow path. Check the carrier gas tank.
Impurities have accumulated in column
Run solvent blank to remove impieties. If impurities persistent after multiple solvent blanks: Inject solvent from a different source. Change syringe, liner and septum. Clean injector. Check impurity levels in your gas. Use the correct gas purity and filter.
Falling Carrier gas leak in the system
Perform a leak test and tighten the connections to the carrier gas line if leak is found.
Column is baking out Wait for the column to stabilize.
Rising Impurities have accumulated in column
Check impurity levels in the gas source. Use correct gas purity.
Abnormal rise in baseline when oven temperature is high
Impurities have accumulated in column
Recondition or replace the column.

7 TroubleshootingInvestigating Baseline Issues
120 TSQ 8000 Evo User Guide Thermo Scientific
Noisy Chromatographic Peaks
General Excessive column bleed at high oven temperatures
Reduce the column temperature. Bake out the column. Install a high-temperature column.
Install oxygen filters in carrier gas line.Check pneumatic and inlet systems for leaks. Use correct gas purity with low oxygen content.
Column is contaminated or damaged
Condition or replace the column.
Oven temperature is higher than column’s maximum allowable temperature
Reduce oven temperature to the maximum allowable temperature of the column.
Leak at column fittings Find leak. Tighten fittings if loose. Replace ferrule if overtightened.
Transfer line temperature is not set too low.
Behavior Characteristic Cause Remedy

7 TroubleshootingInvestigating Peak Issues
Thermo Scientific TSQ 8000 Evo User Guide 121
Investigating Peak IssuesTable 4. Troubleshooting Peak Issues in Your Data (Sheet 1 of 3)
Behavior Characteristic Cause Remedy
Broadening General Column higher than optimum of column
Reduce the flow. Make sure vacuum compensation is turned on.
Column flow lower than optimum of column
Increase the flow.
Split flow is too low for split injection
Increase the flow to 40-50 ml/min.
Performance of the column has degraded
Test the column at the optimum flow rate.
Injector is dirty Clean or replace the liner.
Ion source is dirty Clean the ion source and tune the instrument.
Column is not far enough into the transferline
The GC column does not extend into the MS source. Use the column measuring tool to confirm column length. If the end of the column is inside the transfer line, an excessive amount of GC effluent will contact the inside wall.
Fronting General Column is overloaded Decrease the injected amount and/or analyte concentrations. Increase the split ratio. Use a column with a thicker film.
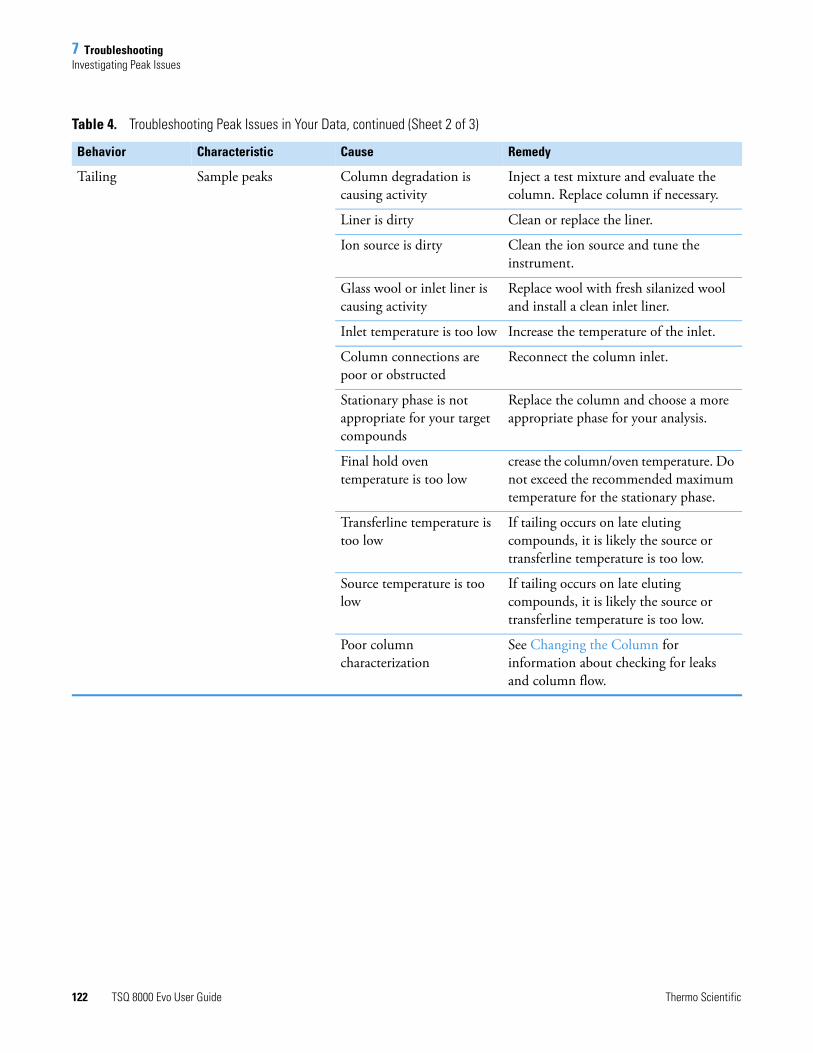
7 TroubleshootingInvestigating Peak Issues
122 TSQ 8000 Evo User Guide Thermo Scientific
Tailing Sample peaks Column degradation is causing activity
Inject a test mixture and evaluate the column. Replace column if necessary.
Liner is dirty Clean or replace the liner.
Ion source is dirty Clean the ion source and tune the instrument.
Glass wool or inlet liner is causing activity
Replace wool with fresh silanized wool and install a clean inlet liner.
Inlet temperature is too low Increase the temperature of the inlet.
Column connections are poor or obstructed
Reconnect the column inlet.
Stationary phase is not appropriate for your target compounds
Replace the column and choose a more appropriate phase for your analysis.
Final hold oven temperature is too low
crease the column/oven temperature. Do not exceed the recommended maximum temperature for the stationary phase.
Transferline temperature is too low
If tailing occurs on late eluting compounds, it is likely the source or transferline temperature is too low.
Source temperature is too low
If tailing occurs on late eluting compounds, it is likely the source or transferline temperature is too low.
Poor column characterization
See Changing the Column for information about checking for leaks and column flow.
Table 4. Troubleshooting Peak Issues in Your Data, continued (Sheet 2 of 3)
Behavior Characteristic Cause Remedy

7 TroubleshootingInvestigating Peak Issues
Thermo Scientific TSQ 8000 Evo User Guide 123
Ghost Peaks General Incomplete elution of previous sample
Increase the final oven program temperature or total run time.Increase the column flow rate.
Carrier gas is contaminated Replace the gas cylinder or filter.
Laboratory glassware has caused contamination
Ensure the glassware is clean and contaminant-free.
Injected sample has decomposed
Decrease the injection port temperature.Use the on-column injection technique.
Injection solution has matrix present
Adequately clean up your sample prior to injection.
Inlet or pneumatics are contaminated
Remove the column and bake out the inlet.Use a high-quality septum.Replace the split vent filter.Install an in-line filter between the pneumatics and the inlet.
Missing Peaks Baseline or background present
Column is broken Replace the column.
Column flow is incorrect Make sure the septa are sealing. Make sure vacuum compensation is turned on.
Backflush settings are incorrect
Set backflush to off until after injection.
Column position in S/SL injector is incorrect (too high)
Check the position of the column.
No baseline or background present
Poor or missing electrical connection
Check the cable connections.
Mass spectrometer is not collecting data
Make sure the tune file is correct.Verify that the Busy light is on during acquisition.Make sure the filament is not burned out.Close Xcalibur, open Instrument Configuration, press the Reset button on the mass spectrometer, wait ten seconds, close Instrument Configuration.
Table 4. Troubleshooting Peak Issues in Your Data, continued (Sheet 3 of 3)
Behavior Characteristic Cause Remedy
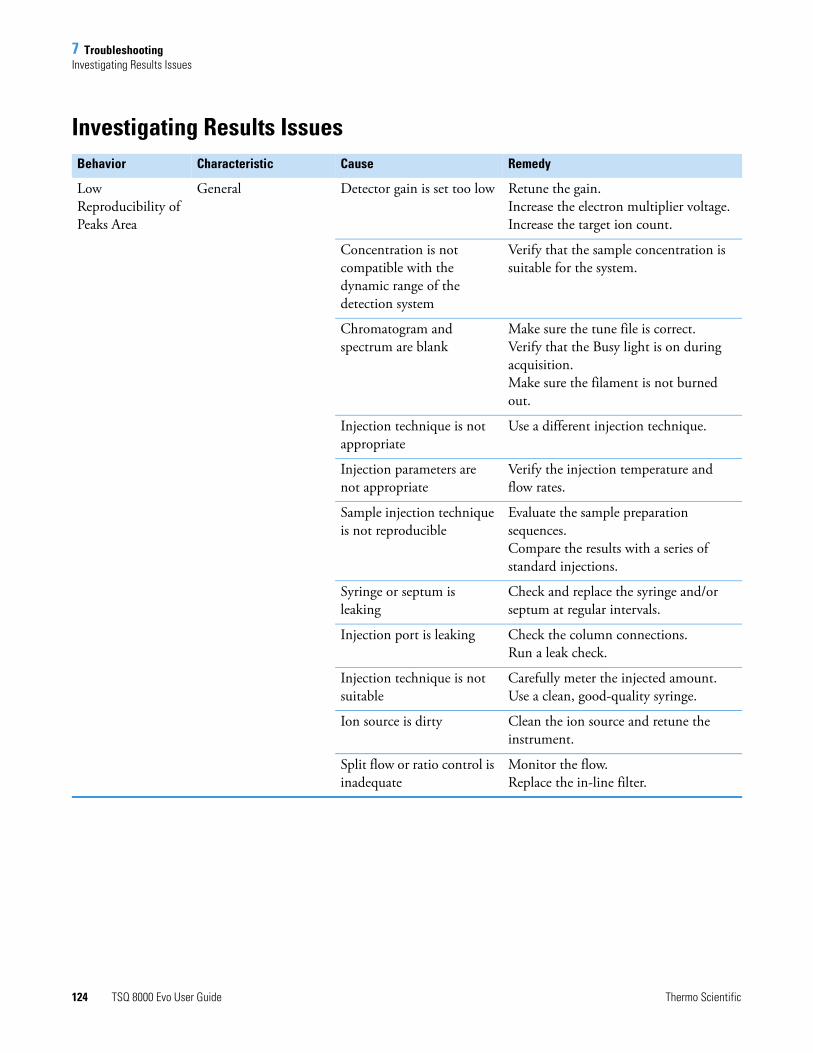
7 TroubleshootingInvestigating Results Issues
124 TSQ 8000 Evo User Guide Thermo Scientific
Investigating Results IssuesBehavior Characteristic Cause Remedy
Low Reproducibility of Peaks Area
General Detector gain is set too low Retune the gain.Increase the electron multiplier voltage.Increase the target ion count.
Concentration is not compatible with the dynamic range of the detection system
Verify that the sample concentration is suitable for the system.
Chromatogram and spectrum are blank
Make sure the tune file is correct.Verify that the Busy light is on during acquisition.Make sure the filament is not burned out.
Injection technique is not appropriate
Use a different injection technique.
Injection parameters are not appropriate
Verify the injection temperature and flow rates.
Sample injection technique is not reproducible
Evaluate the sample preparation sequences.Compare the results with a series of standard injections.
Syringe or septum is leaking
Check and replace the syringe and/or septum at regular intervals.
Injection port is leaking Check the column connections.Run a leak check.
Injection technique is not suitable
Carefully meter the injected amount.Use a clean, good-quality syringe.
Ion source is dirty Clean the ion source and retune the instrument.
Split flow or ratio control is inadequate
Monitor the flow.Replace the in-line filter.

7 TroubleshootingInvestigating Results Issues
Thermo Scientific TSQ 8000 Evo User Guide 125
Poor Sensitivity With increased retention time
Carrier gas flow rate is too low
Increase the carrier gas flow rate.Locate and remove possible obstructions in the carrier gas line.Check the septum for leaks.Check the injector/column ferrules for leaks.
With normal retention time
GC carrier gas line has leaks Run a leak test and correct leaks.
Syringe is leaking during injection
Replace syringe or piston seals, if necessary.
Split injection temperature is too low
Increase the temperature of the injector.
Voltage is not reaching the lens.
Replace the lens plate and springs if damaged. Remove debris or broken pieces in the manifold.Run a lens check diagnostic.Check the connection by removing or inserting the ion source.
Retention Times Low reproducibility DCC is drifting or unstable Monitor the column pressure or flow.Check and replace the controller, if necessary.
Injection technique is inadequate
Pick injection technique suitable for the injector and liner you are using.
Vaporization size of sample inject larger than volume of liner
Reduce the injected amount and/or volume.
Column temperature is unstable
Check the main oven door and cooling flap.Monitor the column temperature.
Behavior Characteristic Cause Remedy


I
Index
Aacquisition methods, purpose of, 50AutoTune, modifying, 96Autotune, using, 31
Bbaseline (troubleshooting)
drifting, 119baseline issues, investigating, 119
Ccentroided data, about, 58chromatographic separation, changing, 89column
changing, 15leak checking, 19temperature, 21
complianceFCC viregulatory vWEEE vii
Configuring the TSQ 8000 Evo, 6contaminants, common, 118contamination, indications, 117
Ddata result issues, investigating, 124diagnostics, selecting tests to run, 101documentation survey xxi
Eelectromagnetic compatibility viEMC compliance v
FFCC compliance vifilament voltage, setting, 99filament, turning off and on, 60fingerprint, indications, 117full-scan mode, about, 57
GGC
creating a method, 78ghost peaks, troubleshooting, 123
Iion source temperature, setting, 52, 100
Lleak, indications, 117leaks, checking for, 19
Mmaintenance, settings, 11mass range, narrowing, 91methods
acquisition, 50creating, 45purpose of, 45
Ppeak height, minimum, 52peak issues, investigating, 121peaks (troubleshooting)
broadening, 121fronting, 121ghost, 123none, 123
Thermo Scientific TSQ 8000 Evo User Guide 127

Index: R
tailing, 122profiled data, about, 58
Rregulatory compliance vresults (troubleshooting)
low reproducibility of peaks area, 124poor sensitivity, 125retention times, 125
retention times, troubleshooting, 125routine maintenance
causes, 117
Ssafety standards vscan rate, optimizing, 90scans, running, 54sensitivity, troubleshooting, 125survey link xxi
Ttailing peaks, troubleshooting, 122temperature of the ion source, 52temperature of the transfer line, 91temperature of transfer line, 52transfer line temperature, setting, 52transfer line, about, 52troubleshooting
about, 115baseline issues, 119peak issues, 121results issues, 124tune report, 39
TSQ 8000creating a method, 45
TSQ 8000 Evochanging the column, 15configuring, 6
TSQ 8000 Evo AutoTune, about, 96tune reports
example report, 39printing, 39settings, 39
tune typesadding, 35CI- tune, 35daily tune check, 33Daily Tune, 34daily tune, 31EI default tune, 34
EI full tune, 35tuning
using Autotune, 31with TSQ 8000 Evo Autotune, 31
Vvoltage of filament, setting, 99
WWEEE compliance vii
128 TSQ 8000 Evo User Guide Thermo Scientific


