Earth Planets Space, 58, 243–252, 2006 Tsunami heights and damage along the Myanmar coast from the December 2004 Sumatra-Andaman earthquake Kenji Satake 1 , Than Tin Aung 1 , Yuki Sawai 1 , Yukinobu Okamura 1 , Kyaw Soe Win 2 , Win Swe 3 , Chit Swe 4 , Tint Lwin Swe 4 , Soe Thura Tun 5 , Maung Maung Soe 6 , Thant Zin Oo 6 , and Saw Htwe Zaw 7 1 Geological Survey of Japan, AIST, Tsukuba, Ibaraki 305-8567, Japan 2 Graduate School of Earth and Environmental Studies, Nagoya University, Nagoya 464-8602, Japan 3 Myanmar Geoscience Society, Yangon, Myanmar 4 Dept. Engineering Geology, Yangon Technological University, Yangon, Myanmar 5 University of Yangon, Yangon, Myanmar 6 Department of Meteorology and Hydrology, Yangon, Myanmar 7 Myanmar Engineering Society, Yangon, Myanmar (Received June 17, 2005; Revised November 4, 2005; Accepted November 4, 2005; Online published February 17, 2006) The tsunami heights from the 2004 Sumatra-Andaman earthquake were between 0.4 and 2.9 m along the Myanmar coast, according to our post tsunami survey at 22 sites in Ayeyarwaddy Delta and the Taninthayi coast. Interviews to coastal residents indicate that the tsunami heights were lower than high tide level in rainy season, probably by storm surge. They also testified that the arrival times were between 2 and 5.5 hours after the earthquake but the reliability may be low because nobody felt ground shaking. Much smaller tsunami than the neighboring Thai coast, where the tsunami heights were 5 to 20 m, explains relatively slighter tsunami damage in Myanmar; the casualties were reported as 71, compared to about 8300 in Thailand. The smaller tsunami was probably due to the fact that the main tsunami source did not extend to Andaman Islands. The tsunami travel times and maximum heights computed from a 700 km long source are basically consistent with the observations. For a nearby tsunami source, the tsunami hazard would be more significant in Myanmar, because coastal houses are unprotected for tsunamis and no infrastructure exists to disseminate tsunami warning information. Key words: Sumatra-Andaman earthquake, tsunami, field survey, Andaman Sea, Myanmar, Thailand. 1. Introduction A giant earthquake occurred off Sumatra Island of In- donesia, at 00:58:53 UTC (07:28 Myanmar time) on De- cember 26, 2004. The earthquake was the largest in size (Mw 9.1–9.3) in the last 40 years in the world, since the 1960 Chilean earthquake (Mw 9.5). The earthquake was an interplate event, caused by the subduction of Indian (or Indo-Australian) plate beneath Andaman (or Burma) mi- croplate (Lay et al., 2005). While the epicenter was lo- cated west off Sumatra Island, the aftershock zone extended through Nicobar to Andaman Islands, the total length being more than 1,000 km (Fig. 1). This earthquake generated a tsunami which devastated the shores of Indonesia, Sri Lanka, South India, Thailand, and as far as the east coast of Africa. More than 200,000 people are thought to have died as a result of the tsunami. The number of victims (International Federation of Red Cross and Red Crescent Societies, 2005), is the largest in Indonesia (∼164,000), followed by Sri Lanka (∼36,000), India (∼16,000), Thailand (∼8,300), and reported as far as from Somalia (∼300). In Myanmar, the damage and casualties (71) are relatively small compared to the above countries. Copyright c The Society of Geomagnetism and Earth, Planetary and Space Sci- ences (SGEPSS); The Seismological Society of Japan; The Volcanological Society of Japan; The Geodetic Society of Japan; The Japanese Society for Planetary Sci- ences; TERRAPUB. For the scientific studies of tsunamis, coastal damage and wave height are the basic data to be collected. This paper is to summarize the survey results to document the effect of tsunami along the Myanmar coast. The post tsunami survey in Myanmar is particularly important to identify (1) why the tsunami damage was much smaller than the neighboring Thai coast, and (2) vulnerability of the Myanmar coast for future tsunamis. 2. Method and Tide Correction The tsunami survey along the Myanmar coastal area was carried out from March 7 through 15, 2005 in Dawei, Kawthaung and Myeik areas along the Taninthayi coast and in Ayeyarwaddy Delta (Fig. 1). In the field, following general procedure was adopted for the survey (Intergovernmental Oceanographic Commission, 1998). (1) collect relevant available data and information, existing maps, charts, tidal records; (2) interview with lo- cal people; (3) take pictures of the present condition; (4) record the location by a portable GPS; (5) measurements of level and distance of maximum flood level; and (6) mea- surements of level and distance of the wave front at the time of measurement. The tsunami heights were measured on the basis of var- ious indicators (Fig. 2), and we rank their reliabilities (Ta- ble 1). When physical evidence such as watermarks or de- bris were found, and endorsed by eyewitness accounts, the 243
Transcript
Earth Planets Space, 58, 243–252, 2006
Tsunami heights and damage along the Myanmar coast from the December2004 Sumatra-Andaman earthquake
Kenji Satake1, Than Tin Aung1, Yuki Sawai1, Yukinobu Okamura1, Kyaw Soe Win2, Win Swe3, Chit Swe4, Tint Lwin Swe4,Soe Thura Tun5, Maung Maung Soe6, Thant Zin Oo6, and Saw Htwe Zaw7
1Geological Survey of Japan, AIST, Tsukuba, Ibaraki 305-8567, Japan2Graduate School of Earth and Environmental Studies, Nagoya University, Nagoya 464-8602, Japan
5University of Yangon, Yangon, Myanmar6Department of Meteorology and Hydrology, Yangon, Myanmar
7Myanmar Engineering Society, Yangon, Myanmar
(Received June 17, 2005; Revised November 4, 2005; Accepted November 4, 2005; Online published February 17, 2006)
The tsunami heights from the 2004 Sumatra-Andaman earthquake were between 0.4 and 2.9 m along theMyanmar coast, according to our post tsunami survey at 22 sites in Ayeyarwaddy Delta and the Taninthayicoast. Interviews to coastal residents indicate that the tsunami heights were lower than high tide level in rainyseason, probably by storm surge. They also testified that the arrival times were between 2 and 5.5 hours after theearthquake but the reliability may be low because nobody felt ground shaking. Much smaller tsunami than theneighboring Thai coast, where the tsunami heights were 5 to 20 m, explains relatively slighter tsunami damagein Myanmar; the casualties were reported as 71, compared to about 8300 in Thailand. The smaller tsunami wasprobably due to the fact that the main tsunami source did not extend to Andaman Islands. The tsunami traveltimes and maximum heights computed from a 700 km long source are basically consistent with the observations.For a nearby tsunami source, the tsunami hazard would be more significant in Myanmar, because coastal housesare unprotected for tsunamis and no infrastructure exists to disseminate tsunami warning information.Key words: Sumatra-Andaman earthquake, tsunami, field survey, Andaman Sea, Myanmar, Thailand.
1. IntroductionA giant earthquake occurred off Sumatra Island of In-
donesia, at 00:58:53 UTC (07:28 Myanmar time) on De-cember 26, 2004. The earthquake was the largest in size(Mw 9.1–9.3) in the last 40 years in the world, since the1960 Chilean earthquake (Mw 9.5). The earthquake wasan interplate event, caused by the subduction of Indian (orIndo-Australian) plate beneath Andaman (or Burma) mi-croplate (Lay et al., 2005). While the epicenter was lo-cated west off Sumatra Island, the aftershock zone extendedthrough Nicobar to Andaman Islands, the total length beingmore than 1,000 km (Fig. 1).
This earthquake generated a tsunami which devastatedthe shores of Indonesia, Sri Lanka, South India, Thailand,and as far as the east coast of Africa. More than 200,000people are thought to have died as a result of the tsunami.The number of victims (International Federation of RedCross and Red Crescent Societies, 2005), is the largest inIndonesia (∼164,000), followed by Sri Lanka (∼36,000),India (∼16,000), Thailand (∼8,300), and reported as faras from Somalia (∼300). In Myanmar, the damage andcasualties (71) are relatively small compared to the abovecountries.
For the scientific studies of tsunamis, coastal damage andwave height are the basic data to be collected. This paperis to summarize the survey results to document the effect oftsunami along the Myanmar coast. The post tsunami surveyin Myanmar is particularly important to identify (1) whythe tsunami damage was much smaller than the neighboringThai coast, and (2) vulnerability of the Myanmar coast forfuture tsunamis.
2. Method and Tide CorrectionThe tsunami survey along the Myanmar coastal area was
carried out from March 7 through 15, 2005 in Dawei,Kawthaung and Myeik areas along the Taninthayi coast andin Ayeyarwaddy Delta (Fig. 1).
In the field, following general procedure was adopted forthe survey (Intergovernmental Oceanographic Commission,1998). (1) collect relevant available data and information,existing maps, charts, tidal records; (2) interview with lo-cal people; (3) take pictures of the present condition; (4)record the location by a portable GPS; (5) measurementsof level and distance of maximum flood level; and (6) mea-surements of level and distance of the wave front at the timeof measurement.
The tsunami heights were measured on the basis of var-ious indicators (Fig. 2), and we rank their reliabilities (Ta-ble 1). When physical evidence such as watermarks or de-bris were found, and endorsed by eyewitness accounts, the
243
244 K. SATAKE et al.: TSUNAMI IN MYANMAR FROM THE 2004 EARTHQUAKE
Fig. 1. Tectonic map showing the epicenter of the Sumatra-Andaman earthquake and aftershock distribution (circles; within 24 hours of the mainshockaccording to U.S.G.S.). The focal mechanism of the mainshock (Harvard CMT solutions) is also shown. Squares are the approximate locations forenlarged maps of Fig. 5. The triangles show the locations where the tide levels are computed for the correction.
reliability is high (rank A). When accounts are based onlyon memories of eyewitness, the reliability is considered aslower (rank B).
For the measurements of the tsunami heights, we used ahandheld laser ranging instrument (Impulse 200LR; LaserTechnology Inc.) and an auto-level equipment. In general,auto-level with the tripod provides more accurate heightsthan the laser instrument without tripod, while the laserinstrument provides quicker results for a long distance(>100 m). For measurements of a short distance, we usedboth instruments. The vertical difference between them isat most 20 cm. For measurements of longer distance, weused only laser instrument.
We measured the height of tsunami traces (debris or wa-termarks) above the sea level at the time of measurement.Tsunami heights were calculated as follows:
T h = (T t − T m) + (T m − T a)
where T h is the estimated tsunami height, T t is the heightof tsunami trace, T m the tidal level at the time of measure-ment, and T a the computed tide at the time of tsunami onDecember 26, 2004 (Figs. 3 and 4). We indicate times in24 hour system (e.g., 13:13) on Myanmar local time whenthey are accurate to the nearest minute.
The tide levels at the times of tsunami arrival and themeasurement were computed on the basis of astronom-ical tides, by using computer program WXTide 32 re-lease 4. The maximum differences of the predicted tideswith a tide table (United Kingdom Hydrographic Office,2004) are within 70 minutes and 50 cm at ebb/flood times.For Ayeyarwaddy Delta, tide was calculated based on pre-dicted tides at Bassein River, Diamond Island (15◦52.0′N,94◦17.0′E). For Dawei coast, the tide was calculated atHeinze Bok, Long Island (14◦24.0′N, 97◦47.0′E). ForMyeik measurements, the tide was calculated at Mergui(12◦26.0′N, 98◦35.9′E). For the measurements aroundKawthaung, tide was calculated at Pulo Basin (9◦59.0′N,98◦29.0′E).
Based on interviews to eyewitnesses, we recorded arrivaltime of the tsunamis (December 26, 2004) at each surveyedsite. As described below, the tsunami arrival times frominterview to coastal residents vary within the neighboringlocations. We felt that such variation in arrival time isdependent on the interviewee, rather than the local effectsof tsunami. We indicate the reported time to the nearestquarter hour with am or pm. We assume that the tsunamiarrival was 11:00 am for the Taninthayi coast and 11:30 forAyeyarwaddy Delta to make the corrections.
K. SATAKE et al.: TSUNAMI IN MYANMAR FROM THE 2004 EARTHQUAKE 245
Tabl
e1.
Sum
mar
yof
surv
ey.
Loc
No
Loc
ality
Lat
.L
ong.
Tsu
nam
iM
easu
red
Type
Bas
edR
elia
bilit
yR
epor
ted
time
Mea
sure
dat
Tid
eA
rriv
alT
ide
01M
aung
mag
anB
each
14.1
435
98.0
908
1.8
2.4
RD
A10
–12,
1420
05/3
/710
:27
2.7
11:0
03.
3
02T
haba
wse
ik-K
yauk
sent
Vill
age
14.1
056
98.0
976
1.6
2.4
IE
B12
–13
2005
/3/7
11:2
52.
511
:00
3.3
03M
yaw
Yit
Gyi
Pago
da14
.087
698
.070
21.
43.
3R
EB
9:30
–11:
3020
05/3
/713
:56
1.4
11:0
03.
3
04Sa
nnL
anV
illag
e13
.939
598
.075
82.
94.
9R
EB
1120
05/3
/716
:40
1.3
11:0
03.
3
05K
yetL
utB
each
13.5
5998
.139
61.
92.
7R
DA
10–1
120
05/3
/812
:30
3.0
11:0
03.
3
06K
yauk
mat
tatV
illag
e13
.581
98.1
514
0.9
2.6
IE
B13
,20
2005
/3/8
14:0
01.
611
:00
3.3
07N
yaw
byin
Vill
age
13.6
348
98.1
459
2.0
4.3
RE
B12
2005
/3/8
15:0
71.
011
:00
3.3
08Pa
laut
onto
nIs
land
10.0
263
98.5
122
2.5
1.8
IW
A10
:30
2005
/3/1
09:
303.
611
:00
2.9
09Y
war
thay
aV
illag
e,Sa
lonl
ayIs
land
10.0
072
98.4
803
1.8
1.0
RE
B11
:15
2005
/3/1
010
:50
3.7
11:0
02.
9
10D
olph
inC
lub,
Salo
nIs
land
9.98
9998
.487
80.
40
RE
B11
:45
2005
/3/1
011
:40
3.3
11:0
02.
9
11K
onna
mai
ngC
haun
gwa
Vill
age
10.0
362
98.5
243
1.9
4.0
IW
A10
:45
2005
/3/1
014
:40
0.8
11:0
02.
9
12Ta
nnyo
pada
Vill
age
10.0
931
98.5
151
1.7
4.4
RE
B10
:30–
11:0
020
05/3
/10
15:5
00.
211
:00
2.9
13T
hiri
mya
ing
Qua
rter
,Kaw
thau
ng10
.000
898
.535
12.
61.
8R
EB
10:3
020
05/3
/10
16:5
40.
211
:00
2.9
14M
yom
aJe
tty,K
awth
aung
9.97
7898
.553
21.
64.
1R
EB
—20
05/3
/10
17:3
00.
411
:00
2.9
15T
hand
erK
yun
Vill
age
12.4
942
98.5
154
0.7
4.4
RE
B11
2005
/3/1
116
:10
0.5
11:0
04.
2
16Pa
htaw
Vill
age
12.4
493
98.5
865
2.2
6.7
RE
B12
2005
/3/1
118
:00
−0.3
11:0
04.
2
17L
ayyi
nK
win
(Air
field
)V
illag
e15
.790
394
.806
40.
60.
7I
EB
11:4
520
05/3
/13
14:4
61.
811
:30
1.9
18K
apye
tTha
ung
Vill
age
15.8
061
94.7
387
2.0
3.5
RE
B11
2005
/3/1
317
:51
0.4
11:3
01.
9
19T
hitP
oke
Vill
age
15.7
833
94.9
784
1.7
2.9
IE
B11
:40
2005
/3/1
48:
570.
711
:30
1.9
20K
aing
Tha
ung
Isla
nd,P
agod
a15
.733
795
.064
21.
91.
8I
WA
11:3
020
05/3
/14
11:4
62.
011
:30
1.9
21K
aing
Tha
ung
Isla
ndV
illag
e15
.733
295
.063
42.
32.
0I
EB
—20
05/3
/14
12:0
52.
211
:30
1.9
22A
ung
Hla
ing
Vill
age
15.7
715
94.9
841.
51.
2I
EB
11:4
520
05/3
/14
14:0
62.
211
:30
1.9
246 K. SATAKE et al.: TSUNAMI IN MYANMAR FROM THE 2004 EARTHQUAKE
(a)(a) (b)(b)
(c)(c) (d)(d)
(a) (b)
(c) (d)
Debris lines
kramretaW
kramretaW
Fig. 2. Indicators of tsunami heights (a) Watermark left on wall surrounding Pagoda (Kating Thaung Island, loc 20). (b) Watermark left inside a houseat Konnamaing Chaungwa Village (loc 11). (c) Debris lines indicating inundation limits of tsunami and rainy season high tide at Maungmagan Beach(loc 1). (d) Eyewitness accounts indicating the tsunami height at Tannyopada Village (loc 12).
Tt: height of tsunami trance Memory of eyewitnessWatermarkDebris
Tm: tide level at the time of measurement
Type of evidence
Measured height
Ta: computed tidal level at the time of tsunami
Th: height of tsunami
Fig. 3. Measurement of tsunami heights and corrections.
Many coastal residents compared the tsunami heightswith the “rainy season high tide level”. From the inter-views, we had an impression that high tide levels are dif-ferent in dry and rainy seasons. However, predicted astro-nomical high tide levels are more or less similar throughouta year. The rainy season high tide may be associated withstorm surges, as we discuss in Section 7.
The survey results are compiled in Table 1 with loca-tion numbers, location names, latitudes and longitudes, thecorrected and measured heights (in meter), type of mea-surements (R for runup and I for inundation), type of ev-idence (D for debris, E for eyewitness accounts, W for wa-termarks), reliability (A is based on physical evidence sup-ported by eyewitness accounts, B is based on eyewitness
accounts only), tsunami arrival times based on interviews,measurement time, computed tide at the measurements (inmeter), assumed tsunami arrival time and calculated tide forthe corrections (in meter).
3. Ayeyarwaddy DeltaA total of six localities (loc 17 to 22) near Pyinsalu were
surveyed (Fig. 5) in Ayeyarwaddy Delta. In this region,25 people lost their lives and 1,130 people were affected.The tsunami arrival times were between 11:00 and 11:45am, according to eyewitness accounts. We assume that thetsunami arrival time was 11:30 am, when the tide level was1.9 m, for the entire region for the correction of tsunamiheights. If the tsunami arrival was 11:00 or 11:45, when
K. SATAKE et al.: TSUNAMI IN MYANMAR FROM THE 2004 EARTHQUAKE 247
0
2
4
0 4 8 12 16 20 240
2
4
0 4 8 12 16 20 0 4 8 12 16 20 24Local Time in Myanmar
Heinze Bok
mm December 26, 2004 March 7, 2005 March 8, 2005
Local Time in Myanmar
Tsunami arrival
Our measurements
Fig. 4. Predicted astronomical tidal changes at Heinze Bok (Long Island), near Dawei. (a) Tidal change on December 26, 2004. An open circle on thecurve shows the time of the tsunami arrival. (b) Tidal change on March 7–8, 2005. Circles on the curve show times of our measurements.
Fig. 5. Tsunami survey locations. Location numbers (in parenthesis) and corrected heights are shown at each location.
248 K. SATAKE et al.: TSUNAMI IN MYANMAR FROM THE 2004 EARTHQUAKE
Fig. 6. Damaged hut in Kapyet Thaung Village.
the tide levels were 2.0 m and 1.8 m, the corrected heightswould be lower or higher by 0.1 m, respectively.
At Layyin Kwin Village (loc 17), 16 huts out of 20 werewashed away and one person was perished by the tsunami(Fig. 6). According to an eyewitness, the tsunami arrived at11:45, when the tide was low, in four waves. The inundationdepth was about 20 cm. Our measurement indicated that thetsunami level was 0.7 m above the sea level, or 0.6 m afterthe correction for tide.
Kapyet Thaung Village (loc 18) is highly affected by thetsunami. Almost all of 130 huts were washed away and 17casualties were reported. Some ships were dragged overinland. According to an eyewitness account, the tsunamiarrived at 11 am in three waves with 15 minute intervals.Our measurement indicated that the tsunami height was3.5 m above the sea level, or 2.0 m after the correction.
Thit Poke (loc 19) is a small village with 332 houses andlocated at about 20 km from Pyinsalu. Two houses weredamaged, but the tsunami caused no injuries or casualties.Interview with local people indicated that the tsunami in-undated about 50 cm above ground at 11:40 am. The mea-sured height was 2.9 m above the sea level and the correctedheight is 1.7 m.
In Kaing Thaung Island Village, a pagoda built near theshoreline was damaged by the tsunami (loc 20). Part of theouter wall was knocked down and watermark was clearlyobserved at 50 cm above the ground level (Fig. 2(a)). ABuddhist monk told us that the tsunami arrived at 11:30am. Our measurement indicated that the tsunami heightwas 1.8 m above the sea level, or 1.9 m after the correc-tion. In this village, 8 casualties and 16 damaged housesare reported. In one of the houses, an eyewitness ac-count indicated that the tsunami height was 1.35 m abovethe ground (loc 21). Our measurement indicated that thetsunami height was 2.0 m above the sea level, or 2.3 m withthe correction.
In Aung Hlaing Village (loc 22), an eyewitness accountindicated that the tsunami arrived at 11:45 am in two waves.The tsunami inundated about 60 cm above the ground. Thesecond wave caused damage to 55 houses without any fa-talities. The measured and corrected tsunami heights were1.2 m and 1.5 m, respectively.
4. Dawei AreaIn the Dawei area, seven sites, loc 01 through loc 07,
were surveyed (Fig. 5). The eyewitness accounts on thetsunami arrival time are variable. We assume that thetsunami arrived at 11:00, when the tide was highest in themorning (3.3 m). If the tsunami arrival was 1.5 hours ear-lier (9:30), then the tide level was 3.0 m. If it was 1.5 hourslater (12:30), then the tide level was 2.9 m. The correctedtsunami height would be higher by 0.3 m and 0.4 m, respec-tively.
On Maungmagan beach (loc 01), two parallel lines ofdebris were observed (Fig. 2(c)). A local fisherman toldus that the lower debris line was formed by the Decembertsunami. He did not feel the earthquake but observed thatthe tsunami arrived at around 2 pm, in a total of four suc-cessive waves with 3 to 4 m height. The tsunami arrived atlow tide and did not exceed the high tide level of the rainyseason (the higher debris line). Another eyewitness indi-cated the tsunami arrival times to be at 10 am and 12 noon.Our measurement indicated that the lower and higher de-bris lines were 2.4 m and 2.9 m above the sea level at thetime of measurement. The dune, to which the tsunami didnot reach, was 4.0 m high. The corrected tsunami heightbecomes 1.8 m.
Thabawseik-Kyauksent Village (loc 02) is a coastal vil-lage of about 200 houses which builds up very close to theshoreline. The interview with a local man confirmed thatthe tsunami reached up to 55 cm above the ground andarrived between about noon and 1 pm in three successivewaves of 20 minute intervals but caused no severe dam-age. The tsunami height was lower than the rainy seasonhigh tide level. Our measurement indicated that the tsunamiheight was 2.4 m above the sea level, or 1.6 m with the cor-rection.
Myaw Yit Gyi Pagoda (loc 03) is situated on a smallgranite island and connected to the opposite bank by a con-crete bridge. A Buddhist monk from the Pagoda told us thathe did not feel the earthquake shaking. Between 9:30 and11:30 am, he observed that three waves coming from differ-ent directions reached at the base of the bridge. The heightof tsunami was larger than the high tide of the rainy sea-son. When receded, the seafloor was exposed about 200 mfrom the shoreline. The tsunami height was measured as3.3 m above the sea level, and the corrected tsunami heightbecomes 1.4 m.
Sann Lan Village (loc 04) is also situated on the sameshoreline, and constituted of almost all wooden houses. Afisherman told us that the tsunami arrived at 11 am in fourtimes with 15 minute intervals, and it was coincidence withlow tide. The measured tsunami height was 4.9 m above thesea level, or 2.9 m after the correction.
Kyet Lut beach (loc 05) is situated on the southern tip ofthe peninsula, 60 km from Dawei. Two parallel debris lineswere observed on the beach. A young man, who seasonallylive in a cottage, reported that the tsunami entered afterlunch (normally, local people take lunch about 10 am), andobserved three times with 3 to 5 minute intervals. The lowerdebris was brought by the tsunami, while the upper one wasby rainy season high tide. Our measurement indicated thatthe lower debris line was 2.7 m above the sea level. The
K. SATAKE et al.: TSUNAMI IN MYANMAR FROM THE 2004 EARTHQUAKE 249
corrected tsunami height becomes 1.9 m.Kyaukmattat Village (loc 06) is situated on the west bank
of the Dawei River. A fisherman mentioned that a recedingwave firstly came around 1 pm and then another high tideappeared at 8 pm. He indicated that the tsunami height wasabout 20 cm above ground on the wooden structure. Ourmeasurement indicated that the tsunami height was 2.6 mabove the sea level, or 0.9 m after the correction.
Nyawbyin Village (loc 07) is situated on the westerncoast of the peninsula in Longlon Township and its curvedbeach is surrounded by two ridges. Most people did notfeel the earthquake but noticed that the tsunami arrivedthere around noon. Our measurement indicated that thetsunami height was 4.3 m above the sea level, or 2.0 m withcorrection.
5. Myeik AreaMyeik is the capital of Taninthayi division and situated
between Dawei and Kawthaung. A chain of small islandscalled Myeik archipelago trending in a north-south direc-tion is situated to the west of Myeik City. Two localities,Thandar Kyun and Pahtaw Villages (loc 15 and 16), weresurveyed (Fig. 5).
The tsunami arrival times by eyewitness accounts differby an hour. For the correction, we assume that the tsunamiarrival time was 11:00, when the calculated tide was 4.2 m.If the tsunami arrival was 12:00, when the tide level was3.7 m, then the corrected tsunami height would be higherby 0.5 m.
At Thandar Kyun Village (loc 15), a man told us that thetsunami arrived at 11 am, in two waves with a 20 minuteinterval. Our measurement of the tsunami levels of twoaccounts were 2.2 m and 4.4 m. Adopting the higher level,the corrected maximum tsunami height becomes 0.7 m.
Pahtaw Village (loc 16) is located on a small island, afew kilometers west of Myeik City. An eyewitness reportedthat the tsunami arrived at 12 noon in three waves. Ourmeasurement indicated that the tsunami height was 6.7 mabove the sea level, or 2.2 m with correction. An eyewitnessindicated that the tide level just before the tsunami arrivalwas 4.6 m, making the tsunami height 2.1 m, very similarto the corrected height.
6. Kawthaung AreaKawthaung City is located at the southern tip of Myan-
mar, and its surrounding islands are reportedly affected bythe tsunami. Total of seven localities along coastal areasof Kawthaung Township, including three islands (loc 8 to10) and western coast of Kawthaung (loc 11 to 14) weresurveyed (Fig. 5).
The eyewitness accounts of tsunami arrival were alsovariable between 10:30 and 11:45 am. We assume that thetsunami arrival was 11:00 (when the tide level was 2.9 m)throughout the Kawthaung area. If the tsunami arrival wasearlier or later by half an hour, i.e., at 10:30 and 11:30when the tide levels were 3.0 m and 2.7 m, then the cor-rected tsunami heights would be either 0.1 m lower or 0.2 mhigher, respectively.
Plautonton Island is a small island close to the west coastof the Kawthaung City, connected by a 600 m long wooden
Fig. 7. Destruction of wooden bridge to Plautonton Island.
bridge. The central part of the bridge was destructed bythe tsunami (Fig. 7). Measurement was taken at PlautontonVillage (loc 08) on the island. Most houses of the village arebuilt on a mudflat, raising floor level up to one or two metersabove the sea surface. Watermark was observed at theinterviewee’s house. A housewife told us that the tsunamiarrived at 10:30 am in three waves with 15 minute intervals.An owner of a grocery store said that two waves with 10–15minute interval arrived. Because the tsunami arrived duringlow tide, there was no severe damage to buildings, but somehousehold wares (rice bags, cloths and TV sets, etc) wereflooded. One person died in this village. Our measurementindicated that the tsunami height was 1.8 m above the sealevel, or 2.5 m after the correction.
At the Ywarthaya Village of Salonlay Island (loc 09), sit-uated to the west of the Plautonton Island, there was nodamage. A young man told us that the tsunami arrived at11:15 am. Three to four waves arrived with 5 minute in-tervals. Our measurement indicated that the tsunami heightwas 1.0 m above the sea level, or 1.8 m after the correction.
The Dolphin Club of Salon Island (loc 10), a few kilome-ters south of Salonlay Island, has a flat shoreline. A youngman told us that tsunami arrived at 11:45 am, in four waveswith 5 minute intervals, and the height was the same as thesea level at the time of our visit. The corrected tsunamiheight becomes 0.4 m, the lowest among the surveyed sites.
Konnamaing Chaungwa Village (loc 11) is a small vil-lage located on the western coast, northwest of KawthaungCity. A bridge over a stream connected to the village ispartly damaged during the incoming tsunami. There weresome damages by the tsunami: one death and destructionof eight houses. There is a clear watermark on a wall ofa house indicating the tsunami height (Fig. 2(b)). Further-more, the tsunami brought up some fishing boats along thestream course and then onto the paddy field. Some tracesof marine mud on telephone post indicated the height ofsplash from the tsunami. According to eyewitness account,the tsunami arrived at 10:45 am. Our measurement indi-cated that the two watermarks were 1.4 and 1.2 m above theground level, or 3.9 m and 4.0 m above the sea level. Thecorrected maximum tsunami height becomes 1.9 m.
250 K. SATAKE et al.: TSUNAMI IN MYANMAR FROM THE 2004 EARTHQUAKE
Fig. 8. Summary of tsunami survey. The left map shows the epicenter of the mainshock (star) and 1-day aftershocks (circles) according to U.S.G.S.The center panel is the corrected tsunami heights. The right panel indicates the tsunami arrival times according to eyewitness accounts. The verticaldashed and dotted lines show the earthquake origin time and the assumed arrival times for the tide corrections, respectively.
Tannyopada Village (loc 12) is a small village of 40houses located along the shoreline northwest of KawthaungCity. A man told us that the tsunami arrived between10:30 and 11 am, in three times with 10 minute intervals(Fig. 2(d)). Our measurement indicated that the tsunamiheight was 4.4 m above the sea level, or 1.7 m after thetide correction. The sea level was very low at the time ofour measurement and the water front was more than 200 moffshore, hence the height measurement was less reliable.
At Thirimyaing Quarter of Kawthaung (loc 13), a youngfemale told us that the tsunami arrived at 10:30 am, in fivetimes with 5 minute intervals. Our measurement indicatedthat the tsunami height was 3.3 m above the sea level. Thecalculated tide levels at the time of measurement and at11:00 of December 26 are 0.2 m and 2.9 m, respectively,hence the corrected height would be 0.6 m. However, thesea level at the time of measurements was very low, andthe measured heights are not reliable. Alternatively, weestimate the tsunami heights using the differential levelsat this location. According to eyewitness accounts, thetsunami height was 1.8 m higher than the high tide levelin the morning of March 10 (our measurement day). Thecalculated high tide of the day is 3.7 m, or 0.8 m higherthan 11:00 of December 26. From these, the tsunami heightis estimated as 2.6 m. We consider that this estimate is morereliable.
Myoma Jetty of Kawthaung (loc 14) is a harbor for do-mestic transportation near the center of Kawthaung City.Many people noticed the abnormal rise of sea level and re-ported that the highest tsunami level was about 30 cm be-low the top of the quay wall. The measured and correctedtsunami heights were 4.1 m and 1.6 m, respectively.
7. Tsunami Heights along the Myanmar CoastSurvey data of the 22 localities (loc 01 to 22) from
Ayeyarwaddy Delta through Taninthayi Division reveal thattsunami heights along the Myanmar coast were between 0.4and 2.9 m and the tsunami arrival times were mostly be-tween 9:30 and 13:00, that is 2 to 5.5 hours after the earth-quake (Table 1 and Fig. 8). The arrival times are highlyvariable in the same area, indicating that the reported timesdepend on the interviewees. Among the eyewitness we in-terviewed, nobody felt the earthquake shaking, making itdifficult to estimate the time between the earthquake andtsunami.
Eyewitness often compared the December tsunamiheights with the “rainy season high tide”; at most locations,the tsunami height was similar or smaller than the “rainyseason high tide” level. As already mentioned in Section 2,however, the calculated high tides are more or less simi-lar throughout a year. Seasonal change in sea level maybe due to seasonal change in the wind direction. In An-daman Sea, the SW wind toward land is dominant in rainy(Monsoon) season (from June through September), whilethe NE wind toward ocean is dominant in other seasons.The sea level change due to the Monsoon wind is about20 cm according to a Global Circulation Model, and thesea level change due to atmospheric pressure change is es-timated as about 10 cm (M. Hirabara, Meteorological Re-search Institute, personal communication). The seasonalchange in Sea Surface Height measured by a satellite in thecentral Andaman Sea is about 10 cm (N. Usui, Meteorolog-ical Research Institute, personal communication). Hencethe amplitudes of sea level change due to Monsoon windare smaller than the daily tidal changes. A possible cause
K. SATAKE et al.: TSUNAMI IN MYANMAR FROM THE 2004 EARTHQUAKE 251
0°
5°
10°
15°
20°N90° 100°E
5°
10°
15°
20°0 5 10 15 20
0 5 10 15 20
Tsunami height, m
tsunami source Thailand
Myanmar
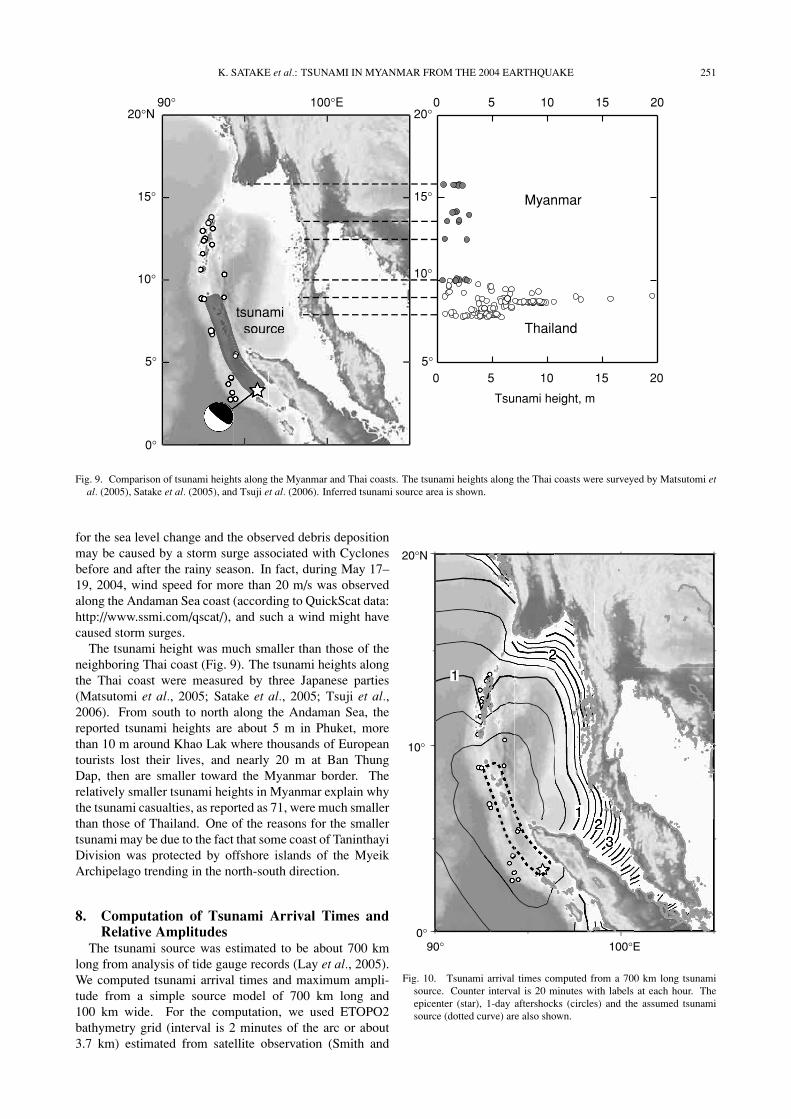
Fig. 9. Comparison of tsunami heights along the Myanmar and Thai coasts. The tsunami heights along the Thai coasts were surveyed by Matsutomi etal. (2005), Satake et al. (2005), and Tsuji et al. (2006). Inferred tsunami source area is shown.
for the sea level change and the observed debris depositionmay be caused by a storm surge associated with Cyclonesbefore and after the rainy season. In fact, during May 17–19, 2004, wind speed for more than 20 m/s was observedalong the Andaman Sea coast (according to QuickScat data:http://www.ssmi.com/qscat/), and such a wind might havecaused storm surges.
The tsunami height was much smaller than those of theneighboring Thai coast (Fig. 9). The tsunami heights alongthe Thai coast were measured by three Japanese parties(Matsutomi et al., 2005; Satake et al., 2005; Tsuji et al.,2006). From south to north along the Andaman Sea, thereported tsunami heights are about 5 m in Phuket, morethan 10 m around Khao Lak where thousands of Europeantourists lost their lives, and nearly 20 m at Ban ThungDap, then are smaller toward the Myanmar border. Therelatively smaller tsunami heights in Myanmar explain whythe tsunami casualties, as reported as 71, were much smallerthan those of Thailand. One of the reasons for the smallertsunami may be due to the fact that some coast of TaninthayiDivision was protected by offshore islands of the MyeikArchipelago trending in the north-south direction.
8. Computation of Tsunami Arrival Times andRelative Amplitudes
The tsunami source was estimated to be about 700 kmlong from analysis of tide gauge records (Lay et al., 2005).We computed tsunami arrival times and maximum ampli-tude from a simple source model of 700 km long and100 km wide. For the computation, we used ETOPO2bathymetry grid (interval is 2 minutes of the arc or about3.7 km) estimated from satellite observation (Smith and
Fig. 10. Tsunami arrival times computed from a 700 km long tsunamisource. Counter interval is 20 minutes with labels at each hour. Theepicenter (star), 1-day aftershocks (circles) and the assumed tsunamisource (dotted curve) are also shown.
252 K. SATAKE et al.: TSUNAMI IN MYANMAR FROM THE 2004 EARTHQUAKE
Fig. 11. Distribution of maximum tsunami heights computed from a 700km long tsunami source. The assumed source region is also shown.
Sandwell, 1997). The tsunami travel times were com-puted on the basis of Huygens’ principle, using softwarettt (tsunami travel time) version 2.2. The maximum ampli-tudes were computed by using finite-difference method ofthe linear long-wave equation (e.g., Satake, 2002).
The computed tsunami travel times (Fig. 10) shows thatthe tsunami travel times to the Myanmar coast are 2.5 hoursor more, indicating that the first tsunami was expected ataround 10 am. Because of lack of ground shaking and therelatively small size of tsunami, coastal residents might nothave noticed the tsunami at the first arrival.
The tsunami source extending in the north-south direc-tion affects the amplitude distribution. Figure 11 showsthe distribution of computed maximum amplitudes. Thetsunami amplitudes are larger in the northeast direction to-ward Phuket and southwest direction toward Maldives. Thecomputed tsunami amplitudes are relatively smaller alongthe Myanmar coast. The amplitudes are slightly large offAyeyarwaddy Delta, probably because the shallow delta ex-tends to offshore to cause concentration of tsunami energy.
9. ConclusionThe tsunami heights from the 2004 December earthquake
were not more than 3 m along the Myanmar coast, whichbrought relatively moderate tsunami damage to Myanmarcompared with other countries such as Indonesia, Thai-land, Sri Lanka and India. Numerous houses, includingseasonal huts, are built along the Myanmar coasts without
any protection for tsunamis. Our interviews indicate thatthe people did not feel earthquake in Taninthayi Divisionor in Ayeyarwaddy Delta. The only way to notify peopleabout the tsunami danger is through Tsunami Warning Sys-tem. However, infrastructure to disseminate the warninginformation is rather poor in Myanmar. In addition, coastalresidents in most surveyed localities live on flat land alongthe coast, especially in the Ayeyarwaddy Delta, and thereis no higher ground to evacuate. In order to prevent futuretsunami hazards, evaluation of earthquake and tsunami po-tential in the northern extension of the Sunda subductionzone is needed. Study of historic and prehistoric tsunamievents would be necessary for such evaluation.
Acknowledgments. Myanmar Department of Meteorology andHydrology helped the Japanese scientists to visit Myanmar. Theencouragement of the director general, San Hla Thaw, and thedeputy director general Tun Lwin, and support by other offi-cers and staffs, including those in the field offices of Dawei,Kawthaung and Myeik, were very helpful. Myanmar Engineer-ing Society provided official invitation and logistic arrangementof the trip. We are grateful to the Chairman U Than Myint forhis continuous support. Advices from members of Yangon Uni-versity, Yangon Technological University, Myanmar GeoscienceSociety and Myanmar Engineering Society are greatly appreci-ated. Many people in the field helped our survey. In particular,Tin Hlaing (the former Township Administration Officer) accom-panied for the surveys in Dawei, Kawthaung and Myeik areas andhelped us arrange local logistics. The survey was supported bySpecial Coordination Funds for Promoting Science and Technol-ogy, from Japanese Ministry of Education, Sports, Culture, Sci-ence and Technology. About the seasonal change in wind and sealevel in Myanmar, Drs. Okada, Yamazaki, Nakazawa, Hirabaraand Usui at Meteorological Research Institute provided valuableinformation.
ReferencesIntergovernmental Oceanographic Commission, Post-tsunami Survey Field
Guide, Manuals and Guides No. 37, 62 pp., UNESCO, 1998.International Federation of Red Cross and Red Crescent Societies, World
Disasters Report, 246 pp., Kumarian Press, 2005.Lay, T., H. Kanamori, C. J. Ammon, M. Nettles, S. N. Ward, R. C. Aster,
S. L. Beck, S. L. Bilek, M. R. Brudzinski, R. Butler, H. R. DeShon,G. Ekstrom, K. Satake, and S. Sipkin, The Great Sumatra-AndamanEarthquake of 26 December 2004, Science, 308, 1127–1133, 2005.
Matsutomi, H., T. Takahashi, M. Matsuyama, K. Harada, T. Hiraishi, S. Su-partid, and S. Naksuksakul, The 2004 Off Sumatra Earthquake Tsunamiand Damage at Khao Lak and Phuket Island in Thailand, Annual J.Coastal Engineering, JSCE, 52, 1356–1360, 2005 (in Japanese).
Satake, K., Tsunamis, in International Handbook of Earthquake and En-gineering Seismology, edited by W. H. K. Lee, H. Kanamori, P. C. Jen-nings, and C. Kisslinger, 81A, 437–451, 2002.
Satake, K., Y. Okamura, M. Shishikura, Than Tin Aung, and K. Fujima,Tsunami field survey along Thai coast from the 2004 Sumatra-Andamanearthquake, Annual Report on Active Fault and Paleoearthquake Re-searches, Geological Survey of Japan/AIST, No. 5, 161–188, 2005.
Smith, W. H. F. and D. T. Sandwell, Global sea floor topography fromsatellite altimetry and ship depth soundings, Science, 277, 1956–1962,1997.
Tsuji, Y., Y. Namegaya, H. Matsumoto, S.-I. Iwasaki, W. Kanbua, M. Sri-wichai, and V. Meesuk, The 2004 Indian tsunami in Thailand: Surveyedrunup heights and tide gauge records, Earth Planets Space, 58, this is-sue, 223–232, 2006.
United Kingdom Hydrographic Office, Admiralty Tide Tables, Volume 3:Indian Ocean & South China Sea (including Tidal Stream Tables), 2004.
K. Satake (e-mail: [email protected]), T. T. Aung, Y. Sawai, Y.Okamura, K. S. Win, W. Swe, C. Swe, T. L. Swe, S. T. Tun, M. M. Soe, T.Z. Oo, and S. H. Zaw