66
TSX: ALS Renewable Energy | Clean Steel | Potash | Copper | Lithium | Nickel | Cobalt Investor Day - May 2021

TSX: ALS
Renewable Energy | Clean Steel | Potash | Copper | Lithium | Nickel | Cobalt
Investor Day - May 2021

|2
FORWARD-LOOKING STATEMENT
This document includes certain statements that constitute “forward-looking statements” and “forward-looking information” within themeaning of applicable securities laws (collectively, “forward-lookingstatements”). Forward-looking statements include statementsregarding Altius Minerals Corporation’s (“Altius”) intent, or the beliefsor current expectations of Altius’ officers and directors. Such forward-looking statements are typically identified by words such as “believe”,“anticipate”, “estimate”, “project”, “intend”, “expect”, “may”, “will”,“plan”, “should”, “would”, “contemplate”, “possible”, “attempts”,“seeks” and similar expressions. Forward-looking statements mayrelate to future outlook and anticipated events or results.
By their very nature, forward-looking statements involve numerousassumptions, inherent risks and uncertainties, both general andspecific, and the risk that predictions and other forward-lookingstatements will not prove to be accurate. Do not unduly rely onforward-looking statements, as a number of important factors, manyof which are beyond Altius’ control, could cause actual results to differmaterially from the estimates and intentions expressed in suchforward-looking statements.
Forward-looking statements speak only as of the date thosestatements are made. Except as required by applicable law, Altius doesnot assume any obligation to update, or to publicly announce theresults of any change to, any forward-looking statement containedherein to reflect actual results, future events or developments,changes in assumptions or changes in other factors affecting theforward-looking statements.
Non-IFRS MeasuresAttributable revenue, adjusted EBITDA and adjusted operating cashflow is intended to provide additional information only and do nothave any standardized meaning prescribed under IFRS and should notbe considered in isolation or as a substitute for measures ofperformance prepared in accordance with IFRS. Other companies maycalculate these measures differently. For a reconciliation of thesemeasures to various IFRS measures, please refer to our ManagementDiscussion and Analysis.

Cyclical Thoughts

|4
=
Consider our increasing reliance on all things electrical and electronic and nothing about today or tomorrow’s increased copper usage should seem surprising:
• Electric lights and heat, machines for processing and manufacturing, water and sanitation systems, refrigerators, ovens, washers and dryers, air conditioners, dishwashers, microwaves, TV, phones, computers, internet, etc. have all gained widespread adoption over this timeframe. Power generation and grid infrastructure has obviously grown accordingly.
• And now power generation is becoming more renewable energy focused and electric powered transport is gaining adoption – both of which are more copper intensive than the technologies they are replacing.
World Refined Copper Usage (000’s metric tonnes)
3x as many people, each using 3x as much copper… means >9x more copper usage
Dr. Copper - Global Structural Demand Since 1950
TSX: ALS | OTCQX: ATUSF

|5
Average Annual Copper Price (US$/t)
Structural and Cyclical Price Trends
Note the lengthening of cycle durations over time, which is likely reflective of increasing lead times for supply responses (permitting, social licencing, more
complex projects
“Super-Cycle”
During the second half of the last century the real price of copper fell consistently despite strong global demand growth
• Technology breakthrough in the mid-60’s (SX-EW) allowed many giant copper deposits in the Andes to become economic
• Economies of scale then took hold and traditional small to medium-scale underground mines were eclipsed by large-scale open pit mines
Around the start of this century a developing world-based demand surge was underestimated by the market while existing mine depletion accelerated – resulting supply deficits lifted prices out of the long-term down-trend during what became known as the “super-cycle”
• Miners / investors happily responded to the higher prices by developing the next best available set of deposits
• These were lower grade or deeper and came with a structurally higher development cost and marginal break even point
TSX: ALS | OTCQX: ATUSF

|6Sources: SNL Financial, internal estimates
Geologic Inflation Through the “Super-Cycle”
0
• Geologic Inflation - Average capital intensity and operating costs per pound moved significantly upward as industry necessarily shifted to lower grade and deeper ore
• Other inflationary pressures (gov’t taxes and royalties, wages, equipment, etc.) also built quickly as prices moved up• Resulting incentive price moved into the $3.50-$4.00 range from the $1.00 to $1.25 range
Cost inflation impacts mitigate the marginal benefits of higher resulting price increases for operators - but royalties are exposed only to the price benefits
$-
$1.00
$2.00
$3.00
$4.00
$5.00
$6.00
$7.00
20
00
20
01
20
02
20
03
20
04
20
05
20
06
20
07
20
08
20
09
20
10
20
11
20
12
20
13
20
14
20
15
Avg. Capex/lb Avg. Operating Cost (C3) / lb Incentive Price Requirement
* Incentive Price is estimated using industry average new build capital intensity and operating costs to derive a 15% IRR result
Capex, Opex and Incentive Pricing
Capex: +300%
Opex: +166%
Incentive: +235%
TSX: ALS | OTCQX: ATUSF

|7
Dr. Copper in 2021– “2005 - 2006 Déjà Vu?”
• 8 years of “super-cycle” incentive conditions ultimately resulted in short term over-supply and a price decline to below incentivization levels
• Prices then stayed below incentive for 8 years – new marginal operating cost curve-support found at around $2/lb vs < $1 prior cycle
• Incentivization now breached and market has real supply / demand deficit issues looming - but capital returns over capital growth investing narrative still prevails for time being amongst most mining company owners
• Sustained overshoot typically required and then new investments should sanction enmasse (and the supply surge will follow 5-7 years later)
• The new investments will be in more difficult projects on average than the last set, likely furthering the inflation of LT incentive pricing requirements - suggesting a longer-term structural up-trend around which shorter cyclical trends should oscillate
• Revenue based royalties insulated from higher costs but full price beneficiaries
Source: S&P Market Intelligence, internal estimatesTSX: ALS | OTCQX: ATUSF
Sources: SNL Financial, internal estimates, dashed lines an informed guess
202120202018 20192017
Incentive Price
Actual Price
Spot Price $ Amount
Above / Below Incentive
?

|8
Cyclical PositionHow is Altius Positioned as a Long-Term, Contrarian Investor?
Interpreted Cyclical Position
20052000 2010 2015 2020
Cycle II (Super-Cycle)Cycle I Cycle III
Altius IPO
We currently appear to be within relatively early
innings (end of 3rd?) of the new cycle
Altius’s bets are largely in:
• Bottom of cycle royalty acquisitions now delivering stronger revenues on price-based increases
• Incentivization conditions for operator funded growth investments in existing operations (brownfield) emerging and we expect the currently extreme “returns of capital” focused narrative to begin to shift shortly in response to changing shareholder demands towards growth – many of our royalty assets are obvious investment targets due to strong margin curve positions and large existing resources
• investor sentiment conditions for new mining project development (greenfield) also becoming permissive – we hold royalties and equity interests related to several advanced stage projects that feature compelling economics and sponsorship
• Speculative and mining company capital flooding back into exploration –our portfolio holdings seeing an outsized share of this with several positioned for potential discovery, larger company takeover interest, etc.
Bottom Bottom
Top
TSX: ALS | OTCQX: ATUSF

Royalty Business Lookback

|10
$0.04/share
$0.39/share
$0.61/share
$0.81/share
$1.03/share
$1.14/share
Operating CF /share
Renewable Energy
Lithium Renewable Energy
Interpreted Cyclical PositionRoyalty Acquisition
20052000 2010 2015 2020
Nickel, Copper, Cobalt
Potash, Thermal (Electrical) Coal
Copper, Zinc
Copper Iron Ore
Potash
Cycle II (Super-Cycle)Cycle I Cycle III
Altius’s Long-Term, Counter-Cyclical Royalty Growth Focus Disciplined Royalty Acquisition History
TSX: ALS | OTCQX: ATUSF

|11
Revenue to Date, NAV Relative to Purchase Price
Historic Acquisition Acquisition Date
PurchasePrice
Realized Net Revenue
Current Net Asset Value (Analyst Average)
Realized Revenue & NAV
Voisey's Bay 2003 $13.6 million $36.0 million $19.1 million $55.1 million
Chapada Stream 2016 $76.8 million $53.3 million $115.0 million $168.3 million
Potash Portfolio 2014 & 2018 $138.2 million $74.5 million $223.3 million $297.8 million
IOC 2017 & 2019 $54.0 million $42.0 million $117.0 million $159.0 million
Calinan Merger 2015 $70.9 million $63.0 million $73.0 million $136.0 million
Coal Portfolio 2014 & 2020 $200.6 million $111.2 million $25.2 million $136.4 million
Altius Renewable Royalties (ARR) 2019 & 2020 $85.0 million - $180.0 million $180.0 million
$639.1 million $380.0 million $752.7 million $1,132.7 million
Note
1. Purchase price is based on cash purchase price in CAD. For the acquisition of Callinan Royalties in 2015, the purchase price excludes cash and consideration allocated to non-royalty related assets. (see Note
9, 2016 Annual Financial Statements), and includes the cost to exercise the option increasing the Gunnison Gross Sales Royalty (exercised in 2018). The main producing royalty in Callinan is 777 with the
Gunnison development stage royalty also part of that acquisition.
2. Realized revenue is the cumulative (since acquisition) reported revenue up to March 31, 2021. For the Chapada copper stream, reported revenue is net of the 30% copper purchase cost, as per the contract.
3. Analyst average NAV by asset based on analysts reports from March – April 2021. The Callinan NAV consensus is based on NAV ascribed to 777 and to Gunnison.
(Note 1) (Note 2) (Note 3)
TSX: ALS | OTCQX: ATUSF

|12
Royalty Revenue Growth
Revenues
Revenue Per Share
$0.22
$0.88 $0.83
$1.08
$1.56
$1.86$1.62
FY 2014 FY 2015 FY 2016 FY 2017 2018 2019 2020
Per-share growth accretion since 2014 mostly reflective of period of counter-cyclical M&A Focus now cyclically shifting to price appreciation and organic volume growth based
TSX: ALS | OTCQX: ATUSF

Organic Royalty Growth Drivers

|14
Public subsidiary ARR funding the development of a portfolio of more than 25 GW of new renewable energy projects as electrical coal royalties approach regulatory phase out
Macro-Trend
Transition to Renewable Energy Royalties
Electrification andStorage
Soil Quality/AgriculturalYield Improvements
LowerEmissionSteel Making
Altius Royalty Exposure
Altius Renewable Royalties Corp.TSX:ARR
Cu, Ni, Li, Co
Natural Potash Fertilizer
Clean Iron Ore Products
Copper, which is essential to EV and renewable energy transitions, represents our largest revenue exposure. Growing exposure to key battery metals - nickel, lithium and cobalt
Potash fertilizer royalties relate to a portfolio of top-tier Canadian mines that are integral to meeting the increasing demand for sustainable food productionwithout additional deforestation
Royalties relate to high-purity iron ore products - that minimize pollution from steel production
Royalty Exposures Well Aligned With Macro Growth TrendsSustainability Thematic Providing Strong Investment Tailwinds For Underlying Assets
TSX: ALS | OTCQX: ATUSF

|15
Commodity / Market Exposures

|16
3Electricity
Mine lives calculated based on current mineral inventory and 2020 throughput. Coal asset lives denote the expected plant closure and not based on mineral inventory. Life of ARR assets based on industry estimated project lives of new wind and solar generation projects.
Reserve Mine Life (Years) M&I Resource Life (Years) Inferred Resource Life (Years)
Chapada
Voisey’sBay
777
Gunnison
Vanscoy
Esterhazy
Cory
Allan
Rocanville
24IOC
34
14
1
127
59
49
31
10
19
60
11
8
Total: 390 Years
Total: 107 Years
Total: 757 Years
Total: 1,318 Years
Total: 1,128 Years
Humphrey South in permitting (2024-2071)
Iron
Base Metals
Potash
+
+
+
+
+
M&I: 182 Years | Inferred: 81 Years
M&I: 46 Years
M&I: 698Years
M&I: 698 Years | Inferred: 571 Years
M&I: 413 Years | Inferred: 684 Years
Significant expansion drilling on-going and capacity expansion under study
Higher prices / lower cut-off grade potentially creates significant additional resource; Further exploration potential
Curipamba development
Perpetual resources allow unlimited life extensions30+
24
ARR
Genesee
Royalty Asset Lives Unrivalled in SectorLarge Resources Are A Strong Predictor of Future Production Expansions
TSX: ALS | OTCQX: ATUSF

|17
Strong Underlying Mine Economics
Operator Mine CommodityBenchmark
SpotPrice
Estimated OperatingMargin
Nutrien All Operations Potash $353 498%
Mosaic All Operations Potash $353 469%
Hudbay Manitoba Copper $4.70 466%
Excelsior Gunnison Copper $4.70 440%
Lundin Chapada Copper $4.70 327%
Vale Voisey's Bay Nickel $8.09 122%
Rio Tinto IOC Fe Concentrate $235 460%
Rio Tinto IOC Fe Pellet $301 285%
Notes
• All amounts in USD, with units being $Cdn/ metric tonne for potash, USD per pound for base metals and USD per tonne for iron ore.
• Chapada margin calculated using Lundin’s guidance of 2021 C1 cash costs of copper per pound (NI43-101 report October 10, 2019) after precious metal by-product credits. Chapada cash costs do not include the
effects of copper stream agreements which will be a component of the copper revenue and will impact realized revenue per pound.
• Nutrien and Mosaic per tonne margins calculated by taking FOB Midwest Spot over Cost of Product Manufactured. COPM = Potash COGS for the 2020 excluding depreciation and amortization expense and
inventory and other adjustments divided by the production tonnes for the period. For Mosaic, we used the 2020 four quarter average actuals cash costs of production (excluding brine) – MOP ($/tonne)
• Voisey’s Bay margin calculation using SNL Modeled Cost Curve for Total Cash Cost per pound of nickel net of by-product credits.
• IOC margin based on Altius modeled $45/t cash costs for concentrate and $65/t cash costs for pellet.
• Gunnison is expected to be in Phase I commercial production in 2021. Total cash cost pe pound of copper is derived from the Base Case of the Feasibility Study dated January 16, 2017
• Manitoba Operations margin calculated using Hudbay’s annual actuals for the year ended December 31, 2020. Cash cost per pound of copper produced, net of by-product credits.
TSX: ALS | OTCQX: ATUSF

Iron Ore
Iron Ore Price (US$/t)
$0
$50
$100
$150
$200
Iron Ore 62% Fe Fines CFR Qingdao
May
2020
Aug Nov Feb May
2021

|19
The Greener Steel TransitionLabrador Trough Structural Advantage
“Altius, with almost two decades of investing experience in the potential of the Labrador Trough, now provides its shareholders with a combination of production, development and exploration level growth exposure to this increasingly important iron ore mining district”
▪ The most common iron ores contain hematite and/or magnetite (iron oxides) and other mineral and elemental level impurities to varying degrees
▪ Iron ore input impurity levels greatly impact the efficiency of steel making blast furnace plants and in so doing directly influence relative pollutive and basic operational cost structure components
▪ The “cost of emissions” is becoming more acutely factored into steelmaking economics – a trend that seems more likely to accelerate than abate
▪ These two factors go most of the way to explaining the heightened structural quality pricing differentiation that has been developing in the market over the recent past number of years
▪ Average iron ore quality is decreasing and driving up the underlying average structural cost of steelmaking – the majority of incremental global iron ore production capacity incentivized during the previous cycle came from inferior quality ore deposits than those from the previous generation
▪ The Labrador Trough produces amongst the very lowest impurity level iron ores of any significant district in the world today – and it is rare in its significant room for competitive production growth
Iron Ore Price vs. Quality
The relative impurity content of 58% vs 66% grade iron ore is almost 3 times higher
Iron Ore Iron Oxygen Iron to Impurities Ratio
Low Quality 58% 25% 17% Impurities(Ratio) 3.4:1
“Benchmark’ Quality 62% 27% 11% Impurities
(Ratio) 5.6:1
High-Quality 66% 28% 6% Impurities(Ratio) 11:1
0%
4%
8%
12%
16%
20%
$150/t
$175/t
$200/t
$225/t
$250/t
58% 62% 66%
Impu
ritie
s Con
tent
(%)
Iron Content (%)
TSX: ALS | OTCQX: ATUSF
|20
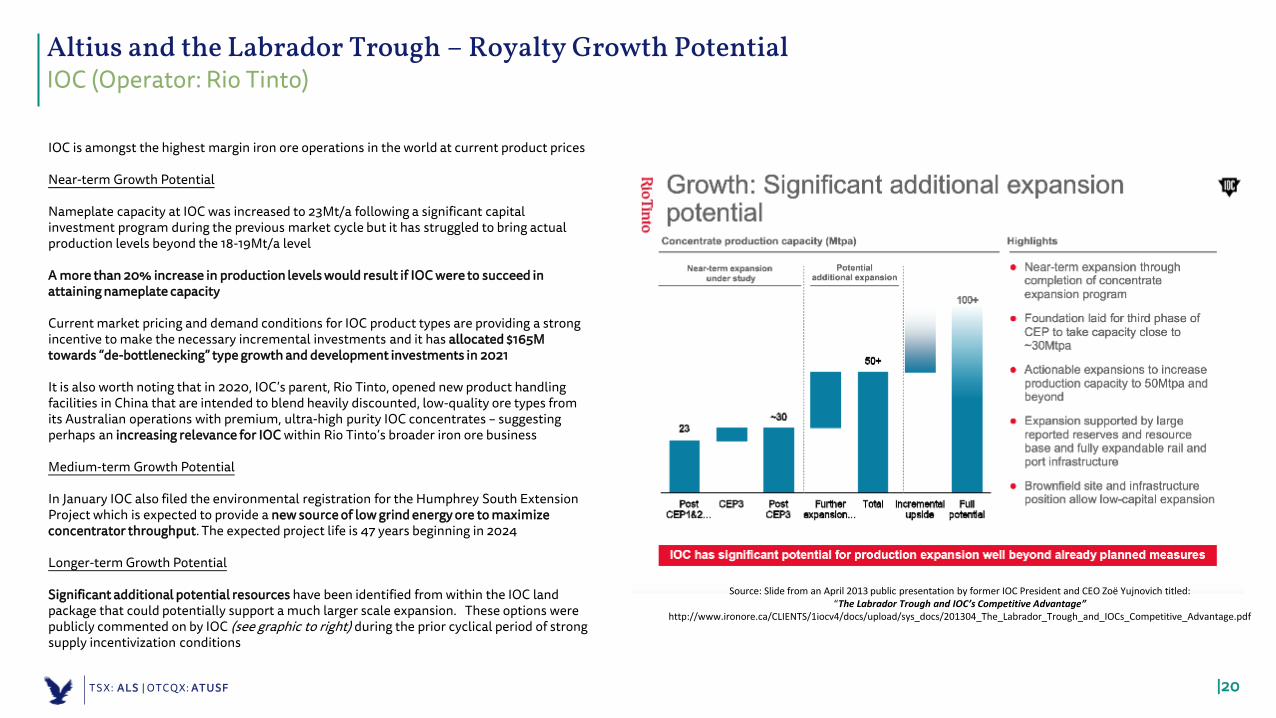
Altius and the Labrador Trough – Royalty Growth PotentialIOC (Operator: Rio Tinto)
IOC is amongst the highest margin iron ore operations in the world at current product prices
Near-term Growth Potential
Nameplate capacity at IOC was increased to 23Mt/a following a significant capital investment program during the previous market cycle but it has struggled to bring actual production levels beyond the 18-19Mt/a level
A more than 20% increase in production levels would result if IOC were to succeed in attaining nameplate capacity
Current market pricing and demand conditions for IOC product types are providing a strong incentive to make the necessary incremental investments and it has allocated $165M towards “de-bottlenecking” type growth and development investments in 2021
It is also worth noting that in 2020, IOC’s parent, Rio Tinto, opened new product handling facilities in China that are intended to blend heavily discounted, low-quality ore types from its Australian operations with premium, ultra-high purity IOC concentrates – suggesting perhaps an increasing relevance for IOC within Rio Tinto’s broader iron ore business
Medium-term Growth Potential
In January IOC also filed the environmental registration for the Humphrey South Extension Project which is expected to provide a new source of low grind energy ore to maximize concentrator throughput. The expected project life is 47 years beginning in 2024
Longer-term Growth Potential
Significant additional potential resources have been identified from within the IOC land package that could potentially support a much larger scale expansion. These options were publicly commented on by IOC (see graphic to right) during the prior cyclical period of strong supply incentivization conditions
Source: Slide from an April 2013 public presentation by former IOC President and CEO Zoe Yujnovich titled: “The Labrador Trough and IOC’s Competitive Advantage”
http://www.ironore.ca/CLIENTS/1iocv4/docs/upload/sys_docs/201304_The_Labrador_Trough_and_IOCs_Competitive_Advantage.pdf
TSX: ALS | OTCQX: ATUSF

|21
Altius and the Labrador Trough – Royalty Growth PotentialKami (Operator: Champion Iron)
The Kami project is a low-impurity feasibility stage opportunity located within the core production area of the Labrador Trough mining district
Altius's project generation team completed the early exploration programs that broadly outlined the iron ore deposits at Kami before then vending the project in exchange for corporate equity and a retained 3% gross sales royalty during the prior market cycle
The original buyer of the Kami project, Alderon Iron Ore, defaulted on a project secured debt, which led to successfully established nearby producer, Champion Iron, recently acquiring the project through a recent receivership process
The most recently updated Alderon feasibility study for Kami was completed in 2018 and indicated its ability to economically produce approximately 7.8 Mt/a of premium-quality iron ore concentrates
Source: Alderon Iron Ore Corp.NI 43-101 Technical Report, October 31, 2018
2018 Feasibility Study
Annual Production (65.2% Fe Con) 7.84 Mtpa
Initial Capex US$982.4M
Cash Operating Cost (FOB) $30.72/t of concentrate
Capital Intensity ~$125/t
2P Reserves Rose Pit 517.2 Mt @ 28.8% Tfe
Mine Life 23 Years
Altius holds a
3% Gross Sales Royalty (GSR)
on the Kami Project
(FOB Sept Iles price basis)
Champion is currently in the process of revising the scope of the Kami Project and updating prior feasibility studies.
Should Kami be developed Altius’s underlying royalty has the potential to become a very material new cash flowing asset within its portfolio
TSX: ALS | OTCQX: ATUSF

|22
PREMIUM PRODUCT TIER 1 JURISDICTION HIGH QUALITY INFRASTRUCTURE
Champion Iron (CIA-TSX/ASX; CIAFF-OTCQX) Altius Minerals Corporation– Investor DayGreen Steel Transition - Labrador Trough Structural Advantage

|23
DisclaimerChampion Iron
This presentation (the “Presentation”) contains information about Champion Iron Limited (“Champion Iron”, “Champion” or the “Company”), current as at the date hereof or as at such earlier date as may be specified herein. This Presentation does not constitute orform part of and should not be construed as, an offer to sell or issue or the solicitation of an offer to buy or acquire securities of the Company or any of its subsidiaries or affiliates or any other person in any jurisdiction or an inducement to enter into investmentactivity, does not constitute marketing material in connection with any such securities and there is no current offering or soliciting for the sale of securities in any jurisdiction.
This Presentation and the information contained herein may not be reproduced or distributed to others, at any time, in whole or in part, for any purpose, and may not be used for any other purpose, without the prior written consent of the Company, and allrecipients agree that they will keep confidential all information contained herein not already in the public domain and will use this Presentation solely for information purposes. Acceptance of this Presentation by any person constitutes an agreement to be bound bythe foregoing terms.
In making any future investment decision, you must rely on your own examination of the Company, including the merits and risks involved. This Presentation should not be construed as financial, legal, tax, accounting, investment or other advice or a recommendationwith respect to any potential investment. You should consult your own advisors as needed to make an investment decision and determine whether it is legally permitted to make an investment under applicable legal investment, securities or similar laws orregulations.
This Presentation may contain “forward-looking information” or “forward-looking statements”, which include all statements other than statements of historical facts, including, without limitation, any statements preceded by, followed by or that include the words
“will”, “would”, “aim”, “aimed”, “will likely result”, “is likely”, “are likely”, “believe”, “expect”, “expected to”, “will continue”, “will achieve”, “anticipate”, “estimate”, “estimating”, “intend”, “plan”, “contemplate”, “seek to”, “seeking to”, “trying to”, “target”, “propose
to”, “future”, “objective”, “goal”, “project”, “should”, “can”, “could”, “may”, “will pursue” or similar expressions or the negative thereof. Without limiting the generality of the foregoing, all statements in this Presentation, other than statements of historical fact, that
address future events, developments or performance that the Company expects to occur, including management’s expectations regarding (i) the Company’s growth; (ii) the Company’s environmental footprint; (iii) the Phase II expansion of the Bloom Lake Mine, its
technical parameters, expected construction timeline, capital expenditures, costs, NPV and IRR; (iv) the DR product potential and its impact on securing new customers and expanding product offering; (v) the estimated future operation capacity of the Bloom Lake
Mine; (vi) the completion of the construction for a potential expansion of the Bloom Lake Mine; (vii) the life of mine of the Bloom Lake Mine; (viii) the Company’s product quality and its Green House Gas emissions and its ability to service the Electric Arc Furnace
market; (ix) the Company’s ability to transition capacity to DR pellet feed; (x) the Kami project acquisition and related port capacity; (xi) the industry demand; (xii) Champion Iron Limited’s ability to advance the Phase II expansion project and its funding, completion
timeline, impact on nameplate capacity, expected capital expenditures and project economics; (xiii) additional port capacity expected from the Kami project acquisition; (xiv) the local support and announced agreement to invest in SFPPN with the Government of
Québec and its ability to support expansion plans; and (xv) measures, and the effectiveness thereof, implemented or expected to be implemented to mitigate the risk and contain COVID-19 and the potential impacts on Champion’s business, financial condition and
financial results of the outbreak of the COVID-19 pandemic are forward-looking statements. Such forward-looking information and statements included in this Presentation are not guarantees of future performance and should not be unduly relied upon. Such
information and statements, including the assumptions made in respect thereof, involve known and unknown risks, uncertainties and other factors that may cause actual results or events to differ materially from those anticipated in such forward-looking information
or statements, as well as those factors discussed in the section entitled “Risk Factors” of the Company’s 2020 Annual Information Form and the risks and uncertainties discussed in the Company’s quarterly activities report for the fiscal year ended March 31, 2020 and
the management’s discussion and analysis for the fiscal year ended March 31, 2020, all of which are available on SEDAR at www.sedar.com, the ASX at www.asx.com.au and the Company’s website at www.championiron.com. The forward-looking information and
statements contained in this Presentation are based on assumptions Champion’s management believes to be reasonable and speak only as of the date of this Presentation, and none of the Company or any of its affiliates, agents, advisors or representatives (including
directors, officers and employees) intend or have any duty or obligation to supplement, amend, update or revise any of the forward-looking statements contained in this Presentation.
On June 20, 2019, the Company released the results of the Feasibility Study for the Bloom Lake Phase II expansion project reported in the National Instrument 43-101 – Standards of Disclosure for Mineral Projects (“National Instrument 43-101”) technical report
entitled “Bloom Lake Mine – Feasibility Study Phase 2” by BBA Inc., Soutex and WSP Canada Inc., having an effective date of June 20, 2019 and filed on August 2, 2019 (the “Phase II Feasibility Study”). The Company is not aware of any new information or data that
materially affects the information included in the Phase II Feasibility Study and confirms that all material assumptions and technical parameters underpinning the estimates in the Phase II Feasibility Study continue to apply and have not materially changed. The Phase
II Feasibility Study dated August 2, 2019 is available at www.sedar.com.
The non-IFRS financial performance measures included in this Presentation include: total cash cost or C1 cash cost, all-in sustaining costs (“AISC”), average realized selling price, earnings before interest, tax, depreciation and amortization ("EBITDA"), adjusted netincome and adjusted earnings per share ("adjusted EPS"). These measures are intended to provide additional information and should not be considered in isolation, or as a substitute for, measures of performance prepared in accordance with IFRS. These measures donot have any standardized meaning prescribed under IFRS and therefore may not be comparable to other issuers.
Nothing described in this Presentation has been or will have been recommended, approved or disapproved by any securities regulatory authority of any state, province or any other jurisdiction, nor has any such securities regulatory authority passed upon theaccuracy or adequacy of this presentation or this Presentation.
Reference to P62: Platts TSI IODEX 62% Fe CFR China;
Qualified Person and data verification: Mr. Nabil Tarbouche, Senior Geologist at Quebec Iron Ore Inc., a wholly-owned subsidiary of the Company (P.Geo.) is a “qualified person” as defined by National Instrument 43-101 and has reviewed and approved the disclosure
of the scientific and technical information related to Bloom Lake contained in this Presentation (the “Bloom Lake Information”). Mr. Tarbouche’s review and approval does not include statements as to the Company’s knowledge or awareness of new information or
data or any material changes to the material assumptions and technical parameters underpinning the Phase II Feasibility Study. Mr. Tarbourche is a member of the Ordre des Géologues du Québec. Mr. Tarbouche consents to the inclusion in this Presentation of the
Bloom Lake Information in the form and context in which it appears. Certain other information contained in this Presentation has been obtained from published sources prepared by third parties and has not been independently verified and no representation or
warranty, expressed or implied, is made with respect to, and no undue reliance shall be placed on, the information or opinions contained herein or in any verbal or written communication made in connection with this Presentation.
This Presentation has been authorized for release to the market by the CEO of Champion Iron Limited, David Cataford.
All information quoted “per tonne” refer to per dry metric tonne (“dmt”).
All amounts are in Canadian dollars unless otherwise stated.

|24
Corporate OverviewChampion Iron
LARGEST PUBLICLY LISTED PURE-PLAY HIGH-GRADE IRON ORE PRODUCER GLOBALLY
BLOOM LAKE
Note: 1. Insider ownership as of February 5, 2021; Realized price and total cash cost for the nine months period ended December 31, 2020
> Top Tier Jurisdiction
> Established production in region since the 50’s
> 2nd largest hub of high-grade export globally
> Access to infrastructure
> Nearly US$4 Billion invested
> 7.4 Mtpa nameplate capacity
> Ongoing Phase II construction expected to double production
> High-grade 66.3% Fe with low impurities
> 20-year mine life
> Proven management team
> 10.7% insider ownership1
> First 9-months of FY21 net average realized selling price US$116.3/t*
> First 9-months of FY21 total Cash cost US$40.4/t FOB*
> $1,060.8M Revenue in last 4 quarters
> $598.5M EBITDA in last 4 quarters

|25
Sustainable SolutionChampion Iron
HIGHEST QUALITY IRON ORE FOR LONGTERM VISION TO ENABLE TRANSITIONTOWARDS GREENER STEEL
Source: Champion Iron Limited; 66.3% Fe grade is fiscal year 2020 to date as of December 31, 2020. Global iron ore concentrate producers total intensity using Wood Mackenzie data. Bloom Lake scope emission as detailed by BMO Capital Markets, November 27, 2020 “ Quantifying potential carbon cost”
Production (thousand tonnes)
Global iron ore production by producers (Mt)
Sco
pe
3 C
O2e
inte
nsi
ty (
Kg/
t St
eel)
> Confirmed ability to produce a Direct Reduction (DR) pellet feed material (~68% Fe)
> Ability to adapt and service EAFs
> Demonstrated ESG track record operational excellence Global scope 3 CO2e intensity by producer
Global iron ore concentrate production Total Intensity (KgCO2e/t)
> At 66.3% Fe, Bloom Lake produces one of the highest quality iron ore products globally
> Bloom Lake’s iron ore concentrate is produced with one of the lowest CO2 footprints globally
C02 Reduction

|26
Product DevelopmentChampion Iron
Current OfferingBlast Furnace Pellet Feed
Proven ProductDirect Reduction Pellet Feed
> Product trading at a premium relative to the quoted Cost and Freight (CFR) China 62%
> Product can be converted into Direct Reduced Iron (DRI) pellets which can be used by Electric Arc Furnaces (EAFs)
> Potential to attract greater premium over the quoted CFR China 62%
66.3% Fe4.7% SiO2 +
Al2O6
~68% Fe2.57% SiO2 + Al2O6
TRANSITION MATERIAL
DR QUALITY MATERIAL
BF QUALITY MATERIAL
Source: Champion Iron Limited, Wood Mackenzie data
Global High Quality Iron Ore Concentrate Blend Specifications
> CIA strives to provide the highest quality material globally

|27
Labrador Trough PotentialChampion Iron
65.5% Fe(S BF)
69.5% Fe(P BF)
67.4% Fe(S BF)
66.2% Fe(S BF)
69.5 % Fe(P EAF)
Source: Champion Iron Limited Proprietary Analysis

|28
Labrador Trough PotentialChampion Iron
* The historical mineral resources and reserves are historical estimates and should not be relied upon. A qualified person has not done sufficient work to upgrade or classify the historical estimates as current mineral resources or mineral reserves and Champion Iron is not treating the historical estimates as current mineral resources or mineral reserves. See Appendix note 1 for Kami Project and Appendix note 2 for Moiré Lake.** Bloom Lake Phase II proven and probable reserves are based on the Phase II Feasibility Study. Bloom Lake Phase II mineral reserves include Bloom Lake Phase I mineral reserves as of the effective date of the mineral reserve estimate reported in the Phase II Feasibility Study. See disclaimer page for statement regarding Phase II Feasibility Study.*** Includes Consolidated Fire Lake, Moiré Lake, Quinto Claims and Harvey Tuttle. The historical mineral resources are historical estimates and should not be relied upon. A qualified person has not done sufficient work to upgrade or classify the historical estimates as current mineral resources or mineral reserves and Champion Iron is not treating the historical estimates as current mineral resources or mineral reserves. See slide 12 “Company projects – Mineral Resources” and Appendix notes 2 to 5 for additional details.**** Certain reserves and resources mentioned are foreign estimates from an Australian perspective. See Appendix for additional details.
> Situated only a few kilometres south eastof Bloom Lake, the Kami project hassignificant historical resources andhistorical reserves of high-grade iron orenear available infrastructure
> Acquisition includes 8 Mtpa of portcapacity at the port of Sept-Îles
*
*
**
Champion controls additional properties which include 1.5 billion tonnes of historical M&I resources and 3.9 billion tonnes of historical inferred resources within 60km of Bloom Lake***
*
*
**
*
**
*
CIA COMPLETED THE ACQUISITION OF THE KAMI PROJECT IN Q1 2021
Note: Port of Sept-Iles

|29
Labrador Trough PotentialChampion Iron
Contact for additional information
Michael Marcotte, VP Investor Relations
[email protected] | 514-316-4858
Questions?

Potash
Potash Price (US$/t)
$100
$200
$300
$400
Midwest Cornbelt Brazil CFR
May
2020
Aug Nov Feb May
2021

|31
Potash Price History
• Cyclical bottom reached in 2016
• Capacity utilization rate beginning to edge up again as expansion
decisions that were incentivized during prior cyclical price and
sentiment conditions now begin to be validated by demand growth
confirmations
• Agricultural economics very strong and crop inventories low –
encouraging record levels of fertilizer application to improve yields
• Recent price surge has not yet been realized by operators due to
contractual sales commitments
• Altius royalties calculated on a “mine gate” realized price basis that
has averaged ~75% of the US Midwest market price since our
royalty acquisition*
*The difference between realized mine gate and quoted market prices generally
relates to the increment of local market prices that include relative transportation
and logistic costs. Further lag effects, which balance over time, are explained by the
time between when product is priced and when sales are recognized – Mosaic
notes a range of 25-75 days and this varies in accordance with the relative mix of
sales by geography within a period (longer distance means greater lag) and
whether the original order was priced using spot market or earlier contracted prices
Historic Potash Pricing USD/t
Price Realization USD/t
$0
$200
$400
$600
$800
$1,000
$1,200
2001 2003 2005 2007 2009 2011 2013 2015 2017 2019 2021
Midwest Cornbelt
Midwest Cornbelt
$150
$250
$350
$450
2014 2015 2016 2017 2017 2018 2019 2019 2020 2021
Altius Realized Price Midwest Cornbelt Brazil CFR
TSX: ALS | OTCQX: ATUSF

|32
Global Potash Demand Growth ( 20-year 2.7% CAGR)
Global potash demand has grown by almost 30M mt (~ 70%) over
past 20 years
Reflects population growth and decrease in per capita arable
land (higher agricultural yield requirements)
Growth rate projections suggest global shipments could increase
by 21Mt (31%) by 2030, 48Mt (71%) by 2040 and 83Mt (122%) by
2050
Our royalty mines represented ~22% of global potash shipments
in 2020
60
50
40
70
30
2000 2020201520102005
Global Potash Shipments Growth
World Population
Source: World Bank, Mosaic
Source: World Bank
5 Billion
6 Billion
7 Billion
8 Billion
2000 2002 2004 2006 2008 2010 2012 2014 2016 2018
0.16
0.17
0.18
0.19
0.2
0.21
0.22
0.23
2000 2002 2004 2006 2008 2010 2012 2014 2016 2018
Hecta
res P
er
Pers
on
Arable Land (Hectares) Per Person
TSX: ALS | OTCQX: ATUSF

|33
Portfolio Mines Volume Growth (7-year 5.4% CAGR)
Source: World Bank, Mosaic
0.00
5.00
10.00
15.00
20.00
25.00
2001 2003 2005 2007 2009 2011 2013 2015 2017 2019 2021
Rocanville Allan Cory Patience Lake Esterhazy Total Nameplate
7.8
4M
mt
+4.1
5 M
mt
Since our initial acquisition in 2014 royalty portfolio
mines have increased production by 4.15Mt (~37%
or 5.4% per year) and have steadily gained global
market share
Mines produced at 66% of combined nameplate
capacities in 2020 implying remaining room for 50%
(7.84 Mt) production growth
10%
15%
20%
25%
30%
2011 2012 2013 2014 2015 2016 2017 2018 2019 2020
Portfolio Mines as Percentage of Global Shipments
Note that in 2019 our operators chose to disproportionately remove tonnes from the market in response to temporary weather-related demand impacts
TSX: ALS | OTCQX: ATUSF

|34
Royalty Attributable Volume Growth (7-year 8.2% CAGR)
• Our attributable royalty volumes (levelized to current royalty
ownership level) have grown at a faster rate than the total
underlying mine production rate since 2014 acquisition (60%
total growth of attributable royalty tonnes vs 37% total production
growth for portfolio mines)
• This is because Altius holds higher percentage royalty unitization
interests related to the larger and lower cost mines in the portfolio
(e.g. Rocanville and Esterhazy), which have represented a greater
share of overall mine portfolio production growth since acquisition to
date
0
200,000
400,000
600,000
800,000
1,000,000
1,200,000
1,400,000
1,600,000
1,800,000
2014 2015 2016 2017 2018 2019 2020
Rocanville Esterhazy Other
100
110
120
130
140
150
160
170
2014 2015 2016 2017 2018 2019 2020
Volume Growth Rates(Base 100, constant 2021 royalty ownership level)
Attributable Tonnes Mine Production Tonnes
Royalty Unitization by Mine
Attributable Tonnes KCl (constant 2021 royalty unitization ownership level basis)
Volume Growth Rates (base 100, constant 2021 royalty ownership level)
Unitization percentages relate to underlying mineral rights percentage ownership within a particular long-term mining unit. All royalty holders within a mine unit area are collectively aggregated and paid their proportionate share of royalty within that unit area. This means mining does not have to occur directly within Altius’ lands to result in revenue. Instead, our overall ownership is taken as a total of the unit (each mine has 1 -3 units) and expressed as the unitization percentage.
Mine (Unit) Unitization Percentage
Rocanville (U1) 23.9%
Rocanville (U2) 14.2%
Esterhazy (U1&2) 8.6%
Esterhazy (U3) 8.8%
Cory 8.2%
Allan 4.6%
Vanscoy 3.0%
Patience Lake 18.2%
TSX: ALS | OTCQX: ATUSF

|35
Production and Nameplate Capacity Utilization by Mine
TSX: ALS | OTCQX: ATUSF

|36
Remaining Capacity Utilization - Future Capacity Growth Timing?
Source: World Bank, Mosaic
M mt
5M mt
10M mt
15M mt
20M mt
25M mt
20
01
20
02
20
03
20
04
20
05
20
06
20
07
20
08
20
09
20
10
20
11
20
12
20
13
20
14
20
15
20
16
20
17
20
18
20
19
20
20
20
21
20
22
20
23
20
24
20
25
20
26
20
27
20
28
20
29
20
30
Production Nameplate Capacity
20 Year 4% CAGR Projection 10 year 5.25% CAGR Projection
Assuming no further increase of current ~22% market share, the
7.84Mt additional tonnes of existing potential production growth (to
reach namplate capacities) from our portfolio mines could be
reached in 2034 at a 2.7% global shipment growth rate
However, portfolio production growth has averaged 4% over 20
years and 5.25% since 2010 when most expansions began to
commission
Continuation of these market share growth rates could bring
production levels to full nameplate capacity by 2028-2030
Given 7-year average build times during prior cycle, are further
expansions looming sooner rather than later?
Saskatchewan brownfields expansion is arguably the most
economically attractive global source of new capacity to meet
medium and longer term demand requirements (capital intensity,
cost of capital, quantity and quality of ore, jurisdictional risk, quality
of operators, etc.)
Estimated brownfields “incentive price” recently reached in some
markets
Altius is not responsible for a share of capital for any future
expansions but will be a full beneficiary
TSX: ALS | OTCQX: ATUSF

|37
$0/t
$100/t
$200/t
$300/t
$400/t
$500/t
$600/t
$700/t
$800/t
$900/t
$1,000/t
$1,100/t
$1,200/t
2001 2004 2006 2009 2012 2014 2017 2020
Midwest Cornbelt Vancouver FOB
Saskatchewan Potash “Incentive Price” Rough Estimates
Average estimated capital intensity of expansions undertaken at
Altius royalty portfolio mines since 2005 is ~$976/t and suggests
incentive market pricing of $410/t
Nutrien estimated $2,500 - $3,000/t hypothetical capital intensity
range suggests incentive market pricing range of $922 and $1,079/ t
BHP Jansen project capital intensity estimate of $1,932/t (including
shaft related costs to date) suggests incentive market pricing of
$796/t
• We believe that BHP is positioning Jansen as a forward-
looking strategic investment decision (i.e. disregarding
costs incurred to date) which results in a brownfield-like
investment case (~$400/t incentivization)
• Global market growth by earliest expected timeframe for
Jansen production of 4.4Mt to come to market is projected
at 7- 8Mt
Saskatchewan Brownfields
Incentive Price
Jansen Implied Greenfield
Incentive Price
Nutrien Implied Greenfield
Incentive Price - Low
Nutrien Implied Greenfield
Incentive Price - High
Saskatchewan Greenfield
Saskatchewan Brownfield
Note: See appendix for incentive price estimation methodology.
TSX: ALS | OTCQX: ATUSF

|38
Project Expansions and Completions Relative to Pricing
US$/t
US$200/t
US$400/t
US$600/t
US$800/t
US$1000/t
2000 2002 2004 2006 2008 2010 2012 2014 2016 2018 2020
Midwest / Cornbelt
Cory
Rocanville
Vanscoy
Esterhazy
Rocanville (+3.5Mmt, $3B)
Allan (+2.1Mmt, $0.8B)
Cory (+1.6Mmt, $1.2B
Esterhazy (+2.4Mmt, $3.2B)
Vanscoy (+1Mmt, $2.3B)
Allan
7-Year
Average
Construction
Period
Expansion Start
Expansion Completed
TSX: ALS | OTCQX: ATUSF

|39
Vast Resources Allow For Multiple Future Expansions
Note: Mine lives calculated based on current mineral inventory and 2020 throughput.
Mine
Reserves
Proven(Mt)
Probable
(Mt)
Reserves Total(Mt)
Average Grade
K2O (%)
Rocanville 195 348 543 23.4
Esterhazy - - 875 23.4
Vanscoy 176 56 232 25.28
Allan 250 99 349 24.8
Cory 171 77 248 22.5
Mine
Resources
Measured(Mt)
Indicated(Mt)
Inferred(Mt)
Resources Total(Mt)
Average Grade
K2O (%)
Rocanville 1,761 1,342 1,376 4,479 23.4
Esterhazy - - - 688 23.4
Vanscoy 687 215 1,041 1,943 24.4
Allan 2,512 733 5,369 8,614 -
Cory 2,336 876 2,626 5,838 -
Reserve Mine Life (Years) M&I Resource Life (Years)
Mine Lives
127
59
49
31
60
Total: 390 Years
Total: 107 Years
Total: 757 Years
Total: 1,318 Years
Total: 1,128 Years
+
+
+
+
+
M&I: 182 Years | Inferred: 81 Years
M&I: 46 Years
M&I: 698Years
M&I: 698 Years | Inferred: 571 Years
M&I: 413 Years | Inferred: 684 Years
Vanscoy
Esterhazy
Cory
Allan
Rocanville
TSX: ALS | OTCQX: ATUSF

|40
Altius’ optionality on potash extends
beyond the current unitized mining
areas based on substantial resource
potential.
• Altius currently owns more than
22,700 ha of Freehold mineral
rights outside of current mining
lease areas
• We estimate the total resource
potential on these non-unitized
mineral rights totals approximately
1.5Bt of potash.
• We consider +9000 ha of Altius
lands, containing approx. +600Mt
of potash, to have the potential for
development over the next 15-20
years via mine expansions or new
developments.
TSX: ALS | OTCQX: ATUSF

|41
Conclusion
Upside Pre-built production volume growth potential of 50% to reach nameplate capacity
Demand / prices rising rapidly on strong yield incentivization conditions at farm level
Producers have higher margin and stronger investor sentiment conditions developing
and will need to begin considering capital investment in further expanded capacity or
risk losing market share by mid to end of this decade as current spare capacity fills
TSX: ALS | OTCQX: ATUSF

$7,000
$9,000
$11,000
$13,000
Lithium Carbonate - CIF Asia…
Metals
Copper Price (US$/lb)
Zinc Price (US$/lb) Nickel Price (US$/lb)
$12.00
$17.00
$22.00
$27.00
$2.00
$3.00
$4.00
$5.00
$5.00
$6.50
$8.00
$9.50
$0.75
$1.00
$1.25
$1.50
Cobalt Price (US$/lb)
May
2020
Aug Nov Feb May
2021
May
2020
Aug Nov Feb May
2021
May
2020
Aug Nov Feb May
2021
May
2020
Aug Nov Feb May
2021
May
2020
Aug Nov Feb May
2021
Lithium Price (US$/t)

|43
Chapada Copper Stream
• Stream acquired in early 2016 from then owner Yamana Gold
• Mine is located ~300 km northwest of Brasilia, Brazil, in Goiás State
• Operated by base metal focused Lundin Mining following acquisition in 2019
• Chapada is a long-life operation with a first quartile industry cost structure
• Base Rate: 3.7% of payable copper production from the Chapada mine; Expansion Incentive Rate: Rate decreases to 2.65% in the event of a Chapada mine expansion; rate reduces to 1.5% for remaining life of mine after 75 million pounds delivered (~2033 at current production rate)
52
58 59 60
50 48 - 53
53 - 5850 - 55
k t Cu
10k t Cu
20k t Cu
30k t Cu
40k t Cu
50k t Cu
60k t Cu
70k t Cu
2016A 2017A 2018A 2019A 2020A 2021G 2022G 2023G
Copper Production (000’s tonnes)Cost Curve Position
TSX: ALS | OTCQX: ATUSF

|44
Chapada Resource GrowthExpansion Studies Underway
• Acquisition heavily motivated by recognition of exceptional resource growth potential
• This has been confirmed over subsequent 5 years with reserve mine life having more than doubled
• Lundin Mining, who acquired the mine in 2019, currently carrying out a 60,000m drilling campaign designed to further delineate near-mine resources and support ongoing expansion studies
• Several drill highlights reported in Q1 from areas peripheral to current resource blocks with grades at or better than recent average head grades
• Recently increased land position in district by 80% - most of which is encompassed in our stream agreement AOI
TSX: ALS | OTCQX: ATUSF Note: Reserve life remaining based on 2016 and 2019 technical reports and life
of mine beyond the year end 2020 in each of those reports.
11 Years
29 Years
2016 2019
Reserve Life Remaining Post 2020

|45
Voisey’s Bay Resource GrowthExcellent potential for longer mine life if economic “cut-off” parameters shift
Approximately 39Mt of ore have been mined from the Voisey’s Bay deposits to date and Vale is currently developing new underground mine to extract an additional ~32Mt by 2034
Note that in 2001 Inco reported NI 43-101 compliant all-category resources as ~142 Mt. Accounting for past production, this equates to at least 60.9 Mt of resources having been removed from the Resource statement in 2018
Much of this additional material is lower grade than that mined to date and incorporated in the current underground mine plan however it does point to longer term mining potential as mine cut-off grades adjust with metal pricing and infrastructure sunk costs, etc are considered
Considerable further exploration potential exists within the district, which is fully encompassed by Altius’ 0.3% NSR royalty interest
TSX: ALS | OTCQX: ATUSF

|46
Voisey’s Bay Resource GrowthCurrent mine plan extends to only 900 m depth; outstanding potential beyond this
West-East Longitudinal Section
Source: Wheaton Precious Metals (2018)
Mine limit at 2034
TSX: ALS | OTCQX: ATUSF

|47
.
.Excelsior Mining’s Gunnison ProjectIn-situ copper mining and Altius’ newest royalty
• First Copper cathode production announced December 2020
• The project envisages development in three production “stages” with capacities of:
- 25 million lbs/yr in Stage 1- 75 million lbs/yr in Stage 2 – to commence in Year 4 of the mine life.- 125 million lbs/yr a in Stage 3 – to commence in Year 7 of the mine
life.
• Life of mine is 24 years
• C$31,682,500 bought-deal financing completed in November.
• Excelsior recently stated their focus for the coming quarter will be on expanding wellfield operations with the goal of achieving full, nameplate capacity of 25 million pounds per annum the first half of 2022
• Altius holds a 1.625% GRR on the Gunnison Project while plant capacity is less than 75 million lbs. of copper per annum and 1.5% while the Plant Capacity is greater than or equal to 75 million lbs. of copper
TSX: ALS | OTCQX: ATUSF

|48
Curipamba Royalty (2% NSR)Adventus Mining TSXV:ADZN / Salazar Resources TSXV:SLR
5.6% copper eq M&I Resource (1.1
Blbs)
• 15 additional exploration targets have been identified within the 215km2 project area that are also included within the royalty AOI - with several planned for drill testing in 2021
• Altius is also an ~12% shareholder of Adventus alongside 3 additional strategic and 35 institutional investors
TSX: ALS | OTCQX: ATUSF

|49
Lithium Royalty CorporationStrategic Investment
US$120.7m raised privately to
date with major shareholders
including Riverstone Holdings
and funds affiliated with Waratah
Capital.
Implied valuation based on
January 2021 raise $US$137M
Altius ownership of 12.6% implies
value of LRC holding of
US$17.3M (not including
additionally acquired 10% direct
interests in Neolithium and Sigma
Lithium royalties)
LRC Royalties Acquired to Date
TSX: ALS | OTCQX: ATUSF

Renewable Energy - ARR
S&P/TSX Renewable Energy
May
2020
Aug Nov Feb May
2021
C$100
C$200
C$300
|511. Source: Electric Reliability Council of Texas, Generator Interconnection Status Report, January 1, 20202. Source: Renews Ltd., Copenhagen Infrastructure Partners to deliver 400 MW to AEP from Panther Grove, July 1, 2020
US$35M royalty investmentGBR acquired by Altius US$80M in GBR for 50% JV interest
US$30M royalty investment commitment
2017 2018 2019 2020 2021
Additional US$25M committed
ARR Formation Royalty Investment Royalty Investment Apollo InvestmentGBR begins working on renewable royalty concept with Altius
GBR Formation Royalty Investment
Renewable Royalty
ARR Closes C$100M IPO
Initial Public Offering
Renewable Royalty
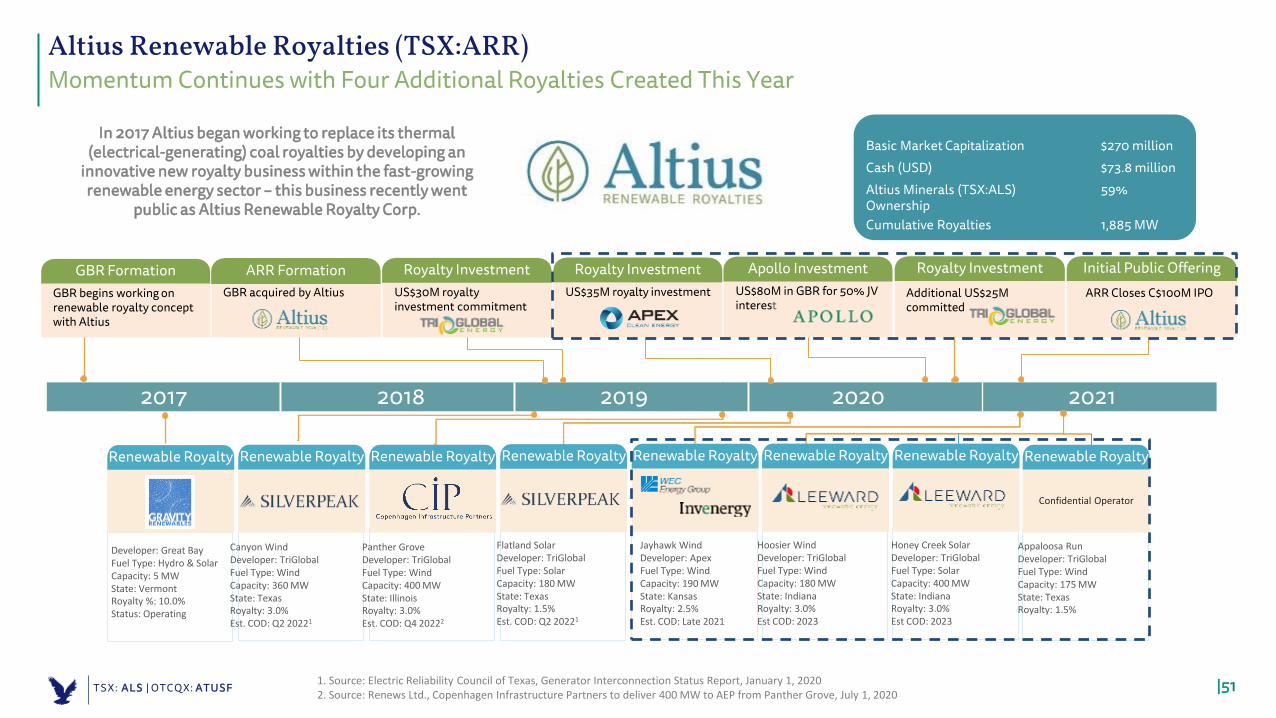
Developer: Great BayFuel Type: Hydro & SolarCapacity: 5 MWState: VermontRoyalty %: 10.0%Status: Operating
Canyon WindDeveloper: TriGlobalFuel Type: WindCapacity: 360 MWState: TexasRoyalty: 3.0%Est. COD: Q2 20221
Renewable Royalty
Panther GroveDeveloper: TriGlobalFuel Type: WindCapacity: 400 MWState: IllinoisRoyalty: 3.0%Est. COD: Q4 20222
Renewable Royalty
Flatland SolarDeveloper: TriGlobalFuel Type: SolarCapacity: 180 MWState: TexasRoyalty: 1.5%Est. COD: Q2 20221
Renewable Royalty Renewable Royalty Renewable Royalty
Confidential Operator
Renewable Royalty
Jayhawk WindDeveloper: ApexFuel Type: WindCapacity: 190 MWState: KansasRoyalty: 2.5%Est. COD: Late 2021
Hoosier WindDeveloper: TriGlobalFuel Type: WindCapacity: 180 MWState: IndianaRoyalty: 3.0%Est COD: 2023
Honey Creek SolarDeveloper: TriGlobalFuel Type: SolarCapacity: 400 MWState: IndianaRoyalty: 3.0%Est COD: 2023
Appaloosa RunDeveloper: TriGlobalFuel Type: WindCapacity: 175 MWState: TexasRoyalty: 1.5%
In 2017 Altius began working to replace its thermal (electrical-generating) coal royalties by developing an
innovative new royalty business within the fast-growing renewable energy sector – this business recently went
public as Altius Renewable Royalty Corp.
Altius Renewable Royalties (TSX:ARR)Momentum Continues with Four Additional Royalties Created This Year
Basic Market Capitalization $270 millionCash (USD) $73.8 millionAltius Minerals (TSX:ALS) Ownership
59%
Cumulative Royalties 1,885 MW
TSX: ALS | OTCQX: ATUSF

|52
2nd
Largest Independent Renewable Developer 1
6.5 GWCommercializedSince Inception
1.9 GWCommercializedSince Inception
1695 MWSold with Embedded GBR
Royalty~2.3 GW
Anticipated Under Royalty 3
3.5+ GW Development
Portfolio
US$55M GBR Committed Capital
~1.7 GWAnticipated Under Royalty 3
26 GWDevelopment
Portfolio 2
US$35M GBR Committed Capital
3rd
Largest Independent Renewable Developer 1
Apex Clean Energy
Tri Global Energy
Exposure to Expansive Development Portfolios
Historical Apex and TGE Project Buyers
Algonquin Power & Utilities Corporation
Xcel Energy
Southern Company
Copenhagen Infrastructure
Partners
NextEra Energy Resources
Engie SA
InvenergyFirst Wind Terna
Energy
1. Source: Bloomberg New Energy Finance ("BNEF"), Developer League Tables and Rankings Interactive Dataset, 2010-20192. Includes 5 GW of ineligible projects to GBR under Apex's royalty agreement3. Estimated midpoint
Altius Renewable Royalties Established Partnerships with Top-Tier Developers
TSX: ALS | OTCQX: ATUSF

Altius’s Project Generation Business
Altius generates mineral exploration projects for sale in exchange for royalties and equity positions
This business has a proven track record of creating pipeline royalties at “negative cost” as well as earning significant equity based profits

|54
4 2 2 2 31
31 4
7
3 21
6
35 1
22
11
16
89
0
Rambler IPO
Aurora IPO Alderon IPO Champion Iron FundingWolfden Funding
Orogen Launch
Altius’s Long-Term, Counter-Cyclical PG Growth FocusPG (Exploration) Business
Num
ber o
f Exp
lora
tion
Proj
ect D
eals Adventus IPO
Aethon (AbraPlata) IPO
Interpreted Cyclical PositionMajor Project Spin-out
20052000 2010 2015 2020
Cycle II (Super-Cycle)Cycle I Cycle III
116
tota
l to
date
Altius’s PG Business generates mineral exploration projects for sale in exchange for royalties and equity
positions TSX: ALS | OTCQX: ATUSF

|55
61 Royalties
Converted to new royalties and junior equities since 2016
market bottom
Raised in 2020 by Altius Portfolio
Companies
~$150M
Project Generation PerformanceMay 2016 – May 2021
The above waterfall shows expenditures of the PG business as well as realized and unrealized gains including in the money warrants and thus differs slightly from how we report PG Equity Position.
TSX: ALS | OTCQX: ATUSF Note: Waterfall excludes value of private holdings.

|56
Global Exploration Funding Set to Increase SignificantlyJunior Mining Equity Markets Very Strong in 2020
0
50
100
150
200
250
300
0
250
500
750
1,000
1,250
1,500
1,750
2,000
2,250
2,500
2,750
3,000
3,250
S D S D
201 2020 2021
u ber o nancin s
ount raised
Gold nancings Base/other metals nancings
Specialty commodi es nancings Number of nancings completed
Source: S&P Global Market Intelligence
More money was raised in Q1’21 than 2020 total
TSX: ALS | OTCQX: ATUSF

|57
PROJECT GENERATION (PG) BUSINESS>225 km of Drilling Exposure anticipated in 2021 from $150mm Raised in 2020/21
TSX: ALS | OTCQX: ATUSF
Anglo Gold

|58
SiliconDirect 1.5%NSR to Altius and 1%NSR to Orogen
TSX: ALS | OTCQX: ATUSF
AngloGold Ashanti’s Silicon Project in SW Nevada is subject to an Altius 1.5% NSR
AGA continues to aggressively drill the Silicon target (more than 20,000 meters of drilling estimated to have been completed to date) with more than 90 additional drill sites recently permitted within a ~2 km long by up to 1 km wide area. While AGA has not published drilling results to date it has made public comments describing Silicon as the “base of its expanding presence in North America”.
Corvus Gold has recently published drilling results from the Lynnda Strip property, located immediately along the southern boundary of the Silicon property, that indicate strong grades and thicknesses of near surface oxidized gold mineralization across an approximate 700m wide section
Further information published by Corvus, as well as information available in recent drill permit applications, indicate that AGA is pattern drilling an extensive area to the immediate north of Lynnda Strip that it refers to as the Merlin project

|59
Adventus Mining CorporationTSX:ADZN
Adventus is executing on development & exploration at multiple copper-gold projects in Ecuador
Mid-2022 construction on El Domo copper-gold mine
5.6% copper eq M&I Resource (1.1 Blbs)
Open pit, +10 year mine life, feasibility study by Q4 2021
~60% after-tax IRR at current metal prices
Lowest capital intensity of global copper projects
Ownership in 3 copper-gold districts in Ecuador
+15,000 m of drilling over 3 projects to end of 2021
~10 volcanic massive sulphide targets
+10 intrusive / porphyry targets
Drilling year-round with below market drilling costs
~C$33M in cash & investments with C$145M market cap.
Fully financed to El Domo construction decision
Deep Ecuadorian Partnerships: Nobis & Salazar
4 strategics & ~35 international institutions on register
WGC ESG CriteriaEquator Principles
TSX: ALS | OTCQX: ATUSF

|60
Orogen RoyaltiesTSX:OGN
Gold/copper royalties covering Canada, USA, and Mexico12
2
Joint ventures structured for organic royalty creation 8
Active drilling campaigns in 2021 with four additional programs planned
ERMITAÑO-Au
(2% NSR) – Sonora, Mexico
ResourcesTonnage
(k tonnes)Gold (g/t)
Silver(g/t)
Contained Gold
(ounces)
Contained Silver
(ounces)
Indicated 2,452 4.25 64 335,000 5,010,000
Inferred 6,022 2.69 57 522,000 11,090,000
*First Majestic production expected in early 2022
3
SILICON-Au
(1% NSR) – Nevada, USA
• AngloGold Ashanti owned• Over 28,000 metres drilling completed at YE 2020• Three drill rigs turning at Merlin area• Adjacent to Coeur Mining (C-Horst) and Corvus Gold (Lynnda
Strip) discoveries• Potential to host multi-million ounce gold deposit
Advanced stage royalties with planned ~$70 million in development and exploration
TSX: ALS | OTCQX: ATUSF

|61
Altius’ NL Gold Exposure~115,000 hectares, 46 km of Drilling, $20M Raised
- Marathon’s substantial resource growth success at Valentine Lake and mine development plans has been a key catalyst in driving gold exploration and investor interest
- New Found Gold’s ongoing high-grade drilling results from Queensway project, citing a Fosterville analogue, continue to draw strong investor interest and has resulted in a recent $1.25 billion market capitalization
- Sokomon’s Moosehead drilling results continue to identify new areas of high-grade mineralization and have attracted successive investments from renowned investor Eric Sprott
- Altius’ strategic land positions allowed us to complete 4 NEW project deals in NL since July 2020 creating significant equity and royalty exposure
- ~$20 million raised in 2020/21 by juniors working Altius generated projects with 46,000m of drilling underway or planned in 2021
Significant Gold Projects
Projects with Altius Interest
Major Structures
Golden Baie Project7,669,024 shares
2% NSR Royalty
Moosehead Project124.2 g/t Au over 5.1 m (MH-18-39)
44.96 g/t Au over 11.9 m (MH-18-01)21.07 g/t Au over 11.6 m (MH-21-163)
2.5% NSR Royalty
Wilding Lake Project4,398,750 shares
2% NSR Royalty
Golden Rose Project8,716,000 shares
2% NSR Royalty
Sail Pond Project 6,505,186 shares
2% NSR Royalty
New Found GoldQueensway North Project
92.9 g/t Au over 19 m (NFGC-19-10)124.4 g/t Au over 17.7 m (NFGC-20-59)261.3 g/t Au over 7.2 m (NFGC-21-137)
Marathon GoldValentine Lake Project
4.78 Moz
St. John’s
10,000 m
20,000 m
7,000 m
4,000 m
5,000 m
10,000 m Planned or estimated drill meterage for 2021
TSX: ALS | OTCQX: ATUSF

|62
Silver Exposure
Diablillos – Rapidly Growing a High-Grade, Large-Scale ProjectLarge 80km2 property (100% AbraSilver) in mining-friendly Salta, ArgentinaLarge & growing resource: +140 million silver-equivalent (AgEq) ounces or 1.7 million gold-equivalent ounces (AuEq) 1
Initial open pit PEA completed in 2018 with compelling economics (+30% IRR) at conservative commodity prices ($20/oz Ag & $1,300/oz Au)
Excellent Exploration Potential at DiablillosConsistently delivering high-grade results from ongoing exploration programMultiple high-grade zones of silver, gold and copper intersected to date:
Silver: 103m at 516 g/t silver-equivalent (oxides)Gold: 7m at 23.3 g/t gold-equivalent (oxides)Copper: 15m at 5.1% Cu, 2.35 g/t Au and 658 g/t Ag (sulphides)
Fully-Funded to Advance Project to a Construction Decision+C$18M cash to fund exploration on Diablillos and other projectsTrading at P/NAV of ~0.40x based on current commodity prices
Experienced Team & Supportive ShareholdersTop Shareholders: Eric Sprott, Altius Minerals, SSR Mining and Insiders own 37% of outstanding shares
TSX: ALS | OTCQX: ATUSF

|63
Wolfden ResourcesSept 2020 PEA Highlights – Top Quartile Project
TSX: ALS | OTCQX: ATUSF

|64
Issued Common Shares 41.5 millionFairfax Preferred Securities 10.0 million ($100 million)
Basic Market Capitalization $768 millionAnnual Dividend $0.20 per shareOutstanding Debt† $128 million
Cash and Public Equity Holdings† $170 million
Available Under Credit Revolver† $42 million
TSX: ALS | OTCQX: ATUSF Returns of Capital
Capital Structure and Track RecordAltius Minerals Corporation
Dividends$2m
Dividends$3M
Dividends$5M
Dividends$7M
Dividends$7M
Dividends$8M
Dividends$8M
Dividends$2M
Share buy back$2M
Share buy back$2M
Share buy back$5M
Share buy back$9M
Share buy back$6M
Share buy back$7.4M
2015 2016 2017 2018 2019 2020 2021 YTD
YTD
TSX: ALS | OTCQX: ATUSF
Strategic review of capital allocation priorities planned for completion in mid 2021
†Market cap as of May 11, 2021 and Debt as at Mar 31, 2021. Cash and public equity holdings includes $19 million cash + $106 million LIORC equity value + $54 million project generation equity values, as at Mar 31, 2021. Cash balance excludes ARR IPO proceeds of $92.9 million.

|65
THANKYOU
Flora WoodDirector, Investor RelationsPhone: (416) 346-9020Email: [email protected]
Producing Royalties
Development Royalties
Project Generation
RenewableEnergy Portfolio

|66
Appendix
Notes to slide 37:
Nutrien Greenfields project case estimates assumed 10 year construction period with capital divided equally over the period. Operating costs at $60/t, freight and logistic costs at $75/t and
3% crown royalty rate. A 100 year project life beginning at start of construction. 2Mmt/a production rate with 2 year ramp up period. Incentive price calculated based upon a target 15% IRR
on an unlevered, pre-tax basis. (See Nutrien November 30, 2020 corporate presentation for capital cost estimating information)
The Jansen Greenfields case assumes midpoint of quoted remaining capital estimate ($5.5B) and midpoint of stage 1 production rate (4.4Mmt) https://www.bhp.com/-
/media/documents/media/reports-and-presentations/2019/190514_globalmetalsminingandsteelconference_presentation.pdf?la=en ramping over 3 years and with a 4 year remaining
construction period. Operating cost of $60/t, freight and logistic costs at $75/t and 3% crown royalty rate. $3B in capital incurred to date spread equally over 10 years. 100 year project life
beginning at start of construction. Incentive price calculated based upon a target 15% IRR on an unlevered, pre-tax basis. Midpoint capital cost and production level and other estimates
derived from https://www.bhp.com/-/media/documents/media/reports-and-presentations/2019/190514_globalmetalsminingandsteelconference_presentation.pdf?la=en
The Saskatchewan Brownfields case assumes the average expansion capital intensity for the mines within Altius’s royalty portfolio that underwent expansions during the previous market
cycle beginning in 2005. These included Rocanville, Esterhazy, Allan, Cory and Vanscoy which collectively expanded by 10.6Mmt at an estimated capital cost of $10.35B. Average
construction period estimated at 7 years with capital spread equally over that period. Operating costs at $60/t, freight and logistic costs at $75/t and 3% crown royalty rate. 100 year project
life beginning at start of construction and 3 year average ramp up. Incentive price calculated based upon a target 15% IRR on an unlevered, pre-tax basis.
All input estimates based upon information compiled from annual disclosure documents of relevant operators and various media reports and should not be considered ass either exhaustive
or definitive.
Notes to slide 44:
Chapada resource estimate have been sourced from multiple sources including: 2016 Reserves & Resources Estimate (12/31/2016 Yamana Earnings Release), 2017 Mineral Reserves &
Resources (2/15/2018 8-K Yamana), 2018 Mineral Reserves & Resources (12/31/2018 Earnings Release), 2019 Mineral Reserves & Resources (9/5/2019 Lundin Mining Press Release),
2020 Mineral Reserves & Resources (09/30/2020 Lundin Mining Press Release)


