62
Investor Day 2022 Strategy November 16, 2018

Investor Day
2022 Strategy
November 16, 2018

2
Forward Looking Statements
This presentation contains forward-looking statements, that should be considered as good faith
estimates. Such statements are subject to risks and uncertainties outside of Viña Concha y Toro’s
control that could cause Viña Concha y Toro’s actual results to differ materially from those set forth
in the forward-looking statements. These risks factors include but are not limited to the risks factors
in Item 3 - “Key Information – Risk Factors” in the 20-F Annual Report, and in those described in
Viña Concha y Toro’s Financial Statements, Note 5 (“Gestión de Riesgos Financieros”). Forward-
looking statements speak only as of the date they are delivered, Viña Concha y Toro undertake no
obligation to publicly update or revise them considering developments which differ from those
anticipated.

3
Agenda
1. 2018 harvest
2. Global wine industry trends
3. Restructuring process – Support areas
4. Restructuring process – Commercial area
5. Fetzer – Excelsior merger
6. 3Q18 results
7. Sustainability
8. Real Estate business
I n v e s t o r
D a y

I n v e s t o r D a y - 2 0 1 8
h a r v e s t
4
2018 harvest - Chile
Following two low-volume vintages, 2018 harvested volume increased 36% in Chile.
915
1,046
1,255 1,282
990
1,287
1,014 949
1,290
0
200
400
600
800
1.000
1.200
1.400
2010 2011 2012 2013 2014 2015 2016 2017 2018
Chile Harvest - (MM liters)
Source: SAG

I n v e s t o r D a y - 2 0 1 8
h a r v e s t
5
2018 harvest - Argentina
In Argentina, the harvested volume increased 31% in 2018.
2,539
2,807
2,174
2,786 2,587
2,338
1,704
1,922
2,516
0
500
1.000
1.500
2.000
2.500
3.000
2010 2011 2012 2013 2014 2015 2016 2017 2018
Argentina Harvest – (th. tons)
Source: INV
I n v e s t o r D a y - 2 0 1 8
h a r v e s t
6
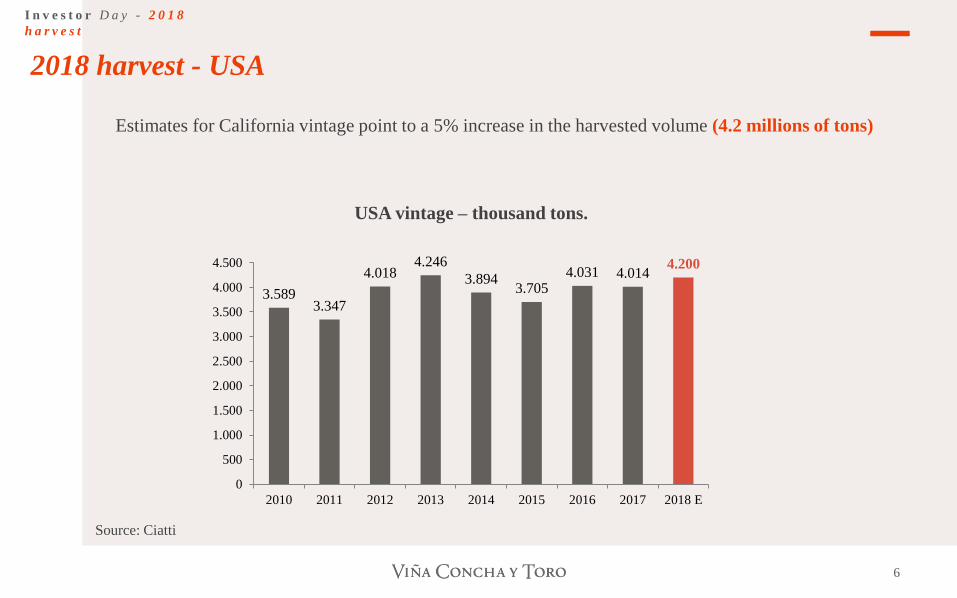
2018 harvest - USA
Estimates for California vintage point to a 5% increase in the harvested volume (4.2 millions of tons)
3.589 3.347
4.018 4.246
3.894 3.705
4.031 4.014 4.200
0
500
1.000
1.500
2.000
2.500
3.000
3.500
4.000
4.500
2010 2011 2012 2013 2014 2015 2016 2017 2018 E
USA vintage – thousand tons.
Source: Ciatti

I n v e s t o r D a y - 2 0 1 8
h a r v e s t
7
Global wine production
• Global wine production in 2018 is estimated at 282 Mhl, an increase of 12%.
• Strong rebound of main producers:
Italy (+14%), France (+27%), and Spain (+26%).
266
262
281 280
267
258
267
300
282 284
268 269
272
264
268
258
292
270
275
269
251
282
200
220
240
260
280
300
320
Mil
lio
ns
of
HL
Source: OIV

I n v e s t o r D a y - 2 0 1 8
h a r v e s t
100
83
98 100
77
20,0
30,0
40,0
50,0
60,0
70,0
80,0
90,0
100,0
110,0
2014 2015 2016 2017 2018
ba
se 1
00
: 2
01
4
Internal grape price (own production)
8
Chile - Price trends for main varieties
Premium Cabernet Sauvignon
100 107
119 142
133
20,0
40,0
60,0
80,0
100,0
120,0
140,0
160,0
2014 2015 2016 2017 2018
ba
se 1
00
: 2
01
4
External grape price

I n v e s t o r D a y - 2 0 1 8
h a r v e s t
100
88
110 104
83
0,0
20,0
40,0
60,0
80,0
100,0
120,0
2014 2015 2016 2017 2018
ba
se 1
00
: 2
01
4
Internal grape price (own production)
100
83 95
167
209
0,0
50,0
100,0
150,0
200,0
250,0
2014 2015 2016 2017 2018
ba
se 1
00
: 2
01
4
External grape price
9
Chile - Price trends for main varieties
Generic Cabernet Sauvignon

I n v e s t o r D a y - 2 0 1 8
h a r v e s t
10
Chile - Share of own production and external grape sourcing
2018 harvest
Own
production
50%
External
50%
Own
production
30%
External
70%
Premium grapes Generic grapes

I n v e s t o r D a y - 2 0 1 8
h a r v e s t
11
Argentina - Price trends for main varieties
Premium Malbec
100,0
148.5 154.4
163.9
88,6
0
20
40
60
80
100
120
140
160
180
2014 2015 2016 2017 2018
Internal grape cost
100.0 93.1
137.8
233.2 172,0
0
50
100
150
200
250
2014 2015 2016 2017 2018
External grape price
Base year: 2014, in USD, f/x as of 04/30 of every year

I n v e s t o r D a y - 2 0 1 8
h a r v e s t
12
Argentina - Price trends for main varieties
Generic Malbec Blend
100.0
105.8
99.7
58.9
69,9
0
20
40
60
80
100
120
2014 2015 2016 2017 2018
Internal grape price
100.0 99.5
151.2
251.2
212.1
0
50
100
150
200
250
300
2014 2015 2016 2017 2018
External grape price
Base year: 2014, in USD, f/x as of 04/30 of every year.

I n v e s t o r D a y - 2 0 1 8
h a r v e s t
13
Argentina - Share of own production and external grape sourcing
External
51%
Own
production
49%
External
46%
Own
production
54%
2018 harvest
Premium grapes Blend - Generic grapes

I n v e s t o r D a y - 2 0 1 8
h a r v e s t
14
Conclusions
• Premium inventory stocks have recovered strongly.
• A decrease in the price of wine was foreseen during 2018, thus, not all of the needs projected (in
terms of grapes) were vinified.
• 2018 harvest: One of the best if not the greatest in terms of quality, in Chile and Argentina.
“I can’t remember such a good year in terms of
wine volume or quality. The wines are very
fruity, expressive and long, and they are easy to
drink. This 2018 harvest has achieved great
wines”.
Marcelo Papa Technical Director Viña Concha y Toro
“It was a typical harvest in Mendoza, with
excellent health and quality. Volume came
in above our expectations.”
Germán Di Césare Chief Winemaker Trivento.

I n v e s t o r D a y - 2 0 1 8
h a r v e s t
15
Conclusions
• Wine prices in 2018 year-to-date, in equivalent terms to grape prices:
• Generic Cabernet Sauvignon: -31%
• Sauvignon Blanc: -34%
• 2019 vintage outlook :
Normal conditions up to date, downward trend for grape prices.

I n v e s t o r
D a y
I n v e s t o r
D a y
Agenda
1. 2018 harvest
2. Global wine industry trends
3. Restructuring process – Support areas
4. Restructuring process – Commercial area
5. Fetzer – Excelsior merger
6. 3Q18 results
7. Sustainability
8. Real Estate business

I n v e s t o r
D a y
17
Trends in the global industry
• Premiumization trend is observed in most markets.
• Wine consumption is not growing significantly in any relevant market.
• China has entered in a stage of lower dynamism and growing “realism” in distribution
channels.
• Strong penetration of “discounters” to the detriment of larger retail chains. A phenomena
with higher intensity in Europe.
• Partnerships among marketers aimed to succeed in the penetration of fine wines category.

I n v e s t o r
D a y
I n v e s t o r
D a y
Agenda
1. 2018 harvest
2. Global wine industry trends
3. Restructuring process – Support areas
4. Restructuring process – Commercial area
5. Fetzer – Excelsior merger
6. 3Q18 results
7. Sustainability
8. Real Estate business

I n v e s t o r
D a y
19
Restructuring process – Support areas
1. Supply chain optimization in Chile local market
- Closure of branches: from 13 in 2016 to 8 in 2018
- Estimated annual net savings (full year): $1,100 million
2. Wine making process optimization
- Reduced number of owned cellars: from 13 to 11 in 2018
- Reduced number of leased cellars: from 5 to 3 in 2018
- Increased winemaking capacity of cellars: +20%
- Estimated annual net savings (full year): $1,630 million
3. Closure of Lo Espejo plant
- Reduced number of bottling plants: from 3 to 2 in 2018 (in Santiago)
- Estimated annual net savings (full year): $5,000 million
4. Rationalization of organizational structure in Chile
- Estimated annual net savings (full year): $4,800 million

I n v e s t o r
D a y
5. Important increase in productivity from higher share of clonal selections
• Productivity of vineyards planted with clonal selections is 27% higher than in massal selections
• 2017-18: Clonal selections share: 29% and massal selections share: 71%
20
Restructuring process – Support areas
Clonal selections - Evolution of share in production
29% 27%
15% 13%
21% 17%
clonal
massal

I n v e s t o r
D a y
21
Restructuring process – Estimated savings
(Ch$ million) 2017 2018 2019 Full Year
Efficiencies and synergies
from program 4,383 10,466 17,656 18,802
Severance payments,
consultancies (3,153) (6,141) (1,668)
Net savings 1,230 4,325 15,989 18,802

I n v e s t o r
D a y
22
Restructuring process – Previous estimates for savings
Differences in estimated net savings for 2018 and 2019 are explained by higher consultancies and
severance expenses.
(Ch$ million) 2017 2018 2019 Full Year
Efficiencies and synergies
from program 4,383 10,466 17,656 18,802
Severance payments,
consultancies (3,153) (4,460) (1,298)
Net savings 1,230 6,006 16,358 18,802

I n v e s t o r
D a y
23
I n v e s t o r
D a y
Agenda
1. 2018 harvest
2. Global wine industry trends
3. Restructuring process – Support areas
4. Restructuring process – Commercial area
5. Fetzer – Excelsior merger
6. 3Q18 results
7. Sustainability
8. Real Estate business

I n v e s t o r
D a y
New commercial strategy
We seek to lead the global wine industry through a consumer-centric focus,
oriented to the development of premium brands, delivering a higher value to
our customers, through a simple, agile, and sustainable productive model.
24
We have carried out significant adjustments in the commercial area in order to face
the new strategy.

I n v e s t o r
D a y
Low
Po
tenti
al
Relevance
1. Casillero del Diablo
1. 1000 Stories
2. Adorada
3. Bonterra
4. CdD Devil’s Collection
5. CdD Reserva Privada
6. CdD Reserva Especial
7. Cono Sur 20 Barrels
8. Cono Sur Bicicleta
1. Anthony’s Hill
2. Cold Water Creek
3. Cono Sur Orgánico
4. Sunrise
5. Tocornal
6. Tocornal CS
7. Tocornal Trivento
8. Trio
1. Clos de Pirque
2. Exportación
3. Fetzer
4. Frontera
5. Isla Negra
6. Maipo Entry Level
(Mi Pueblo y Classic)
7. Reservado
Brand matrix
High
9. Cono Sur Reserva Esp.
10. Diablo
11. Don Melchor
12. Jacked
13. Marques de Casa Concha
14. Trivento Golden
15. Trivento Private Reserve
16. Trivento Reserve

I n v e s t o r
D a y
Brand matrix
26
– Portfolio rationalization: Exit from 82 brand out of 304.
– Special focus on Casillero del Diablo brand (PRINCIPAL).
– Investments in brands with the highest potential from our 3 origins (INVEST).
– Commercial and marketing focus on new brands development to support a
high growth.
Implications:

I n v e s t o r
D a y
Market matrix: Specialized commercial areas
27
Commercial offices: 14 - Distributors: 352 - Markets + 130

I n v e s t o r
D a y
Independent distribution for Viña Cono Sur y Almaviva
28
Viña Cono Sur:
125 distributors
Presence in 84 countries
Viña Almaviva:
Distribution through Negociants de Bordeaux

I n v e s t o r
D a y
29
2018: Year of implantation of the new commercial model
• Long process, not free from internal difficulties: Cultural change.
• External difficulties: Brand portfolio redefinition and reorientation.
• Creation of a new unit for marketing excellence, analytics and market intelligence (CEMAI).
Develops analysis and reports to facilitate information on insights and trends.
• Strengthening of innovation and product development areas.

I n v e s t o r
D a y
New Products - Chile

I n v e s t o r
D a y
New Products - Chile

I n v e s t o r
D a y
32
New Products - Chile

I n v e s t o r
D a y
New Products - Argentina

I n v e s t o r
D a y
New Products - USA

I n v e s t o r
D a y
35
Following this complete revision,
realignment, and new vision:
We have a new company,
a new way of working

I n v e s t o r
D a y
36
A New Company
• Deep restructuring of the senior executive team in Chile.
• A new culture definition, based on :
– Forward-looking approach
– High level of expertise – with external advisory
– Management leadership
– Communication and teamwork promotion
• A simplified company at all levels and areas. High impact on costs and on agility.
• A transformed and new commercial business model.
• Commitment of the company's entire workforce: clear and traceable KPI’s.
• Greater innovation, entrepreneurial mindset of the senior executive team, and openness to change.
I n v e s t o r
D a y
Agenda
1. 2018 harvest
2. Global wine industry trends
3. Restructuring process – Support areas
4. Restructuring process – Commercial area
5. Fetzer – Excelsior merger
6. 3Q18 results
7. Sustainability
8. Real Estate business

I n v e s t o r
D a y
38
Fetzer-Excelsior merger
1. Further consolidation of distributors and retailers. After the last merger, RNDC /
Breakthru, # 1 & #2 will have 60% market share.
Top US Wine Distributors
Integration Sales (billion)
1 Souther Glazer`s Wine & Spirits 2016 US$ 16.5
2 RNDC & Breakthru 2018 US$ 12.0
3 Young`s Market Co. US$ 3.0
2013 2014 2015 2016 2017
Volume USA
(th. cases) 2,811 2,938 3,083 2,951 2,570
YoY variation -6% 5% 3% -3% -13%
60% market share
2. Low performance of Excelsior.
3. The merger is a step taken after achieving a greater level of expertise by Fetzer
commercial and support teams.

I n v e s t o r
D a y
39
Fetzer-Excelsior merger
• Cost savings from consolidation of sales force and SG&A absorption
Investmente US$ 40,5 mm
Annual savings US$ 9,0 mm
Increment marketing
expenses US$ 4,0 mm
Ahorros netos US$ 5,0 million
Fuerza Venta Nº people Merger
Excelsior 50 90
Fetzer 66
SKU’s Nº Merger
Excelsior 121 440
Fetzer 319
• Consolidation of sales force as of July 1, 2018, a year of adjustments and portfolio integration
• 2019: year of expected sales expansion from innovations and larger marketing expenses

40
I n v e s t o r
D a y
Agenda
1. 2018 harvest
2. Global wine industry trends
3. Restructuring process – Support areas
4. Restructuring process – Commercial area
5. Fetzer – Excelsior merger
6. 3Q18 results
7. Sustainability
8. Real Estate business

I n v e s t o r
D a y
41
3Q18 operating profit
(Ch$ million) 3Q18 3Q17 Var%
Sales 155,021 153,728 0.8%
Gross profit 50,946 51,193 (0.5%)
Gross margin 32.9% 33.3% (40 bp)
SG&A (39,033) (36,461) 7.1%
SG&A / sales (25.2%) (23.7%) (150 bp)
Other Income/Expenses 5,543 160 3374.2%
Operating profit 17,457 14,891 17.2%
Operating margin 11.3% 9.7% 160 bp

I n v e s t o r D a y – R e s u l t a d o s 3 Q 2 0 1 8
42
3Q18 non-recurring items
*.
(Ch$ million) 3Q18 3Q17
Restructuring
Costs 846 499
Expenses 1,483 1,037
Restructuring costs + expenses 2,329 1,536
Revaluation 50% Excelsior 6,218 0
I n v e s t o r
D a y
43
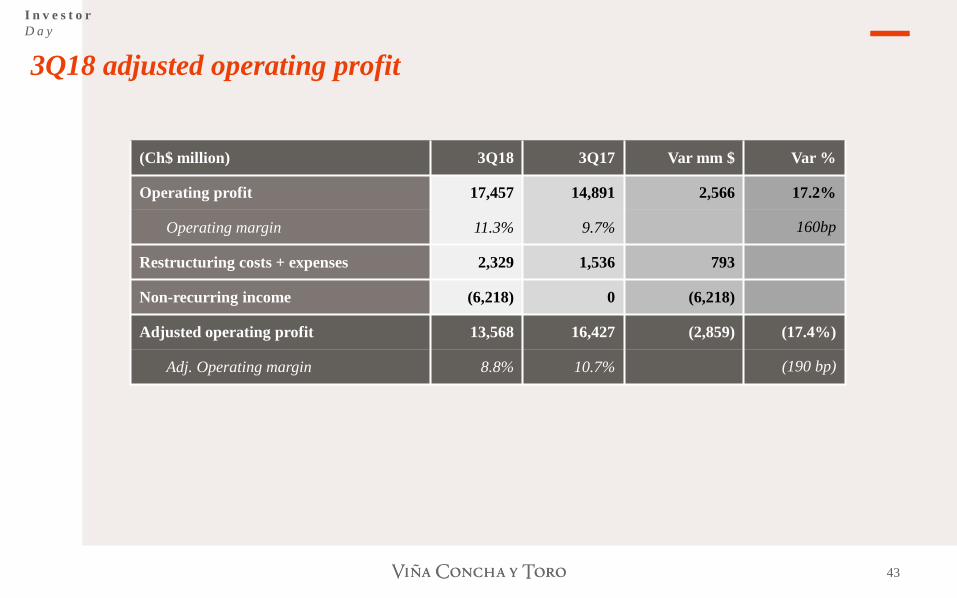
3Q18 adjusted operating profit
*.
(Ch$ million) 3Q18 3Q17 Var mm $ Var %
Operating profit 17,457 14,891 2,566 17.2%
Operating margin 11.3% 9.7% 160bp
Restructuring costs + expenses 2,329 1,536 793
Non-recurring income (6,218) 0 (6,218)
Adjusted operating profit 13,568 16,427 (2,859) (17.4%)
Adj. Operating margin 8.8% 10.7% (190 bp)

I n v e s t o r
D a y
44
3Q18 results – Impact from lower sales volume
Main reasons:
1. Portfolio Rationalization: Exit from 82 out of 304 brands.
2. Volume decline concentrated in non-priority brands:
• Brands in the matrix: -3.6% YoY. Protect and Watch explain 81% of the
decline
• Brands out of the matrix: -15.3% YoY

I n v e s t o r
D a y
45
3Q18 results – Impact from lower sales volume
3. Integration of Excelsior in Fetzer from July 1st, 2018. Large adjustment in the quarter.
• Decline in shipments to USA: -19.2%
4. Fewer business days in September 2018
Bottled exports from Chile (var. 2018/17)
• Jan –mar : -1.4%
•Apr – Jun : -2.2%
• Jul – sept : -9.0%
•September : -26.5%
- Decreases in shipments mainly in direct exports, not at distribution subsidiaries..
5. End of distribution contracts for Diageo and Cusqueña: Decline of $3,098 million

I n v e s t o r
D a y
46
3Q18 non-operating profit
(Ch$ million) 3Q18 3Q17 Var %
Net financial expenses (3,047) (2,584) 17.9%
Exchange differences 2,182 3,791 (42.4%)
Share of profit associates, JV 2,471 2,905 (14.9%)
Non-operating profit 1,606 4,112 (60.9%)

I n v e s t o r
D a y
47
3Q18 affiliates results
(Ch$ million) 3Q18 3Q17 Var %
Industria Corchera 99 169 (41.3%)
Viña Almaviva S.A. 2,546 2,128 19.6%
Others (174) 609 (128.5%)
Share of profit of associates, JV 2,471 2,905 (14.9%)

I n v e s t o r
D a y
48
3Q18 results
(Ch$ million) 3Q18 3Q17 Var %
Sales 155,021 153,728 0.8%
Gross profit 50,946 51,193 (0.5%)
Gross margin 32.9% 33.3% (40 bp)
Operating profit 17,457 14,891 17.2%
Operating margin 11.3% 9.7% 160 bp
Non-operating profit 1,606 4,112 (60.9%)
Net profit 17,582 14,642 20.1%
Net margin 11.3% 9.5% 180 bp
EBITDA 24,626 21,003 17.3%
EBITDA margin 15.9% 13.7% 220 bp

I n v e s t o r
D a y
49
3Q18 Fetzer Vineyards results - individual
(Ch$ million) 3Q18 3Q17 Var %
Sales 19,771 17,884 10.6%
Operating profit 1,877 896 109.5%
Operating margin 9.5% 5.0% 450 bp

I n v e s t o r
D a y
50
3Q18 Trivento results - individual
(Ch$ million) 3Q18 3Q17 Var %
Sales 8,013 9,923 (19.2%)
Operating profit 370 938 (60.6%)
Exchange differences 1,962 379 417.7%
Adjusted operating profit 2,332 1,317 77.1%
Adjusted operating margin 29.1% 13.3% 1,580 bp

I n v e s t o r
D a y
51
9M18 Results
(Ch$ million) 9M18 9M17 Var %
Sales 430,754 434,125 (0.8%)
Gross profit 139,798 142,992 (2.2%)
Gross margin 32.5% 32.9% (50 pb)
Operating profit 41,805 39,541 5.7%
Operating margin 9.7% 9.1% 60 pb
Non-operating profit 4,057 334 1114.6%
Net profit 37,580 29,983 25.3%
Net margin 8.7% 6.9% 180 pb
EBITDA 60,108 56,466 6.5%
EBITDA margin 14.0% 13.0% 90 pb

I n v e s t o r
D a y
Agenda
1. 2018 harvest
2. Global wine industry trends
3. Restructuring process – Support areas
4. Restructuring process – Commercial area
5. Fetzer – Excelsior merger
6. 3Q18 results
7. Sustainability
8. Real Estate business

I n v e s t o r
D a y
53
THE COMPANY INCORPORATES INITIATIVES THAT FOSTER A
BALANCED ADMINISTRATION OF ECONOMIC, ENVIRONMENTAL
AND SOCIAL FACTORS THROUGHOUT THE PRODUCTIVE
PROCESS.
RATIONAL USE OF NATURAL RESOURCES
ENVIRONMENTAL RESPONSIBILITY
COMMITMENT WITH PEOPLE AND
COMMUNITIES
Sustainability

I n v e s t o r
D a y
SOCIAL PRACTICES
CARBON FOOTPRINT Measured since 2007
WATER FOOTPRINT Measured since 2010
RENEWABLE ENERGY
NATIVE FOREST
54
Sustainability
• Eco-glass lightweight bottle used in 99% of portfolio • Carbon footprint certificated by Carbon Trust • 30% reduction of carbon footprint since 2012
• 100% drip irrigation in own vineyards • Water footprint 40% below global industry average
• 65% energy sourcing from clean energy, making progress in certification of energy footprint. Goal: 100% of energy sourcing in 2020
• Compliant with Business Social Compliance Initiative (BSCI) standards • Certificated by Wines of Chile National Sustainability Code • Ruggie Framework Analysis of UN Guiding Principles on Business and
Human Rights
• 3.372 hectares of native forest under conservation plans. 100% of forests with biodiversity inventories
• 2020 Sustainability strategy aligned with United Nations SDG (sustainable development goals)
SUSTAINABILITY STRATEGY
DOW JONES SUSTAINABILITY INDEX
• Top 10 - Global Beverages Ranking - Viña Concha y Toro (4 years in a row)
TRACK RECORD

I n v e s t o r
D a y
Agenda
1. 2018 harvest
2. Global wine industry trends
3. Restructuring process – Support areas
4. Restructuring process – Commercial area
5. Fetzer – Excelsior merger
6. 3Q18 results
7. Sustainability
8. Real Estate business

I n v e s t o r
D a y
56
Real Estate business
• Our Real Estate subsidiary has continued to make progress in feasibility studies and approvals for
our properties in order to maximize their value.
• Progress according to the current phase within Real Estate timelines.
• Projects with the highest degree of advance are La Cisterna y Tocornal.
• In paralell, we have made progress in the divestment of former distribution facilities, with a total
surface of 53,645 m2 and estimated value of UF 200,000, to be executed in 12-24 months.

I n v e s t o r
D a y
57
Real Estate business – La Cisterna ( 50% ownership share)
Location:
La Cisterna, RM
Land area:
10,070 m2
Real Estate project:
apartments.
Project duration:
8 years
Est. land market value w/feasibility:
UF 19/m2
Estimated value of land and project:
UF 48.5/m2
Estimated starting date of construction:
April 2020

I n v e s t o r
D a y
58
Real Estate business – Fundo Tocornal
N
TOCORNAL
Location:
Puente Alto, RM
Land area:
43.57 Ha.
Real Estate project:
Houses
Project duration:
10 years
Est. land market value w/feasibility:
UF 1.8/m2
Estimated value of land and project:
UF 4.5 /m2
Estimated starting date of construction:
December 2021

I n v e s t o r
D a y
Important recognitions
to the company’s portfolio


Investor Day
2022 Strategy
November 16, 2018


