TUBE BENDING WITH AXIAL PULL AND INTERNAL PRESSURE A Thesis by ROHIT AGARWAL Submitted to the Office of Graduate Studies of Texas A&M University in partial fulfillment of the requirements for the degree of MASTER OF SCIENCE May 2004 Major Subject: Mechanical Engineering
Transcript
TUBE BENDING WITH AXIAL PULL AND INTERNAL PRESSURE
A Thesis
by
ROHIT AGARWAL
Submitted to the Office of Graduate Studies of Texas A&M University
in partial fulfillment of the requirements for the degree of
MASTER OF SCIENCE
May 2004
Major Subject: Mechanical Engineering
TUBE BENDING WITH AXIAL PULL AND INTERNAL PRESSURE
A Thesis
by
ROHIT AGARWAL
Submitted to Texas A&M University in partial fulfillment of the requirements
for the degree of
MASTER OF SCIENCE
Approved as to style and content by: ________________________ ______________________
Jyhwen Wang Richard Alexander (Co-Chair of Committee) (Co-Chair of Committee) ________________________ _______________________ Steve Suh Dennis L. O’Neal (Member) (Interim Head of Department)
May 2004
Major Subject: Mechanical Engineering
iii
ABSTRACT
Tube Bending with Axial Pull and Internal Pressure.
(May 2004)
Rohit Agarwal, B.E., Bangalore University, India
Co-Chairs of Advisory Committee: Dr. Jyhwen Wang Dr. Richard Alexander
Tube bending is a widely used manufacturing process in the aerospace, automotive,
and other industries. During tube bending, considerable in-plane distortion and thickness
variation occurs. The thickness increases at the intrados (surface of tube in contact with
the die) and it reduces at the extrados (outer surface of the tube). In some cases, when the
bend die radius is small, wrinkling occurs at the intrados. In industry a mandrel is used to
eliminate wrinkling and reduce distortion. However, in the case of a close bend die
radius, use of a mandrel should be avoided as bending with the mandrel increases the
thinning of the wall at the extrados, which is undesirable in the manufacturing operation.
The present research focuses on additional loadings such as axial force and internal
pressure which can be used to achieve better shape control and thickness distribution of
the tube. Based on plasticity theories, an analytical model is developed to predict cross
section distortion and thickness change of tubes under various loading conditions.
Results from both the FEA and analytical model indicated that at the intrados the increase
in thickness for bending with internal pressure and bending with combined axial pull and
internal pressure was nearly the same. But in the case of bending with the combination of
axial pull and internal pressure there was a significant reduction of thickness at the
extrados.
iv
A parametric study was conducted for the case of bending with combined internal
pressure and axial pull and it was seen that with proper selection of the pressure and axial
pull wrinkling can be eliminated, thickness distribution around the tube can be optimized,
and cross section distortion of the tube can be reduced.
Predictions of the analytical model are in good agreement with finite element
simulations and published experimental results. The model can be used to evaluate
tooling and process design in tube bending.
v
This thesis is dedicated to my Father, Mother and Brother
vi
ACKNOWLEDGEMENTS
I would like to express the deepest appreciation to my advisor, Dr. Jyhwen Wang for
providing me an opportunity to work under his guidance. With his attitude and substance
of a genius: he continually and convincingly conveyed a spirit of enthusiasm, inspiration
and great efforts in regard to my thesis. Without his guidance and persistent help this
research would not have been possible.
The completion of this thesis would not have been possible without the support from
Dr. Richard Alexander who provided important remarks and suggestions at various
stages of my research. I will always be thankful to him for honing my presentation skills,
which will be an asset in my future endeavors. I would also like to take this opportunity
to thank Dr. Steve Suh for serving on my thesis committee and always being ready to go
through any formalities.
A special thanks to Dr. Abu-Odeh Akram for his support with computer software
which made a valuable contribution to my thesis. Thanks also go to the Evans library for
providing clean, quiet, and well-equipped repository and database of highest order.
I would like to express my highest gratitude to my family, relatives and friends for
always inspiring, supporting, and believing in all my ventures.
Finally I would like to acknowledge the services of all those who have helped me
directly or indirectly from Texas A & M University to complete my research.
vii
TABLE OF CONTENTS
Page
ABSTRACT .......................................................................................................... iii DEDICATION ...................................................................................................... v ACKNOWLEDGEMENTS .................................................................................. vi TABLE OF CONTENTS ..................................................................................... vii LIST OF FIGURES .............................................................................................. ix LIST OF TABLES ................................................................................................ xii NOMENCLATURE ............................................................................................. xiii CHAPTER
I INTRODUCTION ........................................................................ 1
1.1 Tube Bending Process ............................................................ 1 1.1.1 Rotary Draw Tube Bending .................................. 2 1.1.2 Compression Tube Bending ................................. 3 1.1.3 Roll Bending ......................................................... 5 1.1.4 Stretch Bending .................................................... 6 1.2 Defects in Tube Bending ......................................................... 8 1.2.1 Variation in Wall Thickness................................... 8 1.2.2 Bursting or Fracture .............................................. 8 1.2.3 Wrinkling ............................................................... 9 1.2.4 Cross Section Distortion ....................................... 10 1.2.5 Springback ............................................................. 11 1.3 Advantages of Additional Loading .......................................... 12 1.3.1 Application of Axial Pull ....................................... 13 1.3.2 Application of Internal Pressure ............................ 13 1.4 Research Objective .................................................................. 14
II LITERATURE REVIEW ............................................................... 17 III ANALYTICAL MODEL ............................................................... 20
3.1 Axial, Circumferential and Radial Stresses and Strains .......... 22
viii
CHAPTER Page
3.1.1 Stresses Induced Due to Bending Moment and Axial Pull ………………………………………... 22
3.1.2 Stresses Induced Due to Internal Pressure ............. 25 3.1.3 Resultant Stress State ............................................ 27 3.1.4 Neutral Axis Shift ................................................. 29
3.2 Wall Thickness Change and Distortion of Cross Section ....... 31 IV FINITE ELEMENT ANALYSIS ................................................. 35
4.1 Validation without Mandrel ................................................... 36 4.2 Validation with Mandrel ........................................................ 38 4.2.1 Effective Plastic Strain ......................................... 41 4.2.2 Change in Relative Thickness .............................. 42
V MODEL PREDICTIONS............................................................. 44
5.1 Comparison of Analytical Model, Experimental
and Numerical Results ........................................................... 44 5.2 Effect of Additional Loading ................................................. 48
5.2.1 Application of Axial Pull ..................................... 49 5.2.2 Application of Internal Pressure ........................... 54 5.2.3 Application of Axial Pull and Internal Pressure ... 56
5.3 Comparison of Wall Thickness Distribution for Different Bending Methods ................................................... 59
VI PARAMETRIC STUDY OF PROCESS PARAMETERS ......... 61
6.1 Effect of Axial Pull ................................................................ 61 6.2 Effect of Internal Pressure ...................................................... 64
VI CONCLUSIONS ......................................................................... 68
REFERENCES .................................................................................................... 70 APPENDIX A SIMULATION OF TUBE BENDING USING LS-DYNA ........ 74 APPENDIX B INPUT DECK FOR ROTARY DRAW TUBE BENDING ....... 83
VITA ..................................................................................................................... 89
ix
LIST OF FIGURES
FIGURE Page
1-1 Tooling of rotary draw tube bending process ............................................. 3
1-2a Initial configuration of compression tube bending .................................... 4
1-2b Final configuration of compression tube bending ..................................... 5
1-3 Roll bending [5] ........................................................................................ 6
1-4a Initial configuration of stretch bending …………..................................... 7
1-4b Final configuration of stretch bending …………….................................. 7
1-5 Variation in wall thickness of the tube ...................................................... 9
3-1 Coordinate system of the bending analysis. (a) bending plane, (b) cross section of tube ............................................................................. 21
3-2 Stress acting on a small element ............................................................... 22
3-3 Pressure acting on tube .............................................................................. 26
3-4 Stress acting on the tube due to internal pressure ..................................... 26
3-5 Neutral axis for the case of pure bending ................................................. 29
3-6 Neutral axis shift e due to the application of axial pull ............................ 30
4-1 Comparison of change in relative thickness obtained from FEA simulations with experimental values of Khodayari [26] .......................... 37
x
FIGURE Page
4-2 Comparison of ovality obtained from FEA simulations with experimental values of Khodayari[26] ........................................................................... 37 4-3 Deformation of tube as it is bend in to different bending angles ............... 40
4-4 Effective strain distribution at the extrados along the length of the tube ... 41
4-5 Effective strain distribution at the intrados along the length of the tube ... 42
4-6 Thickness distribution of the tube on the mid cross-section of 90o bend ... 43
5-1 Comparison of the thickness prediction by analytical model with
experimental results and numerical model of Pan et al. [13] ..................... 45
5-2 Comparison of the thickness prediction by analytical model with experimental results of Khodayari [26] and FEA Simulation ............ 47
5-3 Comparison of cross section distortion of tube obtained from
FEA simulation for different values of coefficient of friction with experimental value Khodayari [26] and analytical model ................. 48
5-4 FEA simulations for 90 degree bend showing wrinkling in the tube.
The tube and geometric and material property used in simulation are listed in table 5-4 .................................................................................. 51
5-5 Application of axial pull eliminates wrinkling .......................................... 52
5-6 Comparison of the thickness prediction by analytical model (axial pull 12.9 kN and no internal pressure) with FEA Simulation (axial pull 12.9 kN and no internal pressure) and analytical model (no axial pull and no internal pressure) .................................................... 52
5-7 Polar plot of the cross section prediction by analytical model (axial pull 12.9 kN and no internal pressure) with undeformed tube ....... 53
5-8 X-Y Plot of the radius prediction by analytical model for axial pull of 12.9 kN and no internal pressure with initial radius of tube ................ 54
xi
FIGURE Page
5-9 Comparison of the thickness prediction by analytical model
(no axial pull and internal pressure of 10 MPa) with FEA Simulation (no axial pull and internal pressure of 10 MPa) and analytical model (no axial pull and no internal pressure) ..................................................... 55
5-10 Comparison of the radius prediction by analytical model
(no axial pull and internal pressure of 10MPa) with undeformed tube ..... 56 5-11 Comparison of the thickness prediction by analytical model
(axial pull 12.9 kN and internal pressure of 4MPa) with FEA Simulation (axial pull 12.9 kN and internal pressure of 4MPa) and analytical model (no axial pull and no internal pressure) ..................................................... 57
5-12 Comparison of the radius prediction by analytical model
(axial pull 12.9 kN and internal pressure of 4MPa) with undeformed tube . 58 5-13 Comparisons of thickness prediction by analytical model
(axial pull of 12.9 kN and no internal pressure) with FEA simulation with and without Pressure die boost of 50 MPa ......................................... 59
5-14 Comparison of thickness distribution for bending with mandrel,
internal pressure and combination of internal pressure and axial pull ..... 60
6-1 Comparison of maximum thickness at intrados at constant pressure for increasing values of axial pull ............................................................ 62
6-2 Comparison of minimum thickness at extrados at constant pressure
for increasing value of axial pull ............................................................. 63 6-3 Comparison of cross section distortion at constant pressure
for increasing value of axial pull ............................................................. 64 6-4 Comparison of maximum thickness at intrados at constant axial pull
for increasing value of internal pressure ................................................... 65 6-5 Comparison of maximum thickness at extrados at constant axial pull
for increasing value of internal pressure ................................................. 66 6-6 Comparison of cross section distortion at constant axial pull
for increasing value of internal pressure ................................................. 67
xii
LIST OF TABLES
TABLE Page
4-1 Material and geometric properties used by Khodayari [26]..................... 36
4-2 Material property of Stainless Steel SS304 (Roll formed and laser welded) ................................................................ 38
4-4 Geometry of tube ....................................................................................... 39
5-1 Geometric and material properties used by Pan et al. [13] ...................... 45
5-2 Comparison of change in relative thickness predicted by Pan et al. [13] and analytical model .......................................................... 46
5-3 Geometric and material properties of the tube ........................................... 50
xiii
NOMENCLATURE
r mean radius of tube
t initial wall thickness of tube
R radius of bend die or center line radius
θ bending angle or degree of bend
F axial pull applied to the tube in the direction opposite to the tube movement
α span angle of the tube
iP applied internal pressure
xmdP axial internal force induced in element due to the bending moment
A area of cross-section of the tube
xmσ longitudinal stress induced in the tube due to the bending moment
xfdP axial force induced in element due to the applied axial force
xfσ axial stress due to the applied axial force rt
Fxf π
σ2
=
xdP resultant axial force acting on the element
xσ resultant axial stress acting on the tube
dv centripetal force acting on the element
cdP circumferential force acting on the element
cdσ circumferential stress acting on the element y vertical distance of the element from the tube center
K geometric parameter ( )αcosln
rRrRK
++
=
xiv
cσ circumferential stress acting on the tube
rσ radial stress acting on the tube
Y yield strength of tube material
xpσ longitudinal stress induced in the tube due to internal pressure
cpσ circumferential stress or hoop stress induced in the tube due to internal pressure
xoσ resultant axial stress at extrados
coσ circumferential stress at extrados
roσ radial stress at extrados
xiσ resultant axial stress at intrados
ciσ circumferential stress at intrados
riσ radial stress at intrados
xε longitudinal strain
xbε longitudinal bending strain
xtε longitudinal tensile strain
e neutral axis shift
φ neutral axis shift in degrees
cε circumferential strain
rε radial strain
αt thickness of the tube at an angle α after bending
extt _α thickness of tube at extrados after bending
xv
int_αt thickness of tube at intrados after bending
coε circumferential strain at extrados
ciε circumferential strain at intrados
αr final radius of the tube thickness of tube at extrados after bending
extr _α radius of tube at extrados after bending
int_αr radius of tube at intrados after bending
Ω cross section distortion
Dmax maximum diameter of the major axis of tube
Dmin minimum diameter of the minor axis of the tube
Do initial diameter of tube
OD outside diameter of tube
1
CHAPTER I
INTRODUCTION
Tube bending processes are widely used to manufacture parts in aerospace,
automotive, oil and other industries. Tubes are used as components in manufacturing of
parts in numerous industries. Their application ranges from simple household items to
sophisticated aerospace parts. Wherever tubes are used, accurate bend angle and uniform
cross section are often desired. In the past decade, tubes have found many new
applications in the automotive industry. Tube hydroforming has been identified as a new
technology to manufacture parts. Tube hydroforming has many advantages in
comparison with conventional manufacturing via stamping and welding. It can reduce
the weight of the component, retain and even improve the strength and stiffness, reduce
tooling cost due to fewer parts and tube hydroforming requires fewer secondary
operations [1-3]. In most cases, the first step of tube hydroforming is bending of the tube
to the required shape. The tube is bent to the approximate centerline of the final part to
enable the tube to be placed in the die cavity [4]. The performance of tube hydroforming
depends upon the pre-bending process. Recently Ford Motor Company used
hydroforming to manufacture the chassis of its new model Ford F150.
The thesis follows the style and format of ASME Journal of Manufacturing Science
and Engineering.
2
1.1 Tube Bending Process
There are many ways by which a tube can be bent into the required radius. The main
techniques by which tube can be bent into the desired shape are rotary draw tube
bending, compression tube bending, roll bending and stretch bending. The selection of
technique depends upon the following factors [5]:
1. The quality of the bend and production rate desired.
2. Diameter, wall thickness and minimum bend radius desired.
1.1.1 Rotary Draw Tube Bending
Rotary draw tube bending is the most flexible bending method and is used immensely in
industry on account of its tooling and low cost. The tooling consists of a bend die, clamp
die, pressure die and wiper die. In this bending technique the tube is securely clamped to
the bend die by using the clamp die. The bend die rotates and draws the tube along with
it. The pressure die prevents the tube from rotating along with the bend die. The pressure
die may be stationary or it may move along with tube. The pressure die provides a boost
(pushes the material at the extrados of the tube) to reduce the thinning of the tube and
can be very helpful when the bending angle is large and the bending radius is small [6].
A mandrel along with wiper die may be used to prevent the wrinkling and collapse of the
tube. But the use of mandrel should be avoided if possible since it increases the
production cost [7]. Figure 1-1 shows the tooling of rotary draw bending process. Rotary
3
draw tube bending provides close control of metal flow necessary for small radius and
thin walled tube [5].
Fig. 1-1 Tooling of rotary draw tube bending process
1.1.2 Compression Tube Bending
The tooling for the compression tube bending is similar to the rotary draw tube
bending. It consists of the stationary bend die, a moving wiper shoe and a clamp. The
only difference between the rotary braw bending and compression bending process is
that in rotary draw tube bending the bend die is movable whereas in the compression
tube bending the bend die is stationary. In compression tube bending the tube is clamped
4
to the bending die near the rear tangent point. The wiper shoe pushes the tube along the
bending die as it rotates around it. Figures 1-2a and 1-2b show the initial and final
configuration of the compression tube bending.
Fig. 1-2a Initial configuration of compression tube bending
5
Fig. 1-2b Final configuration of compression tube bending
1.1.3 Roll Bending
The tooling for roll bending consists of three rolls of the same size arranged in a
pyramid pattern, as shown in Figure 1-3. Two rolls are fixed and the third (center) roll is
movable. The tube is passed through the rolls and the center roll is lowered onto the
tube. This bending technique is usually employed for bending tubes of large radius,
spirals and tube sections of different diameters [5].
6
Fig. 1-3 Roll bending [5]
1.1.4 Stretch Bending
Stretch bending is one of the newer bending techniques being used in industry. In
stretch bending both the inner and outer fibers of the tube are in tension. The outer fiber
is stretched more than the inner fiber. In the other bending methods described above the
outer fibers are in tension whereas the inner fibers are in compression. The tooling for
stretch forming consists of a mandrel (bending die), jaws, and hydraulic actuators. In this
process the tube is first gripped by the jaws which are mounted on hydraulic actuators.
The grips also seal the ends. The tube is first stretched axially to a chosen value of
tension, and then pressure is increased to the desired level while the tension is kept
7
constant. The mandrel then moves and bends the tube [8, 9]. Figures 1-4a and 1-4b
show the initial and final configuration of stretch bending.
Fig. 1-4a Initial configuration of stretch bending
Fig. 1-4b Final configuration of stretch bending
8
1.2 Defects in Tube Bending
During the bending process the tube undergoes considerable in-plane distortion. The
limitations in the tube bending process are distortion of cross-section, wrinkling,
variation in wall thickness, springback and fracture.
1.2.1 Variation in Wall Thickness
During the bending process the bending moment induces axial forces in the inner and
outer fibers. The inner and outer fibers are subjected to compressive and tensile stresses
respectively. This results in thinning of the tube wall at the outer section (extrados) and
thickening of the tube wall at the inner section (intrados). The wall thickness variation is
shown in Figure 1-5.
1.2.2 Bursting or Fracture
The fibers at the extrados are subjected to tensile stress. When the tensile stress
induced in the tube due to the bending moment at the extrados exceeds the ultimate yield
strength of the material, the tube fractures at the extrados.
9
Fig. 1-5 Variation in wall thickness of the tube
1.2.3 Wrinkling
As the tube is bent, the inner surface of the tube, the intrados is subjected to
compressive stress. When the tube is bent into a tight radius, it is subjected to high
compressive stress in the intrados which leads to Bifurcation instability or buckling
(wrinkling) of the tube. Wrinkles are wavy types of surface distortions. As tubes are
used as parts in many applications where tight dimensional tolerances are desired,
wrinkles are unacceptable and should be eliminated. Furthermore, wrinkles spoil the
aesthetic appearance of the tube. Figure 1-6 shows tube wrinkling.
10
Fig. 1-6 Tube wrinkling
1.2.4 Cross Section Distortion
As described above the outer fibers of the tube are subjected to tensile stress whereas
inner fibers of the tube are subjected to compressive stress. There is a tendency of fibers
at both the ends to move towards the neutral axis. The outer fiber of the tube tends to
move towards the neutral plane to reduce the tensile elongation. This results in the cross
section of the tube being no longer circular, instead becoming oval. The common
practice in industry is to provide support to the tube from inside to prevent flattening or
distortion of cross section; usually a filler material or mandrel is used for that. Figure 1-7
shows the cross section distortion of tube.
11
Fig. 1-7 Cross section distortion
1.2.5 Springback
After the bending process is complete and the toolings have been withdrawn the bend
tube springbacks due to the elastic nature of the tube material. This is called springback
or the elastic recovery of the tube. During the bending process internal stresses are
developed in the tube and upon unloading the internal stresses do not vanish. After
bending the extrados is subjected to residual tensile stress and the intrados is subjected to
residual compressive stress. These residual stresses produce a net internal bending
moment which causes springback. The tube continues to springback until the internal
bending moment drops to zero. The springback angle depends on the bend angle, tube
material, tube size, mandrel, machine and tooling [10]. In actual practice the amount of
12
springback is calculated and the tube is over bent by that amount. Figure 1-8 shows
springback after the tooling has been removed.
Fig. 1-8 Springback
1.3 Advantages of Additional Loading
The present study is focused on additional loading conditions in tube bending. The
additional loadings considered are application of axial pull in the direction opposite to
the motion of the tube, application of internal pressure and combination of internal
pressure and axial pull. The application of internal pressure and axial pull either
individually or in combination has various advantages when compared to the
conventional bending methods.
13
1.3.1 Application of Axial Pull
The main goal for applying axial pull is to eliminate wrinkling, a compressive
buckling problem. The application of axial pull reduces the compressive stress at the
intrados and as the axial pull is increased further wrinkling can be eliminated. The
advantages of using axial pull are listed below.
1. Eliminates wrinkling.
2. Reduces springback
3. Reduces tooling cost by eliminating the use of expensive mandrel and wiper die.
4. Improves bending for small bend die radius.
5. Increases versatility of the bending process.
Despite the above mentioned advantages, application of axial pull increases the cross
section distortion.
1.3.2 Application of Internal Pressure
The longitudinal stress developed due to the internal pressure helps in reducing the
compressive stress at intrados i.e. with proper selection of pressure wrinkling can be
eliminated. The main advantages of applying internal pressure are
1. Eliminates wrinkling.
2. Reduces the cross section distortion.
14
3. Reduces the thinning at the extrados for small bend die radius as compared to
using a mandrel.
4. Increases plastic flow due to the absence of friction between the tube and fluid.
5. Provides better contact with the tube as compared to using a mandrel.
In certain cases very high pressure may be required to eliminate wrinkling, so a
combination of internal pressure and axial pull may be necessary to get the optimum
results.
1.4 Research Objective
As described above, wrinkling and cross section distortion are the two most severe
defects in the tube bending process. Industry practice for eliminating wrinkling is to use
a mandrel along with a wiper die. Mandrel selection depends on the angle of bend,
material of the tube and the degree of bend.
The present research investigates application of only axial pull, only internal pressure
and combination of axial pull and internal pressure on the conventional rotary draw tube
bending process. Application of axial pull in the direction opposite to the motion of the
tube eliminates wrinkling. It also assists in reducing springback. Despite the fact that
axial pull eliminates wrinkling and reduces springback, it further adds to the problem of
cross section distortion. To eliminate the problem of cross-section distortion, a
combination of axial pull and internal pressure will be employed to achieve a better
15
cross section of the tube. In addition to axial pull, internal pressure will be applied to the
tube to eliminate wrinkling. There are four main goals in this thesis:
1. Develop an analytical model to predict the thickness distribution and cross
section distortion during bending along the mid cross section of the tube for variable
loading conditions. The loading conditions studied in the present research are application
of axial pull in the direction opposite to the tube movement, application of internal
pressure and combination of the two.
2. Develop a FEA simulation to predict the thickness distribution, effective plastic
strain and cross section distortion of the along the tube during the bending process. The
results obtained form the FEA simulation will be verified with published experimental
results.
3. Compare the results obtained by the analytical model for different loading
conditions with the results obtained from the FEA simulations.
4. Perform a parametric study using finite element simulations to investigate the
effects of axial pull and internal pressure on tube bending.
The outline of the present thesis is as follows: chapter II presents the literature search
on the work done on various aspects of tube bending. Chapter III presents an analytical
model to predict the thickness distribution and cross section distortion of the tube during
bending. Plastic deformation theory is used for the model. In chapter IV, the FEA
capability is presented by comparing the results of the FEA simulation with previously
published results. In chapter V, the results of the analytical model were compared for
different loading conditions. First the model was compared with no additional loading
16
with the published experimental and numerical results. Then the results for different
loading conditions predicted by the analytical model developed in chapter III are
compared with the results of the FEA simulations. In chapter VI, a parametric study is
conducted to study the effects of pressure and tension on the thickness, effective plastic
strain and cross section distortion of the tube. Finally the conclusions are made on the
basis of the present study.
17
CHAPTER II
LITERATURE REVIEW
In the past, researchers have worked on cross section distortion, wall thickness
variation, and wrinkling issues related to pure bending of tubes. Brazier [11] studied the
distortion of round tubes in elastic bending using energy minimization. Named after
Brazier’s work, the cross section deformation in tube bending is often called the Brazier
effect. Zang and Yu [12] investigated the Brazier effect of an infinitely long, cylindrical
tube under pure elastic-plastic bending. Expressions of bending moment and flattening
ratio in terms of radius of curvature were obtained. Considering a finite length tube, Pan
and Stelson [13] used energy method to solve for the distortion shape and wall thickness
variation of plastically deformed tubes. Tang [14] developed expressions for calculating
the magnitude of stresses in simple tube bending. Wall thickness change, shrinking rate
at the bend section, deviation of the neutral axis, and feed preparation length were
derived based on plastic deformation theories. Corona and Kyriakides [15], Kyriakides
and Ju [16], and Corona and Vase [17] investigated the instability (wrinkling) of infinite
length, cylindrical and square tubes under bending. Wang and Cao [18] studied
wrinkling in tube bending with boundary restriction at the ends. An energy method was
used to determine the critical bending radius at the onset of wrinkling as a function of
tube dimensions, tooling geometry and material properties. With the advancement of
computational mechanics, the finite element method has been used to simulate tube
bending process. Zhan et al. [19] simulated a rotary draw tube bending process for a
18
thin-walled tube. It was seen that the maximal wall thinning ratio at the extrados
changes only slightly, and the maximal wall thickening ratio at the intrados increases
linearly with increase of bend angle. Yang et al. [7] simulated the rotary bending process
and concluded that in the case of bending with mandrel, the section remained close to
circular, but the thickness reduction at extrados can be significant. Tarana [6] conducted
simulations of rotary draw bending and tube hydroforming processes. The influence of
bending operation on hydroforming was demonstrated.
With changes in loading condition, tubes under stretch bending behave differently
from those under rotary bending. Dyau and Kyriakides [20] studied the response of long,
relatively thin-walled tubes bent into the plastic range in the presence of axial tension. It
was found that the ovalization induced in bending with tension depends upon the loading
path, the material properties, and the geometry of the tube. Miller et al. [8, 9] conducted
a series of experiments on bending of rectangular tubes on a bend-stretch form-pressure
machine and developed analytical models to predict the distortion, elongation, and
springback of tubes as functions of the pressure, tension, and die radius. In their
experiments they found that tubes can be formed without wrinkling at value of tension
lower than the yield tension. Zhu and Stelson [21] studied the distortion of cross section
of a rectangular tube during stretch bending. The internal pressure at which no distortion
will occur was calculated from the tube thickness, die radius, and yield strength of the
material.
Several important findings from the previous tube bending research motivated the
present study. First, wrinkling tendency can be reduced with axial tension. While axial
19
tension generates larger cross section distortion, moderate internal pressure could
minimize the distortion. Although better shape control is achieved, combining axial
force and internal pressure could result in deteriorated wall thickness variation. Thus, the
objective of the present work is to develop an analytical model to predict the shape and
thickness of tubes under bending, axial force, and internal pressure. Instead of using
energy minimization approach employed in most of the previous work, plastic
deformation theories adapted by Tang [14] are used. Finite element simulations of rotary
draw bending with and without axial force and internal pressure were conducted. The
effects of additional axial force and internal pressure are presented and discussed.
20
CHAPTER III
ANALYTICAL MODEL
The present chapter presents an analytical model to predict wall thickness distribution
along the cross section of the tube and the cross section distortion of the tube. An
analytical model provides an accurate prediction of final tube geometry in a
comparatively smaller computing time than that for FEA simulations. A generalized
model is developed to predict the wall thickness change and cross section distortion of
the tube for combined internal pressure and axial pull.
The coordinate system used in the analysis is shown in Figure 3-1. On the bending
plane, a tube of radius r (tube center to the mid wall) and wall thickness t is bent over a
die of radius R with bending angleθ. Axial force F, applied at the end is equal to zero in
case of pure bending and bending with internal pressure only. On the cross section, the
circumference of the tube is represented by span angle α. The extrados is defined by
20 πα <≤ and παπ 223 <≤ . The intrados is the section where 232 παπ <≤ .
Internal pressure , applied to the inside surface of the tube is equal to zero in the case
of pre bending and bending with axial pull only.
iP
The pertinent assumptions for the analysis include:
1. A plane perpendicular to the tube axis before deformation remains plane and
perpendicular to the axis after deformation.
2. Wall thickness of the tube is small in comparison to the length and radius of the
tube. Hence deformation due to transverse shear is neglected.
21
3. The deformation is symmetric with respect to the x-y plane and the plane normal
to x-y plane at 2θ .
4. The material is incompressible, elastic strain is neglected, and work hardening is
not considered.
5. Friction between the tube and tooling is neglected.
6. Neutral axis shift during pure bending (bending without additional loading) is
neglected.
Fig. 3-1 Coordinate system of the bending analysis (a) bending plane, (b) cross section of tube
Under these assumptions, the stresses, strains, thicknesses, and distortion of the tube due
to bending, axial force, and internal pressure were derived. Mathematical software
MapleTM 9 is used for symbolic processing and numerical evaluation of the equations.
22
3.1 Axial, Circumferential, and Radial Stresses and Strains
In the case of bending with axial pull and internal pressure the tube is subjected to
longitudinal stresses and circumferential stresses due to the bending moment, axial pull
and the internal pressure.
3.1.1 Stresses Induced due to Bending Moment and Axial Pull
Consider a small element of the tube undergoing deformation as shown in Figure 3-2a
and Figure 3-2b.
Fig. 3-2a Stress acting on a small element
23
The axial internal force induced in the element as a result of the bending moment is : xmdP
Fig. 3-2b Stress cube
( )ασσ dtrAdP xmxmxm == (3-1)
where xmσ is the axial stress induced in the tube due to bending moment and A is the
cross section area. The axial force induced in the element due to the applied axial force F
is : xfdP
24
( ) ( ασα )π
dtrdtrrt
FdP xfxf ==2
(3-2)
where, rt
Fxf π
σ2
= is the axial stress due to the applied axial force. Hence the resultant
This centripetal force has a component in the circumferential direction:
( ) ααθσα sinsin trddvdP xc == (3-5)
Following Tang’s [16] approach, the circumferential force can be represented in terms of
the circumferential stress cσ :
( ) θσ )( yRtddP cc += (3-6)
where y is the vertical distance from the tube center to the element and αcosry = as
shown in Figure 3-2. Equating (3-5) and (3-6):
( )xc rR
drd σααασ
cossin+
= (3-7)
The circumferential stress is then obtained by integrating (3-7)
rRrR
xc ++
−=ασσ cosln (3-8)
To simplify the expression, let
αcosln
rRrRK
++
= (3-9)
25
Therefore
xc Kσσ = (3-10)
Without the application of axial force and internal pressure, the bending moment
alone results in plastic deformation. Based on von Mises criterion:
( ) ( ) ( ) 2222 2Yxrrccx =−+−+− σσσσσσ (3-11)
and xmx σσ = , xc Kσσ = , 0=rσ yield:
12 +−±=
KKY
xmσ (3-12)
where Y is the yield strength of the material.
The sign indicates tension or compression at the extrados or intrados. ±
3.1.2 Stresses Induced due to Internal Pressure
Figure 3-3 shows the internal pressure acting on the tube. Figure 3-4 shows the
stress induced on the tube due to internal pressure. Since the wall thickness of the tube is
very small in comparison to the radius of the tube, the radial stress is taken as zero i.e.
iP
0=rσ . xpσ is the longitudinal stress induced in the tube due to the internal pressure and
cpσ is the hoop stress or the circumferential stress induced in the tube due to the internal
pressure.
26
Fig. 3-3 Pressure acting on tube
Fig. 3-4 Stress acting on the tube due to internal pressure
27
trPi
xp 2=σ (3-13)
trPi
cp =σ (3-14)
3.1.3 Resultant Stress State
As the result, the longitudinal stress at extrados due to combined loading of bending,
axial force, and internal pressure can be expressed by adding equation (3-13) to equation
(3-3) and substituting equation (3-12) and rt
Fxf π
σ2
= into equation (3-3).
trP
rtF
KKY i
xo 2212++
+−=
πσ (3-15)
The circumferential stress is obtained by adding equation (3-14) to equation (3-10)
trP
K ixco += σσ (3-16)
Radial stress is given by
0=roσ (3-17)
As the result, the longitudinal stress at intrados due to combined loading of bending,
axial force, and internal pressure can be expressed by adding equation (3-13) to equation
(3-3) and substituting equation (3-12) and rt
Fxf π
σ2
= into equation (3-3).
28
trP
rtF
KKY i
xi 2212++
+−−=
πσ (3-18)
The circumferential stress is obtained by adding equation (3-14) to equation (3-10)
trP
K ixci += σσ (3-19)
Radial stress is given by
0=riσ (3-20)
3.1.3 Neutral Axis Shift
Figure 3-5 shows the distribution of longitudinal stress across the cross section of the
tube in case of pure bending. It is assumed that the tube is bent first and then axial pull is
applied to the tube [24]. Due to the application of axial pull the neutral axis shifts
towards the inside of the bend and with increase in the axial pull, neutral axis moves out
of the plane of bending. With the application of the axial pull the neutral axis shifts by
an amount e towards the center of bend. The longitudinal stress distribution for that case
is shown in Figure 3-6.
29
Fig. 3-5 Neutral axis for the case of pure bending
30
Fig. 3-6 Neutral axis shift e due to the application of axial pull
The longitudinal strain has two components- tensile strain ( xtε ) induced due to the
axial pull, and bending strain ( xbε ) [12]. The tensile strain remains constant throughout
the section.
Ry
Re
xbxtx +=+= εεε (3-21)
where, e is the neutral axis shift
Duncan [24] calculated the neutral axis shift in case of sheet bending on application
of axial pull. The same technique is employed to calculate the neutral axis shift of the
tube.
31
( ) ( ) ααααπ
φ
φ
drYtdrYtF ∫∫ −= coscos0
(3-22)
⎟⎠⎞
⎜⎝⎛= −
YtrF
2sin 1φ (3-23)
where, φ is the neutral axis shift in degrees.
αcosry = (3-24)
φcosre = (3-25)
The resultant longitudinal strain is obtained by substituting equation (3-24) and (3-25)
into equation (3-21)
( φαε coscos += )Rr
x (3-26)
By flow rule, the strain state can be obtained as:
( )( ) x
rcx
cxrr ε
σσσσσσ
ε+−+−
=22
(3-27)
( )( ) x
rcx
xrcc ε
σσσσσσ
ε+−+−
=22
(3-28)
3.2 Wall Thickness Change and Distortion of the Cross Section
The wall thickness change and distortion of the cross section can be derived from the
stresses and strains due to loading. The thickening of the intrados and thinning of the
extrados are found from the radial strain:
32
( tt r )εα += 1 (3-29)
where is the wall thickness of the tube at a given span angle αt α .
Radial strain at extrados is obtained by substituting equation (3-15), equation (3-16),
equation (3-17) and equation (3-26) into equation (3-27)
( )( ) ( )
( )( )( ⎟
⎠⎞
⎜⎝⎛ +
−−+
+−++= φα
σσ
σσεα coscos
22
32
1_ R
r
KtrP
K
KtrP
K
ixfxm
ixfxm
ext ) (3-30)
Substituting equations (3-30) into equation (3-29) the wall thickness distribution along
the extrados is given by
( )( ) ( )
( )( )( t
Rr
KtrP
K
KtrP
Kt
ixfxm
ixfxm
ext
⎥⎥⎥⎥
⎦
⎤
⎢⎢⎢⎢
⎣
⎡
⎟⎠⎞
⎜⎝⎛ +
−−+
+−+++= φα
σσ
σσα coscos
22
32
11_ ) (3-31)
Radial strain at intrados is obtained by substituting equation (3-18), equation (3-19),
equation (3-20) and equation (3-26) into equation. (3-27)
( )( ) ( )
( )( )( ⎟
⎠⎞
⎜⎝⎛ +
−−−
+−+−= φα
σσ
σσεα coscos
22
32
1int_ R
r
KtrP
K
KtrP
K
ixfxm
ixfxm
) (3-32)
Substituting equation (3-32) into equation (3-29) the wall thickness distribution along
the extrados is given by
( )( ) ( )
( )( )( ) t
Rr
KtrP
K
KtrP
Kt
ixfxm
ixfxm
⎥⎥⎥⎥
⎦
⎤
⎢⎢⎢⎢
⎣
⎡
⎟⎠⎞
⎜⎝⎛ +
−−−
+−+−+= φα
σσ
σσα coscos
22
32
11int_
(3-33)
33
The cross section distortion is caused by the circumferential stress on the tube.
Substituting equations (3-15), (3-16), (3-17), (3-26) into (3-28), the circumferential
strain along the extrados can be calculated by:
( )( )
( )( )( ⎟
⎠⎞
⎜⎝⎛ +
+−+
⎟⎠⎞
⎜⎝⎛ ++−+
−= φασσ
σσε coscos
22
2112
_ Rr
KtrP
K
KtrP
K
ixfxm
ixfxm
extc ) (3-34)
Substituting Equations (3-18), (3-19), (3-20), (3-26) into (3-28) the circumferential
strain along the intrados can be calculated by:
( )( )
( )( )( ⎟
⎠⎞
⎜⎝⎛ +
−−−
⎟⎠⎞
⎜⎝⎛ +−−−
−= φασσ
σσε coscos
22
21
212
int_ Rr
KtrP
K
KtrP
K
ixfxm
ixfxm
c ) (3-35)
It is reasonable to estimate the cross section distortion from the tube radii calculated
from the circumferential strain around the tube ( πα 20 <≤ ):
( rr c )εα += 1 (3-36)
Substituting equation (3-34) in (3-36) the radius of tube at the outside of the bend is
calculated by
( )( )
( )( )( r
Rr
KtrP
K
KtrP
Kr
ixfxm
ixfxm
ext
⎥⎥⎥⎥
⎦
⎤
⎢⎢⎢⎢
⎣
⎡
⎟⎠⎞
⎜⎝⎛ +
+−+
⎟⎠⎞
⎜⎝⎛ ++−+
−= φασσ
σσ
α coscos
22
2112
1_ ) (3-37)
Substituting equation (3-35) in (3-36) the radius of tube at the inside of the bend is
calculated by
34
( )( )
( )( )( ) r
Rr
KtrP
K
KtrP
Kr
ixfxm
ixfxm
⎥⎥⎥⎥
⎦
⎤
⎢⎢⎢⎢
⎣
⎡
⎟⎠⎞
⎜⎝⎛ +
−−−
⎟⎠⎞
⎜⎝⎛ +−−−
−= φασσ
σσ
α coscos
22
21
212
1int_ (3-38)
35
CHAPTER IV
FINITE ELEMENT ANALYSIS
Finite element simulations were used to obtain the thickness distribution of the tube,
maximum effective plastic strain induced in the tube and the distortion of the cross
section of the tube during the bending process. Simulations were carried on using Finite
Element Analysis (FEA) solver LS-DYNA [24]. HyperMesh [25] and HyperView were
used for pre and post processing of the model. Appendix A, p. 74 describes step by step
procedure to construct the input deck for the rotary draw tube bending simulation using
HyperMesh. The input deck is presented in Appendix B, p. 83. The FEA simulation
technique was validated by comparing the results with that of a previously published
work on rotary draw tube bending. This is important to show simulation capability and
get accurate results. Two simulations were carried out for the validation purpose. The
tooling for the first simulation was carried out using bend die, clamp die and pressure die
bending with simulation was carried out based on the geometric and material property
used by Khodayari [26] in his experiment. The results of the second simulation were
compared with the simulation results of Shr [27]. The rigid toolings for the second
simulation consisted of bend die, clamp die, pressure die, mandrel and wiper die. In this
the pressure die exerted a pressure of 50 MPa on the tube. Since in the present study
internal pressure is applied to the tube, the technique of applying pressure was validated
in the second simulation.
36
4.1 Validation without Mandrel
The tooling consisted of bend die, clamp die, and pressure die. The material and
geometric properties are listed in table 4-1.
Table 4-1 Material and geometric properties used by Khoyadari [26]
Parameter Magnitude
Outside diameter of the tube (mm) 20
Thickness of the tube (mm) 1.5
Radius of bend die (mm) 50
Yield strength of tube material (MPa) 270
Young’s Modulus of tube material (MPa) 219,400
Tangent modulus of tub material (MPa) 900
Poisson’s ratio 0.3
Coefficient of friction between tube and bend die
0.1
The thickness distribution and cross section distortion are shown in Figure 4-1 and 4-
2 respectively. It is seen that the thickness reduction at extrados predicted by Khoyadari
was 9 % while the FEA simulation predicted 9.07 %. At intrados Khoyadari predicted an
increase of 11 % while the FEA results predicted 12.8 %. The maximum cross section
distortion predicted by Khoyadari was 10 % while the FEA simulation predicted 6.2%.
Simulation with different value of coefficient of friction was done and it was found that
for coefficient of friction of 0.3 the cross section distortion was 8.7 %.
37
-20
-10
0
10
20
0 30 60 90 120 150 180
Angular position α (degrees)
Cha
nge
of re
lativ
e th
ickn
ess
(%)
FEA Simulation
Experiment Khodayari [26]
Fig. 4-1 Comparison of change in relative thickness obtained from FEA simulations with experimental values of Khodayari [26]
0
2
4
6
8
10
12
0 30 60
Bend angle θ (Degrees)
Ova
lity Ω
(%)
90
Coef. of friction = 0.1
Coef. of friction = 0.2
Coef. of friction = 0.3
Experiment Khodayari[26]
Fig. 4-2 Comparison of ovality obtained from FEA simulations with experimental values of Khodayari[26]
38
4.2 Validation with Mandrel
Stainless Steel SS304 was the material used for the tube. Table 4-2 shows the
mechanical property of Stainless Steel SS304 used for the simulation. Table 4-3 lists the
Simulation parameters used in the analysis. Geometry of the tube is shown in table 4-4.
Table 4-2 Material property of Stainless Steel SS304 (Roll formed and laser welded)
Material Property Value
Young’s Modulus E (GPa) 210
Poisson’s Ratio ν 0.3
Strain Hardening coefficient K (MPa) 1451
Strain hardening exponent n 0.6
Initial strain ε0 0.06
39
Table 4-3 Simulation parameters
Value
Bend Die Radius/ Centerline Radius R (mm) 171.45 (3D)
Pressure Die Pressure (Mpa) 50.00
Mandrel type used in simulation Plug Mandrel with wiper
die
Position of mandrel relative to tangent point (mm) 4.43
Mandrel- tube inside surface clearance (mm) 0.286
Table 4-4 Geometry of tube
Value
Initial Tube length L0 (mm) 498.000
Initial tube outside diameter OD (mm) 57.150
Mean Radius of the tube r (mm) 27.146
Initial wall thickness of the tube t (mm) 2.858
The deformation of the tube at different bending angles is shown in Figure 4-3.
40
Fig. 4-3 Deformation of tube as it is bent in to different bending angles
41
4.2.1 Effective Plastic Strain
Effective plastic strain distribution at the extrados for 90o bend is shown in Figure 4-
4. It is seen that the stress at the clamped region remains zero in the FEA simulation
where as it has a very small magnitude in Shr’s simulation. The difference is due to the
contact card used for clamping the tube to the bend die. In the present simulation the
nodes of the tube near the clamp die are constrained to the clamp. The maximum
effective plastic stress predicted by Shr is 0.1688 at extrados whereas for the FEM
simulation it is 0.1666.
0.00
0.02
0.04
0.06
0.08
0.10
0.12
0.14
0.16
0.18
0.20
0 100 200 300 400 500Position in the tube axial direction in extrados (mm)
Effe
ctiv
e pl
astic
str
ain
( ε)
FEA Simulation
FEA Simulation Shr [27]
Fig. 4-4 Effective plastic strain distribution at the extrados along the length of the tube
42
Effective plastic strain distribution at the intrados is shown in Figure 4-5. Again it is
seen that the stress at the clamped region remains zero in the FEM simulation where as it
has a very small magnitude in Shr’s simulation. The difference is due to the contact card
used for clamping the tube to the bend die. The maximum plastic effective strain
predicted by Shr is 0.1581 at intrados whereas for the FEM simulation it is 0.1645.
0
0.02
0.04
0.06
0.08
0.1
0.12
0.14
0.16
0.18
0.2
0 100 200 300 400 500 600Position in the tube axial direction at intrados (mm)
Effe
ctiv
e pl
astic
str
ain
( ε)
FEA Simulation
FEA Simulation Shr [22]
Fig. 4-5 Effective plastic strain distribution at the intrados along the length of the tube
4.2.2 Change in Relative Thickness
Change in relative thickness of the tube on the mid cross-section for a 90o bend is
shown in Figure 4-6. At intrados, an increase in thickness predicted by Shr was 8.64%
43
where as the FEA simulation predicted it as 9.25%. The maximum thickness reduction at
extrados was 6.89% whereas Shr predicted it to be 7.28%.
-20
-15
-10
-5
0
5
10
15
20
0 30 60 90 120 150 180
Angular position α (degrees)
Cha
nge
in re
lativ
e th
ickn
ess
(%)
FEA Simulation Shr[27]
FEA simulation
Fig. 4-6 Thickness distribution of the tube on the mid cross-section of 90o bend
44
CHAPTER V
MODEL PREDICTIONS
The present chapter compares the wall thickness and cross section distortion for the
different loading conditions predicted from the analytical model and the FEA analysis. In
the first section of the chapter the wall thickness and cross section distortion predicted by
the analytical model are compared for the case of pure bending with the numerical and
experimental results of Pan et al. [13]. The wall thickness distribution and cross section
distortion predicted by the analytical model and FEA simulation are compared with the
experimental results of the Khodayari [26] for the case of pure bending. In the second
section the wall thickness distribution and cross section distortion prediction form the
analytical model is compared with the results of the FEA simulation for different loading
conditions. In the third section wall thickness distribution and cross section distortion
results obtained from the FEA simulations are compared for bending with mandrel,
internal pressure and combination of axial pull and internal pressure.
5.1 Comparison of Analytical, Numerical and Experimental Results
The model prediction is compared to the analytical and experimental results from Pan
and Stelson [13]. The tube parameters are listed in Table 5-1. As shown in Figure 5-1, Pan
and Stelson’s model over predicted the thinning and under predicted the thickening. The
45
wall thickness prediction from the present model is in good agreement with the
experimental results. Table 5-2 compares the wall thickness predicted by the analytical
model and Pan’s results.
Table 5-1 Geometric and material properties used by Pan et al. [13]
Parameter Magnitude
Diameter of the tube (mm) 25.4
Wall thickness of the tube (mm) 2.92
Radius of bend die (mm) 50.8
Yield strength of tube material (MPa) 270
-30
-20
-10
0
10
20
30
40
0 30 60 90 120 150 180
Angular position α (degrees)
Cha
nge
of re
lativ
e th
ickn
ess
(%) Analytical model
Experiment Pan et al. [13]
Numerical Pan et al. [13]
Fig. 5-1 Comparison of the wall thickness prediction by analytical model with experimental results and numerical model of Pan et al. [13]
46
Table 5-2 Comparison of change in relative wall thickness predicted by Pan et al. [13] and analytical model
Change of Relative Wall thickness (%)
Pan et al. [13]
Angular Position
Analytical Model Experiment Numerical
0 -12.49% -10 % -22 %
180 25.38% 28 % 22 %
For cross section distortion, the severity of distortion is defined by ovality:
%1000
minmax ×−
=ΩD
DD (5-1)
where and are the major and minor axes of the deformed tube respectively;
is the original tube diameter. The experiments showed that
maxD minD 0D
%20%5 exp ≤Ω≤ . Pan and
Stelson’s model predicted the distortion at different cross sections with the ovality of
. The present model predicts only the cross section with the most
significant distortion at . The friction between the workpiece and tooling could
contribute to this discrepancy.
%15%0 ≤Ω≤
%9=Ω
The tube and tooling parameters for the tube bending experiments conducted by
Khodayari [26] are listed in table 4-1. Finite element simulation was also conducted. As
shown in Figure 5-2, the model predictions agree well with the finite element simulation
and experimental results. Thinning at the extrados, tt <0 , and thickening at the intrados,
, can be observed. Also note that tt >π ttt == 232 ππ as the model assumes symmetric
47
deformation with respect to x-y plane and no neutral line shift in pure bending. Flattening
of the extrados can be expected since, from Equation (3-36), rr <0 and rrr >= 232 ππ .
-20
-10
0
10
20
0 30 60 90 120 150 180
Angular position α (degrees)
Cha
nge
of re
lativ
e th
ickn
ess
(%)
FEA Simulation
Experiment Khodayari [26]
Analytical Model
Fig. 5-2 Comparison of the wall thickness prediction by analytical model with experimental results of Khodayari [26] and FEA Simulation
The ovality is calculated at %6=Ω for analytical model compared to that of the
experiment . The difference may due to the friction condition between tube
and tooling. Simulating tube bending with different coefficient of friction values, Fig. 5-3
shows that, at different cross sections, the ovality increases with coefficient of friction. The
cross section distortion for coefficient of friction of 0.1 was 6.43% and for coefficient of
friction 0.3 was 8.70%. The present model assumes no frictional effect and thus under-
%10exp =Ω
48
estimates the severity of cross section distortion. Another possible source of error is the
simplification of the distortion function, Equation (4-36).
0
2
4
6
8
10
12
0 20 40 60 80
Bend angle θ (degrees)
Ova
lity Ω
(%)
Coef. of friction = 0.1Coef. of friction = 0.2Coef. of friction = 0.3Experiment Khodayari [26]Analytical model
Fig. 5-3 Comparison of cross section distortion of tube obtained from FEA simulation for different values of coefficient of friction with experimental value Khodayari [26] and analytical model
5.1 Application of Additional Loading
Finite element analysis was conducted for the different loading conditions i.e. with
application of axial pull, internal pressure and combination of axial pull and internal
pressure. The wall thickness and cross section distortion were tabulated at the mid cross
49
section i.e. at 45o for the 90o bend. The results obtained form the analytical model is
compared with the FEA results.
5.2.1 Application of Axial Pull
The effects of stretching and internal pressure on tube bending are demonstrated in the
following example. For general bending, the minimum bending radius – the radius which
does not yield wrinkling, can be estimated using a simple tooling design guideline [11]:
2≥ODR (5-2)
Based on this guideline, a small die radius which could result in wrinkling was used to
bend a tube with the geometry and material properties listed in Table 5-3.
50
Table 5-3 Geometric and material properties of the tube
Parameter Magnitude
Diameter of the tube (mm) 57.15
Mean radius of tube (mm) 27.15
Wall thickness of the tube (mm) 2.858
Radius of bend die (mm) 142.87
Pressure die Pressure (MPa) 50
Yield strength of tube material (MPa) 210
Young’s Modulus of tube material (GPa) 210
Simulating the bending process using LS-DYNA, wrinkling is observed as shown in
Figure 5-4.
51
Fig. 5-4 FEA simulations for 90 degree bend showing wrinkling in the tube. The tube and geometric and material property used in simulation are listed in table 5-3
Another simulation showed that applying an axial force of 12.9 kN at the tube end near
the pressure die will eliminate the wrinkling (Figure 5-5). The wall thickness and cross
section distortion predicted by FEA and the analytical model are shown in Figures 5-6 and
5-7. At intrados the increase in wall thickness predicted from analytical model was 10.94%
and 9.38% from FEA simulation. Wall thickness reduction prediction at extrados was
12.57% from analytical model and 8.99 % from FEA simulation. While no wrinkling, the
cross section distortion is significant with ovality %3.11=Ω from FEA simulation and
7.3% form the analytical model. Figure 5-8 shows the change in radius of the tube along
the span angle.
52
Fig. 5-5 Application of axial pull eliminates wrinkling
-20
-15
-10
-5
0
5
10
15
20
0 30 60 90 120 150 180Angular position α (degrees)
Cha
nge
of re
altiv
e th
ickn
ess
(%)
Analytical Model F = 12.9 kN, Pi = 0
FEA Simulation F = 12.9 kN, Pi = 0
Analytical F = 0, Pi = 0
Neutral Axis Shift
Fig. 5-6 Comparison of the wall thickness prediction by analytical model (axial pull 12.9 kN and no internal pressure) with FEA Simulation (axial pull 12.9 kN and no internal pressure) and analytical model (no axial pull and no internal pressure)
53
05
1015202530
010 20
3040
5060
7080
90
100110
120130
140150
160170180
190200210
220230
240250
260
270
280290
300310
320330
340350
Analytical Model F = 12.9 kN, Pi = 0
Undeformed shape
Fig. 5-7 Polar plot of the cross section prediction by analytical model (axial pull 12.9 kN and no internal pressure) with undeformed tube
54
0
5
10
15
20
25
30
0 30 60 90 120 150 180 210 240 270 300 330 360
Angular position α ( degrees)
Rad
ius
of th
e tu
be r
(mm
)
Analytical Model F = 12.9 kN, Pi = 0Initial Radius
Fig. 5-8 X-Y Plot of the radius prediction by analytical model for axial pull of 12.9 kN and no internal pressure with initial radius of tube
5.2.2 Application of Internal Pressure
To prevent the tube from wrinkling and to reduce cross section distortion, internal
pressure can be used. It was found that with 10 MPa internal pressure, wrinkling is
eliminated. The analytical and FEA predictions of the wall thickness and cross section
distortion are shown in Figures 5-9 and 5-10. At intrados the increase in wall thickness
predicted from analytical model was 9.43% and 8.01% from FEA Simulation. The wall
thickness reduction prediction at extrados was 14.77% from analytical model and 9.24%
from FEA simulation.
55
-20
-15
-10
-5
0
5
10
15
20
0 30 60 90 120 150 180Angular position α (degrees)
Cha
nge
of re
altiv
e th
ickn
ess
(%) Analytical Model F = 0, Pi = 10 MPa
FEA Simulation F = 0, Pi = 10 MPa
Analytical Model F = 0, Pi = 0
Fig. 5-9 Comparison of the wall thickness prediction by analytical model (no axial pull and internal pressure of 10 MPa) with FEA Simulation (no axial pull and internal pressure of 10 MPa) and analytical model (no axial pull and no internal pressure)
The cross section distortion prediction was 3.22% from analytical model and 4.21% from
FEA simulation. From the results it is seen that internal pressure provides better cross
section than the cross section obtained from bending of tube in presence of axial pull.
56
0
5
10
15
20
25
30
35
0 30 60 90 120 150 180 210 240 270 300 330 360
Angular position α (degrees)
Rad
ius
of tu
be r
(mm
)
Analytical Model F = 0, Pi = 10 MPa
Initial Radius
Fig. 5-10 Comparison of the radius prediction by analytical model (no axial pull and internal pressure of 10 MPa) with undeformed tube
5.2.3 Application of Internal Pressure and Axial Pull
Figures 5-11 and 5-12 show the effects of applying tension and internal pressure
simultaneously during bending. At intrados the increase in wall thickness predicted from
analytical model was 8.88% and 8.71% from FEA Simulation. The wall thickness
reduction prediction at extrados was 15.11% from analytical model and 11.09% from FEA
simulation. The cross section distortion prediction was 3.69% from analytical and 2.8%
from FEA simulation. Clearly it can be seen that with application of both internal pressure
and axial pull wrinkling can be eliminated and a near circular cross section can be achieved
but the thinning will be more when compared to bending with only internal pressure.
57
-20
-15
-10
-5
0
5
10
15
20
0 30 60 90 120 150 180Angular position α (degrees)
Cha
nge
of re
altiv
e th
ickn
ess
(%)
Analytical Model F = 12.9 kN, Pi = 4 MPa
FEA Simulation F = 12.9 kN, Pi = 4 MPa
Analytical Model F = 0, Pi = 0
Neutral Axis Shift
Fig. 5-11 Comparison of the wall thickness prediction by analytical model (axial pull 12.9 kN and internal pressure of 4 MPa) with FEA Simulation (axial pull 12.9 kN and internal pressure of 4 MPa) and analytical model (no axial pull and no internal pressure)
58
0
5
10
15
20
25
30
0 30 60 90 120 150 180 210 240 270 300 330 360
Angular position α (degrees)
Rad
ius
of tu
be r
(mm
)
Analytical Model F = 12.9 kN, Pi = 4 MPa
Initial Radius
Fig. 5-12 Comparison of the radius prediction by analytical model (axial pull of 12.9 kN and internal pressure of 4 MPa) with undeformed tube
Results from both FEA simulations and analytical model show that bending with only
internal pressure and bending with combined tension and internal pressure reduce cross
section distortion and reduce wall thickness at intrados. The use of fluid mandrel is limited
by the capacity of pressure intensifier. For the case of close bend radius high pressure may
be required to eliminate wrinkling. In such case comparatively small value of internal
pressure in combination with axial pull may be used to eliminate wrinkling.
In all cases, it is found that the analytical model predictions are close to the FEA
predictions. It is seen that at the extrados the analytical model over predicts thinning. This
is because the analytical model does not take into account the boost of 50 MPa provided by
the pressure die. A FEA simulation with axial pull of 12.9 kN was conducted with no
59
pressure die boost. Figure 5-13 shows the wall thickness prediction of the tube. The
maximum reduction of wall thickness at extrados predicted by FEA simulation with
pressure die boost was 8.99% and without boost was 10.11%. The analytical model
prediction was 12.57%.
-20
-15
-10
-5
0
5
10
15
20
0 30 60 90 120 150 180
Angular position α (degrees)
Cha
nge
of re
lativ
e th
ickn
ess
(%)
FEA Simulation ( F = 12.9 kN, Pi = 0 ) with pressure die boost
Analytical Model F = 12.9 kN, Pi = 0
FEA Simulation ( F = 12.9 kN, Pi = 0 ) without Pressure die boost
Fig. 5-13 Comparisons of wall thickness prediction by analytical model (axial pull of 12.9 kN and no internal pressure) with FEA simulation with and without Pressure die boost of 50 MPa
5.3 Comparison of Wall Thickness Distribution for Different Bending Methods The figure 5-14 compares the wall thickness distribution for bending with a plug
mandrel, internal pressure and combination of internal pressure and axial pull. It is seen
from the results that at extrados the increase in wall thickness in case of internal pressure
60
and combination of axial pull and internal pressure was limited to 8.5% and 9% but in the
case of the bending with mandrel it was 11%. At extrados the reduction in wall thickness
in the case of bending with internal pressure was limited to 9.2% but it was nearly 11% in
the other two cases.
-20
-15
-10
-5
0
5
10
15
20
0 30 60 90 120 150 180
Angular position α (degrees)
Cha
nge
in re
lativ
e th
ickn
ess
(%)
Mandrel
F = 0, Pi = 10 MPa
F = 12.9 kN, Pi = 4 MPa
Fig. 5-14 Comparison of wall thickness distribution for bending with mandrel, internal pressure and combination of internal pressure and axial pull
61
CHAPTER VI
PARAMETRIC STUDY OF PROCESS PARAMETERS
A parametric study was conducted to study the effect of process parameters such as
internal pressure and axial pull on the final wall thickness and cross section distortion of
the tube. For the study two types of simulation were carried out. In the first type the axial
pull was kept constant and the internal pressure was varied. In the second type the
internal pressure was kept constant and the axial pull was varied.
6.1 Effect of Axial Pull
Simulations were carried out for six different values of pressure 0, 1, 2, 3, 4 and 5
MPa and four different values of axial pull: 12.90 kN, 15.05 kN, 17.20 kN, 19.35 N. It
was seen that the wall thickness at the intrados and extrados decreases with increase in
the axial pull. This is shown in figures 6-1 and 6-2.
62
3.07
3.08
3.09
3.1
3.11
3.12
3.13
3.14
3.15
3.16
3.17
12900 13900 14900 15900 16900 17900 18900 19900
Axial pull (kN)
Thic
knes
s of
tube
at i
ntra
dos
(mm
)Pi = 0 Pi = 1 MPa Pi = 2 MPa
Pi = 3 MPa Pi = 4 MPa Pi = 5 MPa
Fig. 6-1 Comparison of maximum wall thickness at intrados at constant pressure for increasing value of axial pull
From the two curves it is seen both at extrados and at intrados the wall thickness
reduced with increase in the axial pull. The change in wall thickness at both extrados and
intrados both follow a linear pattern. The slope of the wall thickness change at the
intrados is sharp when compared to the slope of wall thickness change at the intrados.
This implies with the increase in axial pull the rate of reduction in wall thickness is
greater at intrados than extrados.
63
2.51
2.52
2.53
2.54
2.55
2.56
2.57
2.58
2.59
2.6
2.61
12900 13900 14900 15900 16900 17900 18900 19900
Axial pull (kN)
Thic
knes
s of
tube
at e
xtra
dos
(mm
)
Pi = 0 Pi = 1 MPa Pi = 2 MPaPi = 3 MPa Pi = 4 MPa Pi = 5 MPa
Fig. 6-2 Comparison of minimum wall thickness at extrados at constant pressure
The cross section distortion with variation in axial pull is shown in figure 6-3. It was
seen that cross section distortion increased with increase in the axial pull.
64
0
2
4
6
8
10
12
14
16
12900 13900 14900 15900 16900 17900 18900
Axial pull (kN)
Cro
ss s
ectio
n di
stor
tion
Ω (%
)
Pi = 0 Pi = 1 MPa Pi = 2 MPa
Pi = 3 MPa Pi = 4 MPa Pi = 5 MPa
Fig. 6-3 Comparison of cross section distortion at constant pressure
6.2 Effect of Internal Pressure
It was seen that the wall thickness at the intrados decreases with increase in the
internal pressure. Figure 6-4 shows the variation in maximum wall thickness with
increasing pressure. The minimum wall thickness with variation in internal pressure is
shown in figure 6-5. The minimum wall thickness at extrados decreases with increase in
internal pressure.
65
3.08
3.09
3.1
3.11
3.12
3.13
3.14
0 1 2 3 4 5
Internal pressure (MPa)
Thic
knes
s of
tube
at i
ntra
dos
(mm
)
F = 12.9 kN F = 15.05 kNF = 17.2 kN F = 19.35 kN
Fig. 6-4 Comparison of maximum wall thickness at intrados at constant axial pull for increasing value of internal pressure
From the two curves it is seen both at extrados and at intrados the wall thickness
reduced with increase in the axial pull. The change in wall thickness at both extrados and
intrados both follow a linear pattern. The slope of the wall thickness change at the
extrados is sharp when compared to the slope of wall thickness change at the intrados.
This indicates with the increase in internal pressure the rate of reduction in wall
thickness is greater at extrados than intrados.
66
2.51
2.52
2.53
2.54
2.55
2.56
2.57
2.58
2.59
2.6
2.61
0 1 2 3 4 5
Internal pressure (MPa)
Thic
knes
s of
tube
at e
xtra
dos
(mm
)
F = 12.9 kN F = 15.05 kNF = 17.2 kN F = 19.35 kN
Fig. 6-5 Comparison of maximum wall thickness at extrados at constant axial pull for increasing value of internal pressure
The cross section distortion of tube with variation in internal pressure is shown in
figure 6-6. It was seen that the cross section distortion decreased with increase in the
internal pressure. But with further increase in internal pressure the cross section
distortion increased.
67
From the parametric study it can be concluded that with an optimum value of pressure
and axial pull wrinkling can be eliminated and the cross section of the tube can be
maintained circular.
0
2
4
6
8
10
12
14
16
0 1 2 3 4 5
Internal pressure (MPa)
Cro
ss s
ectio
n di
stor
tion
Ω (%
)
F = 12.9 kN F = 15.05 kN
F = 17.2 kN F = 19.35 kN
Fig. 6-6 Comparison of cross section distortion at constant axial pull for increasing value of internal pressure
68
CHAPTER VII
CONCLUSIONS
Stretch bending tends to minimize wrinkling and can reduce springback. By applying
fluid pressure during bending, the wrinkling tendency and cross section distortion of the
tube are reduced. Thus, this approach can be used for bending a thin walled tube over a
small die radius, which cannot be achieved with a traditional tube bending process.
In this paper, the problem of tube bending with internal pressure and axial stretching
has been investigated analytically and numerically. The objective of the study is to
develop a tool to accurately predict the wall thickness variation and cross section
distortion of the tube under different loading conditions. The analytical models were
developed based on the plastic deformation theory. For general tube bending processes
(without the additional tension and pressure), the analytical and FEA predictions agree
well with published experimental data. With additional tension and pressure loading, it is
found that the analytical and FEA results are in good agreement.
It was seen that internal pressure can alone remove wrinkling and provide a better
cross section, but the use of internal pressure alone is limited to the capacity of pressure
intensifier. And moreover beyond a certain value of internal pressure the cross section
distortion increases. In such cases combination of axial pull and internal pressure can be
used. From the parametric study it was seen that with increase in axial pull the rate of
decrease in wall thickness was greater at intrados and in the case of axial pull the rate of
decrease of wall thickness was greater at extrados. The parametric study conducted
69
showed that with optimum level of internal pressure and axial pull best results can be
obtained.
The contribution of the present work is that the developed analytical models can be
used to analyze tooling and process design in the early design stage. This is significant
since the commonly used FEA simulation requires extensive part modeling and
computation time.
The future work can include improvement in the analytical model by incorporating the
effect of the pressure die so a more accurate prediction of wall thickness can be made at
the extrados.
70
REFERENCES
[1] Brewster, K., Sutter, K., Ahmetoglu, M.A., and Altan, T., 1996, “Hydroforming
Tube,” The Tube and Pipe Quarterly, 7(4), pp. 34-40.
[2] Denglar, K., 1996, “Exploring Internal High Pressure in Forming of Metal,” The
Fabricator, 7/8.
[3] Horton, F., 1997, “Using Forming Simulation in Development of Complex
Hydroformed Shapes,” Proceedings of the 2nd annual automotive tube conference,
Dearborn, Michigan, May 13-14, pp.173.
[4] Kim, J., Kang, S.J., and Kang, B.S., 2002, “Computational Approach to Analysis and
Design of Hydroforming Process for an Automobile Lower Arm,” Computers and
Structures, 80, pp. 1295-1304.
[5] Kervick, R.J., and Springborn, R.K., 1966, Cold Bending and Forming Tube and
Other Sections, American Society of Tool and Manufacturing Engineers, Dearborn, MI.
[6] Tarana, K., 2002, “Finite Element Simulation of the Tube Hydroforming Process –
Bending, Preforming and Hydroforming,” Journal of Materials Processing Technology,
127, pp. 401-408.
[7] Yang, J., Jeon, B., 2001, “The Tube Bending Technology of a Hydroforming Process
from an Automotive Part,” Journal of Materials Processing Technology, 111, pp. 175-


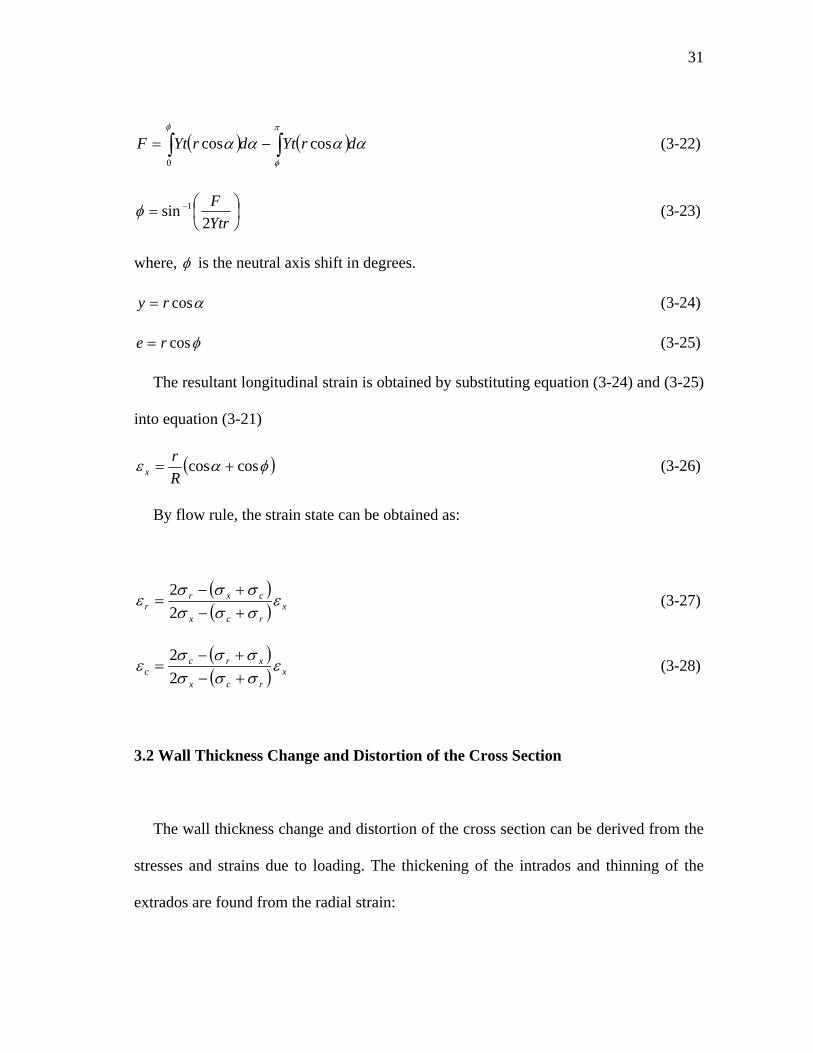


![Experimental behaviour and strength of concrete-encased … · 2019-03-27 · bending and axial compressive load [3–6], and behaviour under biaxial bending and axial compressive](https://static.documents.pub/doc/80x56/5e54a910ee6ea919d33e4e9a/experimental-behaviour-and-strength-of-concrete-encased-2019-03-27-bending-and.jpg)


![MOMENT-CURVATURE DIAGRAMS FOR EVALUATION OF … · 2016-06-09 · for pure bending or bending moment and axial load is consid-ered the same [3]. The curvature for state II, bending](https://static.documents.pub/doc/80x56/5e56bfe4ea976d568d0a479d/moment-curvature-diagrams-for-evaluation-of-2016-06-09-for-pure-bending-or-bending.jpg)


