Advanced Steel Construction Vol. 12, No. 4, pp. 428-445 (2016) 428 TUBULAR STEEL POLES UNDER LATERAL LOAD PATTERNS Edgar Tapia-Hernández Professor, Universidad Autónoma Metropolitana – Azcapotzalco. México, D.F. (Corresponding author: E-mail: [email protected]) Received: 10 November 2015; Revised: 21 December 2015; Accepted: 2 January 2016 ABSTRACT: Hurricane Odile hit Baja California Sur, Mexico in 2014, causing substantial damage to local steel pole structures (light poles and electricity poles). Based on the failure characteristics observed on such poles, this paper develops an analytical study aimed at evaluating the wind-excited inelastic response of slender vertical cantilever structures. Displacement-controlled pushover analyses are performed in OpenSees. The research pretends to establish a reference of the deformation limit for the serviceability limit state in order to contribute to make conservative decisions in the design phase of steel poles. Keywords: steel, wind, poles, serviceability limit state, inelastic analyses DOI:10.18057/IJASC.2016.12.4.4 1. INTRODUCTION In recent years, partial or total collapse of steel poles (light-poles and electricity poles) related with wind patterns have increased in Mexico. Despite that these damages are controllable, the vulnerability of poles under severe natural hazards is one of major concern of designers, owners, managers and society. The fact is that there are several uncertainties related to the exposed structures, storms and the particular conditions of each pole, etc., that make it difficult to quantify the probability of failure or the rate of failure over a period of time (Figure 1). An impressive number of collapses of poles related to wind actions are continually reported in Mexico, which emphasizes their vulnerability. For example, in September 2014 in Baja California Sur, Mexico, Hurricane Odile represents the largest damage in the history of the electrical network in Mexico, where it is estimated that 1,800 poles were affected [1]. Some of them may fail due to many reasons under wind actions such as incorrect design assumptions, improper detailing, material defects, fabrication errors, force fitting during erection and variation in material strength [2]. In addition, safety management such as regular checking of corrosion or damage during the operation conditions might be an additional source of collapses. Careful attention to the design requirements for poles structures will extend their lifespan and ensure public safety. a) Power pole collapse. Electrical substation, Mexico City, January, 2009 b) Damage by Hurricane Odile in Baja California Sur, September 2014 [3] Figure 1. Examples of Poles Collapses
Transcript
Advanced Steel Construction Vol. 12, No. 4, pp. 428-445 (2016) 428
TUBULAR STEEL POLES UNDER LATERAL LOAD PATTERNS
Edgar Tapia-Hernández
Professor, Universidad Autónoma Metropolitana – Azcapotzalco. México, D.F. (Corresponding author: E-mail: [email protected])
Received: 10 November 2015; Revised: 21 December 2015; Accepted: 2 January 2016
ABSTRACT: Hurricane Odile hit Baja California Sur, Mexico in 2014, causing substantial damage to local steel pole structures (light poles and electricity poles). Based on the failure characteristics observed on such poles, this paper develops an analytical study aimed at evaluating the wind-excited inelastic response of slender vertical cantilever structures. Displacement-controlled pushover analyses are performed in OpenSees. The research pretends to establish a reference of the deformation limit for the serviceability limit state in order to contribute to make conservative decisions in the design phase of steel poles. Keywords: steel, wind, poles, serviceability limit state, inelastic analyses DOI:10.18057/IJASC.2016.12.4.4
1. INTRODUCTION In recent years, partial or total collapse of steel poles (light-poles and electricity poles) related with wind patterns have increased in Mexico. Despite that these damages are controllable, the vulnerability of poles under severe natural hazards is one of major concern of designers, owners, managers and society. The fact is that there are several uncertainties related to the exposed structures, storms and the particular conditions of each pole, etc., that make it difficult to quantify the probability of failure or the rate of failure over a period of time (Figure 1). An impressive number of collapses of poles related to wind actions are continually reported in Mexico, which emphasizes their vulnerability. For example, in September 2014 in Baja California Sur, Mexico, Hurricane Odile represents the largest damage in the history of the electrical network in Mexico, where it is estimated that 1,800 poles were affected [1]. Some of them may fail due to many reasons under wind actions such as incorrect design assumptions, improper detailing, material defects, fabrication errors, force fitting during erection and variation in material strength [2]. In addition, safety management such as regular checking of corrosion or damage during the operation conditions might be an additional source of collapses. Careful attention to the design requirements for poles structures will extend their lifespan and ensure public safety.
a) Power pole collapse. Electrical
substation, Mexico City, January, 2009 b) Damage by Hurricane Odile in Baja
California Sur, September 2014 [3]
Figure 1. Examples of Poles Collapses
429 Edgar Tapia-Hernández
Nowadays, Mexico does not have a code with the minimum standards for non-building structures. And local codes usually establish performance requirements which just outline what the required level of performance is and leave it up to the designer how this is achieved. Poles might be designed under different criteria depending on the designer, producer or local market. In contrast, in the United States, design of tubular steel poles is governed by the ASCE Manual #72 [4], which have been published more than 20 years ago. This manual provides a uniform basis on the design and manufacture of steel pole structures: light poles and electricity poles [5]. It also defines the requirements for fabrication, erection, load testing, and quality assurance according to the United States steel market conditions of those years. It should be noted that steel pole structures have several unique design features as compared to other steel structures. For example, poles design is based on the use of the large displacement analysis to account for the P−D effect and check for stability. To prevent excessive deflection effects, the lateral deflection under factored loads is usually limited to 5 to 15% of the total pole length, for poles structures under load combination (dead load and wind load). This limit is not precisely a serviceability requirement, but it constitutes a safeguard against the design of highly flexible structures. So, service deformation limit is not clearly defined. To clarify the role and importance of the above remarks, this paper develops an analytical study aimed at evaluating the wind-excited inelastic response of slender vertical cantilever structures. The research pretends to establish a reference of the deformation limit for the serviceability limit state in order to contribute to make conservative decisions in the design phase of steel poles. Poles were designed to fulfill all the recommendations of the wind and steel guidelines of Mexico's Federal District Code [6] and the Chapter of Wind Design of the Federal Electricity Commission of Mexico [7] and they were designed following the common Mexican practice for tubular steel poles with typical dimensions and the local equipment, as it is discussed in the following sections. Wind-excited response is investigated by pushover nonlinear analyses, focusing on the deformation restrictions for the service limit state under different lateral load patterns in order to contribute to protect life and property during intense wind demands and to improve the acquired knowledge. 2. TESTING AND PROVEN PRODUCT EXPERIENCE In the Mexican practice, full scale cold bend tests may be conducted on poles design to verify the proper behavior and to withstand the design loads specified for these structures as a function of the maximum deformation. Nevertheless, usually these tests do not exceed the yielding limit (Figure 2), because the owner is not willing to pay a destructive test. So, the global drift at the service deformation (at yielding) is not clearly defined for all the possible cases. (Here, the global drift is computed as the difference of the deflections at the top and bottom divided by the total pole length). In fact, the maximum allowed deformation (serviceability limit state) according to the Specification for steel poles of the Federal Electricity Commission of Mexico (CFE-J6200 [8]) is not function of the length of the pole (Table 1). This may mean that the limit value is not based on a formal study of the desirable structural performance, but on the needs of the electrical equipment, lights, batteries, circuits, etc.
Tubular Steel Poles under Lateral Load Patterns 430
Figure 2. Example of the Non-destructive Test for a A13 Steel Pole
Table 1. Deformation Service Limits According to the Specification CFE-J6200 [8]
Additionally, in the local market, some pole structures are purchased to meet a recognized structural code and many others are sold as general commercial design. Design issues include improper safety factors, inadequate base plate design, insufficient anchor bolts, improper application of wind velocities and wind coefficients, undersized weld and improper damage in the manufacture process. Standardizing the design process would improve the safety of poles and reduce confusion during the procurement process [9]. 3. CONDITION OF MANUFACTURING
Steel poles are fabricated from uniformly tapered hollow steel sections and for structural efficiency, the structures taper over their height to a smaller tip diameter at the top. The poles are cold formed by standard methods such as bending, stretch, forming, roll forming, etc. from plates of thickness of 0.48 mm until 12.7 mm (because the maximum plate thickness that a hydraulic press is able to bend is around 12.7 mm). For these structures the industry practice is that the analysis, design and structure detail are usually performed by a steel pole supplier in order to develop the cheapest structures (lightest weight) and more compatibles with fabrication practice and available equipment. Because the selling price of the poles is directly proportional to the weight, companies spend time and money in the engineering to greatly simplify the manufacturing process with the minimal waste. For this reason, the structural design of the poles is highly dependent on the cuts in the plates (Figure 3a). In the Mexican practice, the most common widths, for this purpose, are 48 inches (1,219.2 mm) and 60 inches (1,524.0 mm); although it is possible to find plates with up to 72
0
100
200
300
400
0 200 400 600 800
Load
(kg)
Displacement (cm)
Theo
retical Serv. Lim
it
431 Edgar Tapia-Hernández
inches (1,828.8 mm) width. The tapered steel pole is formed from a trapezoid-shaped plate and depending on the dimensions; the pole might be formed with a single longitudinal weld seam. Figure 4 shows some cutting configurations used in the industry. This is a common practice to reduce material waste and, therefore, reduce the cost of the poles. On poles manufacturing, once cutting has been performed, the rough cross-section is formed by presses (Figure 3b), and then the cross-section is detailed through small presses (Figure 3c). Finally, shell is long-seamed with vertical weld along pole axis, through submerged arc welding techniques or electric resistance welding methods (Figure 3d).
a) Cut of plate b) Bending of the plate with hydraulic press
c) Detailed of the cross-section through
smaller presses d) Longitudinal weld seam
Figure 3. Manufacturing Process of Tubular Steel Poles
Perimeterat bottom
Perimeterat top
Length< 12 m
Plate width
Semiperimeterat bottom
Semiperimeterat top
Semiperimeterat bottom
Length< 12 m
Plate width
Length< 12 m
Plate widthWaste
Waste Waste
a) Cutting plate for two
poles b) Cutting plate for one pole
formed by two shells b) Cutting plate for a shell for a pole formed by two
shells Figure 4. Typical Cutting Configurations in the Local Practice
Tubular Steel Poles under Lateral Load Patterns 432
Corrosion protection must be considered for steel poles, mainly for structures with conditions of wetness and atmospheric pollution level. In Mexico, this protection represents an increase of the 30 percent of the final cost; so, it is important to assess the corrosivity of the environment to which the pole would be exposed and in defining clear and appropriate coating specifications. Selection of a specific coating or the use of weathering steel depends on exposure to severe weather conditions, past experience, appearance and economics. The most used corrosion protection technique on steel poles is the hot-dip galvanizing. In the galvanizing process a zinc coating is metallurgically bonded to the steel surface. The zinc layer provides both a barrier coating for the steel and galvanic protection since the zinc preferentially is consumed before the steel corrodes. Nevertheless, frequently this alternate work might deform the pole due the thickness of the plate (48 mm) (Figure 5a); so, it is common that the cross-section should be detailed through presses again (Figure 5b). Other problems during the transportation to the galvanizing machine are related to damage and rupture of the longitudinal weld (Figure 5c) or strokes in the surface (Figure 5d). Once in field, preventive maintenance is highly recommended through a regular checking of corrosion.
c) Damage in weld seam
a) Deformation after hot-dip galvanizing
b) Repair of straightening d) Hit on surface
Figure 5. Damage related with the hot-dig galvanizing Because of transportation conditions, in the Mexican practice, the maximum pole length is restricted to 12,000 mm. So, pole sections are normally joined by slip splices to transfer shears and moments. They are detailed to have a lap length L no less than 1.05 times the largest inside diameter (Figure 6a). It is important to have a tight fit in slip joint to allow load transfer by friction between sections. Locking devices or flanged joints will be needed if the splice is subjected to uplift forces.
433 Edgar Tapia-Hernández
a) Schematic overlap b) Overlap in power pole Figure 7. Typical light-pole in
Mexico City Figure 6. Typical overlap in pole sections 4. MODELS DESCRIPTION
Ten tubular steel poles from 10 m. to 30 m. were designed to fulfill all the recommendations of the steel guidelines of Mexico's Federal District Code [6] and the Chapter of Wind Design of the Federal Electricity Commission of Mexico [7] and by following the local manufacturing practice. Poles are representative of typical light-poles in Mexico City (Table 2, Figure 7).
The cryptograms for the identification of the models are PxxTy, where P indicates that the structure is a pole, xx indicates the structure height in meters and y (after T) identifies the number of sections.
Poles were analyzed in SAP2000 [10] by linear static analysis in 3D model under: a) weight of the pole, battery, luminaries and solar panels (Table 3) and b) the pressure of the wind acting horizontally on the pole and equipment.
Tubular Steel Poles under Lateral Load Patterns 434
Table 3. Characteristics of Considered Equipment
Supplement Weight (kN)
Exposed area (m2)
Characteristics
Luminary 696.3 0.121 Light emitting diode. 18 W. Battery 951.3 0.090 12V, 1200 Ah @10hr Solar panel 147.1 0.252 185 W. Mono-crystalline. 2x120W
The adequate lighting distribution for exterior commercial poles is a function of its height and location. So, more luminaries and solar panels were considered for taller poles, because they usually are designed to illuminate large areas (Table 4).
Table 4. Estimated Weight of the Equipment for the Design
In the analytical model, a pole was considered as a continued element in order to exhibit full flexural strength and stiffness continuity. In addition, pole was modeled with a set of elements of length 20 cm to reproduce the response of an axially loaded element including large translational displacement and P-delta effects. Through n= 69 certified laboratory coupon tests of steel samples available in the Mexican market, a better reference of the real yielding steel stress were considered. The sample is based on steel plates with thickness varying from 0.48 mm (3/16”) to 0.64 mm (1/4”) [11]. According to the results, the mean value of ratios between effective and nominal material overstrength at yielding is =fy
Effective/fy Nominal)/n = 1.277, which is larger than the one proposed in current codes; for example AISC 341-10 [12] equal to Ry AISC= 1.10 for A50 steel (Figure 8).
Figure 8. Local Material Overstrength In order to account for the deviation, a conservative magnitude of the factor related to the material overstrength was developed from the mean minus one standard deviation (= 0.095) in a normal distribution. Thus, the proposed material overstrength considered in this research is equal to Ry= - = 1.183, which is also included in Figure 8.
1.0
1.1
1.2
1.3
1.4
0 10 20 30 40 50
Ry, Ru
Ry (yielding)Ru (ultimate)Ry (Acc. to AISC 341‐10)
435 Edgar Tapia-Hernández
5. DESIGN CONSIDERATIONS
In the design process, the strength was derived from varying diameter and thickness and by using methods to evaluate designed strength to required strength as it is discussed in further detail in Flores-Montaño [13]. According to the results, the use of this design methodology provides consistent structural performance for steel poles.
The high flexibility of poles makes them susceptible to wind resonant vibration [14, 15]. So, the aerodynamic effects, which accounts for the interaction of the geometry of the pole on surface pressure, due to wind, must be included. According to the specialized codes, the dynamic response factor shall be determined for structures with natural first mode fundamental frequencies less than 1 Hertz (period of vibration of 1 second).
Figure 9. Design Methodology of Steel Poles
The considered design methodology in this research is schematically explained in Figure 9. According to the Guidelines for the wind guidelines [16] of Mexico's Federal District Code [6], the design wind pressure calculation is based on fundamental fluid-flow theory and is computed as follows:
F(z)= 0.50GV(z)2FADA (1)
Where F(z) is the total force at height z over the projected surface area A normal to the wind direction, due to wind speed at the same height V(z). FAD is the dynamic response factor. In the Code, the calculation of pressure coefficients has been simplified by the adoption of this dynamic response factor, where the analysis takes into account the dynamic nature of wind pressure and the response of the structure to result in equivalent static design data. Further details on the steel poles design can be found in [4, 13, 17]. The first two couples of natural (flexural) frequencies are shown in Table 1, whereas the corresponding modal shapes are plotted in Figure 10a. Due to mechanical symmetry, this figure exhibits similar rotations of the two couples of modes with respect to the reference axes x and y (Figure 10b and 10c).
Tubular Steel Poles under Lateral Load Patterns 436
a) Mode shapes lateral view b) First and second modes in
top view c) Third and fourth modes in
top view Figure 10. Typical First Four Modal Shapes
Since, it was supposed that equipment induces a small and negligible eccentricity with respect to the shaft, any excitation passes through the stiffness center. It is worth mentioning that different results may be obtained due the role of eccentricities. The presence of additional devices on the pole (peculiar features such as stairs, cable bundles, antennas, top balcony and/or parabolas) changes the aerodynamic properties and also the mechanical properties of the structural system [15].
The design wind pressure is the dynamic pressure multiplied by factors related to the configuration of the structure and the interaction of the dynamic fluctuations of wind and the response of the pole (Figure 9e). Factors may be available from wind tunnel testing or other sources (alternative solutions) for wind effects from more directions than those indicated in the Codes.
The calculation of pressure coefficients has been simplified by the adoption of the aerodynamic factor, where the analysis takes into account the dynamic nature of wind pressure and the response of the structure to result in equivalent static design data. The dynamic factor accounts for the following actions of wind:
a) Correlation effects of fluctuating along-wind forces on poles. b) Effective pressures due to inertial forces resulting from resonant vibrations. c) Fluctuating pressures in the wake of the structure (vortex shedding forces), producing resultant
forces acting transversely as well as torsionally.
In the design (Figure 9a, 9f), second-order effects caused by the axial load was accounted by an approximate simplified method. According to the Steel Guidelines [18] of the Code [6], structures subject to axial compression and bending moment should satisfy the following requirement:
1.0 (3)
Where, Pu, Mux and Muy are the demands related with axial load and the bending moments; whereas, Rc, MRx and MRy are the capacities. According to the results, the structures (Table 1) fulfill all the limits of the wind and steel guidelines of MFDC-04 [6].
Peak deformations at the top obtained from the elastic analyses are also included in Table 1; whereas in order to exemplify the procedure, characteristics along height of model P12T1 are shown in Figure 11.
0
0.2
0.4
0.6
0.8
1
‐1 ‐0.5 0 0.5 1
Height
Mode 1 & 2
Mode 3 & 4
‐1.0
‐0.5
0.0
0.5
1.0
‐1.0 ‐0.5 0.0 0.5 1.0
Displacement in Y
Displacement in X
Mode 1Mode 2
‐1.0
‐0.5
0.0
0.5
1.0
‐1.0 ‐0.5 0.0 0.5 1.0
Displacement in Y
Displacement in X
Mode 3Mode 4
437 Edgar Tapia-Hernández
a) 3D model
b) Velocity design, VD
c) Variation of the diameter in height
d) Normative load pattern
c) Deformed configuration
Figure 11. Characteristics of model P12T1 along height 6. NONLINEAR ANALYSES Pushover analyses are useful to assess the structural capacity or to characterize the capacity curve by monotonically increasing the lateral loads. Usually, the application of inelastic analyses (static and dynamic) in wind engineering is not common because the design for wind actions requires the structures to remain in the elastic range. So that, its application is used for characterization of the capacity for structures under seismic excitations, due to the fact that in the seismic design philosophy the structures can be designed in the inelastic range under severe excitations [19]. However here, pushover analyses were carried out in order to evaluate the nonlinear response of the structures under wind loading to estimate the inelastic capacities.
Three-dimensional inelastic analyses were performed using the OpenSees computer program [20]. Nonlinear beam-column elements with plasticity spread along the length element were used to model all elements. A circular shaped patch was used to generate the cross-section of poles. Patches were discretized into fibers with three subdivisions in the circumferential direction and 16 divisions in the radial direction as it is shown in Figure 12a. In the model, torsional restraint of the element was also included when out-of-plane buckling is studied. Torsional element properties have been added to the fibre nonlinear beam-column element using the aggregation tool in OpenSees [20]. In addition, poles were modeled with nonlinear beam-column sub-segments (elements of length 20 cm) to reproduce the response of an axially loaded element including large translational displacements and P-delta effects as shown in 12b.
0
2
4
6
8
10
12
30 32 34 36 38 40
Height (m
)
Vel.design (m/sec)
0
2
4
6
8
10
12
0.0 0.1 0.2 0.3
Height (m
)
Diameter (m)
0
2
4
6
8
10
12
0 2 4 6 8
Height (m
)
Pressure (kg/m)
Tubular Steel Poles under Lateral Load Patterns 438
Ext
erio
rd
iam
ete
r
tt
4 div
4 di
v
3 di
v
Node
Tot
al le
nght
202
0
Ove
rlap
Diameter
t
Diameter
2t
Diameter
t
20
20
Fixed node
InitialdeformationL/500
Leng
th, L
Bottom diameter
Nonlinear element
Top diamter
x
yz
a) Cross-section
discretization b) Nonlinear beam-column
elements c) Initial imperfection
Figure 12. Inelastic Model Considerations Steel with nominal Fy= 345 MPa, E= 200,000 MPa and G= 77 GPa was used for the studied structures. Realistic values for the steel yielding stress were used considering coupon test certificates through an overstrength material factor equal to Ry= 1.18 as it was discussed above. Depending on the design, the overlap was included in the model through a double thickness of the plate at the cross section (Figure 12b).
The uniaxial Giuffre-Menegotto-Pinto (GMP) steel material with kinematic and isotropic hardening was used in OpenSees [20] to simulate Bauschinger effect in order to provide a more realistic representation of the elements response compared to the simpler bi-linear model. Thus, structure model was found to give realistic predictions of the inelastic response of a member. Reasonable agreement can be observed between the model in OpenSees and experimental test to predict the capacity of a member subject to flexo-axial loading [21]. Further details and validation of this modeling technique can be found elsewhere in Tapia-Hernández and Tena-Colunga [22].
Poles are flexible structures and may undergo relatively large lateral deflections under design loads. A secondary moment will develop in the poles due to the lateral deflections at the load points. This secondary moment can be a significant percent of the total moment. Therefore, three components can contribute to reduce the strength of poles: a) initial imperfection, b) eccentricity of application of loads and c) residual stresses locked into the cross section. Based on this, realistic conditions of the studied structures was considered (Figure 12c) through an initial imperfection at midspan of L/500 assuming a parabolic shape, in agreement with the deformation after hot-dip galvanizing (Figure 5a). A wide discussion on the influence of out-of-straightness imperfection in the effective length and the second-order effect in advanced analysis of slender steel structures can be found in [23, 24, 25].
Additionally, the inherent residual stresses induced by the differential heating as consequence of the welding process (Figure 3a, 3d) and the rolling and forming process (Figure 3b, 3c) was included through the command uniaxialMaterial in OpenSees [20].
439 Edgar Tapia-Hernández
7. LATERAL LOAD PATTERNS Three possible load distribution patterns were considered: a) the rectangular pattern, b) a modal pattern based on the fundamental mode and c) the pattern obtained from the application of the codified design wind load on the pole. In Figure 13, the normalized patterns are depicted for the P30T3 model to better explain the analyses. Poles were assumed to be located in terrain characterized by a roughness length z0= 0.3 m and a basic reference wind velocity ub= 39 m/s; the mean wind velocity at 10 m height above ground, in a flat homogeneous terrain and with return period of 50 years.
a) Rectangular pattern b) Modal pattern c) Normative pattern
Figure 13. Considered Lateral Load Patterns
A Newton with line search solution algorithm was selected in the OpenSees library [20] to achieve rapid convergence and because of the material nonlinearities. The solution algorithm uses an energy increment test which checks the positive force convergence if half of the inner-product of the displacement increment and the unbalanced force is less than a tolerance equal to 10-5. The equations are formed using a SparseGeneral scheme and they are numbered using the reverse Cuthill-McKee numberer (RCM), which optimizes the node numbering in order to reduce the storage bandwidth. This method outputs an error message when the structure is disconnected (collapsed). The constraints were represented with a Plain constraint handler, which enforces homogeneous single-point constraints (homogenous boundary conditions).
A single load step is performed using a load control integrator for the vertical loads: self-weight of the structure and equipment (luminaries, batteries and solar panels). In here, the time in the domain is then set to 0.0 and this load is kept constant. Subsequently, load wind patterns on the accessories and structure body were added as static incremental loadings. The results of the analysis are then employed to define the capacity curves in terms of the total horizontal force (basal shear force) against the global drift in percentage. 8. DEFORMATION CAPACITIES
Pushover curves from nonlinear analyses (base shear against displacement at the top of the steel pole divided by the total height L) are shown in Figure 14. Capacity curves changing the slope value so slightly in the inelastic range as the obtained are typical of detailed models with a cross-section discretized with fibers.
0
5
10
15
20
25
30
0 0.5 1 1.5
Height (m
)
0
5
10
15
20
25
30
0 0.5 1 1.5
Height (m
)
0
5
10
15
20
25
30
0 0.5 1 1.5
Height (m
)
Tubular Steel Poles under Lateral Load Patterns 440
Figure 14. Pushover Curves
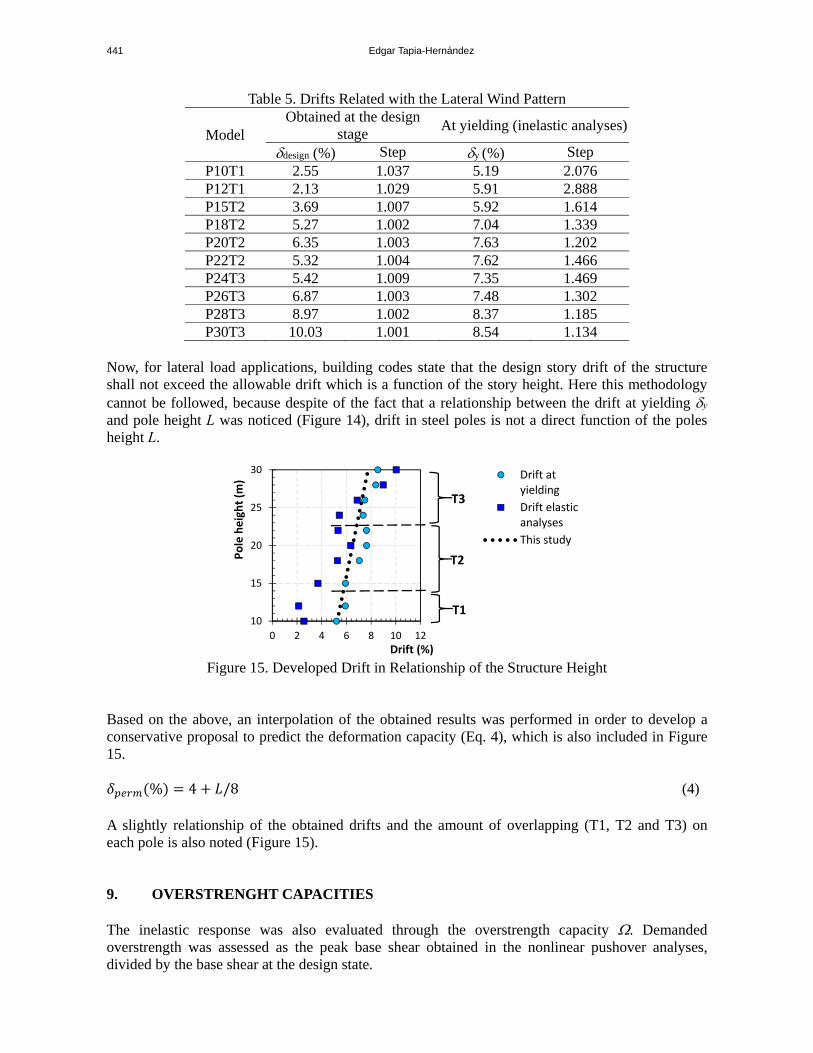
No dependency on the lateral load pattern has been noticed for low-height models. However, the modal pattern becomes critical as the height increases, whereas, the normative pattern related to the more conservative response. It is worth mentioning that the pattern modal pattern and the rectangular one are difficult to be naturally developed [26], since the wind load pattern is tightly related to the solidity area and the height z. Then, the discussion about the deformation capacities are focused on the results of the normative curve. Drift values were studied through two different profiles: a) the drift reported in the elastic analyses, which is usually considered into a typical design process and b) the drift at yielding y in the inelastic analyses, which is related to the serviceability state limit. These magnitudes were included in Figure 14 and summarized in Table 5. As depicted in Figure 15, it was found that, in general, the design drift curve obtained at the elastic analysis for each pole (full rectangles) does not envelope the drift at yielding obtained in the inelastic analysis (full circles). This implies that the actual deformation capacity that steel poles are able to develop is larger than the one obtained in ordinary elastic analysis. This might explain why in conducted full scale tests, the poles usually satisfy the imposed demands with no damage (Figure 2). So, a flag is set on in the importance to close the gap between the predicted behavior, in the design stage, and the actual behavior especially in the inelastic range of steel poles.
Now, for lateral load applications, building codes state that the design story drift of the structure shall not exceed the allowable drift which is a function of the story height. Here this methodology cannot be followed, because despite of the fact that a relationship between the drift at yielding y and pole height L was noticed (Figure 14), drift in steel poles is not a direct function of the poles height L.
Figure 15. Developed Drift in Relationship of the Structure Height
Based on the above, an interpolation of the obtained results was performed in order to develop a conservative proposal to predict the deformation capacity (Eq. 4), which is also included in Figure 15.
% 4 /8 (4)
A slightly relationship of the obtained drifts and the amount of overlapping (T1, T2 and T3) on each pole is also noted (Figure 15).
9. OVERSTRENGHT CAPACITIES The inelastic response was also evaluated through the overstrength capacity . Demanded overstrength was assessed as the peak base shear obtained in the nonlinear pushover analyses, divided by the base shear at the design state.
10
15
20
25
30
0 2 4 6 8 10 12
Pole height (m
)
Drift (%)
Drift atyielding
Drift elasticanalyses
This study
T1
T2
T3
Tubular Steel Poles under Lateral Load Patterns 442
In Table 6, the shear obtained at the design stage Vdesign, the shear at yielding Vy and the peak value VMax obtained for each studied model are compared. The overstrength factor obtained for each pole is the relation between the lateral shear of the code design Vdesign and the peak shear VMax resisted by the model. The ratio between the shear at yielding Vy and the peak shear VMax was also calculated.
Table 6. Overstrength Demands of the Studied Models
In a significant number of poles, the developed overstrength is larger than 1.50, and only in the low-height poles it is larger than 2.0. A trend between the demanded overstrength and the pole height (or fundamental period) was noticed (Figure 16), where the overstrength capacity is reduced as the period increases. The application of the current local code criteria [6] to evaluate the overstrength factor for regular buildings is also included in Figure 16, in order to show that the obtained trend as a function of the structure height was previously identified; although, it has not been enough studied for non-building structures [27].
Figure 16. Overstrength Capacity in Relation to the Fundamental Period In steel poles, the overstrength capacity arises from: a) the rounding of sizes and dimensions for elements diameters in relationship to the waste and the available plate size, Rsize; b) the difference between nominal and factored resistances equal to R= 1/, where is the material resistance factor as defined in Codes; c) the ratio of actual yield strength to minimum specified yield strength (this was directly accounted in models), Rmat; d) the development of strain hardening, Rsh; e) the development of the spread plasticity of cross sections, Rcs; f) the adjustments to adapt the necessary design details to the dimensions and geometry of the real structure, Rdet; among other parameters.
So, to account for the various components contributing to the overstrength-related factor , the following formulation is usually proposed [28]:
1.0
1.5
2.0
2.5
0.0 0.5 1.0 1.5 2.0 2.5
Overstrength,
Period (sec)
This studyMFDC‐04
443 Edgar Tapia-Hernández
= Rsize R Rmat Rsh Rcs Rdet (5) Taking into account that the overstrength material was supposed equal to Rmat= Ry= 1.183 in this research, the proportion /Rmat represents the magnitude related to the other overstrength sources (Table 6) that might develop a reserve of strength, especially in low-height poles, which is not explicitly considered in current Codes [6, 7]. According to the results, the proportion /Rmat has a high dependency on the pole height. 10. CONCLUDING REMARKS This paper develops an analytical study aimed at evaluating the wind-excited inelastic response of slender vertical cantilever structures. Specifically, the attention of this research is focused on the deformation restrictions for the service limit state in order to contribute to protect life and property during intense wind demands. Despite the relatively simple structure, inherent variability on configurations and the uncertainly related to the exact characterization of field situation (environmental loads, geometric and physical characteristics of the poles), were accounted based on actual steel poles with typical dimensions, equipment and the local manufacturing process. Realistic values of the steel’s yielding stress considering 59 coupon test certificates of A-572 Gr. 50 steel were used. Wind-excited response is investigated by pushover nonlinear analyses in detailed models, focusing on the behavior between different lateral load patterns: a) rectangular pattern, b) modal pattern and c) normative pattern. The main contributions of this investigation to wind-resistant design of steel poles are as follows: Capacity curves were very similar regardless of the applied loading profile for low-height
models (L<18 m); no dependency on the lateral load pattern has been noticed. However, as the height increases, the modal pattern becomes critical and the normative pattern becomes the more conservative response.
Although several designs of steel poles are widely used over the country, some design and construction procedures, which are based only on the manufacture process and waste of the steel plates, seems to be unfavorable.
According to the results, the response could not be adequately estimated in common elastic analyses by following only the current code; specifically they could not predict the actual capacity. In fact, steel poles may have a better inelastic performance; but their inelastic capacities would be difficult to predict from the current normative tools and design practices. This notes the importance to close the gap between the predicted behavior, in the design stage, and the actual behavior especially in the inelastic range of steel poles. This might explain why in conducted full scale tests, poles usually satisfy the imposed demands with no damage.
In the local market, there are no guidelines for the designer to limit the damage and to prevent the subsequent collapse. So, a conservative methodology was proposed, which pretends to predict the deformation capacity as a function of the height of the pole by following the current codes and local practices. The proposed equation follows the trends of the results obtained from this research study. More transparent and conservative deformation limits might be taken into account by codes and design practices in order to help to keep the structure safe and stable, even under strong wind demands.
It was found that the overstrength capacities obtained have a strong relationship to the height of the poles (or structure period), something that it is not currently considered in specialized codes.
Tubular Steel Poles under Lateral Load Patterns 444
The results illustrate the need to improve the current design criteria in order to quantify their reliability by means of refined analyses. Long-term field monitoring could further improve the understanding of the actual behavior and prevent failures of this structure type. Finally, active involvement of the owner, manufacturer, designer and professional responsibility is crucial for the accurate structural design of steel poles.
REFERENCIAS [1] García, K., "Este huracán, el más destructor en la historia de la red eléctrica", El
Economista, Newspaper, September 22th (In Spanish), 2014. [2] Prasad, R.N., Knight, G.M.S., Mohan, S.J. and Lakshmanan, N., “Studies on Failure of
Transmission Line Towers in Testing”, Engineering Structures, 2012, Vol. 35, pp. 55-70. [3] Juárez, H., Personal Communication, 2015. [4] ASCE, Design of Steel Transmission Pole Structures, ASCE Manual No. 72, 2nd Edition.
American Society of Civil Engineers, New York, 1990. [5] AASHTO, Standard Specifications for Structural Supports for Highway Signs, Luminaries
and Traffic Signals, American Association of State Highway and Transportation Officials. Fifth edition. Washington, DC, 2009.
[6] MFDC-04, Reglamento de Construcciones para el Distrito Federal, Gaceta Oficial del Departamento del Distrito Federal (in Spanish), 2004.
[7] MOC-CFE-08, “Manual de Diseño de Obras Civiles. Capítulo de Diseño por Viento”, Instituto de Investigaciones Eléctricas, Comisión Federal de Electricidad, México (in Spanish), 2008.
[8] CFE-J6200, "Postes de acero troncocónicos", Federal Electricity Commission of Mexico. Specification (in Spanish), 2002.
[9] Reese, B.R., “Design of sports lighting support structures – Will your structures perform to expectation?”, Proceeding, Structures Congress, American Society of Civil Engineers. Pp. 1269-1285. April, 2014.
[11] García-Carrera S., "Respuesta inelástica de edificios regulares estructurados con marcos dúctiles de acero con contraventeo concéntrico", Master Thesis, Universidad Autónoma Metropolitana - Azcapotzalco. October (In Spanish), 2015.
[12] AISC 341-10, “Seismic Provisions for Structural Steel Buildings”, American Institute of Steel Construction, Chicago, IL, 2010.
[13] Flores-Montaño M., "Demandas de Rigidez Lateral de Postes Tronco-Piramidales de Acero ante Vientos Intensos", Undergraduate Thesis, Universidad Autónoma Metropolitana - Azcapotzalco. August (In Spanish), 2014.
[14] Caracoglia L. and Jones N.P., “Numerical and Experimental Study of Vibration Mitigation for Highway Light Poles. Engineering Structures, 2007, Vol. 29, No. 5, pp. 821–31.
[15] Nguyen, C.H., Freda, A., Solari, G. and Tubino, F., “Aeroelastic Instability and Wind-excited Response of Complex Lighting Poles and Antenna Masts”, Engineering Structures, 2015, Vol. 85, pp. 264-276.
[16] NTCV-04, "Wind Design Guidelines of Mexico's Federal District Code", Gaceta Oficial del Distrito Federal, décimo cuarta época, tomo II, octubre (in Spanish), 2014.
[18] NTCM-04, “Steel guidelines of Mexico's Federal District Code", Gaceta Oficial del Distrito Federal, décimo cuarta época. Tomo II. No. 103-Bis. Distrito Federal, México (in Spanish), 2004.
445 Edgar Tapia-Hernández
[19] Banik, S., Hong, H. and Kopp, G.A., "Assessment of Structural Capacity of an Overhead Power Transmission Line Tower Under Wind Loading", Proceedings, VI International Colloquium on: Bluff Bodies Aerodynamics and Applications, 2008, Milano, Italy, July. pp. 20-24.
[20] Mazzoni, S., McKenna, F., Scott, M. and Fenves, M.Y.G., “Open System for Earthquake Engineering Simulation, User Command-language Manual”, Report NEES grid-TR 2004-21, Pacific Earthquake Engineering Research, University of California, Berkeley, CA, 2006.
[21] Uriz, P. y and Mahin, S., “Toward Earthquake-Resistant Design of Concentrically Braced Steel-Frames Structures”, Report of Pacific Earthquake Engineering Research Center, PEER 2008/08, November, 2008.
[22] Tapia-Hernández E. and Tena-Colunga, A., “Code-Oriented Methodology for the Seismic Design of Regular Steel Moment Resisting Braced Frames”. Earthquake Spectra, November 2014, Vol. 30, No. 4, pp. 1-27.
[23] Liu, Y.P. and Chan, S.L., “Second-Order and Advanced Analysis of Structures Allowing for Load and Construction Sequences", Advances in Structural Engineering, 2011, Vol. 14, No. 4, pp. 635-646.
[24] D'Aniello, M., La Manna, G., Portioli, F. and Landolfo, R., "The Influence of Out-of-straightness Imperfection in Physical Theory Models of Bracing Members on Seismic Performance Assessment of Concentric Braced Structures", The Structural Design of Tall and Special Buildings, 2015, Vol. 24, pp. 176-197.
[25] Repetto, M.P. and Solari, G., "Wind-induced Fatigue Collapse of Real Slender Structures", Engineering Structures, 2010, Vol. 32, Issue 12. pp. 3888-3898.
[26] Holmes J.D. “Wind Loading of Structures”, Spon Press, Second Edition, London, United Kingdom, 2007.
[27] Keshavarzian, M. and Priebe, C., ”Wind Performance of Short Utility Pole Structures.” Practice Periodical on Structural Design and Construction, November 2002, Vol. 7, Issue 4, pp. 141–146.
[28] Mitchel, D., Tremblay, R., Karacabeyli, E., Paultre, P., Saatcioglu, M. and Anderson, D., “Seismic Force Modification Factors for the Proposed 2005 Edition of the National Building Code of Canada”, Canadian Journal of Civil Engineering, 2003, Vol. 30. pp.308–327.