17
a Berkshire Hathaway and Jefferies Financial Group company TUCSON, ARIZONA | MSA ECONOMIC AND DEMOGRAPHIC OVERVIEW 2021
a Berkshire Hathaway and Jefferies Financial Group company
TUCSON, ARIZONA | MSAECONOMIC AND DEMOGRAPHIC OVERVIEW 2021

ECONOMIC AND DEMOGRAPHIC OVERVIEWBERKADIA
TUCSON, ARIZONA | MSA
Exceptional Rent Growth
Recovering Economy
Persistent Demand From UA
Affordable for Millennials
Average effective rent increased 14.6% annually in 2Q21 to $943 per month
- RealPage
In June 2021, local employers added 20,900 net jobs year over year, reaching 95.5% of pre-pandemic workforce
- Bureau of Labor Statistics
More than 38,600 University of Arizona students need off-campus housing, and UA supports about 34,130 jobs
- University of Arizona
Tucson ranked No. 4 among "the 10 Cheapest Places for Millennials to Live in the U.S."
- Yahoo! Finance
INTRODUCTIONTucson's economy is rapidly recovering from the disruption caused by the COVID-19 pandemic. Numerous corporations are relocating and expanding, creating thousands of jobs in the metro area over the next few years. In turn, Greater Tucson is experiencing population growth driven by in-migration. Situated at the northern range of the Sonoran Desert, Tucson is the oldest city in Arizona and continues to attract new residents with its quality of life, history, culture, location, amenities, and beautiful scenery. In fact, the Tucson Metropolitan Statistical Area (MSA), comprised entirely of Pima County, has transformed into a metropolis of more than 1 million residents.
Tucson is home to one of the world’s premier public research universities, the University of Arizona (UA). Combined with UA Health and the UA Tech Park, UA generates over $8.3 billion to the state’s economy and supports more than 34,130 direct and indirect jobs. The region is also a major manufacturing, transportation, and distribution hub for Mexico, California, and the Western United States with over $26 billion in imports and exports flowing through the southern border annually.

ECONOMIC AND DEMOGRAPHIC OVERVIEWBERKADIA
Greater Tucson’s population is forecast to grow 9.6% over the next five years, nearly reaching 1.2 million residents
31% of residents age 25 and older hold a bachelor’s degree or higher
Approximately 23% of metro residents are within the prime renter age group of 18 to 35 years old
32% of housing units in Metro Tucson are renter occupied
The metro area’s median household income is projected to reach $58,471 by 2026, up 10.0% from 2021
TUCSON, ARIZONA | MSA
DEMOGRAPHICS
54.4KNET MIGRATION TO METRO TUCSON
2021 THROUGH 2026
65% OF WORKERS ARE EMPLOYED
IN WHITE-COLLARPOSITIONS METROWIDE
38.8KMEDIAN AGE
OF RESIDENTS
1.2m 224.3k 238.9k 150.3k $58.4k

ECONOMIC AND DEMOGRAPHIC OVERVIEWBERKADIA
Mining, Logging, & Construction
5%
Education & Health Services
18%
Financial Activities
5%
Government
20%Information
1%Leisure & Hospitality
10%
Manufacturing
7%
Other Services
3%
Professional & Business Services
12%
Trade, Transportation, & Utilities
18%
Industry Breakdown
TUCSON, AZ, MSAEMPLOYMENT BY
SECTOR
TUCSON, ARIZONA | MSA
METRO INDUSTRY BREAKDOWN
Tucson is home to one of the world’s premier public research universities, the University of Arizona (UA). The region is also a major manufacturing, transportation, and distribution hub for Mexico, California, and the Western United States.
Recent apartment demand has been underpinned by continued population growth and the gradual economic recovery. Tucson employers added 10,110 net jobs from April 2020 through June 2021, reaching 96% of pre-pandemic employment.
AVERAGE ANNUAL WAGE BY OCCUPATION
Source: BLS Occupational Employment Statistics Survey Source: BLS Current Employment Statistics Survey
Management
Health Care Practitioners & Technicians
Business & Financial Operations
Educational Instruction & Library
Installation, Maintenance, & Repair
Office & Administrative Support
Sales
Transportation & Material Moving
$99.3k
$84.3k
$70.3k
$52.1k
$44.4k
$37.2k
$35.8k
$34.3k
Health Care Support $29.5k
Food Preparation & Serving
$29.7k

ECONOMIC AND DEMOGRAPHIC OVERVIEWBERKADIA
TUCSON, ARIZONA | MSA
46.8%
12.0%
41.1%
JOB EXPOSURELow Medium HighRisk Level
MARKET RESILIENCY ANALYSIS
INDUSTRY COMPOSITION JOBS EXPOSURE
MARKET RATE 46.8%
of jobs are in LOW-risk industries
NATIONAL RATE 47.9%
of jobs are in LOW-risk industries
Risk Level # Employees % of Market National AvgLOW
Agriculture, forestry, fishing and hunting 513 0.2% 1.0%Construction 17,703 5.3% 5.6%Educational services 22,795 6.8% 6.3%Finance and insurance 10,203 3.1% 4.6%Health care and social assistance 63,199 19.0% 15.3%Management of companies and enterprises 1,453 0.4% 1.7%Professional and technical services 17,737 5.3% 7.1%Real estate and rental and leasing 6,103 1.8% 1.6%Transportation and warehousing 16,363 4.9% 4.7%Total 156,069 46.8% 47.9%
MEDIUMOther services, except public administration 10,440 3.1% 3.0%Public administration 23,020 6.9% 5.2%Wholesale trade 6,629 2.0% 4.2%Total 40,089 12.0% 12.4%
HIGHAccommodation and food services 29,955 9.0% 8.3%Administrative and waste services 26,383 7.9% 6.5%Arts, entertainment, and recreation 3,750 1.1% 1.4%Information 4,721 1.4% 2.1%Manufacturing 27,065 8.1% 9.1%Mining, quarrying, and oil and gas extraction 1,903 0.6% 0.4%Retail trade 40,865 12.3% 11.2%Unclassified 16 0.0% 0.2%Utilities 2,366 0.7% 0.6%
Total 137,024 41.1% 39.7%TOTAL 333,182 100% 100%

ECONOMIC AND DEMOGRAPHIC OVERVIEWBERKADIA
(30,000)
(15,000)
0
15,000
30,000
0%
3%
6%
9%
12%
2011 2012 2013 2014 2015 2016 2017 2018 2019 2020 2021*
Employment Trends
Unemployment Rate Jobs Added / Lost*June
TUCSON, ARIZONA | MSA
METRO EMPLOYMENT TRENDS
PIMA COUNTY, AZ
LARGEST EMPLOYERSUniversity of Arizona 15,570
Raytheon 12,610
Davis-Monthan AFB 8,410
Banner Health - University Medical Center 7,500
Pima County 6,940
Tucson Unified School District 6,870
State of Arizona 6,540
U.S. Customs & Border Protection 5,740
Freeport -McMoran Copper & Gold Inc. 5,530
WalMart Inc. 5,500Sources: Sources: University of Arizona; Pima County CAFR; City of Tucson CAFR; Sun Corridor Inc.; Phoenixrelocationguide.com; Southern Arizona VA Health Car System; Pima Community College; CoStar
JUNE2021 6.4%
the metro's monthly unemployment rate
JUNE2021 20,900 jobs
were added metrowide, a 5.9% Y-o-Y increase

ECONOMIC AND DEMOGRAPHIC OVERVIEWBERKADIA
TUCSON, ARIZONA | MSA
UNIVERSITY OF ARIZONA
RESEARCH AND DEVELOPMENT
The University of Arizona (UA) is among the nation's premier public research universities, boasting more than $622 million in annual research spending, which ranks 21st among all public universities in the U.S. Combined, the University of Arizona and its affiliated programs drive the local and state economy with a statewide economic impact of $11.1 billion and more than 34,130 direct and indirect jobs supported. Student spending alone accounts for $779.1 million of the total. Additionally, UA attracts approximately 135,800 out-of-state visitors for sporting events, campus tours, family visits, conferences, and more.
The UA Tech Park is one of the nation’s leading research and development facilities, with a statewide economic impact of $2 billion annually. The UA Tech Park boasts approximately two million square feet of developed space on a 1,268-acre site and is home to multiple tech firms, including Fortune 500 companies IBM, Raytheon Technologies Corporation, UnitedHealth Group, Oracle Corporation, and Citigroup Inc. Currently, the park is home to 47 companies and organizations that support a combined 6,000 jobs.
135,800Out-of-State Visitors
$2 billionEconomic Impact
$779.1 millionStudent Spending Economic Impact
6,000Jobs On Site
46,930Students Enrolled in Fall 2020
47UA Tech Park Companies

ECONOMIC AND DEMOGRAPHIC OVERVIEWBERKADIA
TUCSON, ARIZONA | MSA
NATIONAL DEFENSE
TRANSPORTATION & LOGISTICS
The military and defense assets of Southern Arizona are a powerful local economic engine. Davis-Monthan Air Force Base, the U.S. Army Intelligence Center / Fort Huachuca, and local operations from defense firms have made the aerospace sector a leading industry in Tucson. Davis-Monthan Air Force Base generates $3.0 billion in economic activity annually and supports over 19,150 jobs directly and indirectly. Additionally, over 19,300 military retirees live in the local community with a combined annual retirement pay valued at $513.6 million.
Tucson is physically and logistically well-positioned to serve as a Southwest U.S. hub for moving goods to destinations throughout the world, especially the ever-growing Mexico market. With the United States-Mexico border located just 60 miles away, Mexico—Arizona's largest trading partner—has a strong impact on Tucson with over $26 billion in imports and exports flowing through the Arizona-Sonoran border annually. The Tucson MSA serves a market of 35 million people within a 500-mile radius of the Mexican border.
$3.0 billionEconomic Impact
35 millionPeople Within 500 Miles
19,150+Jobs Supported
$26 billionAnnual Imports and Exports
19,300+Local Military Retirees
63,100Direct and Indirect Jobs Supported

ECONOMIC AND DEMOGRAPHIC OVERVIEWBERKADIA
TUCSON, ARIZONA | MSA
CONSTRUCTION AND DEVELOPMENT
Over a billion dollars' worth of construction is planned for the University of Arizona's Tech Park. Two projects, dubbed The Bridges and The Village, will include several large-scale buildings totaling over 5 million square feet and are expected to take about 10 years to complete. On 65 acres two miles south of UA, The Bridges is designed to be a technology hub with more than 2 million square feet of lab and office space divided into four subdivisions. In June 2020, GEICO moved into the site's new 200,000-square-foot building and has plans to generate 700 new jobs over the next several years. With construction already underway, The Village will include retail, commercial, residential, and hotel space on a 175-acre parcel of land.
UA TECH PARK
5 millionSF of Total Space
$1 billionConstruction Projects
Raytheon Technologies Corporation, Southern Arizona's largest private employer, is undergoing a major expansion at its complex near the Tucson International Airport, adding 559,000 square feet of commercial space. In 2018, a visitor-access center, an advanced test facility, and a multipurpose building were completed. The company recently announced plans to add more than 1,000 workers over the next three years. The announcement came on top of the 2,000 new jobs previously planned in congruence with the building expansion. Raytheon has already hired most of the planned 2,000 new employees, with an average annual salary of over $100,000.
RAYTHEON EXPANSION
$550 millionInvestment
3,000New Jobs Created
ECONOMIC AND DEMOGRAPHIC OVERVIEWBERKADIA
TUCSON, ARIZONA | MSA
CONSTRUCTION AND DEVELOPMENT
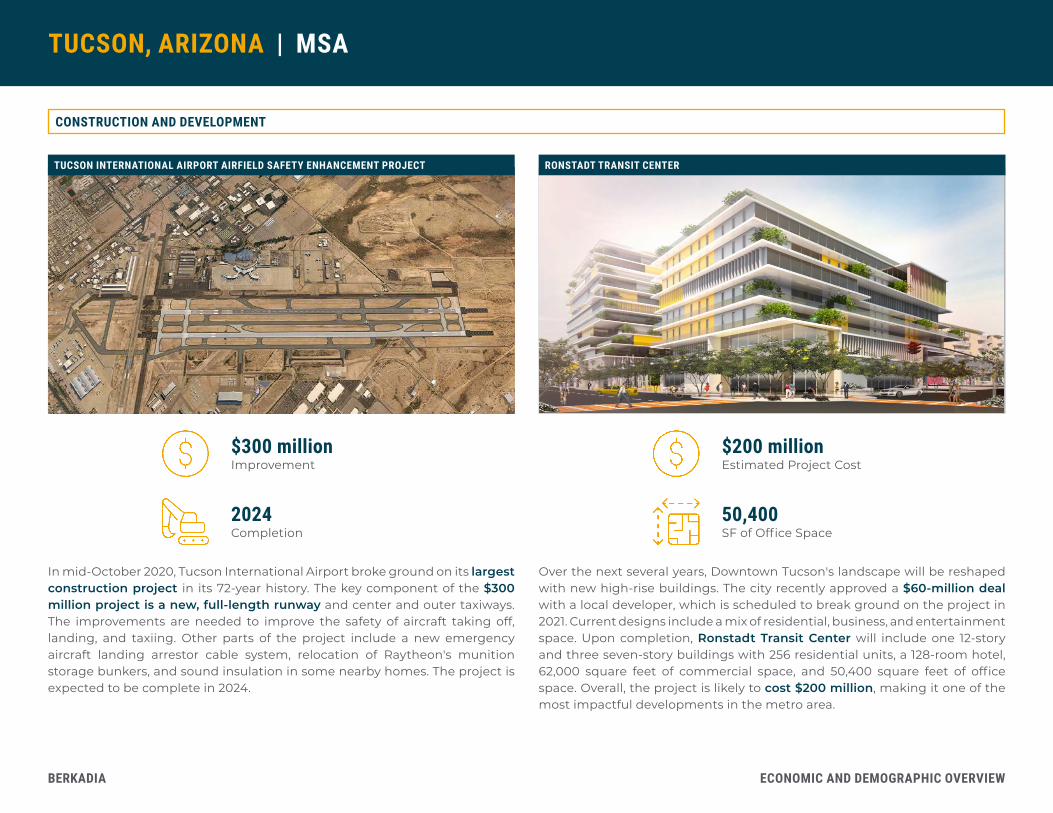
In mid-October 2020, Tucson International Airport broke ground on its largest construction project in its 72-year history. The key component of the $300 million project is a new, full-length runway and center and outer taxiways. The improvements are needed to improve the safety of aircraft taking off, landing, and taxiing. Other parts of the project include a new emergency aircraft landing arrestor cable system, relocation of Raytheon's munition storage bunkers, and sound insulation in some nearby homes. The project is expected to be complete in 2024.
TUCSON INTERNATIONAL AIRPORT AIRFIELD SAFETY ENHANCEMENT PROJECT
$300 millionImprovement
2024Completion
Over the next several years, Downtown Tucson's landscape will be reshaped with new high-rise buildings. The city recently approved a $60-million deal with a local developer, which is scheduled to break ground on the project in 2021. Current designs include a mix of residential, business, and entertainment space. Upon completion, Ronstadt Transit Center will include one 12-story and three seven-story buildings with 256 residential units, a 128-room hotel, 62,000 square feet of commercial space, and 50,400 square feet of office space. Overall, the project is likely to cost $200 million, making it one of the most impactful developments in the metro area.
RONSTADT TRANSIT CENTER
$200 millionEstimated Project Cost
50,400SF of Office Space
ECONOMIC AND DEMOGRAPHIC OVERVIEWBERKADIA
0
500
1,000
1,500
2,000
2015 2016 2017 2018 2019 2020 2Q21*
Construction vs Absorption vs Occupancy
Deliveries Absorption*YTD
TUCSON, ARIZONA | MSA
ABSORPTION / DELIVERIES
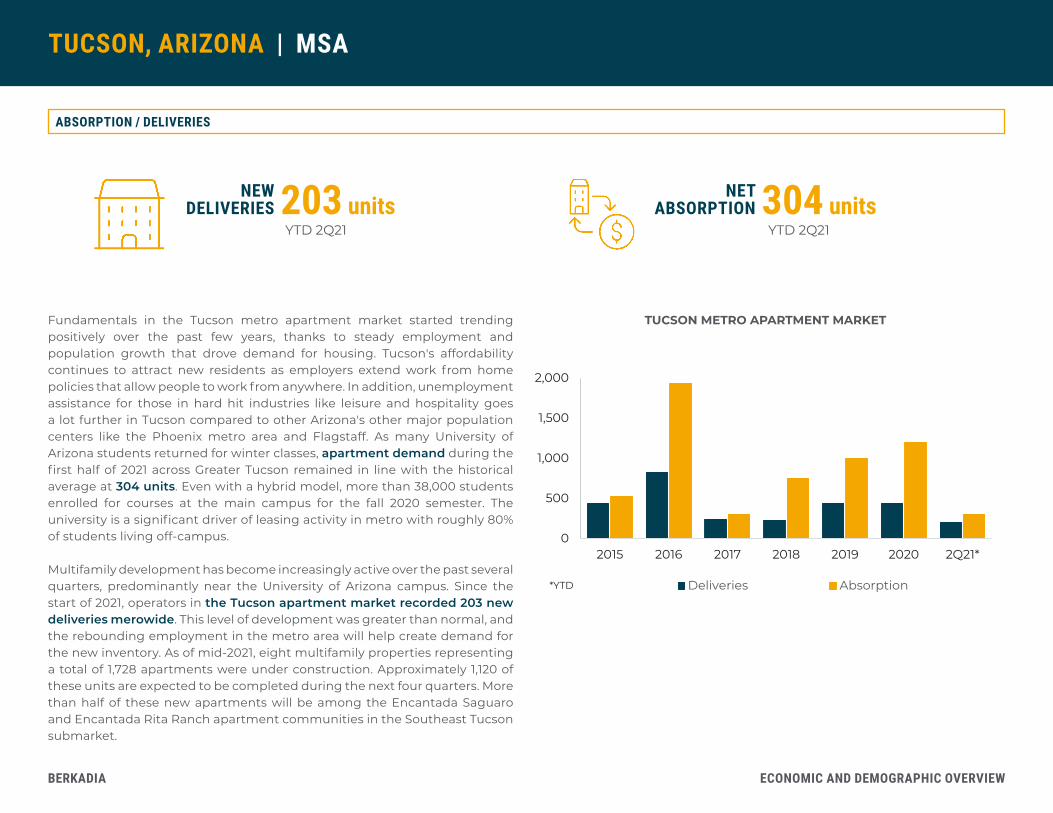
Fundamentals in the Tucson metro apartment market started trending positively over the past few years, thanks to steady employment and population growth that drove demand for housing. Tucson's affordability continues to attract new residents as employers extend work from home policies that allow people to work from anywhere. In addition, unemployment assistance for those in hard hit industries like leisure and hospitality goes a lot further in Tucson compared to other Arizona's other major population centers like the Phoenix metro area and Flagstaff. As many University of Arizona students returned for winter classes, apartment demand during the first half of 2021 across Greater Tucson remained in line with the historical average at 304 units. Even with a hybrid model, more than 38,000 students enrolled for courses at the main campus for the fall 2020 semester. The university is a significant driver of leasing activity in metro with roughly 80% of students living off-campus.
Multifamily development has become increasingly active over the past several quarters, predominantly near the University of Arizona campus. Since the start of 2021, operators in the Tucson apartment market recorded 203 new deliveries merowide. This level of development was greater than normal, and the rebounding employment in the metro area will help create demand for the new inventory. As of mid-2021, eight multifamily properties representing a total of 1,728 apartments were under construction. Approximately 1,120 of these units are expected to be completed during the next four quarters. More than half of these new apartments will be among the Encantada Saguaro and Encantada Rita Ranch apartment communities in the Southeast Tucson submarket.
TUCSON METRO APARTMENT MARKET
NEWDELIVERIES 203 units
YTD 2Q21
NETABSORPTION 304 units
YTD 2Q21
ECONOMIC AND DEMOGRAPHIC OVERVIEWBERKADIA
$653
$677
$719
$769
$816
$871
$94
3
84%
88%
92%
96%
100%
$300
$500
$700
$900
$1,100
2015 2016 2017 2018 2019 2020 2Q21
Rent and Occupancy
Effective Rent Occupancy Rate
TUCSON, ARIZONA | MSA
RENT / OCCUPANCY
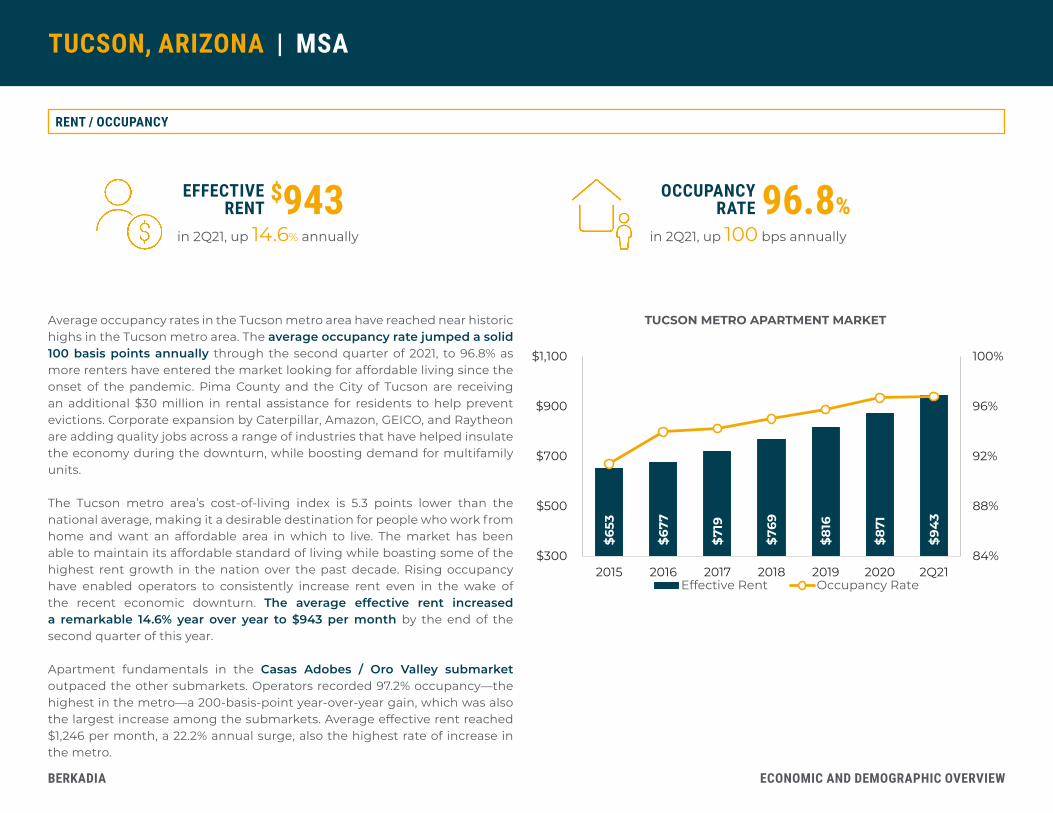
EFFECTIVE RENT
$943in 2Q21, up 14.6% annually
OCCUPANCYRATE 96.8%
in 2Q21, up 100 bps annually
Average occupancy rates in the Tucson metro area have reached near historic highs in the Tucson metro area. The average occupancy rate jumped a solid 100 basis points annually through the second quarter of 2021, to 96.8% as more renters have entered the market looking for affordable living since the onset of the pandemic. Pima County and the City of Tucson are receiving an additional $30 million in rental assistance for residents to help prevent evictions. Corporate expansion by Caterpillar, Amazon, GEICO, and Raytheon are adding quality jobs across a range of industries that have helped insulate the economy during the downturn, while boosting demand for multifamily units.
The Tucson metro area’s cost-of-living index is 5.3 points lower than the national average, making it a desirable destination for people who work from home and want an affordable area in which to live. The market has been able to maintain its affordable standard of living while boasting some of the highest rent growth in the nation over the past decade. Rising occupancy have enabled operators to consistently increase rent even in the wake of the recent economic downturn. The average effective rent increased a remarkable 14.6% year over year to $943 per month by the end of the second quarter of this year.
Apartment fundamentals in the Casas Adobes / Oro Valley submarket outpaced the other submarkets. Operators recorded 97.2% occupancy—the highest in the metro—a 200-basis-point year-over-year gain, which was also the largest increase among the submarkets. Average effective rent reached $1,246 per month, a 22.2% annual surge, also the highest rate of increase in the metro.
TUCSON METRO APARTMENT MARKET

ECONOMIC AND DEMOGRAPHIC OVERVIEWBERKADIA
TUCSON, ARIZONA | MSA
EDUCATION
The Tucson metro area is home to two major institutions of higher education: The University of Arizona and Pima Community College. The two institutions have a combined enrollment of more than 68,000 students. In addition, two Tucson high schools, Basis Oro Valley and University High School, are ranked No. 18 and No. 22, respectively, in the nation by U.S. News & World Report.
Based in Tucson, the University of Arizona (UA) welcomed 46,930 students online and among all its campuses in the fall of 2020. With only 7,300 housing units available on campus, the university is a major source of demand for off-campus rental units.
Pima Community College (PCC) is one of the largest multicampus community colleges in the nation, comprising six campuses, four education centers, and several adult learning centers that offer over 195 certificate and degree programs. PCC enrolls about 21,100 full- and part-time students annually.
HIGHER EDUCATION 68k+students metrowide
DEGREES ANDCERTIFICATIONS 300programs offered at UA
UNIVERSITY OF ARIZONA

ECONOMIC AND DEMOGRAPHIC OVERVIEWBERKADIA
TUCSON, ARIZONA | MSA
LIFESTYLE AND ENTERTAINMENT
With a community rich in history and culture, Tucson offers an abundance of outdoor recreational activities, community festivals, sporting events, arts and cultural attractions, a vibrant downtown, exciting nightlife, activities, and a variety of shopping options. Popular area attractions include Pima Air & Space Museum, Old Tucson, Colossal Cave Mountain Park, Mission San Xavier del Bac, Kitt Peak National Observatory, Mt. Lemmon, Tumamoc Hill, Biosphere 2, and the recently completed Kino Sports Complex.
Situated along the Sonoran Desert encompassing five mountain ranges, the region features hiking trails for all levels as well as 1,000 miles of bike paths. Tucson was named in Bicycling magazine’s top cycling cities in the nation for multiple years. With 131 paved miles, The Loop is one of Tucson's shared-use trail systems ideal for biking, horseback riding, walking, or skating. The region is also home to over 40 golf courses, including Omni Tucson National Resort, host of the PGA Tour Champions Cologuard Classic each March.
Tucson is considered a foodie mecca with an endless variety of options, including world-class dining and the Best 23 Miles of Mexican Food. Many restaurants are found in the city's eclectic downtown in addition to artwork, nightlife, and the Tucson streetcar. Considered an art destination, Tucson boasts over 200 artistic groups, 30 regional museums, and its own ballet, theater, opera, and symphony.
With over 2,130 slot machines, Tucson is also home to Arizona's second- and fourth-largest casinos, respectively, the Desert Diamond Casino and Casino del Sol Resort. Microbrewery fans enjoy fine beers at Barrio Brewing Co. and Dragon Brewing, two of the largest craft breweries in the state.
PAVEDTRAILS 1.0k miles
making Tucson one of the top cycling cities in the nation
BEER, WINE AND SPIRITS 20+
breweries and tap houses, distilleries, pubs, and wineries / vineyards
THE LOOP
ECONOMIC AND DEMOGRAPHIC OVERVIEWBERKADIA
TUCSON, ARIZONA | MSA
Sources: Berkadia; Tetrad; U.S. Census Bureau; U.S. Bureau of Labor Statistics; Fortune/Money.CNN.com; Forbes; Moody’s; Wikipedia; Axiometrics; Tucson Chamber of Commerce; City of Tucson; Pima County; Tucson Regional Economic Opportunities; The Arizona Daily Star; University of Arizona; Phoenix Business Journal; Tucson Citizen; Tucson International Airport; Inside Tucson Business; AZBiz.com; Metropolitan Tucson Convention & Visitors Center; Sun Tran; KVOA.com; University Medical Center; Pima Community College; Tucson Artisan Builders; Tucson 2015; Arizona Public Media; WalletHub; U.S. News & World Report; Smart Asset; National Science Foundation; Davis-Monthan Air Force Base; www.Tucson.com; Tucson Association of Realtors; Tucson News NOW; Southern Arizona Defense Alliance; DM50; Board of Regents - Arizona's Public Universities; Downtown Tucson Partnership; Biz Tucson; Tucson.com; AZCentral.com; CoStar.
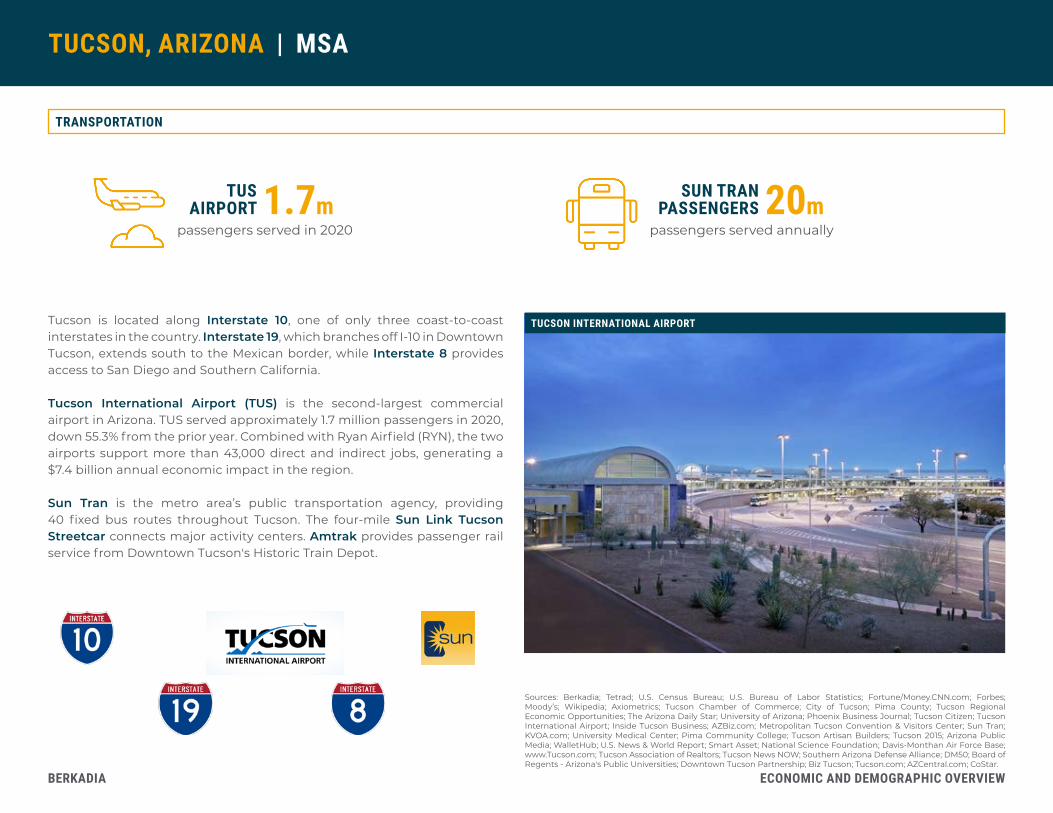
TRANSPORTATION
Tucson is located along Interstate 10, one of only three coast-to-coast interstates in the country. Interstate 19, which branches off I-10 in Downtown Tucson, extends south to the Mexican border, while Interstate 8 provides access to San Diego and Southern California.
Tucson International Airport (TUS) is the second-largest commercial airport in Arizona. TUS served approximately 1.7 million passengers in 2020, down 55.3% from the prior year. Combined with Ryan Airfield (RYN), the two airports support more than 43,000 direct and indirect jobs, generating a $7.4 billion annual economic impact in the region.
Sun Tran is the metro area’s public transportation agency, providing 40 fixed bus routes throughout Tucson. The four-mile Sun Link Tucson Streetcar connects major activity centers. Amtrak provides passenger rail service from Downtown Tucson's Historic Train Depot.
TUS AIRPORT 1.7m
passengers served in 2020
SUN TRAN PASSENGERS 20m
passengers served annually
TUCSON INTERNATIONAL AIRPORT
ECONOMIC AND DEMOGRAPHIC OVERVIEWBERKADIA
TUCSON, ARIZONA | MSA
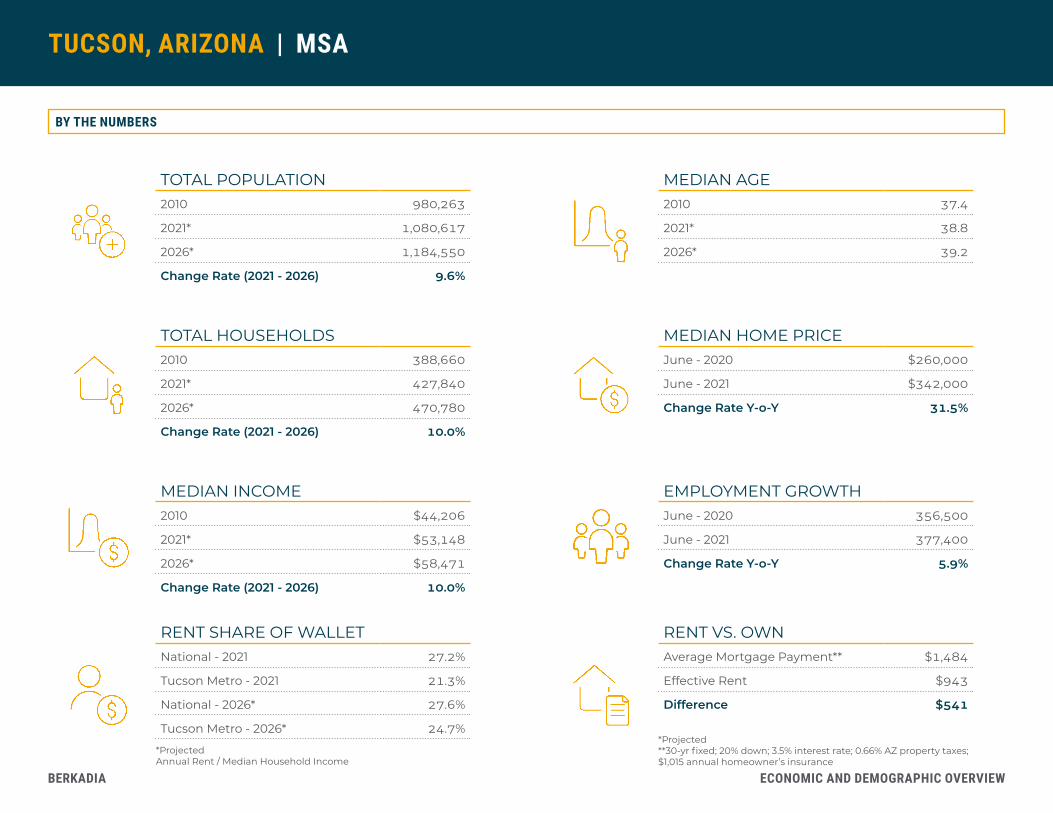
RENT VS. OWNAverage Mortgage Payment** $1,484
Effective Rent $943
Difference $541
RENT SHARE OF WALLETNational - 2021 27.2%
Tucson Metro - 2021 21.3%
National - 2026* 27.6%
Tucson Metro - 2026* 24.7%
BY THE NUMBERS
TOTAL POPULATION2010 980,263
2021* 1,080,617
2026* 1,184,550
Change Rate (2021 - 2026) 9.6%
TOTAL HOUSEHOLDS2010 388,660
2021* 427,840
2026* 470,780
Change Rate (2021 - 2026) 10.0%
MEDIAN INCOME2010 $44,206
2021* $53,148
2026* $58,471
Change Rate (2021 - 2026) 10.0%
MEDIAN AGE2010 37.4
2021* 38.8
2026* 39.2
MEDIAN HOME PRICEJune - 2020 $260,000
June - 2021 $342,000
Change Rate Y-o-Y 31.5%
*Projected**30-yr fixed; 20% down; 3.5% interest rate; 0.66% AZ property taxes; $1,015 annual homeowner’s insurance
EMPLOYMENT GROWTHJune - 2020 356,500
June - 2021 377,400
Change Rate Y-o-Y 5.9%
*ProjectedAnnual Rent / Median Household Income

A Berkshire Hathaway and Jefferies Financial Group company


