Causeway Capital Management LLC 11111 Santa Monica Blvd. 15th Floor Los Angeles, CA 90025 www.causewaycap.com Tucson Supplemental Retirement System International Value Equity Client Review February 28, 2013 Solely for one‐on‐one presentations to institutional clients and prospective institutional clients and their advisers. Causeway Capital Management LLC 11111 Santa Monica Blvd. 15 th Floor Los Angeles, CA 90025 www.causewaycap.com
Transcript
Causeway Capital Management LLC11111 Santa Monica Blvd.15th FloorLos Angeles, CA 90025www.causewaycap.com
Tucson Supplemental Retirement SystemInternational Value EquityClient ReviewFebruary 28, 2013
Solely for one‐on‐one presentations to institutional clientsand prospective institutional clients and their advisers.
Causeway Capital Management LLC11111 Santa Monica Blvd.15th FloorLos Angeles, CA 90025www.causewaycap.com
Table Of Contents
Section
About Causeway 1
Portfolio Overview 2
Performance Analysis and Highlights 3
Investment Outlook 4
Holdings 5
Appendix 6
Business Update- as of December 2012
International Value Equity
December 31, 2012
3About Causeway
Assets under management are approximately $16 billion
Causeway Strategies Include: > Value
International Value Equity‐ $12.4bnInternational Value Select‐ $826mGlobal Value Equity‐ $1.0bn
Harry HartfordPresidentHead of Fundamental Research Portfolio Manager
Sarah KettererChief Executive Officer Portfolio Manager
Paul O’GradyDirector of National Accounts
Eric CrabtreeChief Client Service Officer
Turner SwanGeneral CounselCompliance Officer
Richard IngramHead Trader
Jonathan EngPortfolio Manager
Arjun JayaramanHead of Quantitative ResearchPortfolio Manager
Jerry MacDonaldDirector of Sales
Sarah Van NessRelationship Manager
Gretchen CorbellAttorney
Steve KinomotoTrader
James DoylePortfolio Manager
Duff KuhnertPortfolio Manager
Kevin MoutesProduct Manager
Joy ScarolaClient Service Associate
Nicolas ChangCompliance Manager
Pete PetersenHead of Technology
Kevin DurkinPortfolio Manager
Joe GublerResearch Associate
Jason BetleyDirector of Sales
Kevin HuCompliance Specialist
Steve Cooper Technology
Conor MuldoonPortfolio Manager
Seung HanResearch Associate
Preston PattonDirector of Sales
Jaime RochonHuman Resources
Kumar MahadevaTechnology
Foster CorwithResearch Associate
David HisseyEast Coast Sales Associate
Daniel PhamController
Taline HagopianTechnology
Alessandro ValentiniResearch Associate
McKenzie StuckmanWest Coast Internal Sales
Keisha MooreHead of Operations
Victor LiuResearch Associate
Teddy LevittSouthern Internal Sales
Jason AielloOperations
Ellen LeeResearch Associate
Carolyn JessieOperations
James PakResearch Associate
Katie TranOperations
Andrew RalphResearch Associate
James VillaromanOperations
Steven NguyenResearch Associate
Fusheng LiResearch Associate
Research Team/ Professional Staff
International Value Equity
December 31, 2012
5About Causeway
NAME POSITION Yrs w/ Team Yrs Exp
Sarah Ketterer Portfolio Manager 23 27Harry Hartford Portfolio Manager 19 29James Doyle Portfolio Manager 16 20Jonathan Eng Portfolio Manager 17 21Kevin Durkin Portfolio Manager 14 17Conor Muldoon, CFA Portfolio Manager 9 17Foster Corwith, CFA Research Associate 7 12Alessandro Valentini,CFA Research Associate 6 11Victor Liu, CFA Research Associate 8 12Ellen Lee Research Associate 5 9James Pak Research Associate 3 10Andrew Ralph Research Associate 2 6Steven Nguyen, CFA Research Associate 1 10Fusheng Li, MD, PhD Research Associate 1 3Arjun Jayaraman, PhD, CFA Head of Quantitative Research, PM 7 15Duff Kuhnert, CFA Quantitative Research, PM 17 18Joe Gubler, CFA Research Associate 8 8Seung Han Research Associate 3 6
CORPORATE SUB‐ADVISORY PUBLIC TAFT‐HARTLEY/UNIONAGL Resources IncAlbemarle CorporationAmeren Master Retirement TrustAmerican Airlines, Inc. Archer Daniels MidlandArrowood Indemnity CompanyBAE SystemsDanaher CorporationDeluxe CorporationFlowers Foods, Inc.General MillsIllinois Tool Works Inc. Mutual of OmahaOGE Energy CorporationOncor Retirement Plan Reichhold, Inc. Rockwell Automation, Inc.Rockwell Collins, Inc2 Confidential Corporate
American Beacon International Equity FundCIBC Asset Management Inc.Fortigent, LLCHarbor CapitalLegg Mason Private Portfolio Group, LLC Principal Funds, Inc. – International Value Fund I Harbor Global Value FundHC Capital TrustThe Northern Trust CompanySEI Institutional International Trust SEI Institutional Investments TrustSEI Investments Canada CompanySEI Investments: SMAP/IMAP Managed Account ProgramSEI Adviser Managed Trust: Tactical Offensive Equity Fund13 Confidential Sub‐Advisory
County of Los Angeles Deferred Compensation and Thrift PlanFire and Police Employees’ Retirement System of the City of BaltimoreHydro OneIntrust Superannuation Fund Memphis Light, Gas and Water Retirement and Pension SystemOhio Police and Fire PensionPublic School Retirement System of the City of St. LouisSalt River Project Employees' Retirement PlanSan Francisco Employees' Retirement SystemTeachers’ Retirement System of OklahomaThe Educational Employees' Supplementary Retirement System of Fairfax County The Prince George’s County Police Pension PlanThe Prince George’s County Fire Service Pension PlanPrince George’s County Comprehensive and Supplemental Pension PlansTucson Supplemental Retirement System2 Confidential Public Plans
Amalgamated Bank1199 Health Care Employees Pension Fund1199 SEIU Greater New York Pension FundCentral Pennsylvania TeamstersCentral States, Southeast and Southwest Areas Pension Fund Healthcare Employees' Pension Plan‐ManitobaNorthern CA Pharmacists, Clerks and Drug Employers Pension PlanTwin City Minnesota Nurses Association Pension Trust
CHARITABLE MUTUAL FUNDS TAXABLE TRUSTS/FUNDS ENDOWMENT/FOUNDATIONBanner HealthCedars‐Sinai Medical CenterChristian Brothers Investment Services, Inc.R.W. Grand Lodge of PennsylvaniaVia Christi Health Systems2 Confidential Socially‐Responsible
Causeway International Value FundCauseway Emerging Markets FundCauseway Global Value FundCauseway International Opportunities FundCauseway Global Absolute Return Fund
2 Confidential Family Trusts/Funds 1 Confidential Foundation
Client List
International Value Equity
December 31, 2012
6About Causeway
All separate account and group trust clients included. It is not known whether the listed clients approve or disapprove of Causeway or its investment advisory services.
Research and Portfolio Management
International Value Equity
December 31, 2012
7About Causeway
Portfolio ManagersResearch Analysts
* Head of Fundamental Research** Head of Quantitative Research
QUANTITATIVE Research
Jayaraman**KuhnertGublerHan
PORTFOLIO AND RISK ManagementKettererHartford*JayaramanKuhnert
Research Heads
FINANCIALS AND MATERIALS
ResearchMuldoonValentini
LiuPak
HEALTH CARE AND TECHNOLOGY
ResearchDoyle
ValentiniLiuLi
CONSUMER AND ENERGYResearchDurkinCorwithLee
Nguyen
INDUSTRIALS AND MANUFACTURING
ResearchEng
Corwith LeeRalph
Fundamental Research Matrix (arranged by GICS sector)
International Value Equity
December 31, 2012
8About Causeway
Portfolio ManagersResearch Analysts
Durkin Durkin Durkin Muldoon DoyleEng Corwith Lee Liu DurkinCorwith Nguyen Valentini ValentiniLee Pak LiRalph
Eng Doyle Muldoon Doyle DurkinCorwith Liu Eng Liu LeeLee Li Corwith NguyenRalph Pak
HEALTH CARE
INDUSTRIALS INFORMATION TECHNOLOGY
MATERIALS TELECOM SERVICES
UTILITIES
ENERGY FINANCIALSCONSUMER DISCRETIONARY
CONSUMER STAPLES
Investment Philosophy & Process
International Value Equity
December 31, 2012
9About Causeway
SCREENINGS
RESEARCH LIST
FUNDAMENTALANALYSIS
VALIDATE TARGET PRICE
PORTFOLIOCONSTRUCTION
By Country Earnings Yield, Payout Yield
By Industry Enterprise Value/EBITDA, EPS Revisions
400 stocks
250 stocks
FOREIGN STOCK UNIVERSE24 Markets: 1,500 Stocks
- Industry dynamics-Financial strength-Competitor analysis
-Global cluster review of models and assumptions (1‐ Financials & Materials, 2‐Health Care & Technology, 3‐ Consumer & Energy, 4‐ Industrials & Manufacturing)
CCM 2‐YEAR PRICE TARGET
Approximately 50–80 stocks
150 stocks
INTERNATIONAL VALUE EQUITY
Value manager Active, bottom‐up stock selection Meticulous fundamental research
Focus on controlling risk View risk as volatility of returns, not tracking error Risk is controlled using proprietary quantitative tools
Team approach Provides continuity of the investment process
Portfolio Snapshot
International Value Equity
December 31, 2012
Portfolio Overview 10
ASSETS
CHARACTERISTICS
as of December 31, 2012
Total Assets $45,835,208Equity 98.41%Cash 1.63%Accrued Income 0.03%Currency Forwards Unrealized Gain/Loss ‐0.06%
Portfolio MSCI EAFEFY2 Price/Earnings 11.2 x 11.7 xPrice/Book Value 1.7 x 1.4 xReturn on Equity 17.2 % 15.9 %Dividend Yield 3.4 % 3.4 %
No. of Holdings 59 909Wtd Avg Mkt Cap (Mn $US) 45,998 47,414
Performance
Account returns are calculated daily. Monthly account returns are calculated by geometrically linking the daily returns. Returns are calculated monthly by weighting monthly account returns by the beginning market value. Returns include the reinvestment of interest, dividends and any capital gains. Returns are calculated gross of withholding taxes on dividends, interest and capital gains. The gross performance presented is before management and custody fees but after trading expenses. Returns greater than one year, if any, are annualized. Past performance is no guarantee of future performance.
International Value Equity
December 31, 2012
Portfolio Overview 11
RETURNS (GROSS OF FEES) for the periods ended December 31, 2012
Performance Inception Date: 01/14/2005
‐5
0
5
10
15
20
25
30
Quarter 1 Year 3 Years 5 Years 7 Years Since InceptionTUCSON 5.85 24.14 8.33 ‐0.03 4.99 5.82
MSCI EAFE 6.60 17.90 4.04 ‐3.21 2.67 4.37
Returns (%)
Performance
Account returns are calculated daily. Monthly account returns are calculated by geometrically linking the daily returns. Returns are calculated monthly by weighting monthly account returns by the beginning market value. Returns include the reinvestment of interest, dividends and any capital gains. Returns are calculated gross of withholding taxes on dividends, interest and capital gains. The gross performance presented is before management and custody fees but after trading expenses. Past performance is no guarantee of future performance.
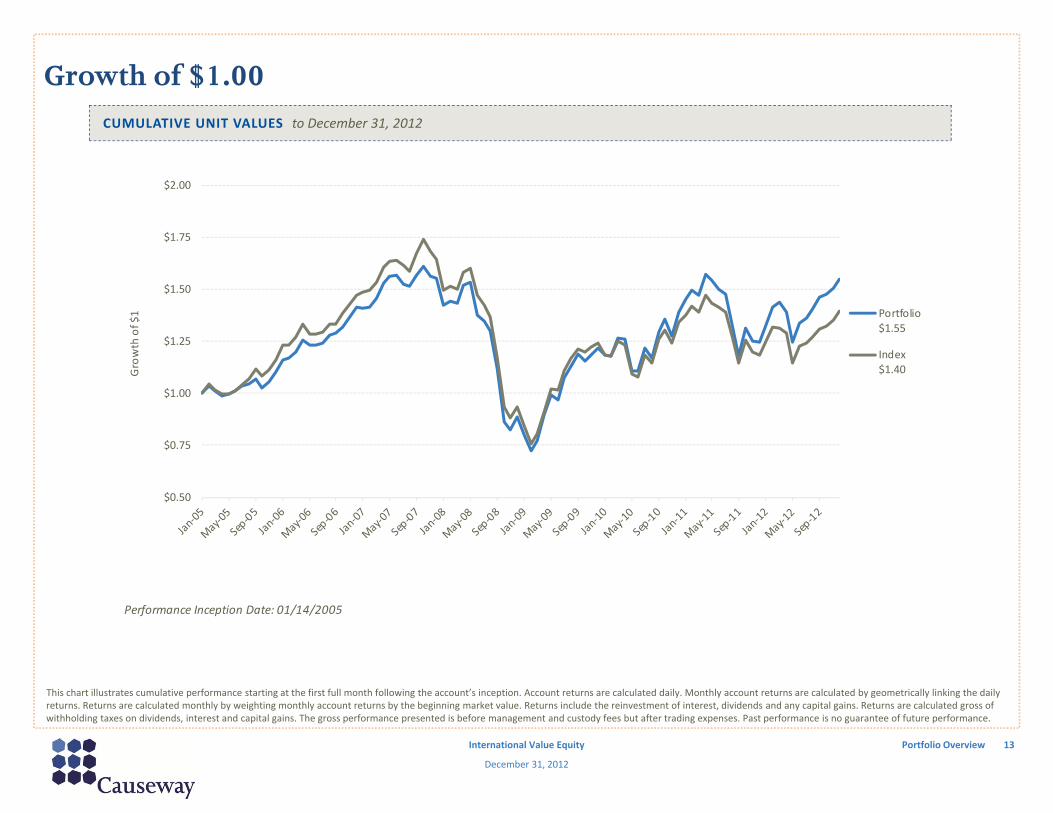
This chart illustrates cumulative performance starting at the first full month following the account’s inception. Account returns are calculated daily. Monthly account returns are calculated by geometrically linking the daily returns. Returns are calculated monthly by weighting monthly account returns by the beginning market value. Returns include the reinvestment of interest, dividends and any capital gains. Returns are calculated gross of withholding taxes on dividends, interest and capital gains. The gross performance presented is before management and custody fees but after trading expenses. Past performance is no guarantee of future performance.
International Value Equity
December 31, 2012
Portfolio Overview 13
CUMULATIVE UNIT VALUES to December 31, 2012
Performance Inception Date: 01/14/2005
$0.50
$0.75
$1.00
$1.25
$1.50
$1.75
$2.00
Growth of $1 Portfolio
$1.55
Index$1.40
Geographic Exposure and Index Performance
International Value Equity
December 31, 2012
Performance Analysis and Highlights 14
WEIGHTS as of December 31, 2012 INDEX RETURNS* for the year‐to‐date through December 31, 2012
PacificAustra l ia 22.3 20.8Hong Kong 28.3 28.0Japan 8.4 21.8New Zea land 30.4 23.3Singapore 31.0 23.5South Korea 21.5 12.9
Africa / MideastIs rael ‐3.9 ‐6.2
Performance Analysis and HighlightsPerformance Analysis and Highlights
Causeway estimates are based on latest available revenues reported by companies in the portfolio on 12/31/12, proportionate to holding weights. Israel is classified as emerging.
Data sources: FactSet, Bloomberg, Causeway Analytics
19.7 18.3
45.2
36.7
20.934.2
14.2 10.8
0
10
20
30
40
50
60
70
80
90
100
Causeway International Value Representative Account MSCI EAFE
%
North America Europe Asia Pacific Emerging
GEOGRAPHIC EXPOSURE BY COMPANY REVENUES
Developed Markets Have Economic Exposure to Emerging Markets
International Value Equity
December 31, 2012
15
Regional Attribution
International Value Equity
December 31, 2012
Performance Analysis and Highlights 16
PORTFOLIO vs. MSCI EAFE for the year‐to‐date through December 31, 2012
Performance attribution is based on the equity portion of the portfolio
‐1.00
0.00
1.00
2.00
3.00
4.00
5.00
6.00
Africa / Mideast Euro Other Europe PacificStock Selection 0.00 4.62 0.82 0.60
Country Allocation 0.17 0.40 ‐0.02 ‐0.22
Currency Allocation ‐0.02 0.22 ‐0.39 0.87
Percen
tage
Stock Selection: Positive ‐ Relative outperformance (6.03%) was due to holdings in Japan, France, Netherlands, Ireland, and United Kingdom.Country Allocation: Positive ‐ Relative outperformance (0.33%) resulted from overweighting in Germany, Spain, and France; relative underperformance
resulted from overweighting in Ireland along with underweighting in Greece.Currency: Positive ‐ Relative outperformance (0.68%) resulted from underweighting in Japanese Yen as well as overweighting in South Korean
Won and Euro; relative underperformance resulted from underweighting in Australian Dollar along with overweighting in BritishPound.
Industry Performance
International Value Equity
December 31, 2012
Performance Analysis and Highlights 17
RETURNS for the year‐to‐date through December 31, 2012
‐60.0
‐40.0
‐20.0
0.0
20.0
40.0
60.0
80.0
Return (%
)
Portfolio MSCI EAFE
Industry Attribution
International Value Equity
December 31, 2012
Performance Analysis and Highlights 18
PORTFOLIO vs. MSCI EAFE for the year‐to‐date through December 31, 2012
Stock Selection: Positive ‐ Relative outperformance (7.34%) was due to holdings in Transportation, Materials, Energy, Technology Hardware &Equipment, and Pharmaceuticals & Biotechnology.
Industry Allocation: Negative ‐ Relative underperformance (‐1.09%) resulted from overweighting in Transportation and Materials; relativeoutperformance resulted from overweighting in Energy as well as underweighting in Technology Hardware & Equipment andFood Beverage & Tobacco.
‐1.00
‐0.50
0.00
0.50
1.00
1.50
2.00
Detraction/Contrib
ution
Percent
Stock Selection
Industry Allocation
Top 5 Bottom 5
for the year‐to‐date through December 31, 2012
Significant Contributors and Detractors
International Value Equity
December 31, 2012
Performance Analysis and Highlights 19
Largest Absolute Contributors
Company Name Weight(1) Return
Contribution to
Return(2) Country Industry GroupAKZO NOBEL 3.6% 40.3% 1.17% Netherlands Materia lsTOYOTA MOTOR CORP 3.1% 41.4% 1.05% Japan Automobi les & ComponentsREED ELSEVIER NV 3.5% 30.9% 0.97% Netherlands MediaSANOFI 2.8% 33.8% 0.92% France Pharmaceutica ls & BiotechnologyBARCLAYS PLC 1.6% 60.2% 0.90% United Kingdom BanksHSBC HOLDINGS PLC 2.5% 43.9% 0.82% United Kingdom BanksDEUTSCHE POST AG 1.4% 49.0% 0.81% Germany TransportationGEMALTO 0.0% 60.3% 0.76% France Technology Hardware & EquipmentJGC CORP 2.4% 31.0% 0.76% Japan Capita l GoodsMUNICH RE 1.6% 53.7% 0.73% Germany Insurance
Largest Absolute Detractors
Company Name Weight(1) Return
Contribution to
Return(2) Country Industry GroupEURASIAN NATURAL RESOURCES 0.0% ‐54.1% ‐0.46% United Kingdom Materia lsBG GROUP PLC 1.5% ‐18.5% ‐0.33% United Kingdom EnergyOPAP SA 0.0% ‐39.9% ‐0.21% Greece Consumer ServicesSANKYO CO LTD GUNMA 0.5% ‐18.5% ‐0.14% Japan Consumer Durables & ApparelTESCO PLC 2.5% ‐8.8% ‐0.12% United Kingdom Food & Staples Retai l ingTOKYO ELECTRON LTD 1.0% ‐9.4% ‐0.07% Japan Semiconductors & Semi EquipmentVODAFONE GROUP PLC 1.6% ‐4.6% ‐0.07% United Kingdom Telecom ServicesBANK OF YOKOHAMA LTD/THE 0.4% 3.3% 0.00% Japan BanksBP PLC 0.0% ‐0.9% 0.00% United Kingdom EnergyMEDIASET ESPANA COMUNICACION SA 0.0% 44.7% 0.00% Spain Media
(1) Ending period weights(2) Geometric average using daily returns and weights
for the year‐to‐date through December 31, 2012
Significant Changes
International Value Equity
December 31, 2012
Performance Analysis and Highlights 20
Increases Country Industry Group % Beginning Weight % Ending Weight Reason*TOTAL SA France Energy 0.00% 2.14% IL, ERDAIMLER AG Germany Automobi les & Components 0.00% 2.02% CD, ERDEUTSCHE BOERSE AG Germany Divers i fied Financia ls 0.00% 1.60% CD, ERCNOOC LTD Hong Kong Energy 0.00% 1.50% IL, ERBG GROUP PLC United Kingdom Energy 0.00% 1.47% IL, ERFANUC LTD Japan Capita l Goods 0.00% 1.04% CD, ERBASF AG Germany Materia ls 0.00% 0.50% CDCHINA MERCHANTS HLDGS INTL Hong Kong Transportation 0.00% 0.50% CD, ERBANK OF YOKOHAMA LTD/THE Japan Banks 0.00% 0.43% CD, ERRED ELECTRICA DE ESPANA Spain Uti l i ties 0.00% 0.30% IL, ER
Decreases Country Industry Group % Beginning Weight % Ending Weight Reason*GEMALTO France Technology Hardware & Equipment 1.51% 0.00% RVHONDA MOTOR CO LTD Japan Automobi les & Components 2.06% 0.00% RVAIR LIQUIDE France Materia ls 1.61% 0.00% RVSMC CORP Japan Capi ta l Goods 1.80% 0.00% RVHYUNDAI HEAVY INDUSTRIES South Korea Capi ta l Goods 1.22% 0.00% RVTNT EXPRESS NV Netherlands Transportation 0.70% 0.00% RVBP PLC United Kingdom Energy 1.23% 0.00% RVBANCO SANTANDER CENTRAL HISP Spa in Banks 0.87% 0.00% RVVINCI SA France Capita l Goods 0.60% 0.00% RVEURASIAN NATURAL RESOURCES United Kingdom Materia ls 0.97% 0.00% RV
*Key: CD = Cyclical discount ER = Earnings revision IL = Industry Laggard PR = Political risk RV = Relative value RB = Rebalance of security weightings
Industry Exposure
International Value Equity
December 31, 2012
Performance Analysis and Highlights 21
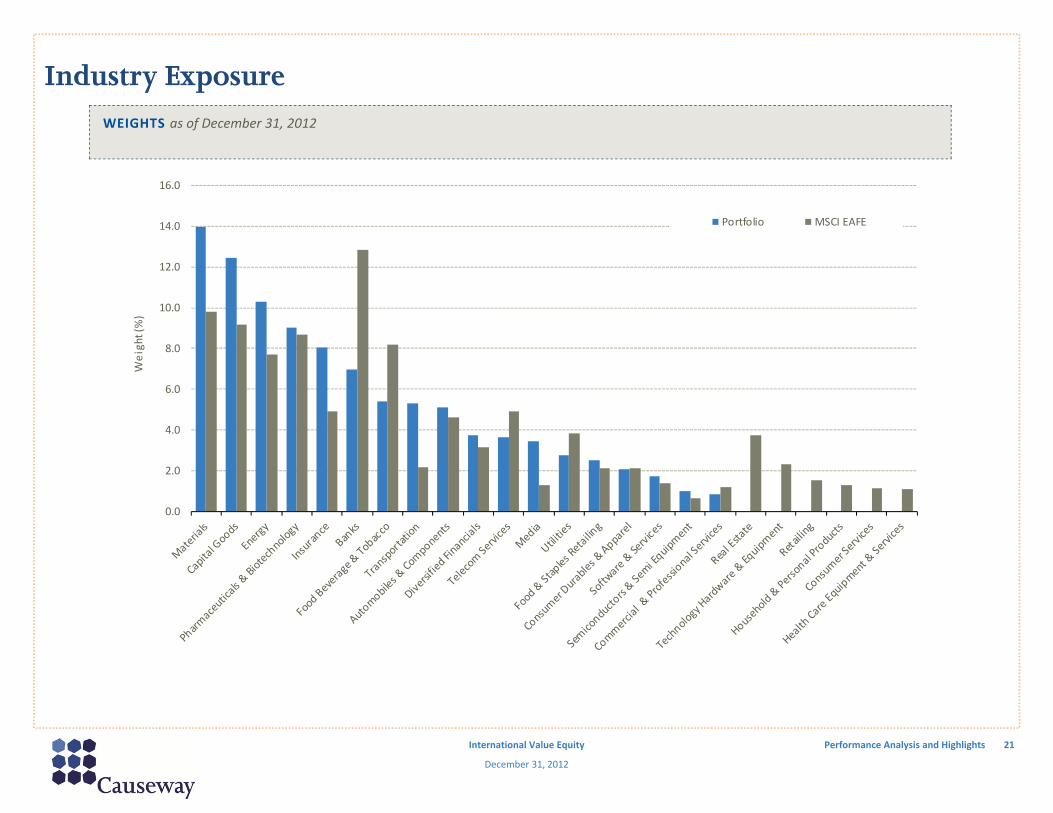
WEIGHTS as of December 31, 2012
0.0
2.0
4.0
6.0
8.0
10.0
12.0
14.0
16.0
Weight (%)
Portfolio MSCI EAFE
as of December 31, 2012
Top 10 Holdings
International Value Equity
December 31, 2012
Performance Analysis and Highlights 22
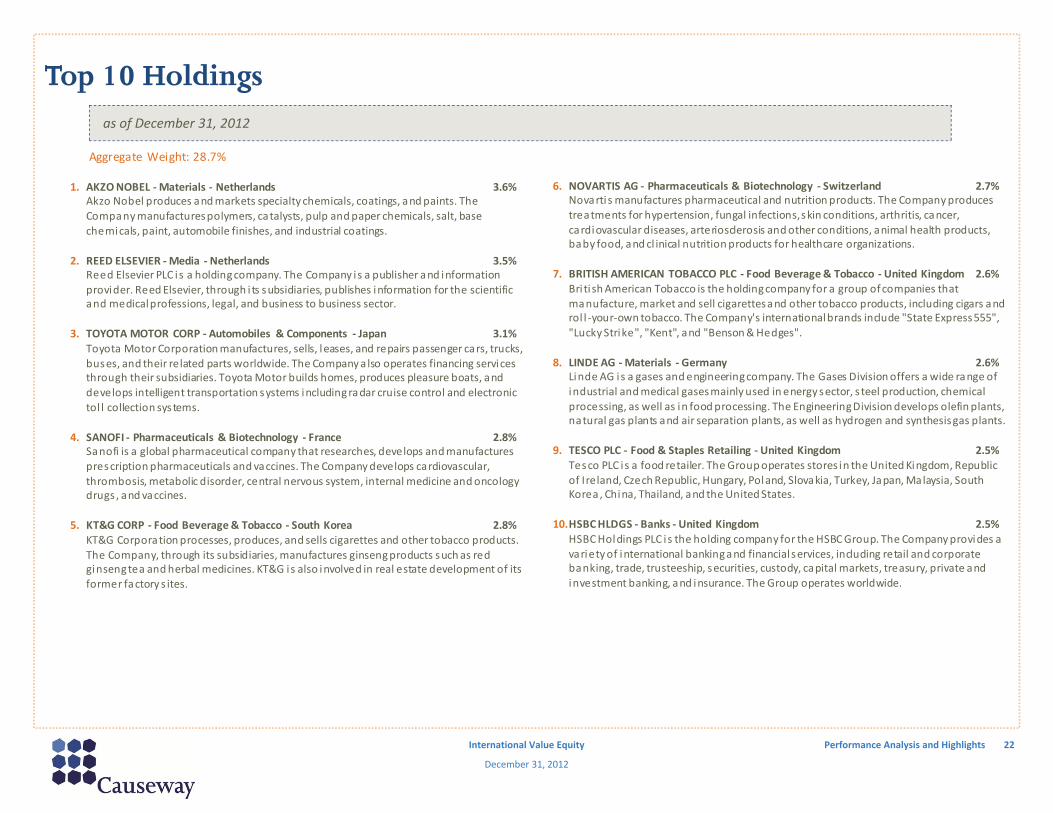
Aggregate Weight: 28.7% 1. AKZO NOBEL ‐ Materials ‐ Netherlands 3.6% Akzo Nobel produces and markets specialty chemicals, coatings, and paints. The Company manufactures polymers, catalysts, pulp and paper chemicals, salt, base chemicals, paint, automobile finishes, and industrial coatings. 2. REED ELSEVIER ‐ Media ‐ Netherlands 3.5% Reed Elsevier PLC i s a holding company. The Company i s a publisher and information provider. Reed Elsevier, through i ts subsidiaries, publishes information for the scientific and medical professions, legal, and business to business sector. 3. TOYOTA MOTOR CORP ‐ Automobiles & Components ‐ Japan 3.1% Toyota Motor Corporation manufactures, sells, leases, and repairs passenger cars, trucks, buses, and their related parts worldwide. The Company a lso operates financing services through their subsidiaries. Toyota Motor builds homes, produces pleasure boats, and develops intelligent transportation systems including radar cruise control and electronic tol l collection systems. 4. SANOFI ‐ Pharmaceuticals & Biotechnology ‐ France 2.8% Sanofi is a global pharmaceutical company that researches, develops and manufactures prescription pharmaceuticals and vaccines. The Company develops cardiovascular, thrombosis, metabolic disorder, central nervous system, internal medicine and oncology drugs , and vaccines. 5. KT&G CORP ‐ Food Beverage & Tobacco ‐ South Korea 2.8% KT&G Corporation processes, produces, and sells cigarettes and other tobacco products. The Company, through its subsidiaries, manufactures ginseng products such as red ginseng tea and herbal medicines. KT&G i s also involved in real estate development of its former factory s ites.
6. NOVARTIS AG ‐ Pharmaceuticals & Biotechnology ‐ Switzerland 2.7%
Novartis manufactures pharmaceutical and nutrition products. The Company produces treatments for hypertension, fungal infections, skin conditions, arthritis, cancer, cardiovascular diseases, arteriosclerosis and other conditions, animal health products, baby food, and cl inical nutrition products for healthcare organizations.
7. BRITISH AMERICAN TOBACCO PLC ‐ Food Beverage & Tobacco ‐United Kingdom 2.6%
Bri ti sh American Tobacco is the holding company for a group of companies that manufacture, market and sell cigarettes and other tobacco products, including cigars and rol l ‐your‐own tobacco. The Company's international brands include "State Express 555", "Lucky Strike", "Kent", and "Benson & Hedges".
8. LINDE AG ‐ Materials ‐ Germany 2.6%
Linde AG i s a gases and engineering company. The Gases Division offers a wide range of industrial and medical gases mainly used in energy sector, s teel production, chemical processing, as well as in food processing. The Engineering Division develops olefin plants, natural gas plants and air separation plants, as well as hydrogen and synthesis gas plants.
Tesco PLC i s a food retailer. The Group operates stores in the United Kingdom, Republic of Ireland, Czech Republic, Hungary, Poland, Slovakia, Turkey, Japan, Malaysia, South Korea, China, Thailand, and the United States.
10.HSBC HLDGS ‐ Banks ‐United Kingdom 2.5%
HSBC Holdings PLC i s the holding company for the HSBC Group. The Company provides a variety of international banking and financial services, including retail and corporate banking, trade, trusteeship, securities, custody, capital markets, treasury, private and investment banking, and insurance. The Group operates worldwide.
Investment Outlook
International Value Equity
December 31, 2012
23Investment Outlook
Global Economy> Aided by low interest rates and unconventional monetary policy, US economy should continue to recover gradually.> European economies will likely remain stagnant through 2013, as fiscal consolidation outweighs the long‐term benefits of
structural reform.> Yen weakness and calls for the establishment of a minimum inflation target may aid recovery in Japan.> Emerging economies will continue growing at a faster pace than developed, but growth will not be uniform. Growth in many
countries will remain susceptible to political and regulatory interference.
Equity Markets> The sector and country rotation from defensives to cyclicals and financials that began in Q4‐12 should continue through Q1‐
13.> Significant market appreciation from current levels will depend on a narrowing equity risk premium.> Lack of attractive alternative investment opportunities, coupled with cheap and plentiful liquidity, may cause equity
valuations to rise.
Portfolio> Valuations are undemanding.> Equity dividend yields are competitive with fixed income.> Corporate balance sheets remain healthy.
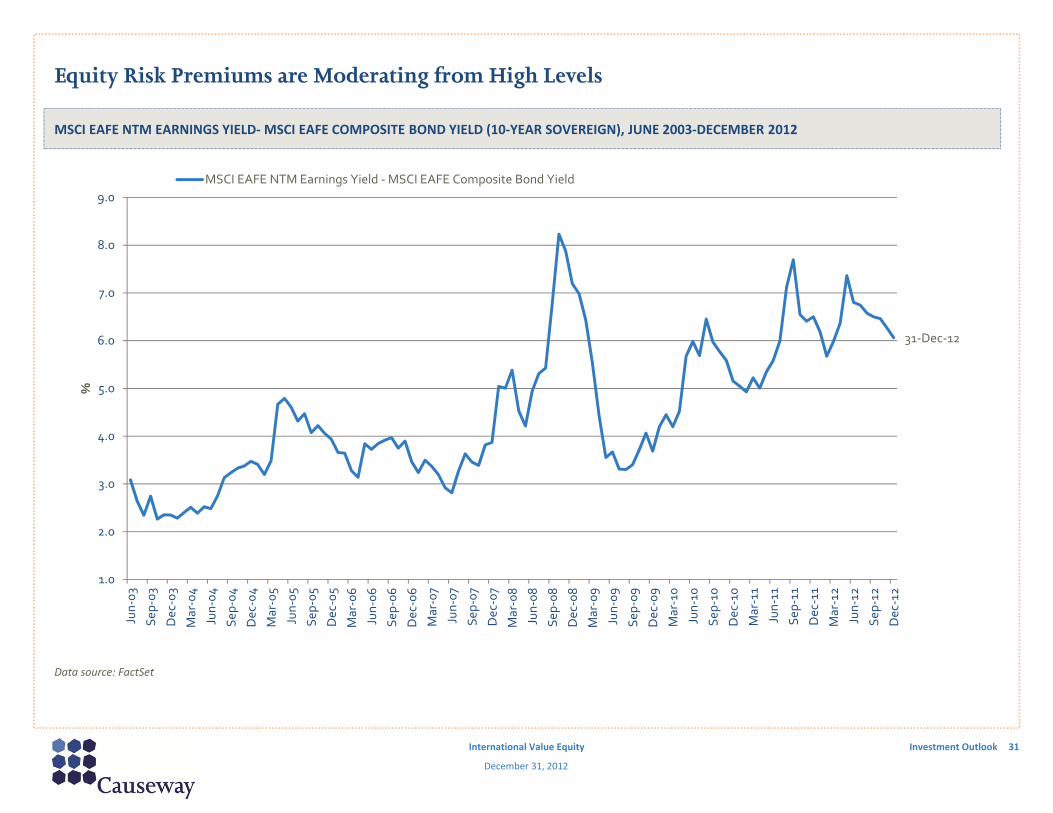
Bond Yield (10‐Year Sovereign) Minus Dividend Yield Average
MSCI EAFE UNIVERSE, JANUARY 1988‐DECEMBER 2012
Equities Are Attractive Versus Bonds
International Value Equity
December 31, 2012
32Investment Outlook
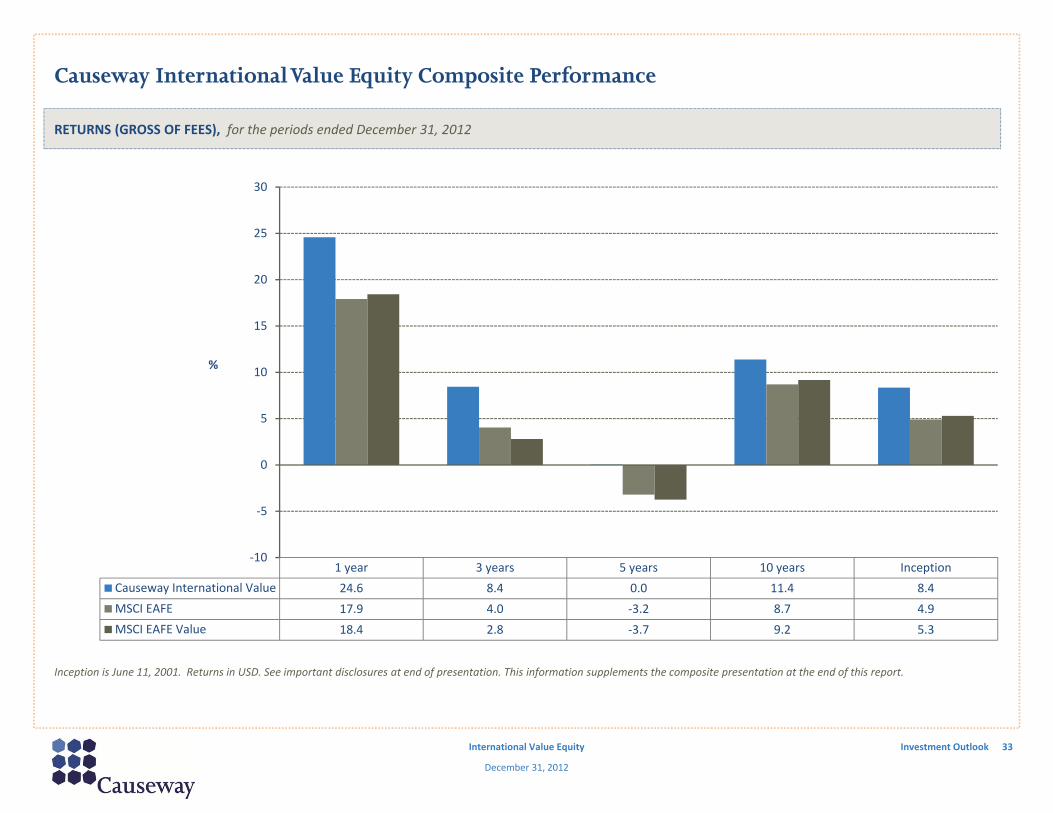
Inception is June 11, 2001. Returns in USD. See important disclosures at end of presentation. This information supplements the composite presentation at the end of this report.
1 year 3 years 5 years 10 years InceptionCauseway International Value 24.6 8.4 0.0 11.4 8.4MSCI EAFE 17.9 4.0 ‐3.2 8.7 4.9MSCI EAFE Value 18.4 2.8 ‐3.7 9.2 5.3
‐10
‐5
0
5
10
15
20
25
30
%
RETURNS (GROSS OF FEES), for the periods ended December 31, 2012
Causeway International Value Equity Composite Performance
International Value Equity
December 31, 2012
33Investment Outlook
*Partial period shown: June 11, 2001 – December 31, 2001 . Returns in USD. See important disclosures at end of presentation. This information supplements the composite presentation at the end of this report.
Causeway International Value Equity Composite Performance
International Value Equity
December 31, 2012
34Investment Outlook
*Partial period shown: January 1, 2001‐June 11, 2001. Returns in USD. The performance presented from 1990 through June 11, 2001 is that of Mercury HW International Value Fund Class I shares (without sales charges). See important disclosures at end of presentation. This information supplements the composite presentation at the end of this report.
Causeway Intl. Value Equity Std. Dev/MSCI EAFE Std. Dev
HISTORICAL TRAILING 12 MONTH VOLATILITY, CAUSEWAY INTERNATIONAL VALUE EQUITY/MSCI EAFE
Risk Management
International Value Equity
December 31, 2012
36Investment Outlook
Returns in USD. The performance presented from 1990 through June 11, 2001 is that of Mercury HW International Value Fund Class I shares (without sales charges). The performance thereafter is that of Causeway's International Value Equity Composite. See important disclosures at end of presentation. This information supplements the composite presentation at the end of this report.
Data sources: FactSet, Causeway Analytics
31.9%
‐19.7%
28.3%
‐26.3%
‐40%
‐30%
‐20%
‐10%
0%
10%
20%
30%
40%
Up Quarters Down Quarters
Return
Causeway International Value Equity Composite MSCI EAFE Index
57 Up QuartersOutperformed Index
36 out of 57
32 Down QuartersOutperformed Index
23 out of 32
ANNUALIZED TOTAL RETURN PERFORMANCE (GROSS OF FEES), OCTOBER 1, 1990‐DECEMBER 31, 2012
Capital Preservation Leads to Competitive Performance
International Value Equity
December 31, 2012
37Investment Outlook
Returns in USD. The performance presented is that of Causeway’s International Value Equity Composite. See important disclosures at end of presentation. This information supplements the composite presentation at the end of this report.
Causeway International Value Equity Composite (Gross of Fees) MSCI EAFE
GROWTH OF $100, Inception June 11, 2001 to December 31, 2012
Causeway International Value Equity Performance versus MSCI EAFE
International Value Equity
December 31, 2012
38Investment Outlook
Annualized Performance (gross of fees)
Causeway Intl. Value Equity: 8.4% MSCI EAFE: 4.9%
Portfolio Holdings
International Value Equity
December 31, 2012
Holdings 39
as of December 31, 2012COUNTRY / SECURITY INDUSTRY GROUP SHARES COST MARKET VALUE ACCRUED INCOME WEIGHT USD$ USD$ USD$Equity British Pound Equity REXAM PLC Materials 90,124 416,623.18 638,720.16 0.00 1.39% Total for British Pound Equity 416,623.18 638,720.16 0.00 1.39% France BNP PARIBAS SA Banks 10,569 703,500.47 593,382.82 0.00 1.29% LEGRAND SA Capital Goods 22,681 915,242.93 953,140.25 0.00 2.08% TECHNIP SA Energy 7,142 418,008.41 817,681.32 0.00 1.78% TOTAL SA Energy 19,097 956,796.93 982,167.40 0.00 2.14% AXA SA Insurance 28,059 561,192.78 493,853.20 0.00 1.08% SANOFI Pharmaceuticals & Biotechnology 13,571 1,013,731.05 1,277,302.16 0.00 2.79% Total for France 4,568,472.57 5,117,527.15 0.00 11.17% Germany DAIMLER AG Automobiles & Components 17,035 830,652.25 927,997.63 0.00 2.02% SIEMENS AG Capital Goods 8,006 865,257.21 867,624.52 0.00 1.89% DEUTSCHE BOERSE AG Diversified Financials 12,059 716,380.19 734,668.94 0.00 1.60% MUENCHENER RUECKVERSICHERUNGS AG Insurance 3,992 566,155.16 715,770.60 0.00 1.56% BASF SE Materials 2,464 164,053.56 231,131.97 0.00 0.50% LINDE AG Materials 6,928 821,565.99 1,205,663.81 0.00 2.63% BAYER AG Pharmaceuticals & Biotechnology 7,647 420,541.15 724,776.31 0.00 1.58% SAP AG Software & Services 9,974 532,898.63 798,051.50 0.00 1.74% DEUTSCHE POST AG Transportation 29,713 566,329.20 650,277.92 0.00 1.42% Total for Germany 5,483,833.34 6,855,963.20 0.00 14.96% Hong Kong YUE YUEN INDUSTRIAL HOLDINGS LTD Consumer Durables & Apparel 216,039 526,280.92 721,909.22 0.00 1.58% CNOOC LTD Energy 317,000 587,591.77 686,280.86 0.00 1.50% CHINA MERCHANTS HOLDINGS INTERNATIONAL C Transportation 72,000 215,515.45 230,839.20 0.00 0.50% Total for Hong Kong 1,329,388.14 1,639,029.28 0.00 3.58%
Portfolio Holdings
International Value Equity
December 31, 2012
Holdings 40
as of December 31, 2012COUNTRY / SECURITY INDUSTRY GROUP SHARES COST MARKET VALUE ACCRUED INCOME WEIGHT USD$ USD$ USD$ Ireland SMURFIT KAPPA GROUP PLC Materials 38,751 775,781.43 453,031.63 0.00 0.99% RYANAIR HOLDINGS PLC Transportation 16,800 453,340.67 575,904.00 0.00 1.26% Total for Ireland 1,229,122.10 1,028,935.63 0.00 2.24% Italy SNAM SPA Utili ties 111,975 530,611.37 518,760.91 0.00 1.13% Total for Italy 530,611.37 518,760.91 0.00 1.13% Japan TOYOTA MOTOR CORP Automobiles & Components 30,700 1,188,373.73 1,422,003.12 0.00 3.10% BANK OF YOKOHAMA LTD/THE Banks 43,000 198,705.58 198,924.42 0.00 0.43% FANUC CORP Capital Goods 2,600 420,319.91 478,713.93 0.00 1.04% JGC CORP Capital Goods 35,000 611,584.83 1,083,212.86 0.00 2.36% SANKYO CO LTD Consumer Durables & Apparel 5,900 332,940.02 233,707.28 0.00 0.51% SONY FINANCIAL HOLDINGS INC Insurance 49,300 884,179.29 878,066.27 0.00 1.92% SHIN‐ETSU CHEMICAL CO LTD Materials 9,800 471,761.68 592,771.64 0.00 1.29% TOKYO ELECTRON LTD Semiconductors & Semi Equipment 10,200 366,054.69 464,199.39 0.00 1.01% KDDI CORP Telecom Services 13,400 867,218.47 943,803.85 0.00 2.06% Total for Japan 5,341,138.20 6,295,402.76 0.00 13.73% Netherlands AKZO NOBEL NV Materials 25,194 1,539,327.51 1,652,307.88 0.00 3.60% REED ELSEVIER NV Media 107,826 1,566,681.80 1,590,024.80 0.00 3.47% POSTNL NV Transportation 109,908 967,429.18 422,823.39 0.00 0.92% Total for Netherlands 4,073,438.49 3,665,156.07 0.00 8.00% Singapore SEMBCORP MARINE LTD Capital Goods 142,000 574,394.87 534,752.35 0.00 1.17% SEMBCORP INDUSTRIES LTD Capital Goods 74,000 290,475.72 318,051.58 0.00 0.69% SINGAPORE AIRLINES LTD Transportation 64,000 446,627.87 563,241.92 0.00 1.23% Total for Singapore 1,311,498.46 1,416,045.85 0.00 3.09%
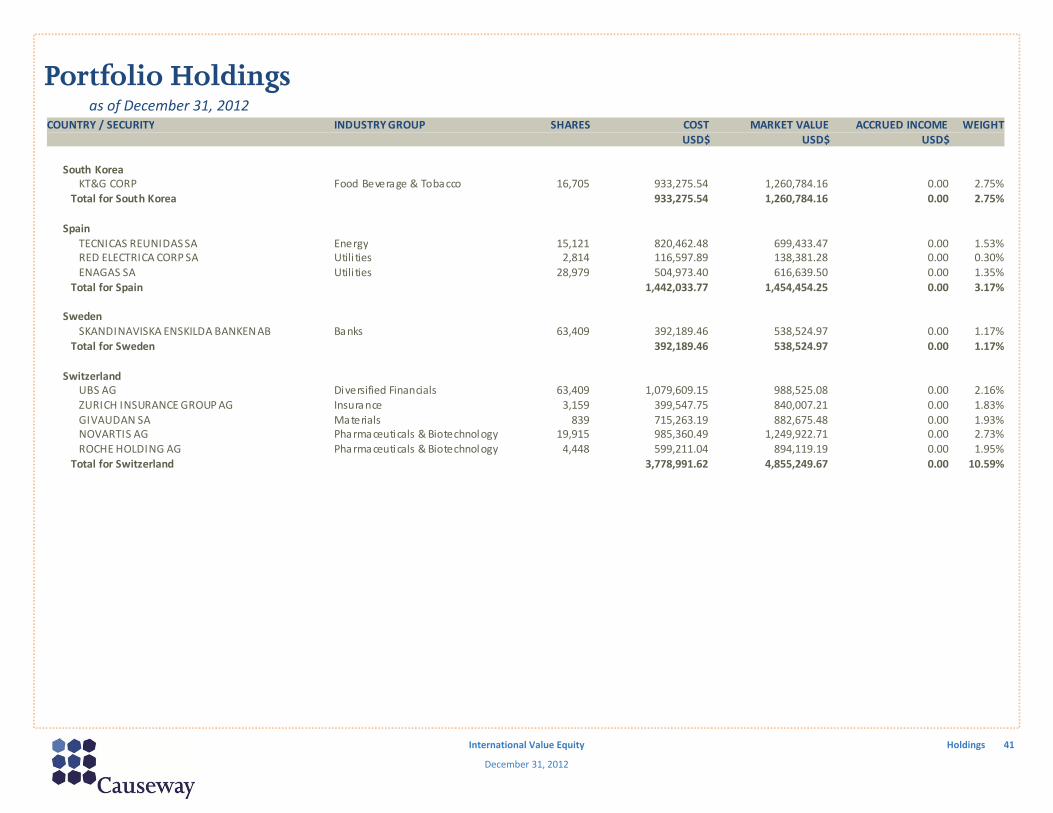
Portfolio Holdings
International Value Equity
December 31, 2012
Holdings 41
as of December 31, 2012COUNTRY / SECURITY INDUSTRY GROUP SHARES COST MARKET VALUE ACCRUED INCOME WEIGHT USD$ USD$ USD$ South Korea KT&G CORP Food Beverage & Tobacco 16,705 933,275.54 1,260,784.16 0.00 2.75% Total for South Korea 933,275.54 1,260,784.16 0.00 2.75% Spain TECNICAS REUNIDAS SA Energy 15,121 820,462.48 699,433.47 0.00 1.53% RED ELECTRICA CORP SA Utili ties 2,814 116,597.89 138,381.28 0.00 0.30% ENAGAS SA Utili ties 28,979 504,973.40 616,639.50 0.00 1.35% Total for Spain 1,442,033.77 1,454,454.25 0.00 3.17% Sweden SKANDINAVISKA ENSKILDA BANKEN AB Banks 63,409 392,189.46 538,524.97 0.00 1.17% Total for Sweden 392,189.46 538,524.97 0.00 1.17% Switzerland UBS AG Diversified Financials 63,409 1,079,609.15 988,525.08 0.00 2.16% ZURICH INSURANCE GROUP AG Insurance 3,159 399,547.75 840,007.21 0.00 1.83% GIVAUDAN SA Materials 839 715,263.19 882,675.48 0.00 1.93% NOVARTIS AG Pharmaceuticals & Biotechnology 19,915 985,360.49 1,249,922.71 0.00 2.73% ROCHE HOLDING AG Pharmaceuticals & Biotechnology 4,448 599,211.04 894,119.19 0.00 1.95% Total for Switzerland 3,778,991.62 4,855,249.67 0.00 10.59%
Portfolio Holdings
International Value Equity
December 31, 2012
Holdings 42
as of December 31, 2012COUNTRY / SECURITY INDUSTRY GROUP SHARES COST MARKET VALUE ACCRUED INCOME WEIGHT USD$ USD$ USD$ United Kingdom BARCLAYS PLC Banks 168,117 640,598.97 717,066.01 0.00 1.56% HSBC HOLDINGS PLC Banks 108,385 1,196,363.85 1,136,868.92 0.00 2.48% BALFOUR BEATTY PLC Capital Goods 140,904 680,892.30 626,876.22 0.00 1.37% ROLLS‐ROYCE HOLDINGS PLC Capital Goods 58,814 424,899.13 835,078.49 0.00 1.82% MICHAEL PAGE INTERNATIONAL PLC Commercial & Professional Services 59,767 209,635.61 383,744.55 0.00 0.84% BG GROUP PLC Energy 40,857 803,793.30 672,427.06 0.00 1.47% PETROFAC LTD Energy 32,953 791,749.41 869,354.99 0.00 1.90% TESCO PLC Food & Staples Retailing 211,819 1,179,213.34 1,156,878.80 0.00 2.52% BRITISH AMERICAN TOBACCO PLC Food Beverage & Tobacco 23,802 683,109.88 1,207,510.44 0.00 2.63% AVIVA PLC Insurance 125,601 1,021,187.22 761,527.52 0.00 1.66% RIO TINTO PLC Materials 13,055 536,182.27 745,166.34 0.00 1.63% VODAFONE GROUP PLC Telecom Services 281,684 698,815.11 707,186.18 13,323.26 1.57% Total for United Kingdom 8,866,440.39 9,819,685.52 13,323.26 21.45% Total for Equity 39,697,056.63 45,104,239.58 13,323.26 98.43% Forward Euro Forward USD/EUR FWD 20130219 SSB USD Forward 857,422 857,421.57 857,421.57 0.00 1.87% EUR/USD FWD 20130219 SSB USD Forward ‐671,500 ‐857,421.57 ‐885,529.54 0.00 ‐1.93% Total for EUR/USD FWD 20130219 SSB USD Forward 0.00 ‐28,107.97 0.00 ‐0.06% Total for Euro Forward 0.00 ‐28,107.97 0.00 ‐0.06% Total for Forward 0.00 ‐28,107.97 0.00 ‐0.06%
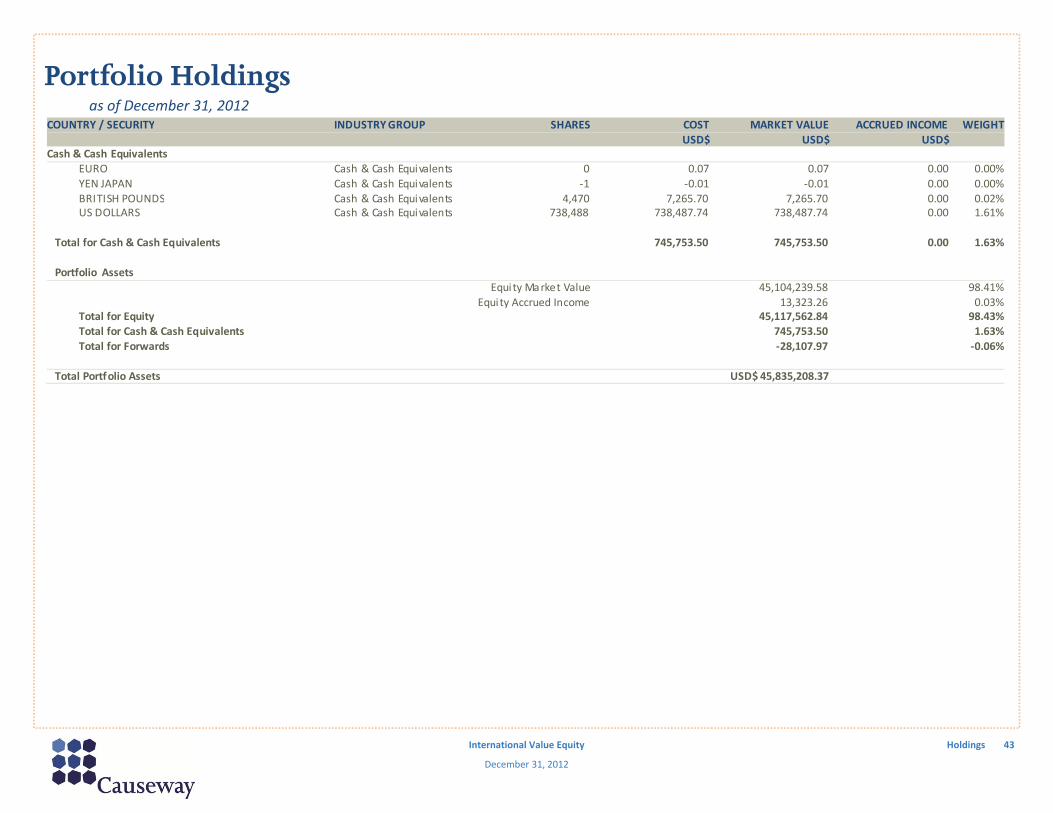
Portfolio Holdings
International Value Equity
December 31, 2012
Holdings 43
as of December 31, 2012COUNTRY / SECURITY INDUSTRY GROUP SHARES COST MARKET VALUE ACCRUED INCOME WEIGHT USD$ USD$ USD$Cash & Cash Equivalents EURO Cash & Cash Equivalents 0 0.07 0.07 0.00 0.00% YEN JAPAN Cash & Cash Equivalents ‐1 ‐0.01 ‐0.01 0.00 0.00% BRITISH POUNDS Cash & Cash Equivalents 4,470 7,265.70 7,265.70 0.00 0.02% US DOLLARS Cash & Cash Equivalents 738,488 738,487.74 738,487.74 0.00 1.61% Total for Cash & Cash Equivalents 745,753.50 745,753.50 0.00 1.63% Portfolio Assets Equity Market Value 45,104,239.58 98.41% Equity Accrued Income 13,323.26 0.03% Total for Equity 45,117,562.84 98.43% Total for Cash & Cash Equivalents 745,753.50 1.63% Total for Forwards ‐28,107.97 ‐0.06% Total Portfolio Assets USD$ 45,835,208.37
CAUSEWAY CAPITAL MANAGEMENT LLCINTERNATIONAL VALUE EQUITYSCHEDULE OF INVESTMENT PERFORMANCE RESULTSFOR THE PERIOD FROM JUNE 11, 2001 (Inception) THROUGH DECEMBER 31, 2012COMPOSITE INCEPTION DATE: June 2001 COMPOSITE CREATION DATE: June 2001
N/M – Not considered meaningful for 5 portfolios or less for the full year.a‐ Not covered by the report of independent accountants.b‐ Partial period shown (June 11, 2001 – December 31, 2001).* In January 2011, the Firm assets were revised to include non‐discretionary accounts managed by Causeway. The previously stated AUM (in millions) was $14,813 in 2005, $18,191, in 2006, $17,263 in 2007, $8,407 in 2008, $9,783 in 2009 and $11,690 in 2010.
Year
Gross‐of‐Fees Return (%)
Net‐of‐Fees Return (%)
Benchmark Return (%)a
Number of Portfolios in Composite at End of Period
Causeway Capital Management LLC (“Causeway”) claims compliance with the Global Investment Performance Standards (GIPS®) and has prepared and presented this report in compliance with the GIPS standards. Causeway has been independently verified for the periods June 11, 2001 through December 31, 2011.
Verification assesses whether (1) the firm has complied with all the composite construction requirements of the GIPS standards on a firm‐wide basis and (2) the firm’s policies and procedures are designed to calculate and present performance in compliance with the GIPS standards. The International Value Equity Composite (“International Composite”) has been examined for the periods June 11, 2001 through December 31, 2011. The verification and performance examination reports are available upon request.
The Firm, Causeway, is organized as a Delaware limited liability company and began operations in June 2001. It is registered as an investment adviser with the U.S. Securities and Exchange Commission under the Investment Advisers Act of 1940. Causeway manages international, global, and emerging markets equity assets for corporations, pension plans, public retirement plans, Taft‐Hartley pension plans, endowments and foundations, mutual funds, charities, private trusts and funds, wrap fee programs, and other institutions. The Firm includes all discretionary and non‐discretionary accounts managed by Causeway.
The International Composite includes all U.S. dollar denominated, discretionary accounts in the international value equity strategy which do not apply a minimum market capitalization requirement of $2.5 billion or higher ($5 billion or higher prior to November 2008), permit investments in South Korean companies after October 2003, do not regularly experience daily external cash flows, and are not constrained by socially responsible investment restrictions. The international value equity strategy seeks long‐term growth of capital and income through investment primarily in equity securities of companies in developed countries located outside the U.S. New accounts are included in the International Composite after the first full month under management, except as noted below. Terminated accounts are included in the International Composite through the last full month under management. From June 2001 through November 2001, the International Composite included a non‐fee‐paying account with total assets of approximately $2 million. This was the sole account in the International Composite from June through September 2001. The account was included in the International Composite at account inception because it was fully invested at inception. A complete list and description of Firm composites is available upon request.
Account returns are calculated daily. Monthly account returns are calculated by geometrically linking the daily returns. The return of the International Composite is calculated monthly by weighting monthly account returns by the beginning market values. Valuations and returns are computed and stated in U.S. dollars. Returns include the reinvestment of interest, dividends and any capital gains. Returns are calculated gross of withholding taxes on dividends, interest income, and capital gains. The Firm’s policies for valuing portfolios, calculating performance, and preparing compliant presentations are available upon request. Past performance is no guarantee of future performance. Composite dispersion, if applicable, is calculated using the equal‐weighted standard deviation of all portfolios that were included in the International Composite for the entire year. The three‐year annualized ex‐post standard deviation quantifies the variability of the composite or benchmark returns over the preceding 36‐month period.
The Morgan Stanley Capital International Europe, Australasia, Far East (“MSCI EAFE”) Index benchmark is an arithmetical average weighted by market value of the performance of approximately 1,000 non‐U.S. companies representing 22 stock markets in Europe, Australasia, New Zealand and the Far East. The Index is gross of withholding taxes, assumes reinvestment of dividends and capital gains, and assumes no management, custody, transaction or other expenses. Accounts in the International Composite may invest in countries not included in the MSCI EAFE Index.
Gross‐of‐fees returns are presented before management, performance and custody fees but after trading expenses. Net‐of‐fees returns are presented after the deduction of actual management fees, performance‐based fees, and all trading expenses, but before custody fees. For bundled fee portfolios, net‐of‐fees returns are presented after the deduction of actual management fees, all trading expenses, custody fees, and fund accounting fees. Causeway’s basic management fee schedules are described in its Firm brochure pursuant to Part 2 of Form ADV. The basic separate account annual fee schedule for international value equity assets under management is: 0.75% of the first $10 million; 0.65% of the next $40 million; 0.50% of the next $50 million; and 0.45% thereafter. Accounts in the International Composite may have different fee schedules or pay performance‐based fees or bundled fees. Bundled fees include management, custody, and fund accounting fees.
MSCI has not approved, reviewed or produced this report, makes no express or implied warranties or representations and is not liable whatsoever for any data in the report. You may not redistribute the MSCI data or use it as a basis for other indices or investment products.
Biographies
International Value Equity
December 31, 2012
Appendix 46
MSCI has not approved, reviewed or produced this report, makes no express or implied warranties or representations and is not liable whatsoever for any data in the report. You may not redistribute the MSCI data or use it as a basis for other indices or investment products.
ERIC P. CRABTREE Chief Client Service Officer Current Position Mr. Crabtree i s the chief cl ient service officer of Causeway. He joined the fi rm in May 2004. Prior Experience From March of 2000 to Apri l 2004, Mr. Crabtree was a senior vice pres ident with Roxbury Capi ta l Management where he was respons ible for cl ient service andbus iness development for the fi rm’s western United States insti tutional and high net worth cl ients and their advisers . From 1995 to December 1999, Mr. Crabtreewas a principa l and chief operating officer of Finacorp Securi ties where he was respons ible for marketing high qual i ty fixed income securi ties . His addi tionalrespons ibi l i ties included tra ining, compl iance and cl ient service. Mr. Crabtree began his career in the financia l services industry in Apri l 1993 as a financia lconsul tant at Merri l l Lynch. Education Mr. Crabtree has a BA in Engl i sh Li terature from Bucknel l Univers i ty and an MBA from the Marsha l l School of Bus iness at the Univers i ty of Southern Ca l i fornia .
HARRY W. HARTFORD President, Portfolio Manager Current Position Mr. Hartford i s the pres ident and a fundamental portfol io manager of Causeway s ince June 2001. Prior Experience From 1996 to June 2001, Mr. Hartford was a managing director for the Hotchkis and Wi ley divis ion of MLIM ("HW‐MLIM") and co‐head of the fi rm's HW‐MLIMInternational and Global Value team. Mr. Hartford and the HW‐MLIM international team were respons ible for approximately $3.4 bi l l ion in international andglobal assets under management, including the $1.1 bi l l ion Mercury HW International Va lue Fund. From 1994 to 1996, Mr. Hartford was a portfol io manager forHotchkis and Wi ley. From 1984 to 1994, Mr. Hartford was with The Investment Bank of Ireland, where he ga ined ten years experience in both international andglobal equi ty management. At IBI, he managed the Bank's U.S. asset base of $1.5 bi l l ion invested primari ly in internationa l equi ties . During this time, Mr. Hartforda lso managed the Iri sh Investment Fund, a closed‐end country fund quoted on the NYSE. Prior to that, he was respons ible for the management of a range ofinternational uni t trusts and globa l funds regis tered in the U.K. and the Is le of Man. Before entering the investment bus iness , Mr. Hartford lectured in micro andmacro Economics at Oklahoma State Univers i ty.
Education Mr. Hartford has a BA, with honors , in Economics from the Univers i ty of Dubl in, Trini ty Col lege, an MSc in Economics from Oklahoma State Univers i ty, and is a PhiKappa Phi member.
Quarterly Investment Review
Tucson Supplemental Retirement System | Fourth Quarter 2012
1 Executive Summary 1
2 Total Plan 16
3 U.S. Equity 21
4 International Equity 49
5 Fixed Income 64
6 Real Estate 73
7 Infrastructure 81
8 Capital Market Environment 84
9 After Fees Performance Summary 97
10 Custom Index Composition 100
11 Manager InBriefs 102
Executive Summary
1
Market Highlights
FourthQuarter
Year‐to‐Date 1‐Year 3‐Year1 5‐Year1 10‐Year1
EquityMSCI All Country World IMI 2.99% 16.38% 16.38% 7.02% ‐0.73% 8.60%MSCI All Country World 2.88% 16.13% 16.13% 6.63% ‐1.16% 8.11%Dow Jones U.S. Total Stock Market 0.18% 16.38% 16.38% 11.40% 2.21% 7.95%Russell 3000 0.25% 16.42% 16.42% 11.20% 2.04% 7.68%S&P 500 ‐0.38% 16.00% 16.00% 10.87% 1.66% 7.10%Russell 2000 1.85% 16.35% 16.35% 12.25% 3.56% 9.72%MSCI All Country World ex‐U.S. IMI 5.74% 17.04% 17.04% 4.18% ‐2.59% 10.16%MSCI All Country World ex‐U.S. 5.85% 16.83% 16.83% 3.87% ‐2.89% 9.74%MSCI EAFE 6.57% 17.32% 17.32% 3.56% ‐3.69% 8.21%MSCI EAFE (100% Hedged) 7.03% 13.79% 13.79% ‐0.08% ‐6.67% 3.19%MSCI EAFE (Local Currency) 7.52% 17.31% 17.31% 2.60% ‐4.25% 5.43%MSCI Emerging Markets 5.58% 18.22% 18.22% 4.66% ‐0.91% 16.52%Fixed IncomeBarclays Global Aggregate ‐0.48% 4.31% 4.31% 5.16% 5.44% 5.98%Barclays Aggregate 0.22% 4.23% 4.23% 6.21% 5.96% 5.19%Barclays Long Gov't ‐0.70% 3.78% 3.78% 13.62% 9.58% 7.64%Barclays Long Credit 1.30% 12.79% 12.79% 13.50% 10.41% 8.23%Barclays Long Gov't/Credit 0.45% 8.77% 8.77% 13.65% 10.16% 7.96%Barclays High Yield 3.29% 15.81% 15.81% 11.86% 10.33% 10.62%SSB Non‐U.S. WGBI ‐2.36% 1.51% 1.51% 3.95% 5.24% 6.38%JP Morgan EMBI Global (Emerging Markets) 3.33% 18.54% 18.54% 12.94% 10.47% 11.56%CommoditiesDow Jones‐UBS Commodity ‐6.33% ‐1.06% ‐1.06% 0.07% ‐5.17% 4.09%Goldman Sachs Commodity ‐3.28% 0.08% 0.08% 2.54% ‐8.12% 2.75%Hedge FundsHFRI Fund‐Weighted Composite2 1.27% 6.16% 6.16% 3.50% 1.50% 6.66%HFRI Fund of Funds2 1.77% 5.25% 5.25% 1.60% ‐1.67% 3.67%Real EstateNAREIT U.S. Equity REITS 2.58% 18.06% 18.06% 17.83% 5.45% 11.63%NCREIF ODCE3 2.06% 9.77% 9.77% 13.30% ‐2.00% 5.72%Private EquityThomson Reuters VentureXpert4 ‐0.07% 5.28% 4.57% 15.18% 4.46% 11.44%InfrastructureMacquarie Global Infrastructure ‐ North America ‐1.33% 4.13% 4.13% 11.72% 2.82% 11.96%
MSCI Indices and NCREIF ODCE show net retuns. MSCI EAFE (100% Hedged) shows price return; all other indices show total returns.1 Periods are annualized.2 Latest 5 months of HFR data are estimated by HFR and may change in the future.3 Fourth quarter return is preliminary.4 Benchmark is as of 06/30/2012.
Periods Ending 12/31/2012Returns of the Major Capital Markets
0.25%
6.57%5.58%
0.22%
‐0.70%
1.30%
16.42%17.32%
18.22%
4.23% 3.78%
12.79%
‐5%
0%
5%
10%
15%
20%
Russell 3000 MSCI EAFE MSCI EmergingMarkets
BarclaysAggregate
Barclays LongGov't
Barclays LongCredit
SHORT TERM RETURNSAS OF 12/31/2012
Fourth Quarter 2012One‐Year
Source: Russell, MSCI, Barclays
2.04%
‐3.69%
‐0.91%
5.96%
9.58%10.41%
7.68% 8.21%
16.52%
5.19%
7.64% 8.23%
‐5%
0%
5%
10%
15%
20%
Russell 3000 MSCI EAFE MSCI EmergingMarkets
BarclaysAggregate
Barclays LongGov't
Barclays LongCredit
LONG TERM ANNUALIZED RETURNSAS OF 12/31/2012
Five‐Year
Ten‐Year
Source: Russell, MSCI, Barclays
2
Return Summary
Quarterly Excess Performance - 5 Years Ratio of Cumulative Wealth - 5 Years
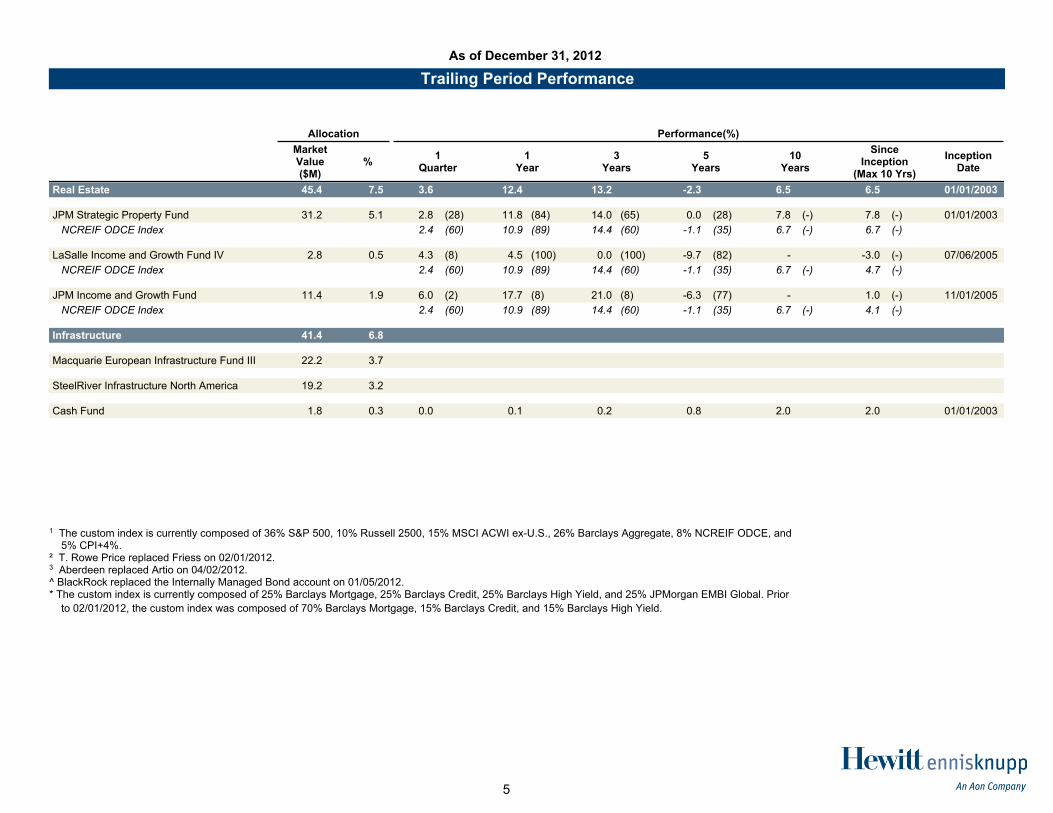
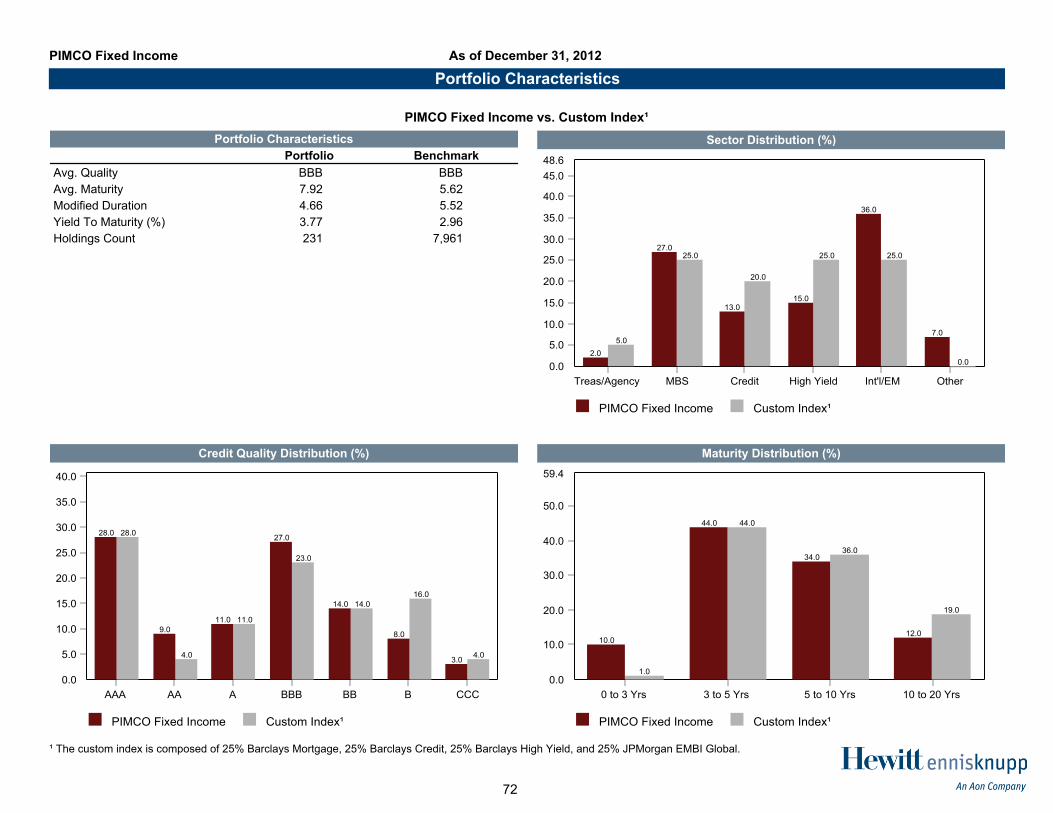
¹ The custom index is currently composed of 36% S&P 500, 10% Russell 2500, 15% MSCI ACWI ex-U.S., 26% Barclays Aggregate, 8% NCREIF ODCE,and 5% CPI+4%. See appendix for prior composition.
S&P 500 Index -0.4 (60) 16.0 (48) 10.9 (48) 1.7 (65) 7.1 (83) 3.8 (72)IM U.S. Large Cap Core Equity (SA+CF) Median 0.0 15.8 10.7 2.2 8.0 4.3
BlackRock Russell 1000 Value Index 61.3 10.1 1.5 (44) 17.6 (29) 11.0 (39) 0.8 (72) 7.5 (70) 7.5 (70) 01/01/2003
Russell 1000 Value Index 1.5 (44) 17.5 (30) 10.9 (41) 0.6 (74) 7.4 (73) 7.4 (73)IM U.S. Large Cap Value Equity (SA+CF) Median 1.3 15.9 10.4 1.7 8.2 8.2
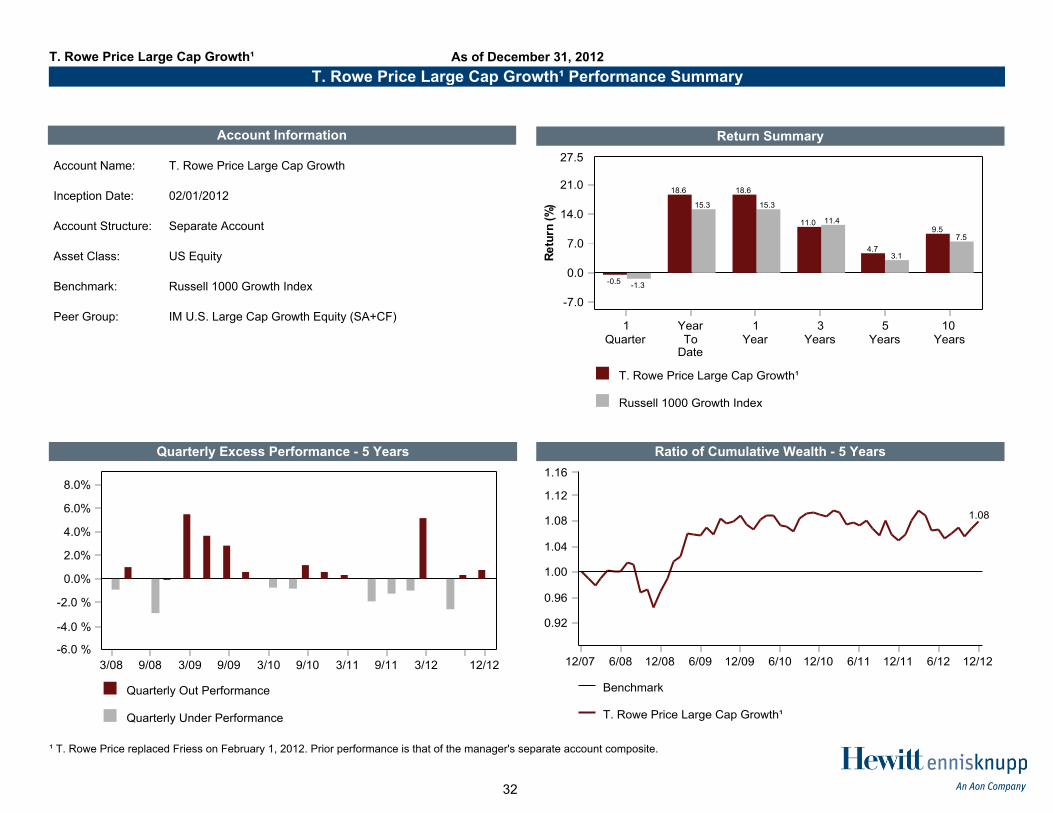
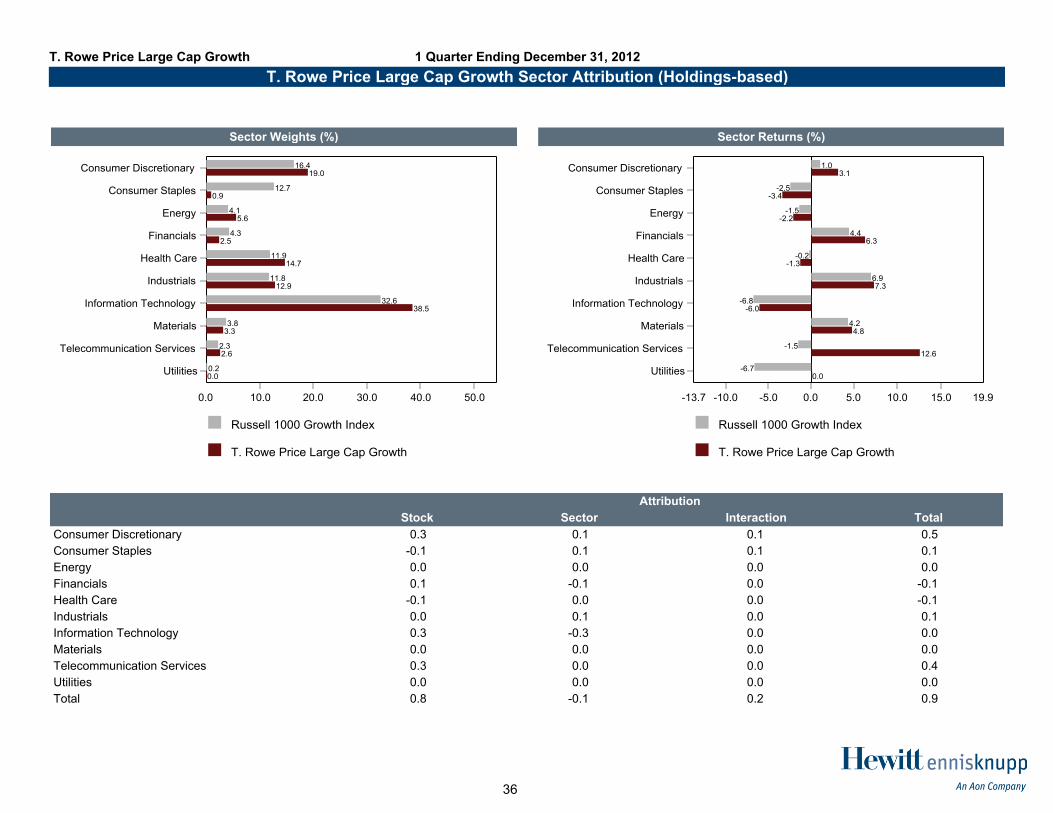
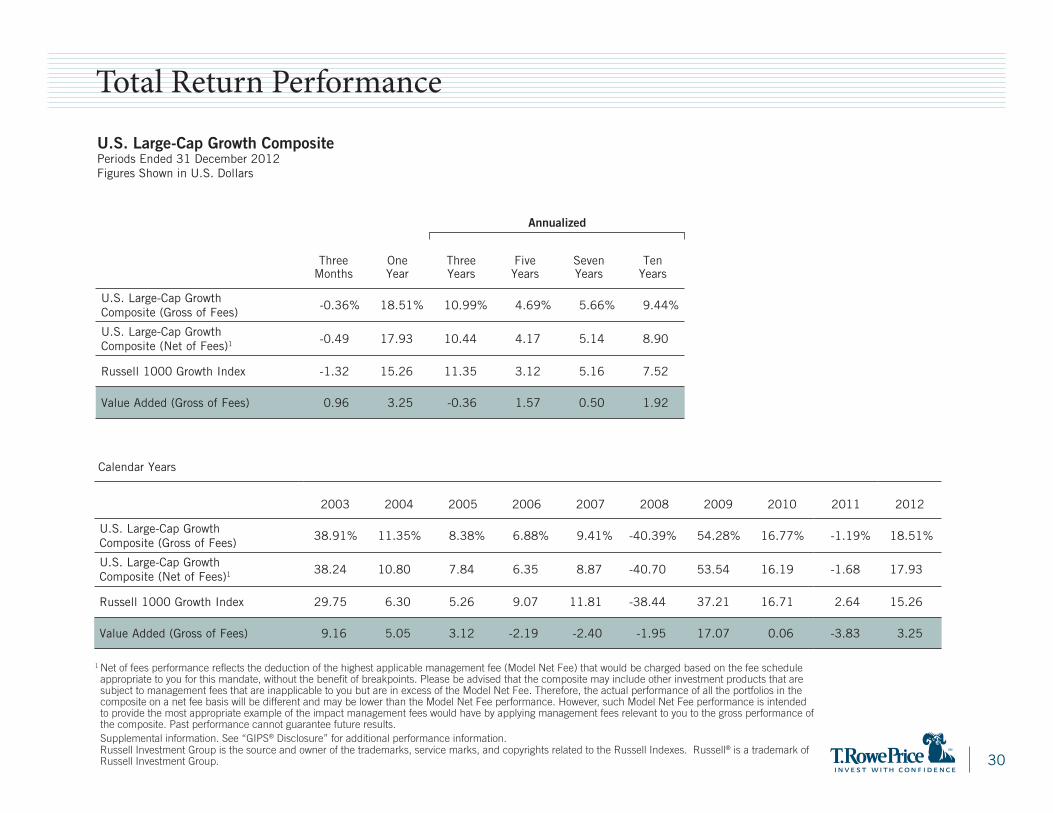
T. Rowe Price Large Cap Growth² 58.3 9.6 -0.5 (46) 18.6 (22) 11.0 (42) 4.7 (16) 9.5 (19) 10.9 (29) 02/01/2012
Russell 1000 Growth Index -1.3 (68) 15.3 (53) 11.4 (39) 3.1 (36) 7.5 (62) 8.8 (49)IM U.S. Large Cap Growth Equity (SA+CF) Median -0.6 15.6 10.6 2.5 8.0 8.7
Small/Mid Cap U.S. Equity 61.1 10.1 2.6 18.2 14.9 5.2 10.8 10.8 01/01/2003
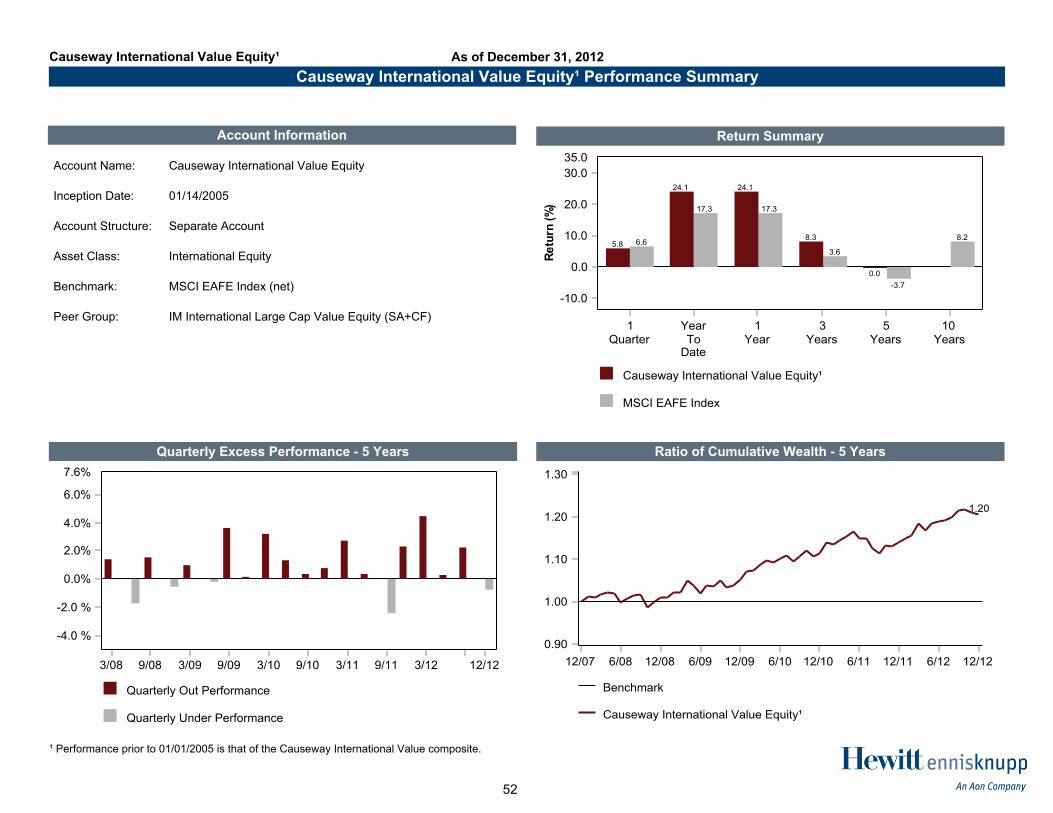
Causeway International Value Equity 45.9 7.6 5.8 (65) 24.1 (10) 8.3 (20) 0.0 (27) - 5.4 (45) 01/14/2005
MSCI EAFE Index 6.6 (41) 17.3 (53) 3.6 (71) -3.7 (84) 8.2 (90) 3.5 (86)IM International Large Cap Value Equity (SA+CF) Median 6.2 17.7 4.9 -1.7 10.0 5.2
1 The custom index is currently composed of 36% S&P 500, 10% Russell 2500, 15% MSCI ACWI ex-U.S., 26% Barclays Aggregate, 8% NCREIF ODCE, and5% CPI+4%.
² T. Rowe Price replaced Friess on 02/01/2012.3 Aberdeen replaced Artio on 04/02/2012.^ BlackRock replaced the Internally Managed Bond account on 01/05/2012.* The custom index is currently composed of 25% Barclays Mortgage, 25% Barclays Credit, 25% Barclays High Yield, and 25% JPMorgan EMBI Global. Prior
to 02/01/2012, the custom index was composed of 70% Barclays Mortgage, 15% Barclays Credit, and 15% Barclays High Yield.
MSCI AC World ex U.S. Index 40.8 (20) 20.9 (22) 16.6 (58) 26.7 (39) 16.7 (55) -45.5 (60) 41.4 (33) 11.2 (67) -13.7 (66) 16.8 (77)IM International Large Cap Growth Equity (SA+CF) Median 35.3 18.4 17.5 25.5 17.5 -44.4 35.9 13.2 -11.6 19.7
NCREIF ODCE Index 9.3 (70) 13.1 (54) 21.4 (35) 16.3 (63) 16.0 (53) -10.0 (48) -29.8 (51) 16.4 (50) 16.0 (42) 10.9 (89)IM U.S. Open End Private Real Estate (SA+CF) Median 10.1 13.7 20.7 17.1 16.4 -11.0 -29.8 16.3 15.7 12.7
LaSalle Income and Growth Fund IV - - - 21.7 (12) 8.6 (87) -17.7 (80) -27.2 (38) 0.4 (100) -4.7 (100) 4.5 (100)
NCREIF ODCE Index 9.3 (70) 13.1 (54) 21.4 (35) 16.3 (63) 16.0 (53) -10.0 (48) -29.8 (51) 16.4 (50) 16.0 (42) 10.9 (89)IM U.S. Open End Private Real Estate (SA+CF) Median 10.1 13.7 20.7 17.1 16.4 -11.0 -29.8 16.3 15.7 12.7
JPM Income and Growth Fund - - - 20.9 (15) 18.1 (30) -27.1 (88) -44.1 (85) 17.1 (35) 28.5 (5) 17.7 (8)
NCREIF ODCE Index 9.3 (70) 13.1 (54) 21.4 (35) 16.3 (63) 16.0 (53) -10.0 (48) -29.8 (51) 16.4 (50) 16.0 (42) 10.9 (89)IM U.S. Open End Private Real Estate (SA+CF) Median 10.1 13.7 20.7 17.1 16.4 -11.0 -29.8 16.3 15.7 12.7
1 The custom index is currently composed of 36% S&P 500, 10% Russell 2500, 15% MSCI ACWI ex-U.S., 26% Barclays Aggregate, 8% NCREIF ODCE, and5% CPI+4%.
² T. Rowe Price replaced Friess on 02/01/2012.3 Aberdeen replaced Artio on 04/02/2012.^ BlackRock replaced the Internally Managed Bond account on 01/05/2012.* The custom index is currently composed of 25% Barclays Mortgage, 25% Barclays Credit, 25% Barclays High Yield, and 25% JPMorgan EMBI Global. Prior
to 02/01/2012, the custom index was composed of 70% Barclays Mortgage, 15% Barclays Credit, and 15% Barclays High Yield.
7
Commentary
§ The TSRS Plan returned 2.1% during the fourth quarter, which exceeded the performance of the custom index by 0.8% and placed it at the 24th percentile of the PARIS Public Funds <$1 B Universe. PIMCO StocksPLUS, T. Rowe Price, Pyramis, PIMCO Fixed Income, and all three real estate funds contributed positively to the plan’s quarterly performance while Champlain, Causeway, and Aberdeen detracted from relative performance. Over the last twelve months, the plan returned 16.0%, gross of fees, exceeding the custom index by 3.4% and placing it at the 3rd percentile of the universe.
§ The two equity index managers, Alliance and BlackRock, continued to track their respective benchmarks well.
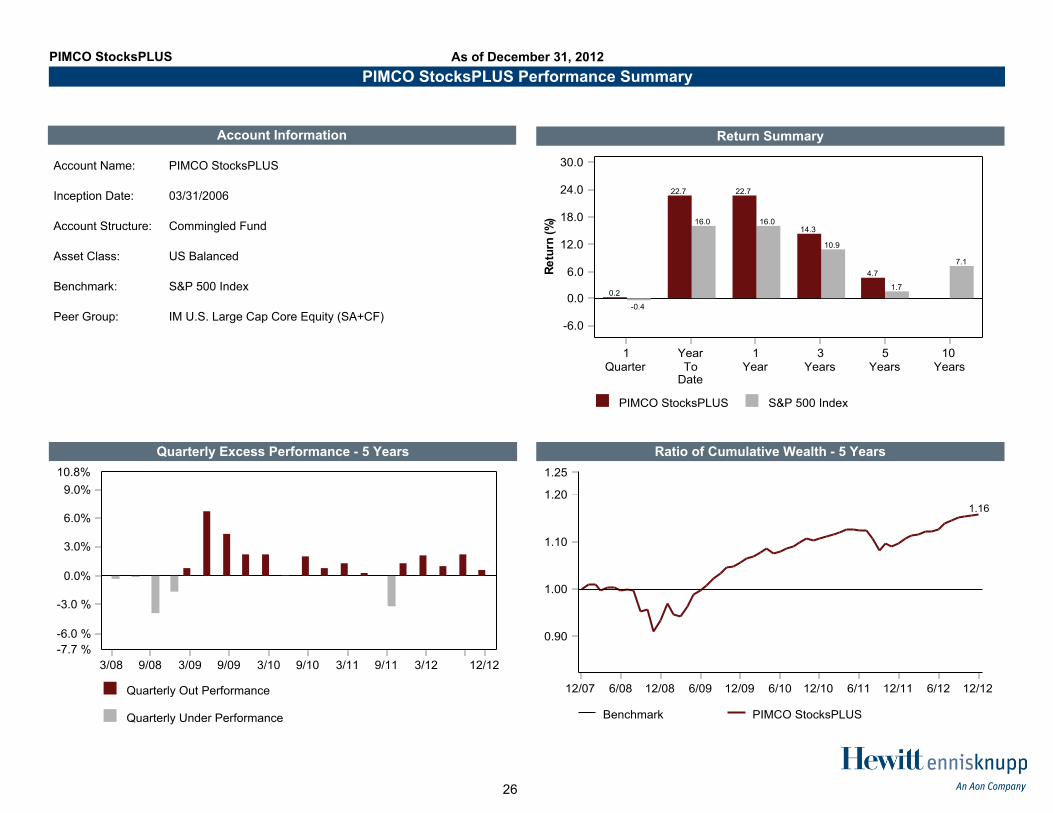
§ PIMCO StocksPLUS, an enhanced indexing product, outperformed its benchmark, the S&P 500 Index, by 0.6% (0.2% versus -0.4%, respectively) during the quarter. The allocation to fixed income helped performance, specifically exposure to bonds of financial firms, non-agency mortgage-backed securities, and currency strategies that benefit from a depreciating yen versus the U.S. dollar. Since its inception in the TSRS Plan almost seven years ago, the product has outperformed the S&P 500 Index by 2.2% on an annualized basis.
§ Large cap growth manager T. Rowe Price outperformed the Russell 1000 Growth Index by 0.8% (-0.5% versus -1.3%, respectively) during the quarter. The portfolio was helped by stock selection in the consumer discretionary, technology, and telecom sectors.
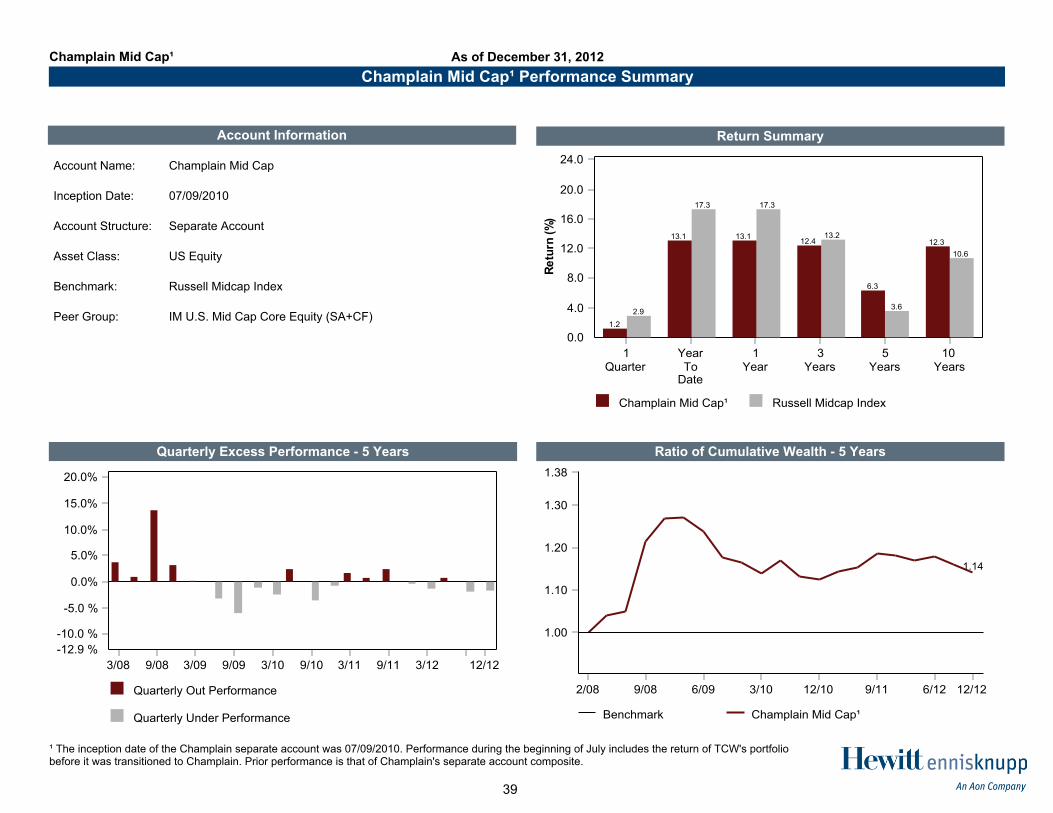
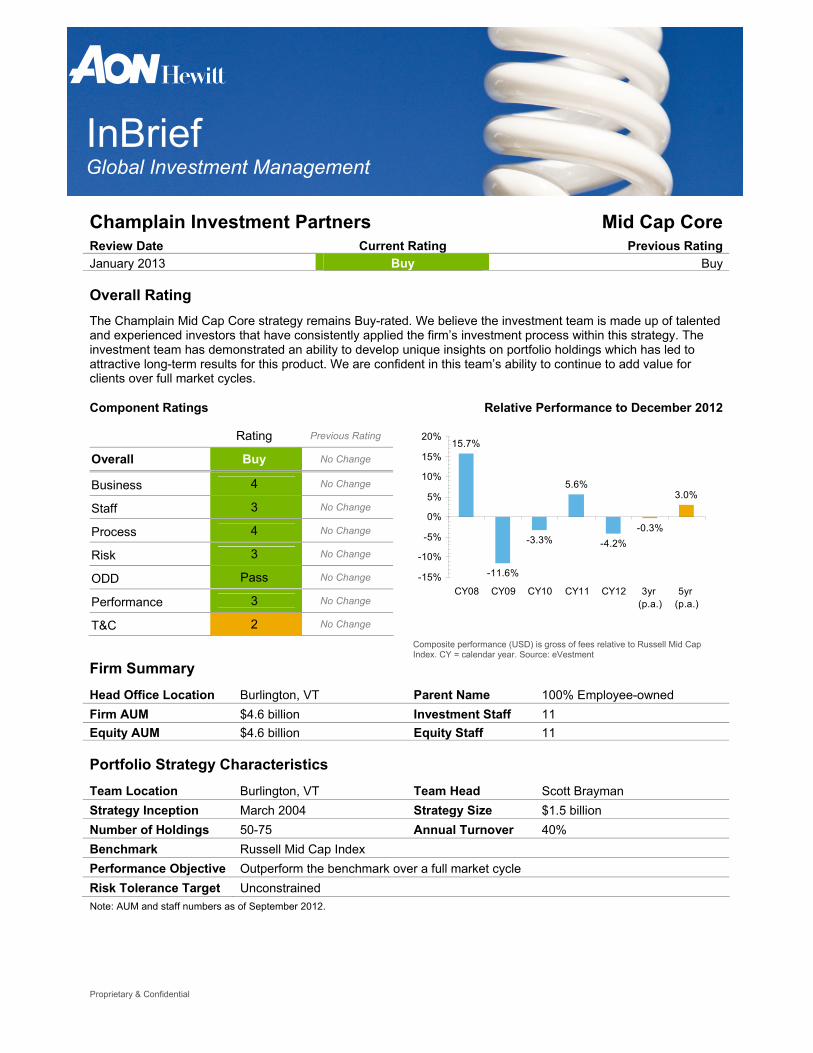
§ Mid cap manager Champlain underperformed the Russell Mid Cap Index by 1.7% (1.2% versus 2.9%, respectively) during the fourth quarter. Performance was hurt by stock selection in the consumer discretionary, energy, and materials sectors. Performance since inception into the TSRS Plan 2-1/2 years ago has lagged the benchmark by 1.2% (15.8% versus 17.0%) on an annualized basis.
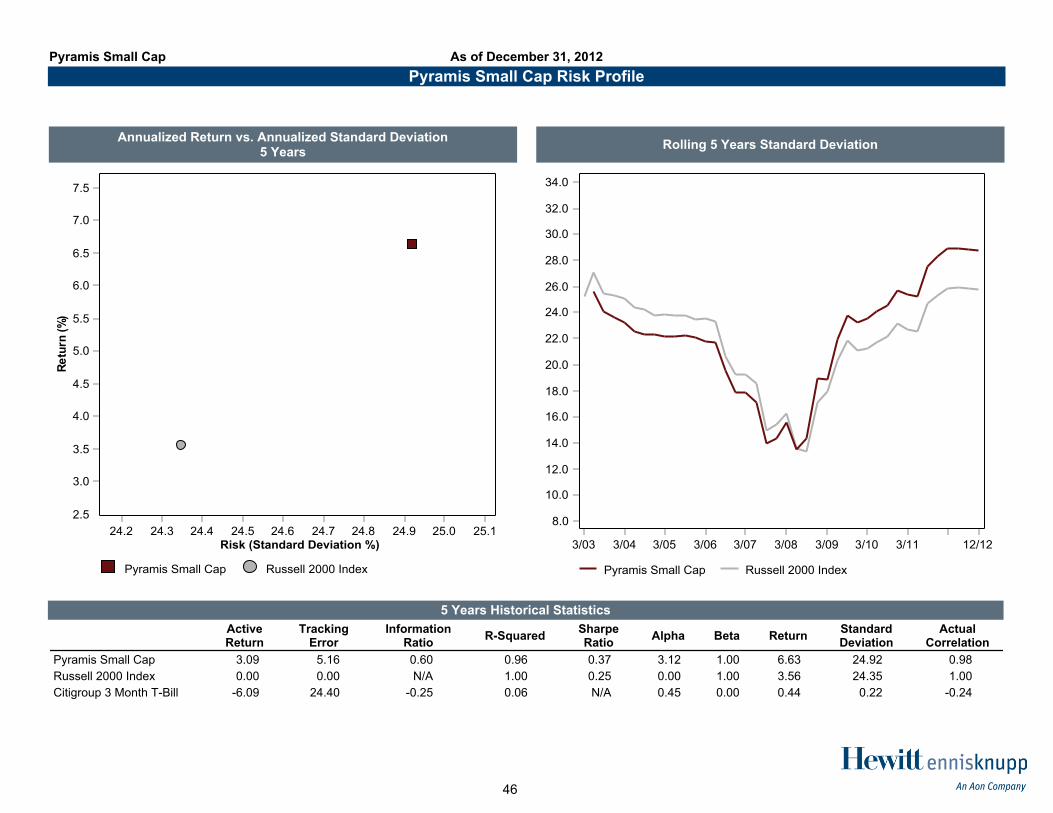
§ Small cap manager Pyramis exceeded the performance of the Russell 2000 Index by 2.0% (3.9% versus 1.9%, respectively) during the quarter. Strong stock selection in the health care, consumer discretionary, and consumer staples sectors contributed positively to relative performance. Over the last twelve months, Pyramis outperformed the benchmark by 7.2% (23.5% versus 16.3%) and ranks at the 4th
percentile of the peer group.
8
Commentary
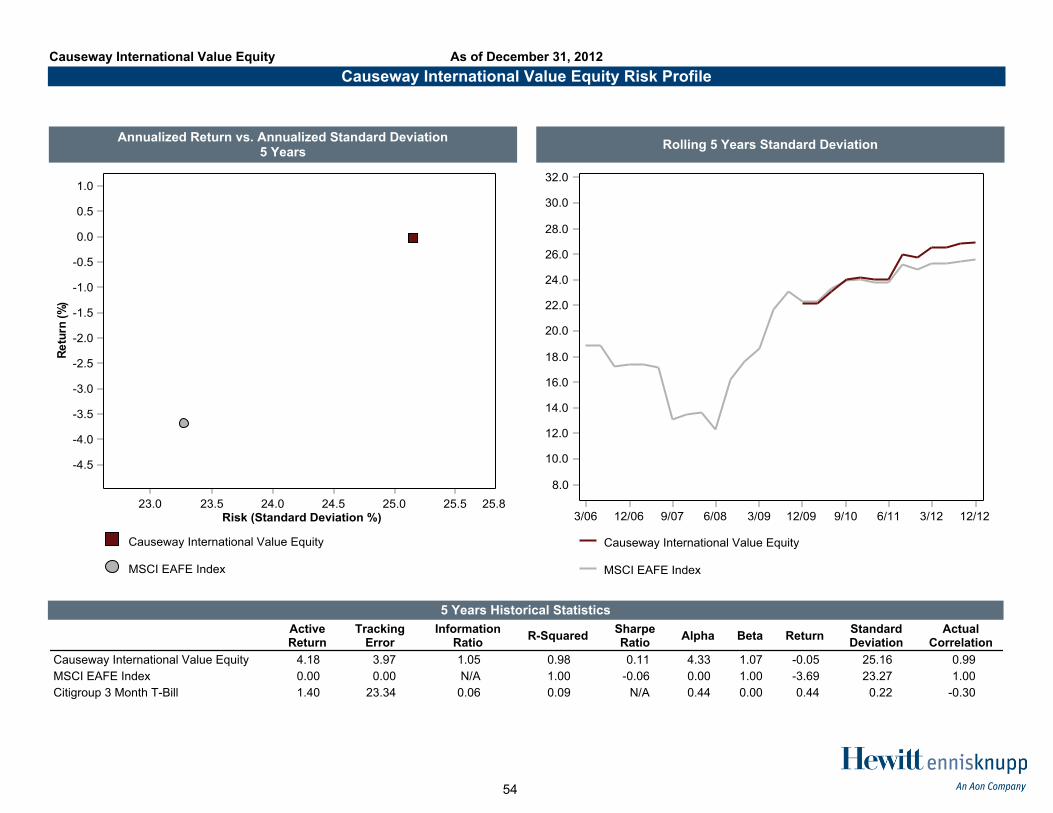
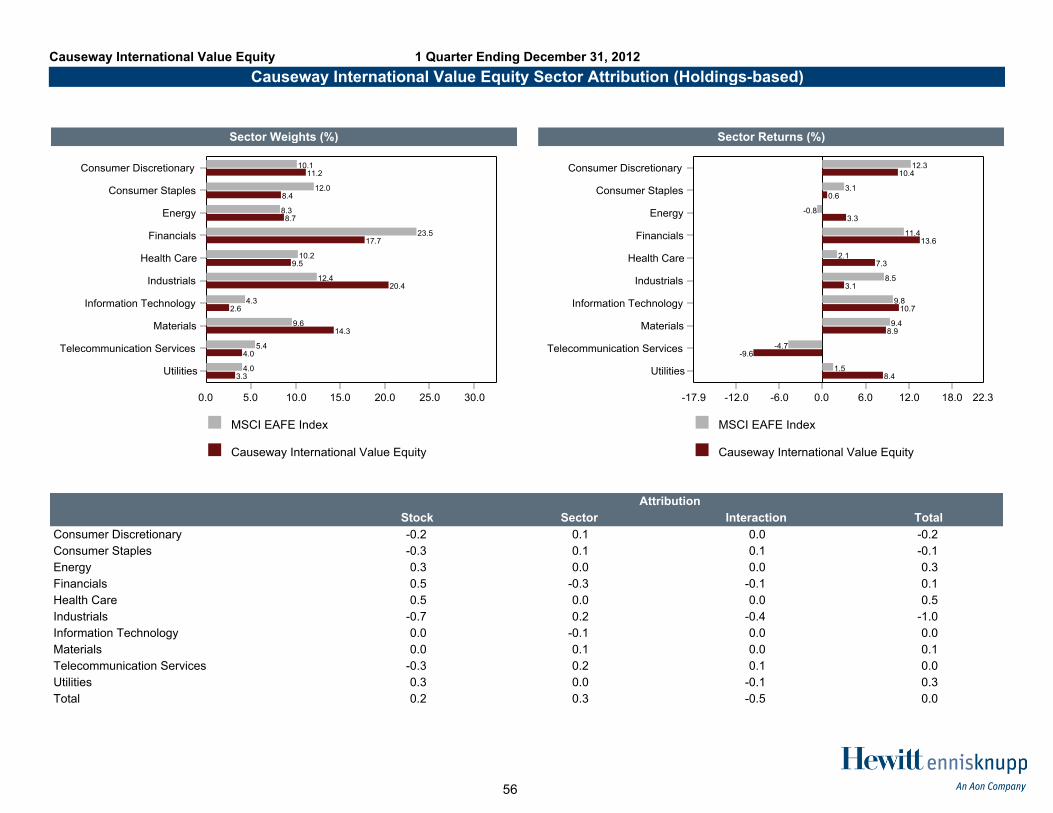
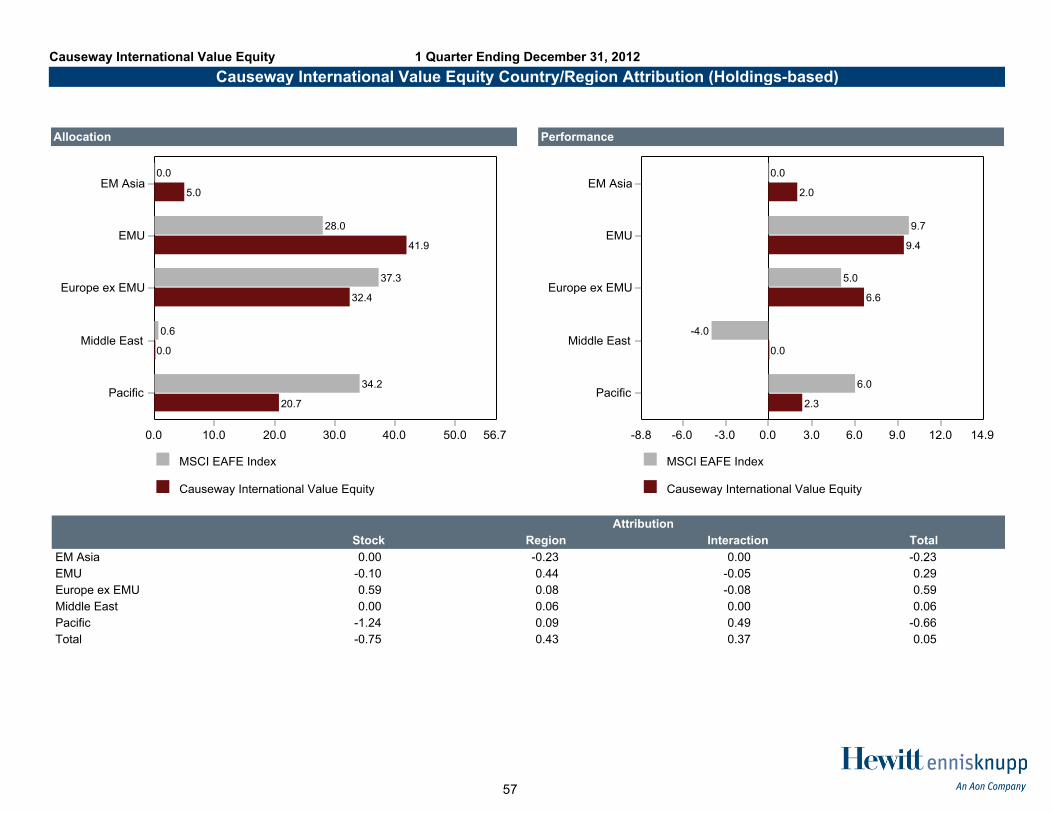
§ International value manager Causeway underperformed its benchmark, the MSCI EAFE Index, by 0.8% (5.8% versus 6.6%) during the fourth quarter. Strong stock selection in the industrials sector detracted from performance. On a country basis, stock selection in Japan, South Korea, and Singapore hurt performance. Over the last twelve months, Causeway has exceeded its benchmark by 6.8% (24.1% versus 17.3%, respectively).
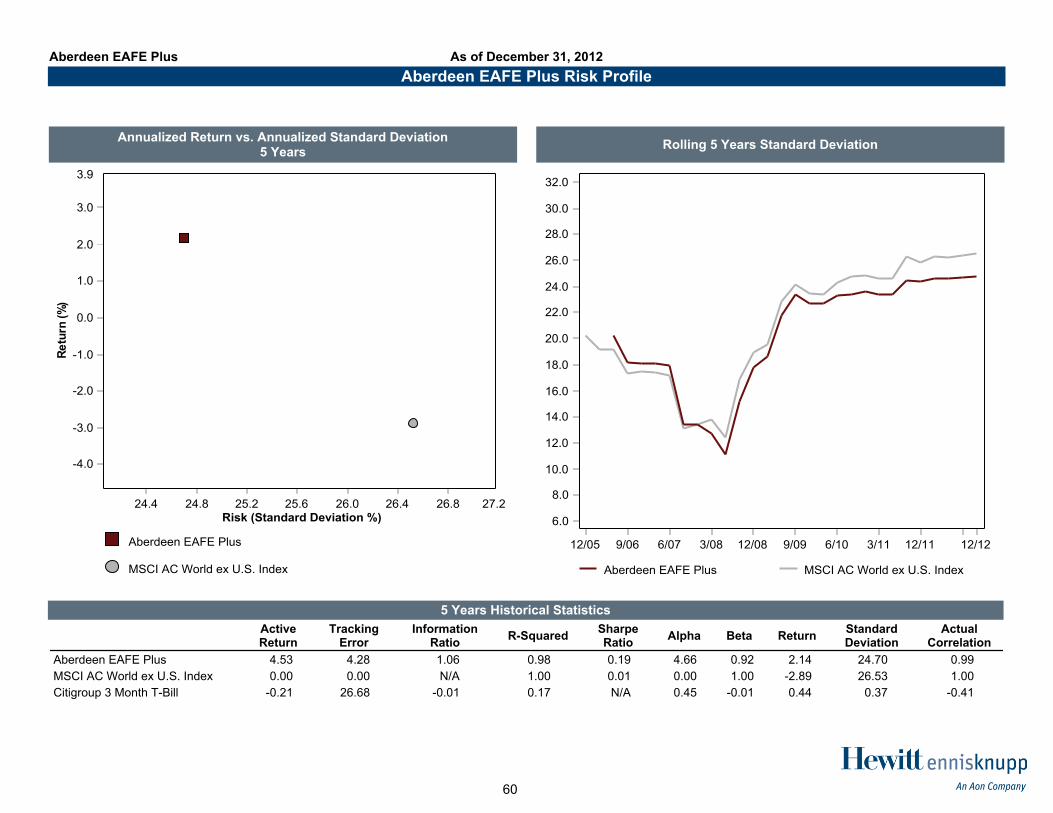
§ International growth manager Aberdeen returned 4.8% during the fourth quarter, which trailed the performance of its benchmark by 1.0%. Stock selection in the financials sector hurt relative performance. On a country basis, stock selection in Switzerland, France, and Australia detracted from returns.
§ BlackRock U.S. Debt Index returned 0.2% during the quarter, matching the performance of its benchmark.
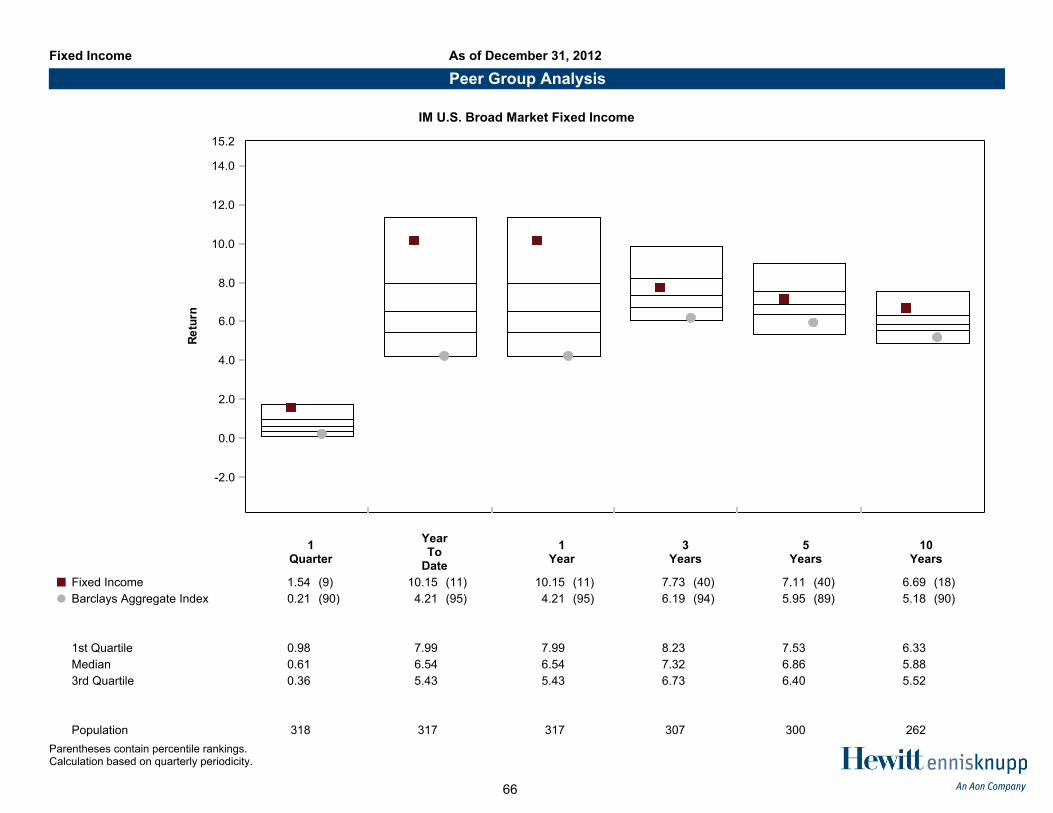
§ PIMCO’s fixed income portfolio returned 2.4% during the quarter, exceeding the performance of its custom index by 0.5%. An underweight to U.S. duration and exposure to non-agency mortgages and municipal bonds helped performance. For the trailing twelve months, the PIMCO portfolio outperformed its benchmark by 2.8% (13.4% versus 10.6%).
§ The Strategic Property real estate portfolio managed by J.P. Morgan outperformed the NCREIF ODCE index by 0.4% for the quarter (2.8%, versus 2.4%, respectively). For the trailing twelve months, the strategy exceeded the performance of its benchmark by 0.9%, returning 11.8% versus 10.9%, respectively.
§ The LaSalle Income and Growth IV real estate portfolio has begun the process of selling a number of properties as the late-2013 liquidation date approaches. The fund made a cash distribution of $0.7 M to TSRS in December.
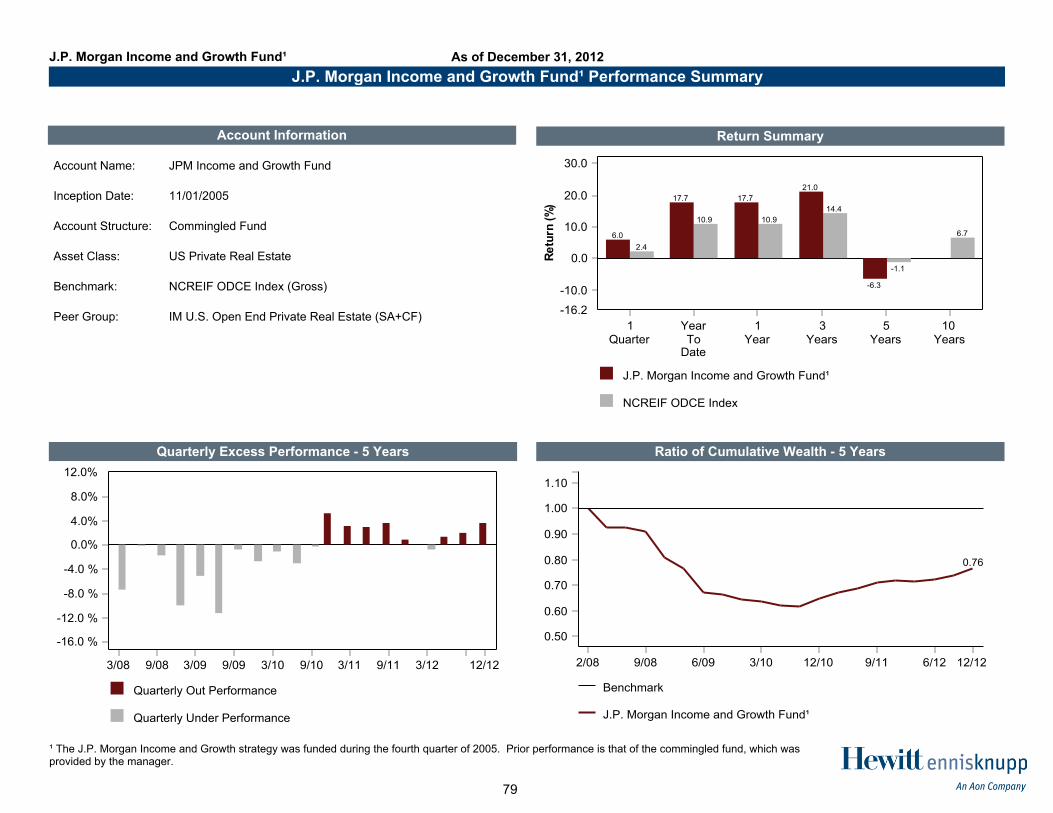
§ The J.P. Morgan Income and Growth real estate portfolio outperformed the NCREIF ODCE during the quarter, returning 6.0% versus 2.4%, respectively. Fund performance was comprised of appreciation of 4.6% and income of 1.4%. For the trailing twelve months, the strategy has outperformed the benchmark by 6.8% (17.7% versus 10.9%).
§ The SteelRiver North American infrastructure portfolio is too early in its investment cycle to have meaningful performance.
§ The Macquarie European infrastructure portfolio is too early in its investment cycle to have meaningful performance.
9
Investment Manager Evaluation
Quantitative Watch List Factors
§ 1 year performance (measured on a quarterly basis, before fees)
– Fixed Income and Real Estate Portfolios:
• Underperform benchmark by 2.0% and bottom 25% in peer group for two consecutive quarters
– Passively Managed Portfolios:
• Underperform benchmark by 0.5%
– Actively Managed Equity Portfolios:
• Underperform benchmark by 5.0% and bottom 25% in peer group for two consecutive quarters
§ 3 year performance (annualized, measured on rolling quarterly basis, before fees)
– Actively Managed Portfolios:
• Underperform benchmark and bottom 60% in peer group for two consecutive quarters
– Passively Managed Portfolios:
• Underperform benchmark by 0.3%
10
Investment Manager Evaluation
Qualitative Watch List Factors
§ A change in the portfolio manager assigned to TSRS;
§ The departure of one or more key investment professionals;
§ Violation of an investment guideline;
§ A change in the ownership or control of the investment management organization; or
§ Regulatory investigation (e.g., SEC, Attorney General, etc.), particularly an investigation involving senior members of the firm or product team.
11
Watch List Procedure
Any investment manager that is on watch list will be reviewed at subsequent Board meetings to determine why it is not meeting the stated benchmarks and if further action is warranted. An investment manager can be removed from watch list for one of three reasons:
§ The investment performance changes so that it meets or exceeds its investment benchmarks.
§ The Board understands why the investment manager is not meeting or exceeding its stated benchmark and is comfortable that the fund is still meeting the objectives for which it was chosen.
§ The qualitative watch list factor has been rectified or the Board understands and feels comfortable with the investment manager's action to address the violation.
§ The Board replaces the fund.
12
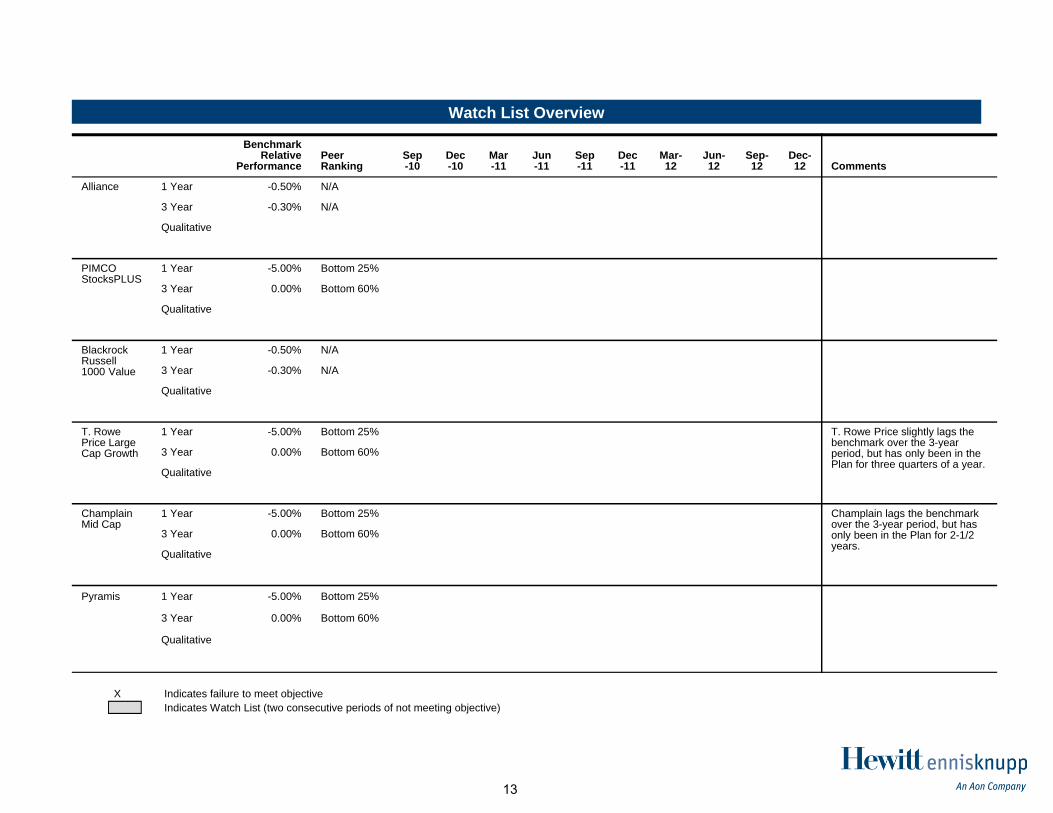
Watch List Overview
Benchmark Relative
PerformancePeer Ranking
Sep-10
Dec-10
Mar-11
Jun-11
Sep-11
Dec-11
Mar-12
Jun-12
Sep-12
Dec-12 Comments
Alliance 1 Year -0.50% N/A
3 Year -0.30% N/A
Qualitative
PIMCO StocksPLUS
1 Year -5.00% Bottom 25%
3 Year 0.00% Bottom 60%
Qualitative
Blackrock Russell 1000 Value
1 Year -0.50% N/A
3 Year -0.30% N/A
Qualitative
T. Rowe Price Large Cap Growth
1 Year -5.00% Bottom 25% T. Rowe Price slightly lags the benchmark over the 3-year period, but has only been in the Plan for three quarters of a year.
3 Year 0.00% Bottom 60%
Qualitative
Champlain Mid Cap
1 Year -5.00% Bottom 25% Champlain lags the benchmark over the 3-year period, but has only been in the Plan for 2-1/2 years.
3 Year 0.00% Bottom 60%
Qualitative
Pyramis 1 Year -5.00% Bottom 25%
3 Year 0.00% Bottom 60%
Qualitative
X Indicates failure to meet objective
Indicates Watch List (two consecutive periods of not meeting objective)
13
Watch List Overview
X Indicates failure to meet objective
Indicates Watch List (two consecutive periods of not meeting objective)
Benchmark Relative
PerformancePeer Ranking
Sep-10
Dec-10
Mar-11
Jun-11
Sep-11
Dec-11
Mar-12
Jun-12
Sep-12
Dec-12 Comments
Causeway 1 Year -5.00% Bottom 25%
3 Year 0.00% Bottom 60%
Qualitative
Aberdeen 1 Year -5.00% Bottom 25%
3 Year 0.00% Bottom 60%
Qualitative
BlackRock U.S. Debt Index
1 Year -0.50% N/A
3 Year -0.30% N/A
Qualitative
PIMCO 1 Year -2.00% Bottom 25%
3 Year 0.00% Bottom 60%
Qualitative
JP Morgan Strategic Property
1 Year -2.00% Bottom 25% X X The fund lags the benchmark by 0.4% over the three-year period and ranks at the 65th percentile of the peer group.
3 Year 0.00% Bottom 60% X X
Qualitative
14
Watch List Overview
X Indicates failure to meet objective
Indicates Watch List (two consecutive periods of not meeting objective)
Benchmark Relative
PerformancePeer Ranking
Sep-10
Dec-10
Mar-11
Jun-11
Sep-11
Dec-11
Mar-12
Jun-12
Sep-12
Dec-12 Comments
LaSalle 1 Year -2.00% Bottom 25% X X X X X X X X X X Until the fund makes significant realizations via property sales, performance for the portfolio is not very meaningful.
3 Year 0.00% Bottom 60% X X X X X X X X X X
Qualitative
JP Morgan Income and Growth
1 Year -2.00% Bottom 25% X
3 Year 0.00% Bottom 60% X X X X X X X
Qualitative
SteelRiver Infrastructure North America
1 Year -2.00% Bottom 25% Until the fund generates significant income or makes realizations via property sales, performance for the portfolio is not very meaningful.
3 Year 0.00% Bottom 60%
Qualitative
Macquaire European Infrastructure
1 Year -2.00% Bottom 25% Until the fund generates significant income or makes realizations via property sales, performance for the portfolio is not very meaningful.
3 Year 0.00% Bottom 60%
Qualitative
15
Total Plan
16
MarketValue($M)
CurrentAllocation
(%)
TargetAllocation
(%)
MinimumAllocation
(%)
MaximumAllocation
(%)
Plan Composite 606.7 100.0 100.0 N/A N/A
Large Cap U.S. Equity 216.4 35.7 36.0 31.0 41.0
Small Cap U.S. Equity 61.1 10.1 10.0 6.0 14.0
International Equity 85.4 14.1 15.0 13.0 17.0
Fixed Income 155.2 25.6 26.0 21.0 31.0
Real Estate 45.4 7.5 8.0 6.0 10.0
Infrastructure 41.4 6.8 5.0 3.0 7.0
Cash Fund 1.8 0.3 0.0 0.0 0.0
Target Allocation Actual Allocation Allocation Differences
Å Custom Index 1.30 (60) 12.63 (52) 12.63 (52) 9.50 (14) 2.88 (66) 7.81 (18)
5th Percentile 2.69 15.51 15.51 10.03 4.69 8.54
1st Quartile 2.09 13.82 13.82 9.17 3.86 7.57
Median 1.58 12.71 12.71 8.55 3.13 6.95
3rd Quartile 0.89 11.67 11.67 7.72 2.68 6.41
95th Percentile 0.00 9.52 9.52 6.40 1.51 5.91
Population 235 232 232 214 193 94
¹ The PARIS All Public Plans <$1 B Universe (Before Fees) consists of 225 Federal, State, and Local pension plans with an average plan size of $145 million as of June 30, 2012.
Plan Composite
Plan Sponsor Peer Group Analysis
As of December 31, 2012
All Public Plans < $1B¹
Parentheses contain percentile rankings.Calculation based on quarterly periodicity.
19
Annualized Return vs. Annualized Standard Deviation5 Years
¹ The custom index is currently composed of 36% S&P 500, 10% Russell 2500, 15% MSCI ACWI ex-U.S., 26% Barclays Aggregate, 8% NCREIF ODCE,and 5% CPI+4%. See appendix for prior composition.
20
U.S. Equity
21
Return Summary
Quarterly Excess Performance - 5 Years Ratio of Cumulative Wealth - 5 Years
¹ The inception date of the Champlain separate account was 07/09/2010. Performance during the beginning of July includes the return of TCW's portfoliobefore it was transitioned to Champlain. Prior performance is that of Champlain's separate account composite.
¹ The custom index is currently composed of 25% Barclays Mortgage, 25% Barclays Credit, 25% Barclays High Yield, and 25% JPMorgan EMBI Global.Prior to 02/01/2012, the custom index was composed of 70% Barclays Mortgage, 15% Barclays Credit, and 15% Barclays High Yield.
As of December 31, 2012J.P. Morgan Strategic Property Fund
76
Portfolio Information as of December 31, 2012
By Property Type
2.6%
17.3%
43.0%
1.6%
21.0%
14.2%
22.8%
25.2%
35.2%
8.3%
0% 20% 40% 60% 80% 100%
Retail
Office
Industrial
Hotel
Apartment J.P. Morgan Strategic Property
NCREIF
By Geographic Region
33.7%
40.9%
25.6%
27.9%
9.5%
34.7%
22.1%
5.7%
0% 20% 40% 60% 80% 100%
West
South
Midwest
East J.P. Morgan Strategic Property
NCREIF
J.P. Morgan Strategic Property Fund
77
Portfolio Information as of December 31, 2012
LaSalle Income and Growth IV 1,2
$8.1
$2.9$2.4
($7.9)($10)
($8)
($6)
($4)
($2)
$0
$2
$4
$6
$8
$10
Committed Drawn Distributed NAV
(In
Mil
lio
ns
)
Total
By Property Type
2.6%
32.7%
0.0%
49.1%
14.2%
22.8%
25.2%
35.2%
7.1%
11.1%
0% 20% 40% 60% 80% 100%
Retail
Office
Industrial
Hotel
Apartment
LaSalle Income and Growth IV
NCREIF
By Geographic Region
33.7%
78.9%
0.3%
9.5%
34.7%
22.1%
1.1%
19.7%
0% 20% 40% 60% 80% 100%
West
South
Midwest
East
LaSalle Income and Growth IV
NCREIF
1 Funding for the LaSalle Income and Growth IV strategy began on 07/06/2005.2 The characteristics shown are an estimate and were provided by the manager.
78
Return Summary
Quarterly Excess Performance - 5 Years Ratio of Cumulative Wealth - 5 Years
Account Information
J.P. Morgan Income and Growth Fund¹
NCREIF ODCE Index
0.0
10.0
20.0
30.0
-10.0
-16.2
Re
turn
(%
)
1Quarter
YearTo
Date
1Year
3Years
5Years
10Years
2.4
10.9 10.9
14.4
-1.1
6.76.0
17.7 17.7
21.0
-6.3
Account Name: JPM Income and Growth Fund
Inception Date: 11/01/2005
Account Structure: Commingled Fund
Asset Class: US Private Real Estate
Benchmark: NCREIF ODCE Index (Gross)
Peer Group: IM U.S. Open End Private Real Estate (SA+CF)
J.P. Morgan Income and Growth Fund¹ Performance Summary
As of December 31, 2012J.P. Morgan Income and Growth Fund¹
¹ The J.P. Morgan Income and Growth strategy was funded during the fourth quarter of 2005. Prior performance is that of the commingled fund, which wasprovided by the manager.
79
Portfolio Information as of December 31, 2012
By Property Type
2.6%
24.7%
45.6%
1.4%
20.4%
14.2%
22.8%
25.2%
35.2%
7.9%
0% 20% 40% 60% 80% 100%
Retail
Office
Industrial
Hotel
Apartment J.P. Morgan Income & Growth
NCREIF
By Geographic Region
33.7%
36.8%
18.4%
38.4%
9.5%
34.7%
22.1%
6.6%
0% 20% 40% 60% 80% 100%
West
South
Midwest
East
J.P. Morgan Income & Growth
NCREIF
J.P. Morgan Income and Growth Fund
80
Infrastructure
81
Portfolio Information as of December 31, 2012
SteelRiver Infrastructure Fund North America 1,2
Fund Investments³ SectorDate of
PurchasePurchase
AmountCurrent
Value Allocation
Seaonus/Portus Companies3 Transportation December 2007 $117.5 MM $132.8 MM 7.2%
Natural Gas Pipeline Co of America Energy Distribution December 2007 768.8 MM 497.5 MM 26.8%
Trans Bay Cable LLC Energy Distribution June 2008 154.3 MM 285.5 MM 15.4%
Peoples Natural Gas Company Energy Distribution February 2010 384.0 MM 635.8 MM 34.3%
Peoples TWP LLC Energy Distribution May 2011 76.8 MM 128.1 MM 6.9%
Patriot Rail Corp Transportation June 2012 170.7 MM 175.3 MM 9.4%
Total $1,672.1 MM $1,855.0 MM 100.0%
$20.0$19.2
$2.3
($18.7)
($25)
($20)
($15)
($10)
($5)
$0
$5
$10
$15
$20
$25
Committed Drawn Distributed NAV
($ In
Millio
ns
)
Total
1 Babcock & Brown was renamed SteelRiver on May 29, 2009.² Funding began in September 2008.³ Formerly the ICS Companies.4 Drawn amount is net of $6.7 MM in returned capital.
4
Commitment Details
82
Portfolio Information as of December 31, 2012
Macquarie European Infrastructure Fund III 1,2
5
Fund Investments SectorDate of
PurchasePurchase
AmountCurrent
Value Allocation
Brussells Airport Transportation November 2008 $531.4 MM $838.2 MM 39.5%
Copenhagen Airport Transportation November 2008 693.2 MM 953.3 MM 44.9%
Ceske Radiokomunikace Communication January 2011 65.0 MM 58.5 MM 2.8%
Thyssengas Energy Transmission February 2011 219.7 MM 153.6 MM 7.2%
Net Cash and Equivalents 0.0 MM 119.9 MM 5.6%
Total $1,509.3 MM $2,123.4 MM 100.0%
$18.3
$22.2
$0.2
($18.3)
($25)
($20)
($15)
($10)
($5)
$0
$5
$10
$15
$20
$25
$30
Committed Drawn Distributed NAV
($ In
Millio
ns
)
Total
Commitment Details
1 Funding began in October 2008. Original commitment was €12.9 MM, equivalent to $20 MM. However, a weakening Euro decreased the commitment to $18.3 MM.² U.S. Dollar amounts are translated from Euros using an exchange rate of 1.32 USD per Euro.
83
Capital Market Environment
84
Global Equity Markets
Positive economic data and a lessening of Eurozone debt crisis worries helped during the fourth quarter, but the impending “fiscal cliff” kept risk appetites in check.
Most equity markets around the world posted positive returns during the quarter. The best performing market was Europe ex-UK, and the worst performing market was the U.S. with “fiscal cliff” concerns impeding equities in the U.S.
2.99%5.74%
‐0.03%
4.47% 5.13%
0.21% 0.38%
8.62%6.01% 5.52%
16.38% 17.04% 15.63%17.36%
7.54% 8.10%
3.02%
21.63%23.88%
18.68%
‐10%
0%
10%
20%
30%
40%
50%
ACWI IMI 53.9%ACWI ex‐U.S.
IMI
46.1%USA IMI
8.3%UK IMI
7.6%Japan IMI
4.3%Canada IMI
0.2%Israel IMI
15.3%Europe ex‐UK IMI
5.2%Pacific ex‐Japan IMI
12.9%EmergingMarkets IMI
GLOBAL MSCI IMI INDEX RETURNSAS OF 12/31/2012
Fourth Quarter 2012One‐Year
Source: MSCI
85
Global Equity Markets
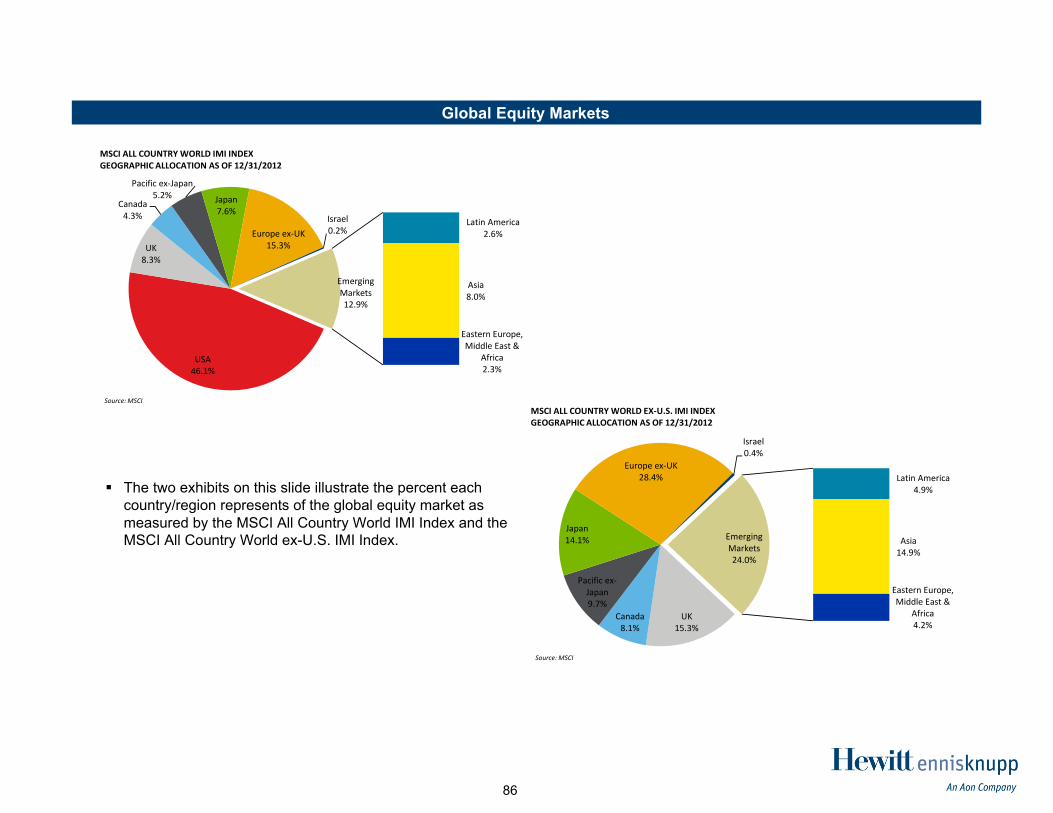
The two exhibits on this slide illustrate the percent each country/region represents of the global equity market as measured by the MSCI All Country World IMI Index and the MSCI All Country World ex-U.S. IMI Index.
USA46.1%
UK8.3%
Canada4.3%
Pacific ex‐Japan5.2% Japan
7.6%
Europe ex‐UK15.3%
Israel0.2%
Latin America2.6%
Asia8.0%
Eastern Europe, Middle East &
Africa2.3%
EmergingMarkets12.9%
MSCI ALL COUNTRY WORLD IMI INDEXGEOGRAPHIC ALLOCATION AS OF 12/31/2012
Source: MSCI
UK15.3%
Canada8.1%
Pacific ex‐Japan9.7%
Japan14.1%
Europe ex‐UK28.4%
Israel0.4%
Latin America4.9%
Asia14.9%
Eastern Europe, Middle East &
Africa4.2%
EmergingMarkets24.0%
MSCI ALL COUNTRY WORLD EX‐U.S. IMI INDEXGEOGRAPHIC ALLOCATION AS OF 12/31/2012
Source: MSCI
86
U.S. Equity Markets
Generally positive U.S. economic data was overshadowed by the “fiscal cliff,” which led to significant uncertainty during the quarter.
The Russell 3000 rose 0.25% during the quarter and returned 16.42% during 2012.
The Industrials, Financials, and Materials sectors were the best performing sectors during the fourth quarter, posting returns of 5.34%, 4.85%, and 3.52%, respectively. The Telecommunications and Information Technology sectors were the worst performing areas, producing returns of -5.55% and -4.68%, respectively, during the fourth quarter.
Mid cap outperformed both small cap and large cap during the fourth quarter. Value outperformed growth across all capitalization segments of the market during the quarter.
0.25%2.94%
‐2.56% ‐1.41%
4.85%
‐0.56%
5.34%
‐4.68%
3.52%
‐5.55%‐2.38%
16.42%
24.76%
3.88%
10.90%
26.21%
19.42%17.16%
13.96%17.49% 18.80%
2.11%
‐10%
0%
10%
20%
30%
40%
50%
Russell3000
12.5% Cons .Disc.
9.9%Energy
9.3%Cons. Stap.
16.8%Financials
11.8%Healthcare
11.3%Industrials
18.2%IT
4.1%Materials
2.7%Telecomms
3.4%Utilities
RUSSELL GICS SECTOR RETURNSAS OF 12/31/2012
Fourth Quarter 2012One‐Year
Source: Russell Indexes
0.25% 0.47%
‐2.46%
3.93%1.69%
3.22%0.45%
16.42% 17.01%15.06%
18.51%15.81%
18.05%14.59%
‐10%
0%
10%
20%
30%
40%
50%
Russell 3000 32.7%Large Value
32.2%Large Growth
14.8%Medium Value
12.7%Medium Growth
3.9%Small Value
3.7%Small Growth
RUSSELL STYLE RETURNSAS OF 12/31/2012
Fourth Quarter 2012One‐Year
Source: Russell Indexes
87
U.S. Fixed Income Markets
The Barclays Aggregate Bond Index returned 0.21% in the fourth quarter.
Corporate bonds and commercial mortgage-backed securities were the strongest performing sectors, returning 1.06% and 1.22%, respectively, over the course of the fourth quarter.
In the investment grade market, lower quality bonds outperformed higher quality bonds. This held true for the quarter and for the full year 2012.
High yield bonds outperformed investment grade bonds as investors sought yield in a low interest rate environment.
From a maturity perspective, the 7-10 year range performed the strongest with a return of 0.72% during the fourth quarter.
0.21%
‐0.06%
1.06%
‐0.20%
0.22%
1.22%
4.21%
2.02%
9.82%
2.59%
3.66%
9.66%
‐2%
0%
2%
4%
6%
8%
10%
12%
Barclays Agg.Bond
46.7%Gov't
21.5%Corp.
29.6%MBS
0.4%ABS
1.8%CMBS
BARCLAYS AGGREGATE RETURNS BY SECTORAS OF 12/31/2012
Fourth QuarterOne‐Year
Source: Barclays Live
‐0.11%
0.33%0.88%
1.68%
3.29%2.38%
5.41%
9.90%
11.48%
15.81%
‐2%
0%
2%
4%
6%
8%
10%
12%
14%
16%
18%
Aaa Aa A Baa High Yield
BARCLAYS AGGREGATE RETURNS BY QUALITY AND HIGH YIELD RETURNSAS OF 12/31/2012
Fourth QuarterOne‐Year
Source: Barclays Live
0.10% 0.01%0.35%
0.72%0.45%
1.33%
2.97%
4.80%
7.32%
8.78%
0%
1%
2%
3%
4%
5%
6%
7%
8%
9%
10%
1‐3 Yr. 3‐5 Yr. 5‐7 Yr. 7‐10 Yr. >10 Yr.
BARCLAYS AGGREGATE RETURNS BY MATURITYAS OF 12/31/2012
Fourth QuarterOne‐Year
Source: Barclays Live
88
U.S. Fixed Income Markets
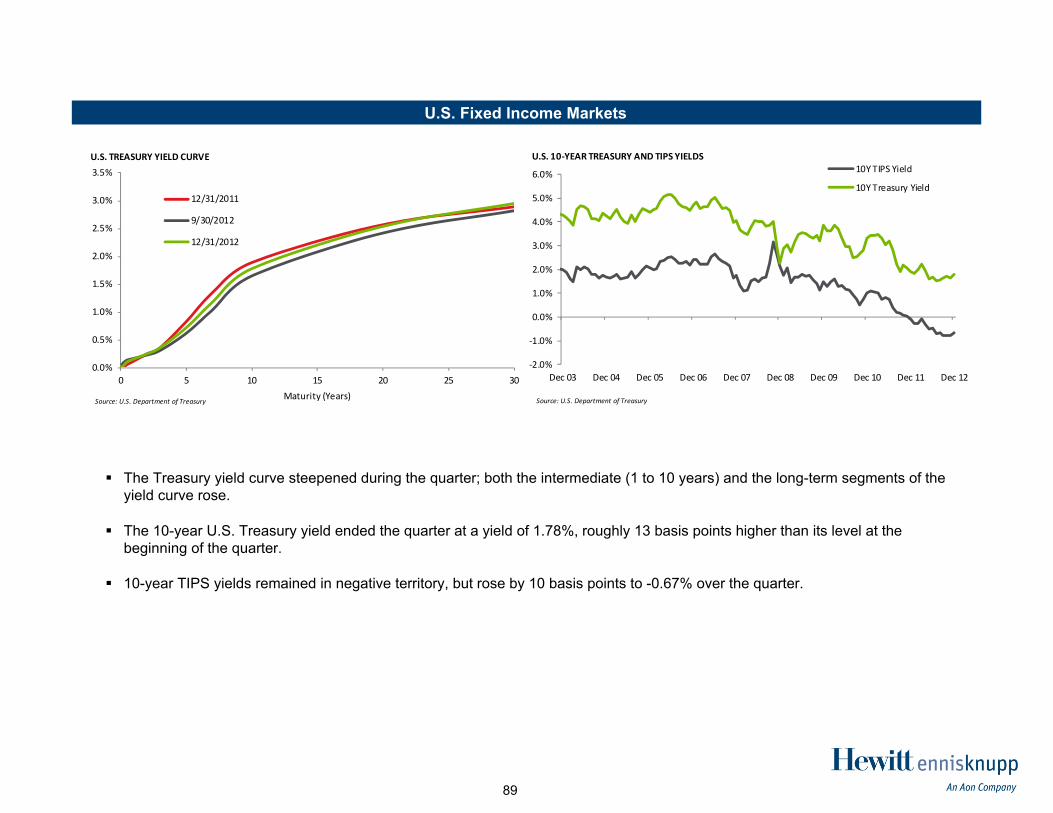
The Treasury yield curve steepened during the quarter; both the intermediate (1 to 10 years) and the long-term segments of the yield curve rose.
The 10-year U.S. Treasury yield ended the quarter at a yield of 1.78%, roughly 13 basis points higher than its level at the beginning of the quarter.
10-year TIPS yields remained in negative territory, but rose by 10 basis points to -0.67% over the quarter.
0.0%
0.5%
1.0%
1.5%
2.0%
2.5%
3.0%
3.5%
0 5 10 15 20 25 30Maturity (Years)
U.S. TREASURY YIELD CURVE
12/31/2011
9/30/2012
12/31/2012
Source: U.S. Department of Treasury
‐2.0%
‐1.0%
0.0%
1.0%
2.0%
3.0%
4.0%
5.0%
6.0%
Dec 03 Dec 04 Dec 05 Dec 06 Dec 07 Dec 08 Dec 09 Dec 10 Dec 11 Dec 12
U.S. 10‐YEAR TREASURY AND TIPS YIELDS10Y TIPS Yield
10Y Treasury Yield
Source: U.S. Department of Treasury
89
European Fixed Income Markets
Greece was one of the focal points of the Eurozone debt crisis during the quarter as speculation rose on whether it would obtain a second tranche of bailout funds. On November 26, European leaders, the European Central Bank, and the International Monetary Fund reached an agreement to release the next €34 billion tranche of bailout money to Greece. This was generally viewed positively by market participants and led to a reduction in Greek spreads over German Bunds.
10-year yield spreads over German Bunds decreased for the rest of the Eurozone periphery as well over the quarter.
0%
5%
10%
15%
20%
25%
30%
35%
40%
45%
Dec07
Mar08
Jun08
Sep08
Dec08
Mar09
Jun09
Sep09
Dec09
Mar10
Jun10
Sep10
Dec10
Mar11
Jun11
Sep11
Dec11
Mar12
Jun12
Sep12
Dec12
EUROZONE PERIPHERAL BOND SPREADS(10‐YEAR SPREADS OVER GERMAN BUNDS)
Spain ItalyPortugal GreeceIreland
Source: DataStream
90
Credit Spreads
Credit spreads fell across most markets during the quarter with the exception of MBS.
Fixed income markets that saw the largest drops in spreads were High Yield, Global Emerging Markets, and CMBS.
Credit spreads across every segment as of December 31, 2012 were lower relative to a year prior.
Driven by negative returns across most market sectors, the Dow Jones-UBS Commodity Index decreased by 6.33% during the fourth quarter.
The strongest and only positive performing segment of the market was livestock with a return of 4.68% during the quarter.
Grains and Agriculture were the worst performing sectors of the market during the fourth quarter with returns of -11.60% and -10.24%, respectively.
‐7.16%
‐6.94%
‐7.33%
‐1.41%
4.68%
‐3.65%
‐11.60%
‐6.80%
‐5.26%
‐10.24%
‐6.33%
‐9.79%
‐22.39%
6.29%
0.53%
‐3.54%
0.67%
18.25%
2.85%
‐9.36%
3.98%
‐1.06%
‐25% ‐20% ‐15% ‐10% ‐5% 0% 5% 10% 15% 20% 25%
Soybean Oil
Softs
Prec. Metals
Petroleum
Livestock
Ind. Metals
Grains
Ex‐Energy
Energy
Agric.
DJ‐UBS Commodity Index
COMMODITY RETURNSAS OF 12/31/2012
Fourth QuarterOne‐Year
92
Currency
As measured through the broad trade weighted U.S. dollar index, the U.S. dollar marginally appreciated during the quarter and the one-year period.
The MSCI EAFE Unhedged Index slightly underperformed the MSCI EAFE 100% Hedged Index during the year-to-date period reflecting the appreciation of the U.S. dollar. The Unhedged index outperformed the Hedged index during the trailing 3-, 5-, and 10-year periods.
90
95
100
105
110
115
120
Dec07
Mar08
Jun08
Sep08
Dec08
Mar09
Jun09
Sep09
Dec09
Mar10
Jun10
Sep10
Dec10
Mar11
Jun11
Sep11
Dec11
Mar12
Jun12
Sep12
Dec12
TRADE WEIGHTED U.S. DOLLAR INDEX(1997 = 100)
Source: Federal Reserve
‐9.68%
‐5.50%
11.24%
18.98%
8.07%
‐15.79%
7.01%5.72%
‐3.39%
5.98%
2.06%
‐0.06% ‐0.24% ‐0.24%
0.57% 0.10%2.16%
‐20%
‐15%
‐10%
‐5%
0%
5%
10%
15%
20%
25%
2000
2001
2002
2003
2004
2005
2006
2007
2008
2009
2010
2011
2012
1‐Year
3‐Years
5‐Years
10‐Years
DIFFERENCE BETWEEN MSCI EAFE UNHEDGED AND HEDGED INDICESAS OF 12/31/2012
Source: MSCI
UNHEDGED OUTPERFORMS
HEDGED OUTPERFORMS
93
Hedge Fund Markets Overview
Except for Global Macro, all major hedge fund strategies types posted positive returns in the fourth quarter and for the full year 2012. The HFRI Fund-Weighted Composite Index and the HFRI Fund of Funds Composite Index produced returns of 1.27% and 1.77%, respectively, during the fourth quarter.
Emerging Markets and Distressed-Restructuring strategies were the strongest performers during the quarter gaining 4.91% and 4.11%, respectively.
1.55%
‐1.02%
1.82%
4.91%
3.12%
4.11%
1.91%
1.27%
1.77%
8.31%
‐0.18%
7.39%
10.30%
8.54%
10.34%
10.04%
6.16%
5.25%
‐2% 0% 2% 4% 6% 8% 10% 12%
Fixed Income/Convertible Arb.
Global Macro
Equity Hedge
Emerging Markets
Event‐Driven
Distressed‐Restructuring
Relative Value
Fund‐Weighted Composite Index
Fund of Funds Composite Index
HEDGE FUND PERFORMANCEAS OF 12/31/2012
Fourth QuarterOne‐Year
Source: HFR
94
Private Equity Market Overview – Q3 2012
Fundraising: Continues to improve: LTM levels ($263B) healthy but not excessive levels. Remains well below pre-crisis levels ($490B). Overhang significant ($785B) but decreasing.Buyout: Deal volume vacillating quarter to quarter, but flat to slightly trending up. Small and middle market deals comprise bulk of activity although increasing activity seen in the large market. Purchase price multiples remained relatively steady for last three years; large cap is above its 10 year average while middle market is below its 10 year average. European activity remains slow due to economic uncertainty.Venture capital: YTD investment levels ($20B) lagging strong levels in 2011. Meaningful shift over last 1.5 years to later stage deals with a commensurate increase in series C in pre-money valuations and a decrease in series A and B pre-money valuations; YTD exit activity down 14% due to reduced M&A activity, number of IPOs flat with 2011.Mezzanine: U.S. mezzanine lenders continue to target smaller transactions as getting squeezed out of larger transactions in favor of high yield. YTD sub debt usage in large cap deals represented smallest percentage of total purchase price multiple in last 15 years.Distressed Debt: Investment activity remains low due to high refinance activity and continued low high-yield default rates; looking forward to 2013-2014 attractive opportunities exist primarily in mid to lower cap market due to fragile economy and reduced leveraged loan capacity.Secondaries: $16 billion raised YTD expect second highest year of fundraising; YTD volume of $18.5 billion lagging 2011 but still robust. Pricing discounts flat at 11% for Buyout and decreasing slightly to 25% for Venture. Infrastructure: YTD Fundraising down from 2011, new infrastructure debt funds being raised. Activity plateaued at lower levels due to debt availability and increased regulation in Europe.
0
1,000
2,000
3,000
4,000
5,000
6,000
$0
$200
$400
$600
$800
$1,000
$1,200
1Q07
2Q07
3Q07
4Q07
1Q08
2Q08
3Q08
4Q08
1Q09
2Q09
3Q09
4Q09
1Q10
2Q10
3Q10
4Q10
1Q11
2Q11
3Q11
4Q11
1Q12
2Q12
3Q12
LTM GLOBAL SPONSOR M&A DEAL VOLUME AND VALUE(TRAILING 12 MONTH DATA)
2013 U.S. Real Estate Outlook:The U.S. economy is expected to remain in a slow-growth mode for much of 2013. While still supporting a continuation of measured improvements in real estate fundamentals (e.g., net absorption, occupancies, and now more broadly some rent growth), the pace ofimprovement is expected to remain modest.Real Estate returns are expected to continue their path of moderation given the sector's robust pricing rebound over the past few years. Consensus forecast range for the NPI is 6%–9% (Core real estate), which is still generally in line with the sector's long-term average.
– If Core buyers accept lower yields for real estate absent attractive income alternatives in other asset classes, returns could reach the high end of the range. On the flip side, policies meant to address long term government fiscal issues could deliver a short termeconomic shock placing returns at the lower end of the range, at best.
Uncertainty stemming from the negative scenarios that could play out through multiple macro economic/political issues will likely keep investors cautious in early 2013. Thus we expect growth in transaction volumes to remain muted versus typical rebound periods. We anticipate the market will continue to seek the safety of current yield provided by Core, which remains historically attractive relative to other asset classes.
– The current low interest rate environment continues to support price recovery/growth and this is expected to persist as the U.S.Federal Reserve has indicated it will support a low interest rate environment until sustained economic growth is evident.
New supply is expected to become more noticeable in 2013, first entering through the apartment sector, though select industrial development has also begun. As an asset class, however, new deliveries are still well restrained.
– The ramp up in multifamily supply is expected to slow that segment’s positive momentum in 2013, though not derail it—selective pruning of apartment holdings in high supply markets should be up for consideration.
NCREIF ODCE Index (Net) 2.1 (61) 9.7 (90) 13.3 (60) -2.0 (34) 5.7 (-)IM U.S. Open End Private Real Estate (SA+CF) Median 2.3 11.7 14.0 -3.8 -
LaSalle Income and Growth Fund IV 4.0 (8) 3.0 (100) -1.6 (100) -11.2 (83) -
NCREIF ODCE Index (Net) 2.1 (61) 9.7 (90) 13.3 (60) -2.0 (34) 5.7 (-)IM U.S. Open End Private Real Estate (SA+CF) Median 2.3 11.7 14.0 -3.8 -
JPM Income and Growth Fund 5.7 (2) 16.3 (8) 19.2 (8) -7.8 (79) -
NCREIF ODCE Index (Net) 2.1 (61) 9.7 (90) 13.3 (60) -2.0 (34) 5.7 (-)IM U.S. Open End Private Real Estate (SA+CF) Median 2.3 11.7 14.0 -3.8 -
1 The custom index is currently composed of 36% S&P 500, 10% Russell 2500, 15% MSCI ACWI ex-U.S., 26% Barclays Aggregate, 8%NCREIF ODCE, and 5% CPI+4%.
² T. Rowe Price replaced Friess on 02/01/2012.3 Aberdeen replaced Artio on 04/02/2012.^ BlackRock replaced the Internally Managed Bond account on 01/05/2012.* The custom index is currently composed of 25% Barclays Mortgage, 25% Barclays Credit, 25% Barclays High Yield, and 25% JPMorgan
EMBI Global. Prior to 02/01/2012, the custom index was composed of 70% Barclays Mortgage, 15% Barclays Credit, and 15% BarclaysHigh Yield.
99
Custom Index Composition
100
Custom Index Composition
Index
Jul-12 through Present
Jul-10 through
Jun-12
Jan-09 through
Jun-10
Jul-06 through Dec-08
Jan-05 through
Jun-06
Jul-02 through Dec-04
Prior to Jul-02
S&P 500 Index 36% 36% 36% 38% 41% 41% 41%
Russell 2000 Index 10% 10% 10% 11% 11% 11% 11%
MSCI ACWI ex-U.S. 15% 15% 15% 15% 15% 15% 15%
Barclays Aggregate Bond Index 26% 23% 23% 25% 25% 28% 23%
Barclays High Yield Index 0% 3% 3% 3% 3% 0% 0%
Solomon Bros Non-U.S. Government Index 0% 0% 0% 0% 0% 0% 5%
NCREIF ODCE 8% 8% 8% 8% 5% 5% 5%
CPI + 4% 5% 5% 5% 0% 0% 0% 0%
Total 100% 100% 100% 100% 100% 100% 100%
101
Manager InBriefs
102
Proprietary & Confidential
InBrief Global Investment Management
Aberdeen Asset Management EAFE PlusReview Date Current Rating Previous RatingSeptember 2012 Buy No Change
Overall Rating We find the current global/international equity team to be of good quality with extensive resources. Performance has been strong under varying market conditions with good risk management integrated into company analysis. . Assets under management for the team have grown significantly in the last couple of years and we closely monitor any impact that this growth in assets has on the performance of the portfolio.
Component Ratings Relative Performance to September 30, 2012
Rating Previous Rating
Overall Buy No Change
Business 3 No Change
Staff 3 No Change
Process 3 No Change
Risk 3 No Change
ODD Pass No Change
Performance 3 No Change
T&C 3 No Change
5.6%
1.4%
3.4%
9.6%
0.1%
5.5% 5.5%
0%
2%
4%
6%
8%
10%
12%
CY08 CY09 CY10 CY11 YTD 3yr (p.a.)
5yr (p.a.)
Composite performance (USD) is gross of fees relative to MSCI AC World ex U.S. Index. CY = calendar year. Source: the manager
Firm Summary
Head Office Location Aberdeen, Scotland Parent Name Aberdeen Asset Management Plc
Portfolio Strategy Characteristics Team Location Edinburgh Team Head Stephen Docherty Strategy Inception January 2003* Strategy Size $6.4 billion Number of Holdings 40 – 60 Annual Turnover 20 – 30% p.a. Benchmark MSCI All Country World ex U.S. Index Performance Objective 3% outperformance over a rolling three year period Risk Tolerance Target 3 – 9% p.a. tracking error range Note: AUM and Staff numbers as at September 30, 2012 * The Fund had been in existence prior to this but was managed by a different team and process.
Proprietary & Confidential
Investment Manager Evaluation
Rating Sheet
Factor Rating Comments
Business 3
Aberdeen Asset Management (“Aberdeen”) is a dedicated, independent fund manager with its primary listing in the UK. The global/international equity team and its related strategies have experienced significant growth in assets under management over the last couple of years and we would like to see more clarity around capacity management. While key team members have invested their own assets in the product ensuring some alignment of interests, we would prefer to see the remuneration linked to the success of the global/international equity product rather than the overall firm.
Investment Staff 3
The global/international equity team has been stable since Stephen Docherty took over the leadership in 2003. All the team members are generalists and make use of the broad regional teams' research. We find the key individuals in the team to be experienced and of good quality
Investment Process 3
Aberdeen implements a consistent internal research methodology with a high focus on company meetings. The global equity team picks names from the list of stocks rated "Buy" by regional analysts and thereby leverages off an extensive analyst base. The team will do their own thorough research on potential stocks, though this part of the process is less structured in particular with respect to sector and regional comparison. The portfolio will be fairly concentrated with 40 to 60 stocks and we believe there will be a slight structural bias to Asia and Emerging Markets. The strategy can invest up to 30% of the total portfolio in Emerging Markets companies.
Risk Management 3
Risk management is integrated into the investment process primarily through individual company analysis. In addition, the team will use risk tools to identify unintended risk and will adjust the portfolio if necessary.
Operational Due Diligence Pass
The Charles River systems are used for trading. In addition, there is a detailed manual checking procedure. We believe the scalability of the systems will be tested if Aberdeen continues to see an ongoing significant increase in its client base for this strategy.
Performance Analysis 3
The product has had strong performance in both rising and falling markets. Most of the outperformance can be attributed to good stock selection which is in line with the investment process. Historically the product has also benefited from general exposure to Asia and Emerging Markets.
Terms & Conditions 3
Aberdeen has responded promptly to our requests for information. Fees are slightly above average for this type of product.
In terms of ESG, Aberdeen actively considers non-financial factors that may impact a company's business, and appears to have fully integrated the appraisal of such criteria into their investment process.
Proprietary & Confidential
Rating Sheet Factor Rating Comments
Overall Rating Buy
We find the current global/international equity team to be of good quality with extensive resources. Performance has been strong under varying market conditions with good risk management integrated into company analysis. Assets under management for the team have grown significantly in the last couple of years and we closely monitor any impact on the portfolio.
Proprietary & Confidential
Ratings Explanation Below we describe the criteria which we use to rate fund management organizations and their specific investment products. Each criterion, except for Operational Due Diligence ("ODD"), is individually rated from 1 to 4, where:
1 = Weak 2 = Average 3 = Above Average 4 = Strong
The ODD factor can be assigned a Pass, Conditional Pass, or Fail rating and can be interpreted as follows:
Pass – Our research indicates that the manager has acceptable operational controls and procedures in place. Conditional Pass – We have specific concerns that the manager needs to address within a reasonable established timeframe. Fail – Our research indicates that the manager has critical operational weaknesses and we recommend that clients formally review the appointment.
An overall rating is then derived for the product from the individual ratings. We do not assign a fixed weight to each criterion to establish the overall rating; instead we consider each case individually. The overall rating score can be interpreted as follows:
Buy = We recommend purchase of this investment product Buy (Closed)
= We recommend purchase of this investment product, however it is closed to new investors
Hold = We recommend client investments in this product are maintained Sell = We recommend termination of client investments in this product In Review = The rating is under review as we evaluate factors that may cause us to change the current
rating.
The comments and assertions reflect our views of the specific investment product and our opinion of its strengths and weaknesses.
Disclaimer This document has been produced by the Global Investment Management Team of Aon plc. Nothing in this document should be treated as an authoritative statement of the law on any particular aspect or in any specific case. It should not be taken as financial advice and action should not be taken as a result of this document alone. Consultants will be pleased to answer questions on its contents but cannot give individual financial advice. Individuals are recommended to seek independent financial advice in respect of their own personal circumstances.
Champlain Investment Partners Mid Cap CoreReview Date Current Rating Previous RatingJanuary 2013 Buy Buy
Overall Rating The Champlain Mid Cap Core strategy remains Buy-rated. We believe the investment team is made up of talented and experienced investors that have consistently applied the firm’s investment process within this strategy. The investment team has demonstrated an ability to develop unique insights on portfolio holdings which has led to attractive long-term results for this product. We are confident in this team’s ability to continue to add value for clients over full market cycles.
Component Ratings Relative Performance to December 2012
Rating Previous Rating
Overall Buy No Change
Business 4 No Change
Staff 3 No Change
Process 4 No Change
Risk 3 No Change
ODD Pass No Change
Performance 3 No Change
T&C 2 No Change
15.7%
-11.6%
-3.3%
5.6%
-4.2%-0.3%
3.0%
-15%
-10%
-5%
0%
5%
10%
15%
20%
CY08 CY09 CY10 CY11 CY12 3yr (p.a.)
5yr (p.a.)
Composite performance (USD) is gross of fees relative to Russell Mid Cap Index. CY = calendar year. Source: eVestment
Portfolio Strategy Characteristics Team Location Burlington, VT Team Head Scott Brayman Strategy Inception March 2004 Strategy Size $1.5 billion Number of Holdings 50-75 Annual Turnover 40% Benchmark Russell Mid Cap Index Performance Objective Outperform the benchmark over a full market cycle Risk Tolerance Target Unconstrained Note: AUM and staff numbers as of September 2012.
Investment Manager Evaluation
Rating Sheet
Factor Rating Comments
Business 4
Champlain Investment Partners is 100% employee-owned by eight individuals. Equity interests are broadly distributed with Scott Brayman and Judy O’Connell having the largest stakes; however, no individual owns more than 25% of the firm. The senior professionals of the organization have continued to demonstrate a commitment to remaining independent. We believe the broad distribution of equity within the investment team has favorably aligned the interests of clients with that of the firm’s employees.
The firm is dedicated to managing two investment strategies - Mid Cap Core and Small Cap Core Equity - and has shown good capacity management by closing the Small Cap Core strategy to new investors at a conservative asset level. We would expect the firm to apply the same discipline with respect to the Mid Cap Core strategy.
Champlain has a diverse set of clients and has experienced few client terminations over the history of the firm. The firm’s client base is primarily institutional which we view positively.
Investment Staff 3
The investment staff is led by Scott Brayman who serves as the firm’s Chief Investment Officer. He is supported by a team of three senior analysts and five associate analysts. The three senior analysts have all collectively worked together with Mr. Brayman since the firm’s inception year (2004).
Champlain has continued to build out its investment team with the addition of multiple associate analysts over the past several years. It appears that these analysts have transitioned well into the structure of the organization. The newest addition to the team was Jason Wyman, who joined during 2012 from Dwight Asset Management. Mr. Wyman’s background is primarily quantitative. The firm anticipates that Mr. Wyman’s quantitative analysis will enable the team to evaluate the firm’s investment discipline, risk management, and portfolio attribution in greater detail.
We have found that Champlain has assembled a team of individuals with unique backgrounds and perspectives that are collaboratively shared within the organization. We believe the talent level and skill of the investment team is above average, and also view the team dynamic within the organization to be particularly strong.
Rating Sheet Factor Rating Comments
Investment Process 4
The investment process is predicated on various qualitative sector factors that eliminate the majority of the investable universe for the Mid Cap strategy. Champlain takes a conservative view with respect to its definition of quality that relies heavily on evaluating company management, management’s capital allocation abilities, as well as the durability of the firm’s business model which typically includes stable earnings growth, low debt, and high return on capital.
The investment team applies a rigorous valuation framework to each investment idea primarily through the use of discounted cash flow analysis. Champlain remains disciplined in purchasing names trading below the firm’s estimate of fair value and incrementally trimming and eventually selling positions that reach the firm’s fair value target.
We have found that the team’s rigorous discipline with respect to the firm’s definition of quality and valuation of respective names is consistent, thorough, and repeatable. We believe the firm’s fundamental research efforts as well as its dedication to investing in quality companies are distinguishing characteristics of this investment approach.
Risk Management 3
The firm does not have an independent risk team and they do not use risk models to evaluate total portfolio risk. However, the firm’s investment discipline has led to consistent preservation of capital during down market environments through the firm’s quality sector factors and rigorous valuation analysis.
Operational Due Diligence Pass
Policies and procedures in place with regards to trading and compliance appear satisfactory.
Performance Analysis 3
Clients should expect this strategy to struggle on a relative basis during periods of strong absolute performance for the benchmark (i.e., benchmark returns greater than 15% over a twelve-month period). The investment discipline will also struggle when lower quality names materially outperform the highest quality names (generally defined by ROIC). Over full market cycles we believe this strategy will continue to add value for clients and provide strong down market protection as the strategy has done over its historical track record.
Terms & Conditions 2
Investment management fees for the firm’s separate account and mutual fund vehicles are higher than its peer group median. Client service provided by the organization has been satisfactory.
Overall Rating Buy
The Champlain Mid Cap Core strategy remains Buy-rated. We believe the investment team is made up of talented and experienced investors that have consistently applied the firm’s investment process within this strategy. The investment team has demonstrated an ability to develop unique insights on portfolio holdings which has led to attractive long-term results for this product. We are confident in this team’s ability to continue to add value for clients over full market cycles.
Manager Updates and Monitoring Major Developments There are no major developments to report at this time.
Key Monitoring Points
There are no key monitoring points to report at this time.
Ratings Explanation Below we describe the criteria which we use to rate fund management organizations and their specific investment products. Each criterion, except for Operational Due Diligence ("ODD"), is individually rated from 1 to 4, where:
1 = Weak 2 = Average 3 = Above Average 4 = Strong
The ODD factor can be assigned a Pass, Conditional Pass, or Fail rating and can be interpreted as follows:
Pass – Our research indicates that the manager has acceptable operational controls and procedures in place. Conditional Pass – We have specific concerns that the manager needs to address within a reasonable established timeframe. Fail – Our research indicates that the manager has critical operational weaknesses and we recommend that clients formally review the appointment.
An overall rating is then derived for the product from the individual ratings. We do not assign a fixed weight to each criterion to establish the overall rating; instead we consider each case individually. The overall rating score can be interpreted as follows:
Buy = We recommend purchase of this investment product Buy (Closed)
= We recommend purchase of this investment product, however it is closed to new investors
Hold = We recommend client investments in this product are maintained Sell = We recommend termination of client investments in this product In Review = The rating is under review as we evaluate factors that may cause us to change the current
rating.
The comments and assertions reflect our views of the specific investment product and our opinion of its strengths and weaknesses.
Disclaimer This document has been produced by the Global Investment Management Team of Aon plc. Nothing in this document should be treated as an authoritative statement of the law on any particular aspect or in any specific case. It should not be taken as financial advice and action should not be taken as a result of this document alone. Consultants will be pleased to answer questions on its contents but cannot give individual financial advice. Individuals are recommended to seek independent financial advice in respect of their own personal circumstances.
Pyramis Global Advisors Small Cap CoreReview Date Current Rating Previous RatingNovember 2012 Hold No Change
Overall Rating We rate the Pyramis Small Cap Core strategy a Hold. While we believe that portfolio manager, Ethan Hugo, has demonstrated promise in his ability to navigate difficult market environments, we have reservations as it relates to the depth of the analyst support that he has access to. In addition, we believe that his track record on this strategy, as well as in portfolio management in general, is too short to use as a gauge for his capabilities in various market environments. This rating has the potential to be revised upward pending additional exposure to Mr. Hugo and members of his staff, as well as comfort achieved around the depth and magnitude of the analysts’ contribution.
Component Ratings Relative Performance to September 2012
Rating Previous Rating
Overall Hold No Change
Business 2 No Change
Staff 2 No Change
Process 2 No Change
Risk 2 No Change
ODD Pass No Change
Performance 2 No Change
T&C 2 No Change
6.3%
-8.5%
20.5%
7.0%
1.0%
4.7%3.2% 2.7%
-10%
-5%
0%
5%
10%
15%
20%
25%
CY07 CY08 CY09 CY10 CY11 YTD 3yr (p.a.)
5yr (p.a.)
Composite performance (USD) is gross of fees relative to Russell 2000 Index. CY = calendar year. Source: eVestment Alliance
Firm Summary Head Office Location Smithfield, RI Parent Name FMR, LLC Firm AUM $190 billion Investment Staff N/A Equity AUM $79.1 billion Equity Staff N/A
Strategy Characteristics Team Location Smithfield, RI Team Head Ethan Hugo Strategy Inception January 1995 Strategy Size $1.3 billion Number of Holdings 200-300 Annual Turnover 75%-125% Benchmark Russell 2000 Index Performance Objective Outperform the benchmark by 3% per year Risk Tolerance Target 3-5% Note: AUM and Staff numbers as of September 2012
Proprietary & Confidential
Investment Manager Evaluation
Rating Sheet
Factor Rating Comments
Business 2
Pyramis Global Advisors is Fidelity’s institutional asset management arm. The firm has seen positive net inflows into its strategies year-to-date as of September 30, 2012. Further, the firm has also seen consistent net inflows into the small cap core strategy in recent years, which is notable, given the decline in search activity for small cap mandates.
New product development is an ongoing concern with regards to the organization. New products are steadily being launched by Pyramis, as the firm continues its effort to create a full and complete product list to present to the institutional market. Product development appears to be driven by growth decisions as opposed to specific client demands.
Investment Staff 2
The lead portfolio manager for the small cap core strategy is Ethan Hugo, who assumed his role in 2008. Mr. Hugo is supported by the Pyramis small cap team, which is comprised of research analysts and portfolio managers, as well as the equity research and high yield research teams that sit within the Fidelity organization. The research analysts from both Fidelity and Pyramis are sector and/or industry specific in their coverage and are primarily responsible for identifying and ranking securities for strategies across the firm’s platform. Mr. Hugo is primarily responsible for theme development and portfolio construction, although he remains actively involved in the fundamental research efforts of the analyst team.
We believe that, throughout his short tenure as a portfolio manager, Mr. Hugo has exhibited skill in navigating various market environments, while adhering to the underlying philosophy and approach that defines the strategy. In addition, Mr. Hugo’s approach to portfolio theme development is well-supported by a strong understanding of inter-sector dynamics and the fundamentals driving sector and company specific growth. However, we continue to have reservations about the research staff supporting Mr. Hugo. While the support is robust, it is also difficult to gauge the strongest sources of value add, given the sheer number of analysts that Mr. Hugo interacts with at any given time. Moreover, given the rotational nature of the Fidelity analyst staff, it is difficult to assess whether or not Mr. Hugo will benefit from consistent research methodologies and views. Finally, a significant percentage of analysts’ variable compensation is contingent upon 1 year stock performance, which does not align well with a strategy that is intended to be more long-term focused.
Proprietary & Confidential
Rating Sheet Factor Rating Comments
Investment Process 2
The objective of the strategy is to invest in companies that have faster, more consistent growth relative to their peers, attractive valuations, and high or improving operating quality. In addition, Mr. Hugo prefers to capture these companies when they are experiencing a transition or fundamental change that is either unrecognized or unappreciated by the market, but that have the potential to create significant upside potential. Ideas are generally identified by the analysts, who also conduct the fundamental research on attractive ideas. Research focuses on, but is not limited to, understanding company leadership and strategy, sources of earnings, and posture within an industry. Analysts also dedicate time to building out earnings and valuation models. Using all of the necessary data points, Mr. Hugo develops portfolio themes as a guide to his portfolio construction approach, which is sector neutral, devoid of major growth or value bets, and relatively neutral to factor exposure such as momentum.
We view the sector neutrality of the portfolio to be positive as it has the potential to weather different market environments, particularly those that are challenged. In addition, we believe that Mr. Hugo’s access to a wide range of research resources, as provided by the analyst teams, can be beneficial in his efforts to build comprehensive industry and sector views. However, we continue to have neutral sentiment as it relates to the uniqueness of the analysts’ research methodologies and views. Also, given the small size of dedicated Pyramis small cap team, we question whether certain sectors have enough coverage and if the support is appropriate for the diversified nature of the portfolio.
Risk Management 2
The strategy is managed according to constraints on portfolio size, cash levels, and sector/industry exposure. In addition, the portfolio is subject to review by the Chief Investment Officer, who meets with the portfolio manager quarterly to discuss and amend major risks exposures at the aggregate portfolio level. Mr. Hugo also has real-time access to risk reports that highlight various risk factors. While we believe that the appropriate measures are in place to provide insights on the positioning of the portfolio, additional time is needed to understand how these measures impact portfolio construction and if those impacts have been positive for investors.
Operational Due Diligence Pass
Policies and procedures in place appear to be satisfactory from both a trading and compliance standpoint.
Performance Analysis 2
Performance has been strong relative to the Russell 2000 Index for both short- and long-term periods. Strong stock selection has been the primary driver of performance, though the sector neutrality of the strategy has also been a benefit. While we acknowledge the strong run of the portfolio in difficult markets, we also recognize that the track record under Mr. Hugo remains short and believe additional time is needed to observe his capabilities over a longer time period. Also, further clarification is needed with regards to the level of analyst contribution to portfolio performance.
Terms & Conditions 2
Fees are average for an institutional small cap core mandate. Client service has been average.
Proprietary & Confidential
Rating Sheet Factor Rating Comments
Overall Rating Hold
We rate the Pyramis Small Cap Core strategy a Hold. While we believe that portfolio manager, Ethan Hugo, has demonstrated promise in his ability to navigate difficult market environments, we have reservations as it relates to the depth of the analyst support that he has access to. In addition, we believe that his track record on this strategy, as well as in portfolio management in general, is too short to use as a gauge for his capabilities in various market environments. This rating has the potential to be revised upward pending additional exposure to Mr. Hugo and members of his staff, as well as comfort achieved around the depth and magnitude of the analysts’ contribution.
Proprietary & Confidential
Manager Profile Overview Pyramis Global Advisors was formed by Fidelity in 2005 to focus on institutional
clients. The firm offers traditional long only equity, long-short equity, fixed income, and asset allocation strategies.
Since its inception, Pyramis has continued to launch new strategies in an attempt to offer a full suite of investment products to its current and potential institutional client base.
Business • During 2012, the firm introduced new hires at the management and senior
investment staff level. Earlier in the year, Michael Jones, who previously served as head of US asset management at Columbia Management Investment Advisers, was named Chair and President of Pyramis. In addition to Mr. Jones, a global head of consultant relations and distribution and a senior research lead (to be located in London) were hired. Both individuals are slated to begin their tenures during November 2012.
• In an effort to continue the expansion of its global capabilities, the firm is in the process of opening an office in Tokyo. This office will house a number of research staff who will support the firm’s global and international strategies.
• Pyramis continues to cater to a diverse client base, which includes defined benefit and contribution plans as well as endowments and foundations, Taft Hartley plans, and a number of sub-advisory relationships. Its total asset base also represents a wide range of equity, fixed income, and alternative mandates. 50% of its assets under management are equity mandates.
Client Base
Pyramis
Institutional
Retail
Sub-Advisory
Other
Firmwide AUM as of Sep 2012 : USD$190bn
Data sourced from eVestment Alliance
Pyramis
Global
US
International / EAFE
European (inc UK)
Japan
Dev. Asia / Pacif ic ex-Japan
Emerging marketData sourced from eVestment Alliance
Equity AUM as of Sep 2012 : USD$79.1bn
AUM totaled $190 billion as of September 30, 2012.
AUM for the small cap core strategy totaled $1.3 billion as of September 30, 2012.
Proprietary & Confidential
Investment Staff
Key Staff Position Date Joined Years of
Experience
Ethan Hugo Portfolio Manager 2005 17
Ethan Hugo is the sole portfolio manager for the small cap core strategy. Prior to assuming his portfolio management duties in 2008, he served as an analyst within the research team at Pyramis. Mr. Hugo is supported by individuals from various arms of the Fidelity/Pyramis organization, including members of the Fidelity global research and small cap teams, the Pyramis (general) research team, and the Pyramis small cap team. In addition, Mr. Hugo often relies on the Fidelity High Income Research team for additional analysis.
At present, the Pyramis Small Cap team is comprised of 6 dedicated research analysts and 3 portfolio managers. Of those 6 analysts, 3 are dedicated to the domestic strategies. The team is open to hiring opportunistically as there are certain sectors, such as information technology, consumers, healthcare, and financials that could use deeper coverage. However, Mr. Hugo prefers that the team remain small as to maximize efficiency and communication.
While Pyramis is an arm of the Fidelity organization, there are slight differences in how its research analysts approach the stock universe. The Fidelity analysts are segregated by sector and are tasked with the responsibility of assigning ratings to all stocks within their specific sectors. Conversely, Pyramis analysts, while also sector-specific in coverage, focus more on identifying best ideas within the stock universe for analysis as opposed to engaging in a ratings exercise.
Investment Process Process
Idea Generation - Stock ideas emerge from various channels, including (but not limited to) meetings with company management, industry conferences, individual networks, and quantitative screens. While the research analysts from both Fidelity and Pyramis teams are primarily responsible for identifying and ranking stock ideas within their respective sectors/universes, the portfolio manager will often participate in the exercise of identifying ideas. Generally, 500+ ideas become eligible for additional analysis. The majority of stock ideas are provided by the analyst teams and the quantitative screen(s). Ideas that are generally the most favorable are those that are undergoing a fundamental change that is largely underappreciated or unrecognized by the market, but that have the potential to drive upside potential. Fundamental Research – As with idea generation, the research analysts are responsible for conducting both the fundamental and valuation work on companies that look promising for investment. Within their respective sectors, analysts seek to gain a comprehensive view of a company, particularly its business structure and strategy, and will do so by conducting meetings with company affiliates, industry players, suppliers, competitors, and customers. In addition, analysts seek to understand the valuation of a company by utilizing various valuation methodologies. The portfolio manager generally participates alongside the analysts in their vetting of companies and will spend time learning overarching sector and industry trends, mainly for the purpose of building or adjusting expectations on stock ideas.
Proprietary & Confidential
Portfolio Construction - Ideas that emerge with the highest conviction from the fundamental research process are eligible for portfolio inclusion. The portfolio is constructed with a sector neutral approach where the portfolio’s risk exposures are similar to that of the Russell 2000 Index. The largest positions tend to be companies that are assigned the highest conviction by both the portfolio manager and the analysts, though weightings are driven by a combination of opinion, potential contribution to diversification, and liquidity. Typical portfolio contains 200-300 holdings with turnover ranging between 75%-125% per year.
Risk Management The portfolio is managed to the following constraints:
– Position size - +/- 1.75% of benchmark weight at time of purchase
– Sector exposure - +/- 2.50% relative to benchmark
– Tracking error – 300-500 basis points relative to benchmark
The portfolio is also subject to ongoing monitoring. Pyramis provides a proprietary risk management platform that allow for portfolio managers to view areas of risk on a real time and pre-/post-trade basis. On a quarterly basis, a chief investment officer meets with the portfolio manager to review the portfolio.
Operational Due Diligence
Pyramis Global Advisors Trust Company is registered with the State of New Hampshire Office of the Bank Commissioner and is regulated by this government entity as opposed to the Securities and Exchange Commission (SEC). The New Hampshire Banking division conducted a routine examination of Pyramis Global Advisors in May 2010. According to Pyramis, there were no material issues identified during the examination.
Pyramis does not have a COO. Pyramis does have a Governance, Risk, Compliance, and Treasury Group responsible for Pyramis' compliance program.
Pyramis Compliance is responsible for reviewing client guidelines and coding those guidelines into the firm's proprietary compliance monitoring system.
Pyramis does not disclose the number of trade errors, but the firm has an "Error Policy" to handle them appropriately and rapidly.
Pyramis has an appropriate disaster recovery plan (Business Continuity Plan) in place.
Terms & Conditions Separate Account (minimum of $50 million or local country equivalent):
First $25 million: 80 bps
Balance: 65 bps
Commingled Fund (minimum of $5 million or local country equivalent):
First $25 million: 80 bps
Balance: 65 bps
Proprietary & Confidential
Performance and Risk Metrics
Historic Performance (Inception: January 1995)
-50%-40%-30%-20%-10%
0%10%20%30%40%50%60%
2007
2008
2009
2010
2011
2012
YTD
Trai
ling
1-Y
ear
Trai
ling
3-Y
ear
Trai
ling
5-Y
ear
Sin
ceIn
cept
ion
Small Cap Core Russell 2000
Relative Return
Risk – Return
5 Years Ending 9/30/2012
Small Cap Core
Russell 2000
T-Bill
0.0
1.0
2.0
3.0
4.0
5.0
6.0
0.0
2.0
4.0
6.0
8.0
10.0
12.0
14.0
16.0
18.0
20.0
22.0
24.0
26.0
28.0
Risk (% p.a.)
Ret
urn
(% p
.a.)
`
Monthly Return and 12-Month Rolling Tracking Error
5 Years Ending 9/30/2012
-6.0%
-4.0%
-2.0%
0.0%
2.0%
4.0%
6.0%
Sep
-07
Dec
-07
Mar
-08
Jun-
08
Sep
-08
Dec
-08
Mar
-09
Jun-
09
Sep
-09
Dec
-09
Mar
-10
Jun-
10
Sep
-10
Dec
-10
Mar
-11
Jun-
11
Sep
-11
Dec
-11
Mar
-12
Jun-
12
Sep
-12
0.0%
2.0%
4.0%
6.0%
8.0%
10.0%
12.0%Monthly Relative Return (LHS)
Rolling 1-Year Tracking Error (RHS)
Proprietary & Confidential
Growth of $1,000 (Inception: January 1995)
800
1,800
2,800
3,800
4,800
5,800
6,800
1/1/
957/
1/95
1/1/
967/
1/96
1/1/
977/
1/97
1/1/
987/
1/98
1/1/
997/
1/99
1/1/
007/
1/00
1/1/
017/
1/01
1/1/
027/
1/02
1/1/
037/
1/03
1/1/
047/
1/04
1/1/
057/
1/05
1/1/
067/
1/06
1/1/
077/
1/07
1/1/
087/
1/08
1/1/
097/
1/09
1/1/
107/
1/10
1/1/
117/
1/11
1/1/
127/
1/12
Small Cap CoreRussell 2000T-Bill
Sector Allocation Quarter Ending 9/30/2012
0.0 5.0 10.0 15.0 20.0 25.0
Energy
Materials
Industrials
Cons. Disc.
Cons. Staples
Healthcare
Financials
IT
Telecom
Utilities
Cash & Other
Small Cap Core Russell 2000
Notes Composite performance (USD) is gross of fees and sourced from eVestment Alliance.
Ratings Explanation Below we describe the criteria which we use to rate fund management organizations and their specific investment products. Each criterion, except for Operational Due Diligence ("ODD"), is individually rated from 1 to 4, where:
1 = Weak 2 = Average 3 = Above Average 4 = Strong
The ODD factor can be assigned a Pass, Conditional Pass, or Fail rating and can be interpreted as follows:
Pass – Our research indicates that the manager has acceptable operational controls and procedures in place. Conditional Pass – We have specific concerns that the manager needs to address within a reasonable established timeframe. Fail – Our research indicates that the manager has critical operational weaknesses and we recommend that
Proprietary & Confidential
clients formally review the appointment.
An overall rating is then derived for the product from the individual ratings. We do not assign a fixed weight to each criterion to establish the overall rating; instead we consider each case individually. The overall rating score can be interpreted as follows:
Buy = We recommend purchase of this investment product Buy (Closed)
= We recommend purchase of this investment product, however it is closed to new investors
Hold = We recommend client investments in this product are maintained Sell = We recommend termination of client investments in this product In Review = The rating is under review as we evaluate factors that may cause us to change the current
rating.
The comments and assertions reflect our views of the specific investment product and our opinion of its strengths and weaknesses.
Disclaimer This document has been produced by the Global Investment Management Team of Aon plc. Nothing in this document should be treated as an authoritative statement of the law on any particular aspect or in any specific case. It should not be taken as financial advice and action should not be taken as a result of this document alone. Consultants will be pleased to answer questions on its contents but cannot give individual financial advice. Individuals are recommended to seek independent financial advice in respect of their own personal circumstances.
60 Queen Victoria Street London, EC4N 4TZ United Kingdom +44.20.7651.8200
United States
100 East Pratt Street Baltimore, MD 21202 United States +1.410.345.2000
Issued in the U.S.A. by T. Rowe Price Associates, Inc., 100 East Pratt Street, Baltimore, MD 21202, which is regulated by the U.S. Securities and Exchange Commission. The material is not intended to be a solicitation for any product or service not available to U.S. investors, including the T. Rowe Price Funds SICAV, and may be distributed only to institutional investors.Issued in Japan by T. Rowe Price International Ltd, Tokyo Branch (TRPILTB) (KLFB Registration No. 445 (Financial Instruments Service Provider), JIAA Membership No. 011-01162), located at NBF Hibiya Building 20F, 1-7, Uchisaiwai-cho 1-chome, Chiyoda-ku, Tokyo 100-0011. This material is intended for use by professional investors only and may not be disseminated without the prior approval of TRPILTB.Issued in Canada by T. Rowe Price (Canada), Inc. T. Rowe Price (Canada), Inc., enters into written delegation agreements with affi liates to provide investment management services. T. Rowe Price (Canada), Inc., is not registered to provide investment management business in all Canadian provinces. Our investment management services are only available to select clients in those provinces where we are able to provide such services. This material is intended for use by accredited investors only.Issued in Australia by T. Rowe Price International Ltd (TRPIL) (ABN 84 104 852 191), Level 50, Governor Phillip Tower, 1 Farrer Place, Suite 50B, Sydney, NSW 2000, Australia. TRPIL is exempt from the requirement to hold an Australian Financial Services license (AFSL) in respect of the fi nancial services it provides in Australia.TRPIL is authorized and regulated by the UK Financial Services Authority (the FSA) under UK laws, which differ from Australian laws. This material is not intendedfor use by Retail Clients, as defi ned by the FSA, or as defi ned in the Corporations Act (Australia), as appropriate.Issued in New Zealand by T. Rowe Price International Ltd (TRPIL). TRPIL is authorized and regulated by the UK Financial Services Authority under UK laws, which differ from New Zealand laws. This material is intended only for use by persons who are not members of the public, by virtue of section 3(2)(a)(ii) of the Securities Act 1978, and is not intended for public distribution nor as a solicitation for investments from members of the public. This material may not be redistributed without prior written consent from TRPIL.Issued in the Dubai International Financial Centre by T. Rowe Price International Ltd (TRPIL), 60 Queen Victoria Street, London EC4N 4TZ, which is authorized and regulated by the UK Financial Services Authority (the FSA). This material is communicated on behalf of TRPIL by the TRPIL Representative Offi ce, which is regulated by the Dubai Financial Services Authority (DFSA) as a Representative Offi ce. This material is not intended for use by Retail Clients, as defi ned by the FSA and DFSA. Retail Clients should not act upon information contained within this material.Issued in Hong Kong by T. Rowe Price Hong Kong Limited (TRPHK), 21/F, Jardine House, 1 Connaught Place, Central, Hong Kong, a Hong Kong limited company regulated by the Securities & Futures Commission. This material is intended for use by professional investors only and may not be redistributed without the prior approval of TRPHK.Issued in Switzerland by T. Rowe Price (Switzerland) GmbH (TRPSWISS), Talstrasse 65, 6th Floor, 8001 Zurich, Switzerland. This material is not intended for use by non-institutional clients and may not be redistributed without prior written consent from TRPSWISS.Issued outside of the U.S.A., Japan, Canada, Australia, New Zealand, DIFC, Switzerland, and Hong Kong by T. Rowe Price International Ltd, 60 Queen Victoria Street, London EC4N 4TZ, which is authorized and regulated by the UK Financial Services Authority (the FSA). This material is not intended for use by Retail Clients, as defi ned by the FSA.This material is provided pursuant to specifi c request. It is intended for informational purposes only and is not intended to be a solicitation for any T. Rowe Price products or services. Recipients are advised that T. Rowe Price shall not offer any products or services without an appropriate license or exemption from such license in the relevant jurisdictions. This material may not be redistributed without prior written consent from T. Rowe Price. The contents of this material have not been reviewed by any regulatory authority in any jurisdiction where this presentation is being made or by any other regulatory authority. This material does not constitute investment advice and should not be exclusively relied upon. Investors will need to consider their own circumstances before making an investment decision.T. Rowe Price, Invest With Confi dence, and the bighorn sheep logo are registered trademarks of T. Rowe Price Group, Inc., in the United States, European Union, Australia, Canada, Japan, and other countries. This material was produced in the United Kingdom.
1
T. Rowe Price — Presenters
Institutional Sales
John Masdea, CFA
Vice President – Institutional Sales
• 10 years of investment experience;
• 2 years with T. Rowe Price.
Portfolio Specialist
Ronald H. Taylor
Vice President — Portfolio Specialist: U.S. Equities
• 24 years of investment experience;
• 9 years with T. Rowe Price.
Table of Contents
2121805 (7/2012)
1 Overview
2 Investment Team and Process
3 Performance Review
4 Portfolio Review
5 Exhibits
• Additional Performance Information
• GIPS® Disclosure
• Fee Schedule
• Monitoring and Risk Management Elements
• Your Institutional Team
• Biographical Backgrounds
• Performance Statistics Glossary
6 F ull Portfolio Holdings
Table of Contents
3
Overview
4 14
• Financial Strength and Strategic Investment:
– Strong balance sheet with $2.2 billion in cash and mutual fund investment holdings and no outstanding long-term debt
– Steady growth in fi rm-wide assets to $576.8 billion under management,2 with a compound annual growth rate of 15.2%
in total AUM over 10 years
– Diversity of assets:
– U.S. Equity 60.2%, International Equity 12.8%, U.S. Fixed Income 20.9%, and International Fixed Income 6.1%3
– Institutional accounts represent over 50% of the fi rm’s assets under management
2 The combined assets under management of the T. Rowe Price group of companies. The T. Rowe Price group of companies includes T. Rowe Price Associates, Inc., T. Rowe Price International Ltd, T. Rowe Price Hong Kong Limited, T. Rowe Price Singapore Private Ltd., and T. Rowe Price (Canada), Inc.
3 Equity includes Balanced/Asset Allocation assets; International includes Global assets in addition to International assets.
0
50
100
150
200
250
300
350
400
450
2012201120102009200820072006200520042003
191202
237
330339
385
256
285
396
PMs, PM/Analysts, Portfolio Specialists
Analysts, Associate Analysts, Specialty Analysts
All Others
Inve
stm
ent
Pro
fess
ionals
4261
Continued Investment in Our Global Research Team Long Tenure Perpetuates Our Philosophy and Investment Approach
0 5 10 15 20 25 30
Portfolio Manager Average Tenure
15 years
20 years
22 years
27 years
Portfolio Manager Average Investment Experience
Management Committee Average Tenure
Management Committee Average Investment Experience
As of 31 December 2012
516
T. Rowe Price Update
1 The Toronto offi ce is a branch of T. Rowe Price (Canada), Inc.2 New products launched within existing investment strategies.3 As of December 31, 2012.
Thoughtful Expansion Building on Our Capabilities
2003 2004 2005 2006 2007
Copenhagen Amsterdam Zurich
Sydney
Luxembourg Toronto1
2001Target date
Strategies
Launched
U.S. Large-Cap
Core Growth2
Global Equity
Strategy Launched2
U.S. Large-Cap
Growth Strategy
Launched
2008 2009 20102000 2002Inst’l Floating
Rate, Global
Real Estate,
Global Large-Cap
Equity, Strategic Income
Strategies Launched
U.S. Large-Cap
Core, Global Multi-
Sector Strategies
Launched
Global Expansion of T. Rowe Price Sales Offices and Key Relationships
Key Product Launches
Africa &
Middle East
Strategy
Launched
First Chinese Mandate
San
Francisco
Global
Infrastructure
Strategy
Launched
2011
Dubai
20123
• Global Equity—Leveraging Our Global Research Capabilities to
Unlock the Best Ideas
– Global Collaboration: Worldwide network of over250 investment professionals
– Measured Growth: Broadened our portfolio of international and global equity investment offerings
– Continued Investment in Key Capabilities: Added to our proprietary global research resources
• Fixed Income—An Important Dimension to T. Rowe Price
– Experienced Professionals: Portfolio managers and analysts average 13 years of industry experience
– Multi-Sector Expertise: Successful and long-termtrack records in both specialized and broadmulti-sector strategies
– Strong Credit Research: Deep research team issuing credit ratings independent of rating agencies
– Global Collaboration: Global research and collaboration with Equity Division enhances our credit research
Providing global capabilities with local presence.
2 As of 31 December 2012
623
U.S. Large-Cap Growth Assets Under Management
Total U.S. Large-Cap Growth Equity Assets: $98.0 Billion1
As of 31 December 2012Figures Shown in U.S. Dollars
U.S. Large-Cap Growth Strategy Assets: $29.0 BillionAs of 31 December 2012Figures Shown in U.S. Dollars
1 The total U.S. large-cap growth equity assets of the T. Rowe Price group of companies.2 Corporate, Public, Non-Profi t, Taft-Hartley, Endowments/Foundations, and Sub-Advisory clients.3 Includes a U.S.-registered mutual fund and a common trust fund. This information is not intended to be an offer or solicitation of the sale of any product to any investor in which distribution or purchase is not authorized based on the investor’s domicile. The T. Rowe Price Mutual Funds are not registered for sale outside of the U.S. The T. Rowe Price Funds SICAV are Luxembourg-registered funds available to non-U.S. institutions domiciled in qualifying jurisdictions. The T. Rowe Price Common Trust Funds are Maryland-registered common trust funds available to ERISA qualifi ed retirement plans and certain governmental and church retirement plans.
Numbers may not total due to rounding.
Large-Cap Growth investing is a signifi cant business for T. Rowe Price.
U.S. Institutional Commingled Funds
$6,217.0M3
Non-U.S. Separate Accounts $10,427.7M
U.S. Separate Accounts $11,294.8M2
Non-U.S. Commingled Fund $1,016.6M
U.S. Large-Cap Core Growth Strategy
$29.1B
U.S. Large-Cap Growth Strategy
$29.0B
U.S. Growth Stock Strategy
$39.9B
As of 31 December 2012
Figures Shown in U.S. Dollars
As of 31 December 2012
Figures Shown in U.S. Dollars
7
• Objective
– Seeks to provide long-term capital appreciation by investing primarily in common stocks of large
growth companies.
• Mandate
– U.S. Large-Cap Growth Strategy: Separately Managed Portfolio
Strategy Assets as of 31 December 2012: $29.0 Billion
• Benchmark
– Russell 1000 Growth Index
Client Objective
Tucson Supplemental Retirement System
Total Assets = $61,077,350
Inception Date: 1 February 2012As of 31 January 2013
Figures Shown in U.S. Dollars
8
Investment Team and Process
97
U.S. Large-Cap Growth Investment Team
U.S. Large-Cap Growth Strategy
Portfolio Management Team
Stability | Depth | Collaboration
Robert W. Sharps, CFA1
Portfolio Manager (LCG) Joseph Fath, CPA
Associate Portfolio Manager (LCG)
Larry J. Puglia, CFA, CPA
Portfolio Manager (LCCG) Robert Bartolo, CFA, CPA
Portfolio Manager (GSF) Ronald H. Taylor
Portfolio Specialist Craig S. Watson, CPA
Portfolio Specialist
• 17 years of investment experience
• 15 years with T. Rowe Price
- BS, Towson University
- MBA, The Wharton School, University of Pennsylvania
• 12 years of investment experience
• 10 years with T. Rowe Price
- BS, University of Illinois, Urbana-Champaign
- MBA, The Wharton School, University of Pennsylvania
• 23 years of investment experience
• 22 years with T. Rowe Price
- BBA, University ofNotre Dame
- MBA, The Darden School, University of Virginia
• 15 years of investment experience
• 10 years with T. Rowe Price
- BS, University of Southern California
- MBA, The Wharton School, University of Pennsylvania
• 24 years of investment experience
• 9 years with T. Rowe Price
- BA, University of California, Los Angeles
- MBA, Harvard Business School
• 17 years of investment experience
• 5 years with T. Rowe Price
- BS, Hampton University
- MBA, The Wharton School, University of Pennsylvania
Equity Research Team
135 Research Analysts | Industry Specialists2
As of 31 December 2012
Extensive collaboration among investment professionals enhances idea generation.
1 Lead portfolio manager for U.S. Large-Cap Growth Strategy.2 8 sector portfolio managers, 96 analysts, 23 associate analysts, 5 quantitative analysts, and 3 specialty analysts as of 31 December 2012.
10 1
HEALTH CARE
Ziad Bakri, CFA, MD BALU.S. BiotechMark Bussard, MD BALMedtech, Dental, OrthopedicSimon Cheng, CFA HKGAsia Ex-Japan HC ServicesMelissa Gallagher, Ph.D. LONO.U.S. PharmaKris H. Jenner, MD, D. Phil1 BALU.S. Pharma & BiotechGraham M. McPhail BALHC ServicesPaul O’Sullivan SYDHospital Supply, Pharma, HC ServicesTaymour R. Tamaddon, CFA BALHospital Supply, Life Sciences and OphthalmologyJean-Pierre Thibaud, CFA LONLatAm HCRouven Wool-Lewis, Ph.D. BALHC ServicesJohn Xie HKGAsia HC Services (ex Pharma)
BUSINESS SERVICES
Andrew Fones BALIT Consulting, Staffi ng,EducationClark R. Shields BALTransaction Processors, Financial Services Related, Other
FINANCIAL SERVICES
Malik Asif LONAfrica & Middle East BanksHari Balkrishna LONCanada, Scandinavian, UK BanksJon Friar BALRegional BanksChristopher T. Fortune, CFA BALBanks (Smaller)/ThriftsNina Jones, CPA BALReal EstateYoichiro Kai, CMA SGPJapan Financials/Real EstateAden Lau SGPNon-Bank Financials,Infrastructure Finance David M. Lee, CFA1 BALReal EstateIan C. McDonald, CFA BALCanadian Ins Companies; Financial Exchanges, Life Ins.Jihong Min SGPSouth East Asia and Korea BankingEric C. Moffett HKGAsia Ex-Japan Real EstateSridhar Nishtala SGP Asia Ex-Japan InsPaul O’Sullivan SYDMajor & Regional Banks, Asset Managers, P&C & Speciality Ins, Speciality FinanceViral Patel SYDAustralian REITSFrederick Rizzo, CFA LONEuropean BanksMatt Snowling, CFA BALFinancial Services Companies Gabriel Solomon BALMulti-line, P&C InsMitchell Todd, CA LONEurope Ins/FinancialsEric L. Veiel, CFA1 BALAsset Managers, Investment Banks, Money Center BanksMarta Yago LONEuropean Real Estate, Asset Managers and Brokerage Firms, Rating Agencies
TECHNOLOGY
Kennard W. Allen1 BALHardware, SoftwareRhett K. Hunter BALSmid-Cap GeneralistJai Kapadia HKGAsia Ex-Japan Tech MaterialsShalin Mody, CFA BALSmid-Cap Telecom Equipment, SemiconductorsTobias Mueller LONEurope Semiconductors, SoftwareHiroaki Owaki, CFA TOKJapan GeneralistAdam Poussard, CFA BALSemiconductor Capital EquipmentJoshua K. Spencer, CFA1 BALSemiconductors & EquipmentThomas H. Watson, CFA BALSoftwareJustin P. White, CFA BALStorage, Network EquipmentNalin Yogasundram BALAlt EnergyAlison Yip HKGAsia Ex-Japan Generalist
MEDIA/TELECOM
Archibald Ciganer, CFA TOKJapan Media, Telecom ServicesJim Friedland BALMedia CompaniesPaul D. Greene BALAdv, Diversifi ed Media, Radio, TVRandal Jenneke1 SYDAustralia MediaRyan Martyn SYDAustralia/New Zealand TelecomDaniel Martino, CFA1 BALTelecom Services & CableCorey Shull, CFA BALMedia, InternetJustin P. White, CFA BALInternet Infrastructure, CableChristopher Whitehouse LONEurope Media, Telecom ServicesWenli Zheng HKGAsia Telecom, Internet
CONSUMER/RETAIL
Paulina Amieva LONLatin America & South Africa RetailFrancisco M. Alonso BALSoft Goods, Hard Goods, Discount Stores, Textiles, ApparelIra W. Carnahan, CFA BALSoft Goods, Toys, Nutrition, Diet and Direct Sellers, Outdoor EquipmentArchibald Ciganer, CFA TOKJapan ConsumerJessie Ding HKGConsumer DiscretionaryBarry Henderson BALHard Goods, Discount Stores, GamingRandal Jenneke1 SYDAustralia GamingMichael Lasota BALCruise Lines, Commercial Brokers, LodgingIan C. McDonald, CFA BALHousing Sridhar Nishtala SGPRetail, Consumer Products, LeisurePaul O’Sullivan SYDApparel & Footwear, Specialty RetailViral Patel SYDAustralia Food & Beverage RetailersRobert T. Quinn, Jr. BALFood, Beverage, Tobacco, Personal Care, Cosmetics, Conglomerates (Multi-Cap)Sebastian Schrott LONEuropean Retail and Luxury GoodsAmit Seth BALBranded Apparel, FootwearVivian Si BALSoft Good, Textiles, ApparelJonty Starbuck, CFA LONEurope Food, Beverage, Tobacco, Personal Care, Gaming, LodgingAshley R. Woodruff, CFA BALRestaurants, Supermarkets
INDUSTRIALS
Paulina Amieva LONLatin America AirlinesHari Balkrishna LONEurope Autos Sheena Barbosa, CFA HKGAsia Ex-Japan InfrastructurePeter J. Bates, CFA BALEnv Services, Ind Manufacturing, Agriculture Equipment, Capital Goods, Mega ConglomeratesJonathan Chou, CFA BALAuto Manufacturers, Distributors, Rental CarsArchibald Ciganer, CFA TOKJapan TransportAndrew Davis BALAirlines, Railroads, TruckingEric DeVilbiss, CFA BALAgricultureJin Jeong, CPA LONEurope Capital Goods, AutoJai Kapadia HKGAsia Ex-Japan ConglomeratesRyan Martyn SYDAustralia Building Materials Susanta Mazumdar1 SGPAsia Ex-Japan InfrastructureSridhar Nishtala SGPAirlinesCurt J. Organt, CFA BALSmid-Cap Generalist, DistributionAustin M. Powell, CFA TOKJapan Ind ManufacturingVivek Rajeswaran BALWaste ManagementDavid L. Rowlett, CFA BALAerospace and DefenseJeneiv Shah, CFA LONEastern Europe Autos, Transport, AirlinesJohn C. A. Sherman LONAerospace and Defense, Transport, LogisticsClark R. Shields BALAir Freight, LogisticsEunbin Song, CFA SGPSteel, Shipbuilding, E&C,Asia Ex-Japan Power EquipmentJohn Xie HKGAsia TransportChristopher Yip, CFA HKGAsia Ex-Japan Ind Manufacturing
NATURAL RESOURCES
Haider Ali SGPAsia Ex-Japan Oil and Gas, Mining, Non-ferrous MetalsMalik Asif LONMiddle East PetrochemicalsSheena Barbosa, CFA HKGAsia Ex-Japan UtilitiesRyan N. Burgess, CFA BALChemicals, UtilitiesArchibald Ciganer, CFA TOKJapan UtilitiesShawn T. Driscoll BALE&P, Coal, E&CShinwoo Kim BALEnergy ServicesJeremy Kokemor, CFA BALSmid-Cap MetalsSteven D. Krichbaum, CFA1 BALSmall-Cap Utilities Ben Landy BALE&C Fertilizer, Ind GasesRyan Martyn SYDAustralia Energy, Chemicals, E&PSusanta Mazumdar1 SGPAsia Ex-Japan Utilities, EnergyHeather K. McPherson1 BALPaper, Forest Products Timothy E. Parker, CFA1 BALEnergy Service, E&P, Global Energy MajorsCraig Pennington, CFA LONGlobal Energy Majors, E&P, Refi ningRick de los Reyes1 BALMetals & MiningNaoto Saito TOKE&C, Japan Energy, Chemicals, Trading Companies Ami Shah LONEurope UtilitiesJeneiv Shah, CFA LONEastern Europe Mid-Cap OilsThomas Shelmerdine SYDAustralia Metals & MiningJohn C. A. Sherman LONChemicalsJohn Williams, CFA BALEnergyNalin Yogasundram BALAlt Energy
REGIONAL GENERALISTS Ulle Adamson, CFA LONEMEA Martin Baylac BALatin America José Costa Buck1 BALatin America Simon Cheng, CFA HKGGreater China Small-Cap Luis Fananas LONEurope Small-CapVishnu Gopal HKGAsia Ex-Japan Small-CapBen Griffi ths, CFA LONEurope Small-Cap Leigh Innes, CFA1 LONEMEA GeneralistTetsuji Inoue TOKJapan Smid-Cap Jai Kapadia HKGIndia Small-CapMark Lawrence, CFA LONMiddle East and Africa Francisco Sersale BALatin America Miki Takeyama, CMA TOKJapan Smid-Cap Sin Dee Tan, CFA LONEurope Small-Cap Verena Wachnitz, CFA BALatin America Hiroshi Watanabe, CFA TOKJapan Smid-Cap
1 Also has portfolio management responsibilities.2 8 sector portfolio managers, 96 research analysts, 23 associate research analysts, 5 quantitative analysts, and 3 specialty analysts as of 31 December 2012. Highlighted names refl ect analysts with coverage responsibilities for portfolio holdings.
DIRECTOR OF GLOBAL EQUITYHEAD OF EQUITY RESEARCH
William J. Stromberg, CFA BAL
DIRECTORS OF EQUITY RESEARCH
Kamran Baig LONEMEA and Latin AmericaAnna M. Dopkin, CFA BAL North America
Charles G. Pepin BALNorth America Jason B. Polun, CFA BAL North America
Kes Visuvalingam, CFA SGPAsia
ASSOCIATE DIRECTORS OF EQUITY RESEARCH
Viral Patel SYD Australia
Eric C. Moffett HKG Asia
As of 1 January 2013
135 Equity Research Professionals worldwide.2
BAL Baltimore BA Buenos Aires LON London SYD Sydney SGP Singapore HKG Hong Kong TOK Tokyo
Equity Research Team As of 1 January 2013
119
• Analysts are industry specialists across capitalization and investment styles
– Evaluate impact of all competitors within an industry group
• Fundamental, bottom-up approach to company research
– Industry and company dynamics, management team quality, and fi nancial fundamentals are central considerations
• “Push/pull” relationship between Analysts and Portfolio Managers
– Multiple signaling tools communicate Analysts’ conviction and urgency
1 8 sector portfolio managers, 96 analysts, 23 associate analysts, 5 quantitative analysts, and 3 specialty analysts as of December 31, 2012. 31 December 2012.
15
Performance Review
16
Performance Summary
I. Market Overview
Fourth Quarter One Year
S&P 500 Index -0.38% 16.00%
Russell 1000 Growth Index -1.32 15.26
Russell 1000 Value Index 1.52 17.51
Nasdaq -3.10 15.91
Russell 2000 Index 1.85 16.35
• Markets struggled to hold gains for year
• Global economic growth remained muted
• Small-cap stocks outperformed large-caps
Past performance cannot guarantee future results.
II. Sector Performance Russell 1000 Growth Index
Fourth Quarter
Top Three Performers Bottom Three Performers
Industrials and Business Services Information Technology
Financials Utilities
Materials Consumer Staples
One Year
Top Three Performers Bottom Three Performers
Health Care Utilities
Financials Energy
Consumer Discretionary Consumer Staples
Major Absolute Contributors Major Absolute Detractors
Netflix Apple
Juniper Networks Google
Crown Castle International Express Scripts Holding
Precision Castparts Edwards Lifesciences
Gilead Sciences TIBCO Software
III. Portfolio Performance Fourth Quarter
Tucson Supplemental Retirement System
Major Purchases Major Sales
Lowe’s (N) Stryker (E)
Visa (N) UPS
Ecolab (N) Starbucks
Cognizant Technology Solutions Southwestern Energy (E)
Home Depot (N) Informatica (E)
IV. Signifi cant Trades Fourth Quarter
Tucson Supplemental Retirement System
Major Absolute Contributors Major Absolute Detractors
Apple Groupon
Crown Castle International Baidu
Gilead Sciences Atmel
Amazon.com TIBCO Software
MasterCard JPMorgan Chase
III. Portfolio Performance One Year
U.S. Large-Cap Growth Representative Portfolio1
V. Market Outlook
• Investors remain cautious amid economic growth and
The specifi c securities identifi ed and described above do not represent all of the securities purchased, sold, or recommended for the portfolio, and no assumptions should be made that the securities identifi ed and discussed were or will be profi table.The information shown does not refl ect any ETFs that may be held in the portfolio.
As of 31 December 2012
1 The representative portfolio is an account in the composite we believe most closely refl ects current portfolio management style for the strategy. Performance is not a consideration in the selection of the representative portfolio. The characteristics of the representative portfolio shown may differ from those of the composite and of the other accounts in the composite. Information regarding the representative portfolio and the other accounts in the composite is available upon request.
Supplemental information.
17
Total Return Performance
U.S. Large-Cap Growth CompositePeriods Ended 31 December 2012
Figures Shown in U.S. Dollars
1 Net of fees performance refl ects the deduction of the highest applicable management fee (Model Net Fee) that would be charged based on the fee schedule appropriate to you for this mandate, without the benefi t of breakpoints. Please be advised that the composite may include other investment products that are subject to management fees that are inapplicable to you but are in excess of the Model Net Fee. Therefore, the actual performance of all the portfolios in the composite on a net fee basis will be different and may be lower than the Model Net Fee performance. However, such Model Net Fee performance is intended to provide the most appropriate example of the impact management fees would have by applying management fees relevant to you to the gross performance of the composite. Past performance cannot guarantee future results.
Supplemental information. See “GIPS® Disclosure” for additional performance information.
Annualized
Three Months
Since Client Performance
Inception1 February 2012
One Year
Three Years
Five Years
SevenYears
TenYears
Tucson Supplemental Retirement System (Gross of Fees) -0.47% 10.93% N/A N/A N/A N/A N/A
Tucson Supplemental Retirement System (Net of Fees) -0.59 10.42 N/A N/A N/A N/A N/A
U.S. Large-Cap Growth Composite (Gross of Fees) -0.36 10.793 18.51% 10.99% 4.69% 5.66% 9.44%
U.S. Large-Cap Growth Composite (Net of Fees)1 -0.49 10.283 17.93 10.44 4.17 5.14 8.90
Russell 1000 Growth Index -1.32 8.77 15.26 11.35 3.12 5.16 7.52
Value Added (Gross of Fees)2 0.85 2.16 3.25 -0.36 1.57 0.50 1.92
2 Value Added is shown as the U.S. Large-Cap Growth Composite (Gross of Fees) versus the Russell 1000 Growth Index for all periods except for “Three Months” and “Since Client Performance Inception,” which is shown as the portfolio (Gross of Fees) versus the Russell 1000 Growth index.
Russell Investment Group is the source and owner of the trademarks, service marks, and copyrights related to the Russell Indexes. Russell® is a trademark of Russell Investment Group.3 Calculated from 31 January 2012 through 31 December 2012, as performance returns are run month end.
18
Attribution Analysis
Numbers may not add to 100% due to rounding; all numbers are percentages. Analysis represents the equity-only performance of the portfolio as calculated by the Wilshire Atlas attribution model and is exclusive of cash, trusts, mutual funds, de-listed securities, and other non-equity holdings. Returns will not match offi cial TRP performance because Wilshire uses different pricing and exchange rate sources and does not capture intra-day trading or fair-value pricing. Performance for each security is obtained in the local currency and, if necessary, is converted using an exchange rate determined by an independent third party.Source: Wilshire Atlas, MSCI/S&P GICS Sectors; Analysis by T. Rowe Price Associates, Inc. T. Rowe Price uses the MSCI/S&P Global Industry Classifi cation Standard (GICS) for sector and industry reporting. Each year, MSCI and S&P make changes to the GICS structure. The last change occurred on 1 July 2010.T. Rowe Price will adhere to all future updates to GICS for prospective reporting.Figures are shown gross of fees.Past performance cannot guarantee future results.
Tucson Supplemental Retirement System vs. Russell 1000 Growth IndexThree Months Ended 31 December 2012
– Stock selection in the sector contributed to relative performance during the quarter.
– Shares of NFLX were up sharply during the quarter as video streaming traffi c data indicate they are keeping competitors at bay. In addition, the company announced an exclusive deal to carry Disney movies.
Telecommunication Services
– Stock selection contributed to relative results as CCI, our only holding in the sector, continued to benefi t from demand for higher data capacity to support smartphone and tablet technology.
Industrials and Business Services
– Stock selection and an overweight position to the best performing sector in the index helped relative performance during the quarter.
– Aerospace names were among the top performers, as PCP announced in November it will be acquiring Titanium Metals, and UAL benefi tted from lower fuel prices further integration of United and Continental.
• DETRACTORS:
Health Care
– Stock selection hurt relative performance.
– After a strong run, EW shares pulled back on a reduction in the number of a specifi c type of cardiovascular procedure being performed by surgeons. ESRX was another poor performer, after they released a negative 2013 outlook, driven by persistently high unemployment and a weak business climate.
Financials
– Our underweight to the sector hurt relative performance as fi nancials was the second-best performing sector in the index. The sector was helped by banks continuing to improve their balance sheets, and a slight ease in lender restrictions that helped boost consumer loan demand.
The information shown does not refl ect any ETFs that may be held in the portfolio.The specifi c securities mentioned above comprised 8.4% of the portfolio as of 31 December 2012.
20
Attribution Analysis
U.S. Large-Cap Growth Representative Portfolio1 vs. Russell 1000 Growth IndexOne Year Ended 31 December 2012
Figures Shown in U.S. Dollars
Numbers may not add to 100% due to rounding; all numbers are percentages. Analysis represents the equity-only performance of the portfolio as calculated by the Wilshire Atlas attribution model and is exclusive of cash, trusts, mutual funds, de-listed securities, and other non-equity holdings. Returns will not match offi cial TRP performance because Wilshire uses different pricing and exchange rate sources and does not capture intra-day trading or fair-value pricing. Performance for each security is obtained in the local currency and, if necessary, is converted using an exchange rate determined by an independent third party.Source: Wilshire Atlas, MSCI/S&P GICS Sectors; Analysis by T. Rowe Price Associates, Inc. T. Rowe Price uses the MSCI/S&P Global Industry Classifi cation Standard (GICS) for sector and industry reporting. Each year, MSCI and S&P make changes to the GICS structure. The last change occurred on 1 July 2010.T. Rowe Price will adhere to all future updates to GICS for prospective reporting.Figures are shown gross of fees.Past performance cannot guarantee future results.
1 The representative portfolio is an account in the composite we believe most closely refl ects current portfolio management style for the strategy. Performance is not a consideration in the selection of the representative portfolio. The characteristics of the representative portfolio shown may differ from those of the composite and of the other accounts in the composite. Information regarding the representative portfolio and the other accounts in the composite is available upon request.
– Stock selection drove relative outperformance, as our only holding, CCI, benefi tted from demand for higher wireless data capacity due to the consumer adoption of smartphones and tablet computers.
Health Care
– Stock selection and an overweight position to the best-performing sector in the index contributed to relative performance. – Our biotechnology holdings performed well, as GILD advanced trials of its hepatitis C treatment, bringing the product closer to market, and HGSI received a take-out offer at a signifi cant premium.
Consumer Staples
– The sector remains our largest underweight (-11%), which helped relative performance in the period as investors favored more cyclical names.
– We maintain a relatively small exposure to the consumer staples sector, as most companies do not offer the potential for double-digit earnings growth over the long term, in our view.
Information Technology
– An overweight position and stock selection contributed to strong relative performance, driven by computers and peripherals company AAPL, and our software, and internet software and services holdings (CRM, EBAY, LNKD).
– We continue to favor companies driven by the convergence of communications & computing, and to avoid those legacy companies not well positioned for this trend (CSCO, ORCL, HPQ).
• DETRACTORS:
Financials
– Stock selection was negative during the period, led by JPM, which suffered heavy trading losses in May. AMTD struggled with other online brokers as persistent low interest rates and low trading volumes have led to a decline in profi t.
– Our underweight position also hurt relative performance, as the sector was helped by banks continuing to improve their balance sheets, and easing lender restrictions that helped boost consumer loan demand.
Industrials and Business Services
– Stock selection was negative during the period, but was partially mitigated by an overweight position. – Shares of BA were up modestly, but underperformed the broader industrials sector during 2012. Although the company faced labor issues and some technical problems with its 787 Dreamliner, the backlog for new commercial aircraft orders remains strong going into 2013.
The information shown does not refl ect any ETFs that may be held in the portfolio.The specifi c securities mentioned above comprised 20.7% of the fund as of December 31, 2012.The specifi c securities mentioned above comprised 20.7% of the portfolio as of 31 December 2012.
22
Total Return Performance
Percent
Composite Outperformance
Composite Underperformance
U.S
. Larg
e-C
ap G
row
th C
om
posi
te-40 -30 -20 -10 10 20 30 40
-40
-30
-20
-10
0
10
20
30
40
Russell 1000 Growth Index
Three-Year Rolling Quarterly Returns (Annualized Gross of Fees) —
U.S. Large-Cap Growth Composite vs. Russell 1000 Growth IndexCalculated Quarterly from 31 December 2002 to 31 December 2012
Figures Shown in U.S. Dollars
Each point represents the performance of the composite and its benchmark for a 3-year annualized period. Points above the diagonal represent outperformance relative to the benchmark. Points below the diagonal represent relative underperformance. Figures shown gross of fees. Returns would have been lower as the result of the deduction of applicable fees. Past performance cannot guarantee future results.Supplemental information.
23
Total Return Performance
Russell 1000
Growth Index
U.S. Large-Cap
Growth Composite
Average Annual Standard Deviation (%)
Ave
rage A
nnual R
etu
rn (%
)
12 14 16 18
4
6
8
10
Risk/Return Characteristics10 Years Ended 31 December 2012
Figures Shown in U.S. Dollars
Statistics are based on monthly gross returns. Returns would have been lower as the result of the deduction of applicable fees. Past performance cannot guarantee future results.Supplemental information.
10 Years
U.S. Large-CapGrowth Composite
Russell 1000Growth Index
Annualized Total Return 9.44% 7.52%
Annualized Standard Deviation 17.13% 15.00%
Historical Tracking Error 4.24% 0.00%
Beta 1.11 1.00
R-Squared 0.95 1.00
Alpha 1.37% 0.00%
Sharpe Ratio 0.45 0.39
Information Ratio 0.36 0.00
24
Po rtfolio Review
25
Portfolio Snapshot As of 31 December 2012, Market Capitalizations Shown in U.S. Dollars
Company % of Portfolio
Apple 8.6%
Google 4.9
Amazon.com 4.0
Danaher 3.0
Gilead Sciences 2.7
priceline.com 2.7
MasterCard 2.6
Crown Castle International 2.5
Juniper Networks 2.4
Qualcomm 2.3
Total 35.8%
Tucson Supplemental Retirement System Russell 1000 Growth Index
Projected Earnings Growth Rate1 16.8% 12.5%
Price to Earnings (12 Months Forward)1 18.9X 15.4X
Investment Weighted Average Market Capitalization (Millions) $86,076 $100,067
Number of Holdings 70 571
20 Largest Holdings 55% 38%
Portfolio Turnover (Last 3 Months) 8.5% N/A
Top 10 Holdings
Portfolio Characteristics
Sector Weightings
1 Source: IBES. The specifi c securities identifi ed and described above do not represent all of the securities purchased, sold, or recommended for the portfolio, and no assumptions should be made that the securities identifi ed and discussed were or will be profi table.
The information shown does not refl ect any ETFs that may be held in the portfolio. Numbers may not total due to rounding. Statistics are investment-weighted median unless otherwise noted.
T. Rowe Price uses the MSCI/S&P Global Industry Classifi cation Standard (GICS) for sector and industry reporting. Each year, MSCI and S&P make changes to the GICS structure. The last change occurred on 1 July 2010. T. Rowe Price will adhere to all future updates to GICS for prospective reporting.
-20
-10
0
10
20
30
40
UtilitiesTelecom
Services
MaterialsInfo.
Tech.
Indust. &
Bus. Servs.
Health
Care
FinancialsEnergyConsmr.
Staples
Consmr.
Disc.
Over/UnderweightingRussell 1000 Growth IndexTucson Supplemental Retirement System
Percent
26
10 Largest Over/Underweights
Tucson Supplemental Retirement System Relative to the Russell 1000 Growth Index As of 31 December 2012
The specifi c securities identifi ed and described above do not represent all of the securities purchased, sold, or recommended for the portfolio, and no assumptions should be made that the securities identifi ed and discussed were or will be profi table.
The information shown does not refl ect any ETFs that may be held in the portfolio. Numbers may not total due to rounding.
10 Largest
Overweights
% of
Portfolio
% of
Index Difference
Danaher 3.0% 0.2% 2.9%
Amazon.com 4.1 1.3 2.8
Juniper Networks 2.4 0.0 2.4
Google 4.9 2.6 2.3
priceline.com 2.7 0.4 2.2
Crown Castle International 2.5 0.3 2.2
Carnival 2.1 0.0 2.1
Gilead Sciences 2.7 0.8 1.9
MasterCard 2.6 0.8 1.9
McKesson 2.0 0.3 1.7
10 Largest
Underweights
% of
Portfolio
% of
Index Difference
IBM 0.0% 3.0% -3.0%
Microsoft 0.0 2.9 -2.9
Coca-Cola 0.0 2.0 -2.0
Philip Morris International 0.0 1.9 -1.9
Oracle 0.0 1.8 -1.8
Verizon Communications 0.0 1.7 -1.7
PepsiCo 0.0 1.5 -1.5
Abbott Laboratories 0.0 1.4 -1.4
Schlumberger 0.0 1.3 -1.3
Wal-Mart 0.0 1.3 -1.3
27
Portfolio by Market Capitalization
The specifi c securities identifi ed and described above do not represent all of the securities purchased, sold, or recommended for the portfolio, and no assumptions should be made that the securities identifi ed and discussed were or will be profi table.The information shown does not refl ect any ETFs that may be held in the portfolio.Numbers may not total due to rounding.
Tucson Supplemental Retirement System As of 31 December 2012
Market Capitalizations Shown in U.S. Dollars
$0 - $10 Billion
12%
$10 - $25 Billion
29%
$25 - $50 Billion
23%
$50+ Billion
37%
Akamai Technologies
Atmel
Catamaran
Chipotle Mexican Grill
Cimarex Energy
Dollar Tree
D. R. Horton
Fossil
IHS
Monster Beverage
Netflix
Nuance Communications
TD Ameritrade Holding
TIBCO Software
TSC
United Continental
Alexion Pharmaceuticals
Broadcom
Cognizant Technology Solutions
Crown Castle International
Ecolab
Edwards Lifesciences
Fastenal
Juniper Networks
Liberty Global
LinkedIn
McKesson
Michael Kors Holdings
Pioneer Natural Resources
Rackspace Hosting
Ralph Lauren
Range Resources
Red Hat
Regeneron Pharmaceuticals
Salesforce.com
SanDisk
Sherwin-Williams
Starwood Hotels & Resorts Worldwide
Valeant Pharmaceuticals International
Whole Foods Market
Williams Companies
Baidu
Biogen Idec
Carnival
Celgene
Danaher
EOG Resources
Express Scripts Holding
Franklin Resources
Las Vegas Sands
Lowe’s
Praxair
Precision Castparts
priceline.com
Starbucks
Amazon.com
Apple
Boeing
eBay
EMC
Facebook
Gilead Sciences
Google
Home Depot
MasterCard
Qualcomm
Union Pacific
UnitedHealth Group
UPS
Visa
The securities mentioned above represent 100% of the publicly traded common equity securities held by the portfolio.
28
Market Capitalization Range
Tucson Supplemental Retirement System As of 31 December 2012
Market Capitalizations Shown in U.S. Dollars
0
12
24
36
48
60
$50+$25-$50$10-$25$0-$10
Russell 1000 Growth Index
Tucson Supplemental Retirement System
Percent
Billions
29
Exhibits
Additional Performance Information
GIPS® Disclosure
Fee Schedule
Monitoring and Risk Management Elements
Your Institutional Team
Biographical Backgrounds
Performance Statistics Glossary
3014
Total Return Performance
U.S. Large-Cap Growth CompositePeriods Ended 31 December 2012Figures Shown in U.S. Dollars
1 Net of fees performance refl ects the deduction of the highest applicable management fee (Model Net Fee) that would be charged based on the fee schedule appropriate to you for this mandate, without the benefi t of breakpoints. Please be advised that the composite may include other investment products that are subject to management fees that are inapplicable to you but are in excess of the Model Net Fee. Therefore, the actual performance of all the portfolios in the composite on a net fee basis will be different and may be lower than the Model Net Fee performance. However, such Model Net Fee performance is intended to provide the most appropriate example of the impact management fees would have by applying management fees relevant to you to the gross performance of the composite. Past performance cannot guarantee future results.
Supplemental information. See “GIPS® Disclosure” for additional performance information.
Annualized
Three Months
One Year
Three Years
Five Years
SevenYears
TenYears
U.S. Large-Cap Growth Composite (Gross of Fees)
-0.36% 18.51% 10.99% 4.69% 5.66% 9.44%
U.S. Large-Cap GrowthComposite (Net of Fees)1 -0.49 17.93 10.44 4.17 5.14 8.90
Russell 1000 Growth Index -1.32 15.26 11.35 3.12 5.16 7.52
Value Added (Gross of Fees) 0.96 3.25 -0.36 1.57 0.50 1.92
U.S. Large-Cap GrowthComposite (Net of Fees)1 38.24 10.80 7.84 6.35 8.87 -40.70 53.54 16.19 -1.68 17.93
Russell 1000 Growth Index 29.75 6.30 5.26 9.07 11.81 -38.44 37.21 16.71 2.64 15.26
Value Added (Gross of Fees) 9.16 5.05 3.12 -2.19 -2.40 -1.95 17.07 0.06 -3.83 3.25
Russell Investment Group is the source and owner of the trademarks, service marks, and copyrights related to the Russell Indexes. Russell® is a trademark of Russell Investment Group.
3124
Attribution Analysis
U.S. Large-Cap Growth Representative Portfolio1 vs. Russell 1000 Growth IndexFive Years Ended 31 December 2012Figures Shown in U.S. Dollars
Numbers may not add to 100% due to rounding; all numbers are percentages. Analysis represents the equity-only performance of the portfolio as calculated by the Wilshire Atlas attribution model and is exclusive of cash, trusts, mutual funds, de-listed securities, and other non-equity holdings. Returns will not match offi cial TRP performance because Wilshire uses different pricing and exchange rate sources and does not capture intra-day trading or fair-value pricing. Performance for each security is obtained in the local currency and, if necessary, is converted using an exchange rate determined by an independent third party.Source: Wilshire Atlas, MSCI/S&P GICS Sectors; Analysis by T. Rowe Price Associates, Inc. T. Rowe Price uses the MSCI/S&P Global Industry Classifi cation Standard (GICS) for sector and industry reporting. Each year, MSCI and S&P make changes to the GICS structure. The last change occurred on 1 July 2010.T. Rowe Price will adhere to all future updates to GICS for prospective reporting.Figures are shown gross of fees.Past performance cannot guarantee future results.
1 The representative portfolio is an account in the composite we believe most closely refl ects current portfolio management style for the strategy. Performance is not a consideration in the selection of the representative portfolio. The characteristics of the representative portfolio shown may differ from those of the composite and of the other accounts in the composite. Information regarding the representative portfolio and the other accounts in the composite is available upon request.
Numbers may not add to 100% due to rounding; all numbers are percentages. Analysis represents the equity-only performance of the portfolio as calculated by the Wilshire Atlas attribution model and is exclusive of cash, trusts, mutual funds, de-listed securities, and other non-equity holdings. Returns will not match offi cial TRP performance because Wilshire uses different pricing and exchange rate sources and does not capture intra-day trading or fair-value pricing. Performance for each security is obtained in the local currency and, if necessary, is converted using an exchange rate determined by an independent third party.Source: Wilshire Atlas, MSCI/S&P GICS Sectors; Analysis by T. Rowe Price Associates, Inc. T. Rowe Price uses the MSCI/S&P Global Industry Classifi cation Standard (GICS) for sector and industry reporting. Each year, MSCI and S&P make changes to the GICS structure. The last change occurred on 1 July 2010.T. Rowe Price will adhere to all future updates to GICS for prospective reporting.Figures are shown gross of fees.Past performance cannot guarantee future results.
U.S. Large Cap Growth Representative Portfolio1 vs. Russell 1000 Growth Index10 Years Ended 31 December 2012
Figures Shown in U.S. Dollars
Sector
-1
0
1
2
3Valu
e A
dded -
Perc
ent
Total Value Added
Value Added from
Sector Weight
Value Added from
Stock Selection
1 The representative portfolio is an account in the composite we believe most closely refl ects current portfolio management style for the strategy. Performance is not a consideration in the selection of the representative portfolio. The characteristics of the representative portfolio shown may differ from those of the composite and of the other accounts in the composite. Information regarding the representative portfolio and the other accounts in the composite is available upon request.
# of Accts. in Comp. 2 8 12 35 48 45 42 45 46 51Total Firm Assets (Billions) 188.0 234.7 268.9 333.8 397.5 275.7 395.2 485.0 493.1 579.81Reflects deduction of highest applicable fee schedule without benefit of breakpoints. Investment return and principal value will vary. Past performance cannot guarantee future results. See below for further information related to net of fee calculations.
T. Rowe Price (“TRP”) has prepared and presented this report in compliance with the Global Investment Performance Standards (GIPS®). TRP has been independently verified for the 10-year period ended June 30, 2012 by KPMG LLP. The verification report is available upon request. Verification assesses whether (1) the firm has complied with all the composite construction requirements of the GIPS standards on a firm-wide basis and (2) the firm's policies and procedures are designed to calculate and present performance in compliance with the GIPS standards. Verification does not ensure the accuracy of any specific composite presentation. TRP is a U.S. investment management firm with various investment advisers registered with the U.S. Securities and Exchange Commission, the U.K. Financial Services Authority, and other regulatory bodies in various countries and holds itself out as such to potential clients for GIPS purposes. TRP further defines itself under GIPS as a discretionary investment manager providing services primarily to institutional clients with regard to various mandates, which include U.S., international, and global strategies but excluding the services of the Private Asset Management group. The minimum asset level for equity portfolios to be included in composites is $5 million and prior to January 2002 the minimum was $1 million. The minimum asset level for fixed income and asset allocation portfolios to be included in composites is $10 million; prior to October 2004 the minimum was $5 million; and prior to January 2002 the minimum was $1 million. Valuations are computed and performance reported in U.S. dollars. Gross performance returns are presented before management and all other fees, where applicable, but after trading expenses. Net of fees performance reflects the deduction of the highest applicable management fee that would be charged based on the fee schedule appropriate to you for this mandate, without the benefit of breakpoints. Gross and net performance returns are net of nonreclaimable withholding taxes on dividends, interest income, and capital gains. Policies for valuing portfolios, calculating performance, and preparing compliant presentations are available upon request. Dispersion is measured by the standard deviation across asset-weighted portfolio returns represented within a composite for the full year. Dispersion is not calculated for the composites in which there are five or fewer portfolios. Some portfolios may trade futures, options, and other potentially high-risk derivatives which generally represent less than 10% of a portfolio. Benchmarks are taken from published sources and may have different calculation methodologies, pricing times, and foreign exchange sources from the composite. Composite policy requires the temporary removal of any portfolio incurring a client initiated significant cash inflow or outflow greater than or equal to 25% of portfolio assets. The temporary removal of such an account occurs at the beginning of the measurement period in which the significant cash flow occurs and the account re-enters the composite on the last day of the current month after the cash flow. Additional information regarding the treatment of significant cash flows is available upon request.
The firm's list of composite descriptions and/or a presentation that adheres to the GIPS® standards are available upon request.
34
The U.S. Large-Cap Growth Composite seeks long-term capital appreciation by investing primarily in common stocks of large-cap growth companies based in the U.S.(Created June 2006)
First $50 million 50 basis points
Next $50 million 45 basis points
Above $100 million 40 basis points on all assets1
Above $200 million 35 basis points on all assets1
Minimum separate account size $50 million
U.S. Large-Cap Growth Composite As of Current Quarter-End Figures Shown in U.S. Dollars
1 A transitional credit is applied to the fee schedule as assets approach or fall below the breakpoint.
Fee Schedule
As of 31 December 2012
Figures Shown in U.S. Dollars
3525
• Equity Steering Committee Oversight
– Periodic review by senior investment professionals promotes consistency of the strategy’s investment process and portfolio construction.
• Quantitative Risk Management Tools
– Wilshire Variance Analysis enables portfolio managers to review performance attribution versus benchmarks from a holdings-based perspective.
– Barra risk analysis provides managers with a common risk factor tool to analyze their strategy versus a benchmark.
– Zephyr returns-based style analysis allows portfolio managers to analyze the style and size consistency of their strategy versus a benchmark.
Monitoring and Risk Management Elements
36
Your Institutional Team
David B. OrlandoInstitutional Client Service ExecutivePhone: 415-772-1103 Fax: 415-772-1111E-mail: [email protected]
Tucson Supplemental Retirement System
Your client service team is your partner in getting you the information you need.
John D. Plowright, CFA Institutional Client Service Executive Phone: 415-772-1117 Fax: 415-772-1111 E-mail: [email protected]
Dawn WilliamsonInstitutional Client Operations ManagerPhone: 410-345-2544 Fax: 410-345-2829E-mail: [email protected]
Operations:
Addresses contributions and distributions to andfrom your account, works closely with your primaryclient service contact and investment support toresolve operational issues, and coordinates review oflegal agreements.
Primary Contact:
Secondary Contact:
37
Ronald Taylor
Ron Taylor is a portfolio specialist in the Equity Division of T. Rowe Price. He is a member of the U.S. Large-Cap Growth
strategy team working closely with institutional clients, consultants, and prospects. Mr. Taylor is a vice president of
T. Rowe Price Group, Inc.
Mr. Taylor has 24 years of investment experience, nine of which have been at T. Rowe Price. Prior to joining the fi rm in 2003,
he was employed by Zurich Scudder Investments as an equity product specialist and later as the director of Institutional
Client Service. Ron also previously worked for Chancellor Capital Management as an equity product specialist and at Putnam
Investments as an equity analyst and later in new business development and client service. He began his career as a
high-yield bond analyst at Columbia Savings & Loan.
Mr. Taylor earned a B.A. in economics from the University of California, Los Angeles, and an M.B.A. from
Harvard Business School.
John F. Masdea, CFA
John Masdea is a vice president of T. Rowe Price Group, Inc., and T. Rowe Price Associates, Inc. He is a U.S. institutional
sales executive for Global Investment Services, the organization responsible for the fi rm’s institutional business worldwide.
Mr. Masdea has 10 years of experience in institutional investment management sales. Prior to joining T. Rowe Price in 2010,
he was vice president of institutional sales for RS Investments.
John earned an M.B.A. from Oxford University, and a B.S. in physiology from the University of Southern California. He is a
series 6 and 63 registered representative and has earned the Chartered Financial Analyst designation.
Biographical Backgrounds
T. Rowe Price — Presenters
381
Alpha – A measure of a strategy’s risk-adjusted performance. Alpha represents the difference between a strategy’s actual returns and its expected performance, given its level of risk as measured by beta. The difference is expressed as an annualized percentage.
Beta – A measure of the market risk of a strategy showing how responsive the strategy is to a given market index, such as the S&P 500 Index (an index for equity strategies) or the Barclays Government/Corporate Bond Index (an index for fi xed income strategies). By defi nition, the beta of the benchmark index is 1.00. A strategy with a 1.10 beta is expected to perform 10% better than the index in up markets and 10% worse in down markets. Usually, higher betas represent riskier investments.
Earnings Growth Rate (Current Fiscal Year) – Measures the annualized percent change in earnings per share from the prior fi scal year to the current fi scal year.
Historical Tracking Error – Standard deviation of the strategy’s excess return over the market benchmark.
Information Ratio – A measure of the signifi cance or quality of alpha. It is defi ned as the ratio of alpha to the standard deviation of alpha. A larger number is better – either a very strong alpha score or a consistent alpha with low standard deviation.
Market Capitalization – A measure of a company’s total value and is equal to the total dollar value of all outstanding shares.
Median – Represents the midpoint of market capitalization of stocks in a portfolio where 50% of holdings are above the value.Investment-Weighted Median – Represents the breakpoint where 50% of the weights are above the value. Investment-Weighted Average – Sum of each holding’s market capitalization multiplied by its weight in the portfolio.
Price to Book Ratio – Used to compare a stock’s market value to its book value. It is calculated by dividing the current closing price of the stock by the latest quarter’s book value (book value is simply total assets minus intangible assets and liabilities).
Price-to-Earnings Ratio (12 Months Forward) – P/E is a valuation measure calculated by dividing the price of a stock by the analysts’ forecast of the next 12 months expected earnings. The ratio is a measure of how much investors are willing to pay for the company’s future earnings. The higher the P/E, the more investors are paying for a company’s earnings growth in the next 12 months.
Price-to-Earnings Ratio (Current Fiscal Year) – P/E is a valuation measure calculated by dividing the price of a stock by its reported earnings per share from the latest fi scal year. The ratio is a measure of how much investors are willing to pay for the company’s earnings. The higher the P/E, the more investors are paying for a company’s current earnings.
Price-to-Earnings Ratio (Next Fiscal Year) – P/E is a valuation measure calculated by dividing the price of a stock by its estimated earnings for the next fi scal year. The ratio is a measure of how much investors are willing to pay for the company’s future earnings. The higher the P/E, the more investors are paying for the company’s expected earnings growth in the next fi scal year.
Projected Earnings Growth Rate (IBES) – A company’s expected earnings per share growth rate for a given time period based on the forecast from the Institutional Broker’s Estimate System, which is commonly referred to as IBES.
Return on Equity (Current Fiscal Year) – ROE is a valuation measure calculated by dividing the company’s current fi scal year net income by shareholders’ equity (i.e., the company’s book value). Return on equity measures how much a company earns on each dollar that common stock investors have put into the company. It indicates how effectively and effi ciently a company and its management are using stockholder investments.
R-Squared – Measures the percentage of a strategy’s movement that is explained by movements in the benchmark index. R-Squared helps indicate the accuracy of a strategy’s alpha and beta.
Sharpe Ratio – A risk-adjusted measure, which is calculated using standard deviation and excess return to determine reward per unit of risk. The higher the Sharpe ratio, the better the strategy’s historical risk-adjusted performance.
Standard Deviation – Indicates the volatility of a strategy’s total returns as measured against its mean performance. Unlike alpha, beta, and R-Squared, which are compared with a benchmark index, standard deviation is strategy-specifi c. In general, the higher the standard deviation, the greater the volatility or risk.
Turnover – A measurement of how frequently assets within a fund are bought and sold by the managers.