1,2,3-TCP MIT 11/5/201 CITY OF TULARE TIGATION FEASIBILITY ST Nov P P Provost & Pritchard Co Fre 14 TUDY vember, 2014 Prepared for: City of Tulare Prepared by: onsulting Group esno, California
Transcript
1,2,3-TCP MITIGATION FEASIBILITY STUDY
11/5/2014
CITY OF TULARE
TCP MITIGATION FEASIBILITY STUDY
November
Prepared for:
Prepared by:
Provost & Pritchard ConsultingFresno
/2014
TCP MITIGATION FEASIBILITY STUDY
November, 2014
Prepared for:
City of Tulare
Prepared by:
Consulting Group Fresno, California
COPYRIGHT 2014 by PROVOST & PRITCHARD CONSULTING GROUP ALL RIGHTS RESERVED
Provost & Pritchard Consulting Group expressly reserves its common law copyright and other applicable property rights to this document. This document is not to be reproduced, changed, or copied in any form or manner whatsoever, nor are they to be assigned to a third party without first obtaining the written permission and consent of Provost & Pritchard Consulting Group. In the event of unauthorized reuse of the information contained herein by a third party, the third party shall hold the firm of Provost & Pritchard Consulting Group harmless, and shall bear the cost of Provost & Pritchard Consulting Group's legal fees associated with defending and enforcing these rights.
1,2,3-TCP MITIGATION FEASIBILITY STUDY CITY OF TULARE
iii Provost & Pritchard Consulting Group G:\Clients\Tulare_City of-1543\15431401-123-TCP Feasibility Study\_DOCUMENTS\Reports\Tulare TCP Feasibility Study.docx
GPM .................................................................................................................................. Gallons per Minute
MCL .................................................................................................................. Maximum Contaminant Level
MDD .......................................................................................................................... Maximum Day Demand
MGD ........................................................................................................................... Million Gallons per Day
mg/L ................................................................................................................................. Milligrams Per Liter
NOM ......................................................................................................................... Naturally Organic Matter
NTU ................................................................................................................. Nephelometric Turbidity Units
PHG ................................................................................................................................... Public Health Goal
PSI ............................................................................................................................ Pounds per Square Inch
TID .............................................................................................................................. Tulare Irrigation District
TOC .............................................................................................................................. Total Organic Carbon
The volatile organic compound (VOC) 1,2,3-trichloropropane (TCP) has been detected in half of the City of Tulare’s wells. The City has requested that Provost & Pritchard evaluate alternatives to mitigate the impact of the TCP contamination on the water system and determine the cost to implement the most feasible mitigation alternative.
In August 2009, the California Office of Environmental Health Hazard Assessment (OEHHA) established a California Public Health Goal (PHG) for TCP of 0.0007 µg/L (0.7 parts per trillion) based on carcinogenicity. This is the second lowest California PHG among all drinking water contaminants. TCP is not currently regulated at the federal or state level. However, the California State Water Resources Control Board Division of Drinking Water is expected to announce a draft maximum contaminant level in 2014. Regardless of the MCL level the state ultimately adopts, the City of Tulare’s TCP Well Water Contamination Monitoring and Mitigation Strategy and Plan (effective April 1, 2014) states that the City’s goal is to “remove TCP from the City’s water supply and eliminate public exposure to TCP in the City’s drinking water” and that TCP removal “must be accomplished when/as funding becomes available”.
Historical TCP levels in the City’s wells have ranged from approximately 0.010 µg/L to 0.075 µg/L (14 to over 100 times the public health goal). The City requires that these levels be reduced to below the public health goal. The only feasible means of satisfying this requirement is to treat the 13 contaminated wells evaluated in this study with granular activated carbon (GAC) adsorption. GAC is the most economical treatment solution and is also the only viable alternative that can reliably reduce the TCP concentration to below the public health goal. The GAC treatment plants should be designed using a series vessel configuration and an empty bed contact time of 15 minutes. Well sites 12, 13, 23, 24, 34, 35, 38, 43, and 44 are not large enough for construction of GAC treatment and the City will therefore need to acquire additional property. Wells 43 and 44 can be treated together at the Well 44 site.
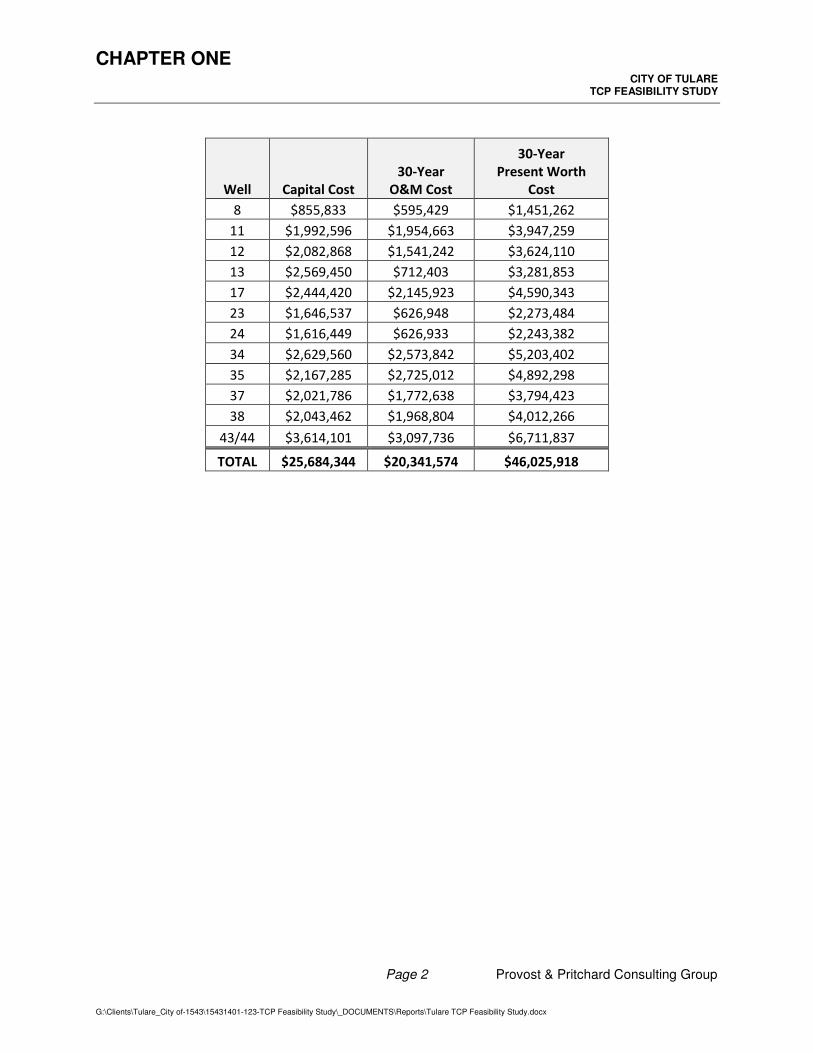
The following table summarizes the estimated cost for capital improvements and ongoing operation and maintenance of the treatment plants:
The City of Tulare currently has a population of approximately 61,000 people. The City’s water system provides potable water to residential, commercial, industrial, and institutional customers within an approximately 20 square mile area. The City’s entire water supply is extracted from twenty-eight groundwater wells. The water is transmitted from the wells to customers through a water distribution system operated as a single pressure zone with a single 150,000-gallon elevated tank providing storage.
The volatile organic compound (VOC) 1,2,3-trichloropropane (TCP) has been detected in half (fourteen) of the City’s wells. The City has requested that Provost & Pritchard evaluate alternatives to mitigate the impact of the TCP contamination on the water system and determine the cost to implement the most feasible mitigation alternative.
2.2 Existing Facilities
Following is a map showing the locations of the TCP-impacted wells and summary descriptions of the existing facilities associated with each well.
CITY OF TULARE TCP FEASIBILITY STUDY
Figure 2-14: Well 44
2.3 1,2,3-Trichloropropane Characteristics
1,2,3-trichloropropane is also known as allyl trichloride, trichlorohydrin, and glycerol trichlorohydrin and has the following physical properties:
Property Value
Chemical formula C3H5Cl3
CAS No. 96-18-4
Storet No. 77443
Molecular weight 147.43
Density 1.38 g/cm3 at 20°C
Solubility in water 1.75 g/L at 20°C
Vapor pressure 3.69 mm Hg at 25°C
Henry’s Law constant 3.43 x 10⁻⁴ atm-m3/mol at 25°C 22.83 x 10⁻⁴ Pa-m3/mol at 25°C 0.013 dimensionless (Kaw)
Octanol-water partition coefficient (Log KOW)
1.99; 2.54; 2.27
CITY OF TULARE TCP FEASIBILITY STUDY
For purpose of comparison, the following table lists the Henry’s Law constant, and log octanol-water partition coefficients for TCP and other commonly treated VOCs and SOCs:
Chemical Henry’s Law Constant
(atm-m3/mol) Log Octanol Water
Partition Coefficient
1,2,3-Trichloropropane (TCP) 0.0003 2.26
Dibromochloropropane (DBCP) 0.00015 2.43 – 2.96
Methyl tertiary-butyl ether (MTBE) 0.0007 1.13
Tetrachloroethylene (PCE) 0.015 3.14
Trichloroethylene (TCE) 0.009 2.36
1,1-Dichloroethene (1,1-DCE) 0.015 to 0.07 1.32
TCP has a relatively low Henry’s Law constant and moderate log octanol-water partition coefficient compared to other commonly treated organic contaminants. The Henry’s Law constant and octanol-water partition coefficient correlate with the performance of the air stripping and granular activated carbon treatment processes respectively. These parameters will be discussed in more detail in subsequent sections.
2.4 Health Effects
In August 2009, the California Office of Environmental Health Hazard Assessment (OEHHA) established a California Public Health Goal (PHG) for TCP of 0.0007 µg/L (0.7 parts per trillion). This is the second lowest California PHG among all drinking water contaminants. The PHG is based on carcinogenic effects. TCP is also on the list of chemicals known to the state to cause cancer.
2.5 Laboratory Analysis for TCP
Because of the extremely low PHG level (0.0007 µg/L), the traditional EPA methods of testing for VOCs (methods 502.2 and 524.2) are not adequate. These methods have detection limits orders of magnitude greater than the PHG. The California state Sanitation and Radiation Laboratories have developed two special gas chromatography / mass spectrometry (GC/MS) methods that are capable of detecting TCP down to the California detection limit for purposes of reporting (DLR), which is 0.005 µg/L.
2.6 Regulatory Implications
TCP is not currently regulated at the federal or state level. However, the California State Water Resources Control Board Division of Drinking Water (DDW) web site reports that
“CDPH [now DDW] is currently developing an MCL for 1,2,3-TCP, which is expected to be released for public comment in 2014, as part of the formal regulations adoption process. In the interim, we will continue to use the 0.005-µg/L notification level to provide information to local governing agencies and consumers.”
CITY OF TULARE TCP FEASIBILITY STUDY
As of the date of this report, DDW has not yet announced the draft maximum contaminant level (MCL). By law (Health and Safety Code §116365(a)) DDW must set the MCL “as close as feasible to the corresponding public health goal placing primary emphasis on the protection of public health, and that, to the extent technologically and economically feasible…”. It is technologically feasible to remove TCP from drinking water to the PHG using treatment processes described in this report. It is unknown to what extent economic considerations may impact the state’s determination of an MCL. In any event, regardless of the MCL level DDW ultimately adopts, the City of Tulare’s TCP Well Water Contamination Monitoring and Mitigation Strategy and Plan (effective April 1, 2014) states that the City’s goal is to “remove TCP from the City’s water supply and eliminate public exposure to TCP in the City’s drinking water” and that TCP removal “must be accomplished when/as funding becomes available”.
Nevertheless, once the MCL has been adopted, the City will have six months to collect the first compliance sample from each well. Samples must be collected quarterly thereafter with compliance established based on the running annual average value calculated from the previous four quarterly samples. Note that a well may be out of compliance as early as the first quarterly sample if the level of TCP detected is over four times the MCL. As soon as one or more wells are out of compliance with the new MCL, the City will receive a compliance order from DDW and will be required to notify the public. The compliance order will require that the City respond to DDW with a plan to address the noncompliance. The time the City will be given to correct the problem is difficult to predict. DDW has the ability to issue administrative fines up to $25,000/day, but is unlikely to do so as long as the City has a plan to bring the system into compliance with the rule and is making reasonable progress towards executing that plan.
3 DESIGN CRITERIA
3.1 TCP Levels
Historical TCP levels are presented in Section 4.2. Peak TCP levels measured in each of the wells have ranged from approximately 0.010 µg/L to 0.075 µg/L (14 to over 100 times the PHG).
Even though these levels are high by health-based standards, they are unlikely to significantly influence the physical design of TCP removal treatment systems or carbon life for the GAC process. The reason is that the TCP levels are almost certainly orders of magnitude lower than the natural organic matter (NOM) that exists in all water supplies. NOM is the result of groundwater or surface water passing through soil or along channels and impoundments that contain naturally occurring organic material (leaves, grass, fish, etc.). This organic material breaks down and becomes dissolved in the water.
CITY OF TULARE TCP FEASIBILITY STUDY
3.2 Well Production Rates
Following are typical well flow rates and annual production volumes for each of the wells. Flow rates are taken from the City’s 2010 Urban Water Management Plan. Annual production values are based on 2013 production data.
Well Flow Rate
(GPM) Annual Production
(Gallons)
8 317 18,492,800
11 885 316,291,200
12 1,441 182,037,300
13 508 27,274,300
17 1,675 273,337,600
23 433 2,851,100
24 695 2,912,500
34 1,652 407,298,800
35 1,132 536,866,100
37 1,527 259,429,700
38 1,463 318,487,200
43 1,475 112,673,000
44 1,420 288,229,900
TOTAL 2,746,181,500
3.3 TCP Mitigation Objective
The City requires that the TCP be removed to below the public health goal. Therefore the TCP mitigation objective will be to supply water to the City’s customers with TCP levels below 0.0007 µg/L.
4 WATER QUALITY
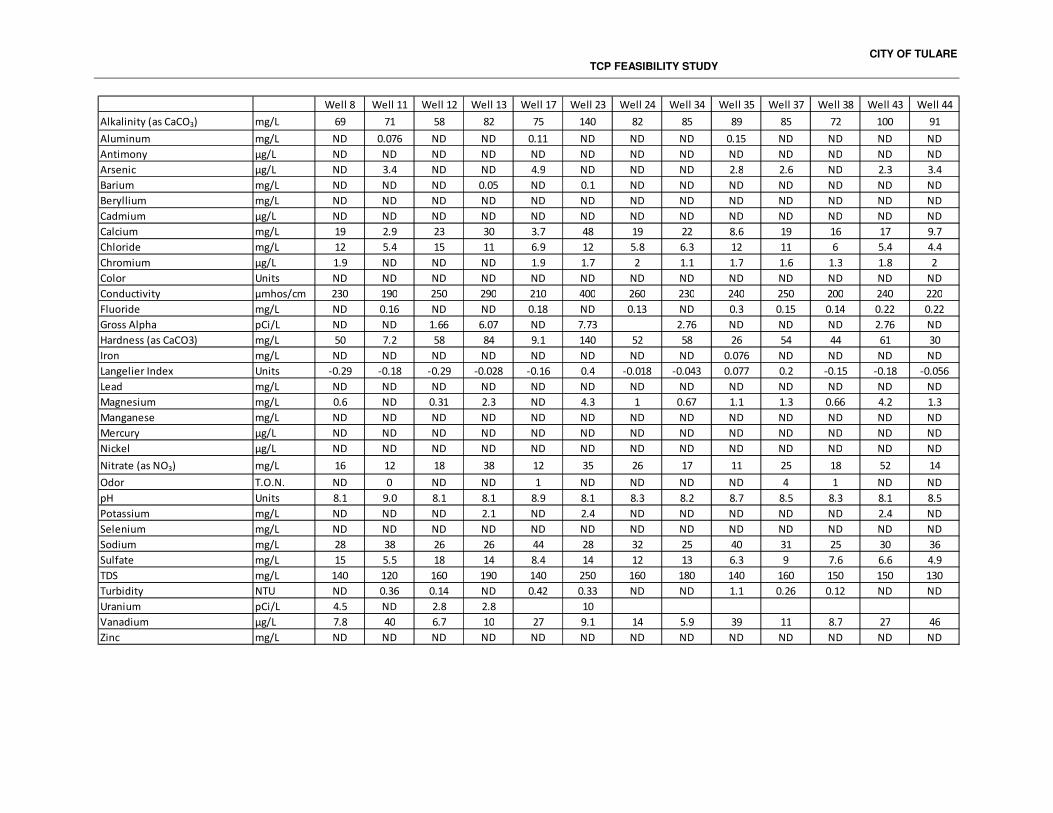
4.1 General Water Quality
A general mineral, general physical, and inorganic water quality summary for the impacted wells is presented in the following table:
CITY OF TULARE TCP FEASIBILITY STUDY
Well 8 Well 11 Well 12 Well 13 Well 17 Well 23 Well 24 Well 34 Well 35 Well 37 Well 38 Well 43 Well 44
The general mineral, general physical, and inorganic findings most significant to this evaluation relate to the turbidity at Well 35, the odor at Well 37, and nitrate levels.
Turbidity measurements at Well 35 have been consistently over 1 NTU. The relatively high turbidity may indicate that the well is producing sand or other sediment. It could also simply be the result of entrained gas. If it is the result of sanding and GAC treatment is installed, a sand separator, or possibly even a filter will need to be installed on the well to prevent the sand from building up on the GAC media and increasing head loss through the vessel. If sand is allowed to accumulate on the GAC, the vessel will need to be backwashed periodically to reduce the head loss. Backwashing the GAC bed after it has been in service results in mixing of the media, disruption of the mass transfer zone, and a reduction in carbon life. The City should evaluate the water quality at Well 35 further to determine what is causing the turbidity.
In 2013, the odor in the Well 37 water measured 4 T.O.N. This level is above the secondary standard value of 3 T.O.N.; however the running annual average has never exceeded the MCL. Odor measurements in 2010 and 2011 were non-detect. There is a possibility that the odor is the result of hydrogen sulfide in the water. If there is hydrogen sulfide in the water, it could affect GAC treatment at that site by shortening carbon life.
Several of the wells produce water with nitrate levels greater than ½ of the MCL value (45 mg/L as NO3). As of June 2014, Well No. 43 has been producing water that exceeds the nitrate MCL. These nitrate levels will have an impact on the GAC treatment process. That impact and required mitigation measures are described later in this report.
4.2 Other Constituents
A few of the City’s wells have had low-level detections of 1,2-Dibromo-3-chloropropane (DBCP), a contaminant often found with TCP, and low levels of other organic contaminants have been detected at one well. These low concentrations will not impact the TCP-removal performance of the GAC treatment process recommended in this study although the GAC treatment is likely to remove some or all of these contaminants at the same time it removes the TCP.
4.3 1,2,3-Trichloropropane
All TCP measurements from March 2002 through June 2014 are presented in the following table. All wells have had TCP measurements between 14 times the PHG and 71 times the PHG within the past year (2014).
CITY OF TULARE TCP FEASIBILITY STUDY
5 NON-TREATMENT ALTERNATIVES
Treating water to remove VOCs such as TCP will result in significant ongoing operations and maintenance costs for the life of the treatment system, regardless of the treatment process selected. It will also place administrative and regulatory burdens on the City that would not otherwise exist if treatment were not required. For these reasons, non-treatment alternatives should be carefully considered before a decision is made to treat the water.
5.1 Well Abandonment
The City’s 2010 Water Master Plan concluded that the City-wide firm supply capacity was less than the existing peak hour demand. The Master Plan recommended that the City have a total well production capacity of 63.6 MGD. The current total production capacity of the City’s 28 wells is less than 46 MGD. Based on existing supply pressures, the loss of any one of the TCP-impacted wells would result in unacceptably low pressures (below 35 psig) in the northeast portion of the City’s water distribution system.
Abandoning one or more of the TCP-impacted wells without replacing the lost capacity is not a viable alternative.
5.2 Blending
Blending for the purpose of reducing the concentration of one or more contaminants is a method that relies on mass balance. It is an “averaging” of the contaminant concentration in the different sources being blended taking into account that the flow rate contribution from the different sources may not be the same. None of the TCP would be removed from the water in a blending process.
Blending of sources to reduce the concentration of naturally occurring drinking water contaminants (e.g. arsenic) is practiced by several California utilities and is permitted by DDW. Blending for the mitigation of anthropogenic contaminants such as TCP is much less common. This is primarily due to the belief of drinking water consumers that the man-made contaminant does not belong in the water at any concentration. This City’s TCP Well Water Contamination Monitoring and Mitigation Strategy and Plan indicates that the City shares this belief.
Blending will not be acceptable to DDW unless the blending process is reliable, can be sufficiently monitored, and occurs prior to the water being served to the first consumer. There are several technological and permitting issues associated with using blending to mitigate TCP contamination:
1. It is impossible to monitor the blending process accurately enough to ensure the protection of public health. The detection limit for TCP is 0.005 µg/L. Even if the TCP is measured as non-detect (<0.005 µg/L) in the blended water sample, the TCP may be present at almost seven times the PHG, which is 0.0007 µg/L.
2. The extent of the TCP contamination at Tulare means that there are few sources that might be free of TCP and all of those are at risk of contamination in the future.
3. The need to construct dedicated water transmission pipelines and/or storage tanks connecting high-TCP wells with clean wells.
4. The controls that start the contaminated well(s) would need to be interlocked so that the contaminated wells could only operate at the same time as the clean wells. This would significantly reduce the City’s flexibility in managing its water supply.
5. In many cases, the need to maintain an acceptable ratio of blend water to contaminated water results in the need to reduce the flow from the contaminated well, which is unacceptable to the City given, among other reasons, its current supply deficit.
CITY OF TULARE TCP FEASIBILITY STUDY
As a practical matter, the last two issues identified above would likely force the City to develop new sources of supply to offset the loss in control flexibility and therefore production of the impacted wells.
For these reasons, blending has been determined to be infeasible for mitigating the City’s TCP contamination.
5.3 Purchasing Water / Consolidation
There are no nearby drinking water systems with enough excess drinking water supply capacity to offset the City wells that would be lost to TCP contamination. The nearest major city of comparable size to Tulare is Visalia. Visalia is also facing the potential of lost source capacity due to TCP contamination of its wells. Additionally, any small utilities in the area around Tulare that rely on groundwater are likely to be facing similar TCP challenges.
Purchasing water from another utility or consolidation with another utility is not a viable alternative.
5.4 Well Replacement or Modification
contaminated with TCP; two (40 and 41) produce water with arsenic levels exceeding the MCL; and three (4, 6, and 7) have been taken out of service due to low water levels.
Additionally, the City’s topography generally slopes down from east to west. The lowest water system pressures and greatest supply deficiency occurs on the east side of the City, particularly to the northeast. Even if wells meeting all drinking water standards
The City does need to plan on constructing new supply wells and/or storage tanks to increase supply capacity to meet current and planned future demands. However, based on the extent of existing wells that are currently contaminated with TCP it is likely that some, if not all, of the new wells will also be contaminated with TCP. The City should consider retaining a hydrogeologist to evaluate possible locations and depths for future wells that are least likely to be contaminated.
In some cases, utilities have been successful in modifying existing wells to reduce the concentration of targeted contaminants in the water produced. This is done by blocking off water-producing strata that contain high levels of the contaminant. It is difficult to predict whether the modifications to the well will be successful. However; it is certain that a reduction in well capacity will result. The City needs all of the capacity its wells can produce.
Construction of new supply wells or modifying existing wells are not viable alternatives.
CITY OF TULARE TCP FEASIBILITY STUDY
5.5 Developing a Surface Water Supply
The closest surface water supplier to the City is the Tulare Irrigation District (TID). All but the southern portion of the City lies within the boundaries of the TID service area; however, the City is not a part of TID. TID has authority to obtain and deliver surface water supplies within the district boundaries for the purpose of agricultural irrigation and groundwater recharge. TID is not currently authorized to supply surface water for municipal use.
There are a number of obstacles to offsetting the water supply from the TCP contaminated wells with surface water from TID or another source:
1. The City would need to obtain rights to the water. 2. TID is currently not authorized to distribute water for municipal use. 3. TID’s surface water supply, and most of the surface water supply “available” in
the Central Valley is not secure. The supply cannot be guaranteed during times of supply shortage such as the severe drought we are currently experiencing.
4. The City would need to construct and operate a surface water treatment plant. Surface water treatment is much more extensively regulated by DDW than the City’s well water supply, or even wellhead treatment.
For the above reasons, it is not considered feasible for the City to offset lost production from TCP contaminated wells with a surface water supply.
6 TREATMENT ALTERNATIVES
Since there are no viable non-treatment alternatives to address the City’s TCP contamination problem, it will be necessary for the City to treat the well water to remove TCP. The following sections describe all reasonably viable TCP-removal wellhead treatment technologies. When a draft MCL is published, the notice will include a list of best available treatment technologies (BATs) to remove the contaminant. BATs are not published prior to the MCL. However; based on the BATs listed for other currently regulated VOCs and SOCs, it is anticipated that GAC and “packed tower aeration” (PTA) will be the only two technologies listed.
Note that there is no requirement that the City utilize a BAT. However, it should be anticipated that the use of any technology not listed as a BAT will result in greater regulatory scrutiny.
6.1 Air Stripping
Packed tower aeration, as identified in the drinking water regulations, is a misnomer. Aeration is technically a process whereby a gas is being added to water whereas air stripping involves the removal of a gas from the water. It is the latter that is required to remove TCP from drinking water. It is also an oversimplification to specifically list “packed tower” as the means of accomplishing the air stripping because several non-packed tower air stripping technologies are capable of accomplishing the same treatment performance with much shorter equipment heights.
CITY OF TULARE TCP FEASIBILITY STUDY
In an air stripping process, volatile contaminants are removed by transferring them from the liquid phase (water) to the vapor phase (air). Most air strippers operate in a counter-flow condition – the water cascades down from the top into a sump while air is blown up from the bottom to an exhaust port at the top. The air entering the air stripper is typically free of the contaminant(s) being targeted, while the air leaving the air stripper is contaminated with one or more volatile contaminants “stripped” from the water. Depending on the air-to-water ratio, contact time, area available for mass transfer, water temperature, and the volatility of the contaminants, air strippers can approach removal efficiencies of 100%.
The more volatile the contaminant is, the more easily it is transferred from the water to the air. The parameter most commonly used to represent the volatility of a substance is it’s Henry’s Law constant (H). “H” is a physical characteristic related to the partial pressure and the solubility of a given compound. It is not a constant, but increases as temperature increases. The greater the value of H, the greater the air stripping removal efficiency and the less air that is required. “H” values for commonly occurring drinking water contaminants were presented in Section 2.3. In general, H values greater than 0.001 atm-m3/mol indicate that a compound can be removed efficiently from water using air stripping. This is validated by practical experience which demonstrates that PCE and TCE, which have high H values, can be effectively removed using air stripping whereas DBCP and MTBE, which have low H values, cannot. TCP has an H value of 0.0003 atm-m3/mol, similar to DBCP and MTBE, which indicates that it will be difficult to remove using air stripping.
Limited data for two operational air stripping treatment facilities that treat water containing TCP is available. Both the Burbank Operable Unit and the City of Fresno operate treatment plants designed for the removal of other VOCs from water that also contains TCP. Treatment for TCP removal was not considered in the selection of air stripping treatment at either facility. The technical memorandum, Burbank OU, Impact of Trace 1,2,3-TCP on System Performance, prepared by CH2M Hill in April 2001 states that the PTA system at Burbank was removing approximately 10 to 20 percent of the TCP present in the influent water. Data collected by the City of Fresno at City Pump Station 70 indicates that approximately 12 to 26 percent of the TCP present in the influent water is removed through PTA.
Based on TCP’s relatively low H value and the poor TCP removal performance at existing water treatment plants, air stripping will not be the most economical solution for the City’s wells.
6.2 Reverse Osmosis
Membrane treatment processes, in order of increasing removal capabilities include microfiltration, ultrafiltration, nanofiltration, and reverse osmosis (RO). The common characteristic of all of these processes is a membrane designed to reject or selectively pass certain contaminants based on the compound’s size, shape, polarity, and electrical charge. RO is the only membrane type capable of significant rejection of relatively low molecular weight dissolved organic compounds such as TCP.
CITY OF TULARE TCP FEASIBILITY STUDY
Operation of an RO treatment plant requires high feed pressures (in excess of 150 psi) and results in the continuous generation of a high flow rate concentrated reject waste stream. Pretreatment for sediment removal may be required in order to prevent damage to the sensitive RO membrane elements. Operation of an RO treatment plant requires a high level of operator oversight and skill. Failure to properly pre-treat the water and regulate the process can result in permanent damage to the expensive RO membranes.
A 1990 study, Membranes for Removing Organics from Drinking Water (Fronk, Lykins, & Carswell, Proceedings of 1990 American Filtration Society Annual Meeting) included the bench-scale evaluation of multiple RO membrane types for TCP removal. Among the membranes tested, observed rejection of TCP ranged from 39 to 85 percent. The author is familiar with one operational RO treatment facility that treats water containing TCP. The City of Oceanside operates the Mission Basin Desalting Facility, which treats brackish groundwater for total dissolved solids (salt) removal. After the facility was constructed, TCP was detected in several of the wells supplying the treatment plant. Monitoring of the treatment plant influent and effluent TCP levels during 2003 and 2004 revealed that the RO treatment process was only rejecting 60 to 70 percent of the TCP. The city ultimately installed a GAC treatment plant downstream of the RO process in order to reduce the TCP levels to non-detect.
Based on the demonstrated poor performance of the RO treatment process in bench testing and full-scale application and the impracticality of the City managing the brine waste stream generated by the RO process, RO has been determined to be infeasible for TCP removal at the City’s wells.
6.3 Advanced Oxidation
Advanced oxidation is a term used to describe a variety of oxidation processes designed to generate hydroxyl radicals at room temperature and pressure. A hydroxyl radical is a chemical species with a single oxygen atom and a single hydrogen atom and with an unpaired electron in its outer shell. The hydroxyl radical is a highly reactive and relatively non-selective oxidant capable of completely destroying many organic contaminants by oxidizing them to end-products of carbon dioxide, water, and mineral acids.
There are several advanced oxidation processes (AOPs) used in the drinking water industry. The most common are:
A primary concern with the use of AOPs is the possibility of incomplete oxidation. When the primary organic contaminant is oxidized, it does not immediately break down to carbon dioxide, water, and mineral acids. It is first converted to smaller organic molecules, which may in turn be further reduced into smaller organic molecules and so on. These intermediate organic byproducts may in some cases be more harmful to
CITY OF TULARE TCP FEASIBILITY STUDY
humans than the original targeted organic compound. The nature of intermediate byproducts formed when AOPs are used on TCP has not been adequately studied, nor have the AOP dosages required for complete oxidation been established.
The dosages required for the various AOP processes to completely oxidize TCP are likely high. First, no manufacturer of commercially available AOP processes is actively marketing their product for this application. Second, the only published study documenting the use of AOP treatment on TCP contaminated water the author is aware of utilized the Halia-HiPOx system manufactured by Air Products (formerly marketed by Applied Process Technology). The Halia-HiPOx process uses a combination of ozone and hydrogen peroxide to produce hydroxyl radicals. The study (Dombeck and Borg 2005) evaluated treatment of water from an undisclosed San Joaquin Valley utility that contained TCP and DBCP at concentrations of approximately 0.95 µg/L and 0.059 µg/L respectively. In order to reduce the TCP concentration to 0.005 µg/L, 53 mg/L of ozone and a hydrogen peroxide to ozone ratio of 0.7 was required. The study also acknowledged that “additional work is needed to determine the destruction pathway so as to understand potential byproduct formation and their toxicity”. No follow-up studies have been published.
There are no commercially available advanced oxidation treatment systems that have been sufficiently evaluated for drinking water TCP treatment. In order to determine if AOP processes might be made viable, the City would need to initiate an extensive study to determine not only the dosages required to obtain non-detect TCP levels, but also what byproducts may have been formed during the oxidation process. It has been assumed that funding and administering such a study is not in the City’s best interests given the proven treatment process (GAC) that is already available.
6.4 Alternative Sorbents
Synthetic resin sorbent media have been used for removal of hydrocarbon and VOC contaminants from water. Two resins that have been considered for VOC and SOC removal from drinking water in the past are Polyguard (manufactured by Guardian Environmental Technologies) and Ambersorb (manufactured by Rohm & Haas).
Bill Litwin with Guardian Environmental Technologies was contacted to discuss Guardian’s experience with TCP removal. Mr. Litwin reported that Guardian had not conducted any studies related to removal of TCP using the Polyguard media. Furthermore the Polyguard media is not currently certified to ANSI/NSF Standard 61, which is required for all drinking water treatment equipment and media in contact with potable water.
Ambersorb used to be marketed by Basin Water. Previous discussions with Basin water indicated that Ambersorb (any of the variants of the product) had not been tested for TCP removal. Basin water has been acquired by Envirogen Technologies. Envirogen Technologies has also not pursued the use of Ambersorb for the TCP removal application. Ambersorb is not an ANSI/NSF-61 certified product.
CITY OF TULARE TCP FEASIBILITY STUDY
6.5 Biological Treatment
Biological processes have long been utilized for the treatment of wastewater, but until recently biological processes in drinking water treatment were limited to biological degradation of organic contaminants on filter media. Recently there has been an increase in interest and research regarding the use of biological processes for the treatment of drinking water contaminants including VOCs and nitrate. Several pilot studies involving biological treatment are currently underway.
TCP is generally considered to be non-biodegradable. A recent study, Transformation and Biodegradation of 1,2,3-trichloropropane (Samin, G., Janssen, D.B., Environmental Science and Pollution Research International, 2012) looked specifically at the viability of biological treatment of drinking water for TCP removal. Their results were not promising and they concluded that further work would be required, including genetic engineering, to develop microorganisms capable of breaking down TCP within practical conditions.
It is not feasible to treat the City’s water for TCP removal utilizing biological processes.
6.6 Activated Carbon
There are several reasons to consider GAC as the best choice for TCP-removal treatment at the City’s wells:
1. California drinking water regulations (CCR §64447.4) list adsorption with granular activated carbon as a best available treatment technology for all but five of the dozens of currently regulated VOCs and SOCs. The DDW is almost certain to list GAC as a BAT for TCP.
2. GAC is the only treatment process that can reliably remove TCP to levels below the PHG.
3. To the author’s knowledge, GAC is the only wellhead treatment process that has been previously specified for TCP removal from drinking water when co-contaminants were not also being targeted for removal.
4. The drinking water industry has generally accepted GAC as the most cost effective treatment technology for TCP removal.
The following section describes the GAC adsorption process in more detail and presents process design parameters specific to the City’s well capacities and water quality.
CITY OF TULARE TCP FEASIBILITY STUDY
7 GRANULAR ACTIVATED CARBON DESIGN
7.1 Process Description
Adsorption is a mass transfer process where one or more substances in a fluid, referred to as the adsorbate, are captured onto the surface of a solid substance referred to as the adsorbent. It should be noted that adsorption differs from absorption in that the former is a process that only occurs at the material pore surfaces whereas an absorbed substance can occupy the entire volume of the pores (e.g. a sponge).
During the adsorption process, dissolved compounds are transported from the surface of the solid adsorbent particle through small passages to the pore surfaces where they are bound to the surface primarily through physical forces.
Activated carbon in either the granular or powdered form is the most common adsorbent used in water treatment. The granular form is typically used for long term adsorption treatment at fixed locations, such as this application. The powdered form is frequently used in surface water treatment applications where the need for treatment is intermittent (e.g. seasonal taste and odor problems).
7.2 Operational Experience
GAC treatment systems removing TCP from drinking water are either in planning, installed, or operational at the following locations:
• City of Alhambra, CA • Burbank Operable Unit, San Fernando Valley (Area 1) Superfund Site, CA • Glendale, CA • Tustin, CA • Maui Water, HI • Kaanapali Water Corporation, HI • City of Oceanside, Mission Basin Groundwater Purification Facility, CA • San Jerardo Water System, Salinas, CA • Fresno, CA • Livingston, CA • Shafter, CA • Lamont PUD, CA
7.3 Carbon Type
GAC can be manufactured from almost any raw material with high carbon content. Typical materials used to manufacture GAC are coal (lignite, bituminous, and anthracitic grades), coconut shell, peat, and wood. Variations in the raw material and manufacturing process produce GAC with different surface areas, pore size distributions, abrasion resistance and other physical properties.
Adsorption of small molecular weight VOCs and SOCs such as TCP typically requires a carbon with a large percentage of small pores (i.e. a microporous carbon). Depending
CITY OF TULARE TCP FEASIBILITY STUDY
on a particular manufacturer’s product line, bituminous coal based or coconut shell based carbons are usually recommended. Most available studies indicate that coconut shell carbons will outperform the coal based carbons for most domestic well water sources. For this reason, use of a coconut shell based carbon is recommended pending test data demonstrating that a coal-based carbon is more cost-effective.
7.4 Carbon Usage Rate
Five predictive methods are used to predict carbon usage rates. These methods are listed below in order from least reliable to most reliable:
• Computer modeling such as that based on the Freundlich isotherm equation; • Bottle point adsorption isotherm measurements using contaminated well water; • Rapid small scale column test (RSSCT) study using contaminated well water; • Small-scale pilot plant studies; and • Full-scale implementation
The first method – computer modeling, does not involve any testing with the source water and does not take into consideration the background water quality. Computer modeling is considered a very approximate indicator of carbon performance. The isotherm test is a steady-state test that utilizes the actual well water to be treated. It provides an indication of the total adsorption capacity of a particular carbon for a contaminant, but does not account for the fact that adsorption is a dynamic process. RSSCT studies are commonly performed to better estimate GAC performance because they partially account for the kinetics of the adsorption process and can be completed within a few days. However the RSSCT test does not accurately simulate full scale performance. Small scale pilot plant studies and full-scale implementation provide accurate carbon performance data, but take months or potentially years to perform, making them impractical in most cases.
The City may wish to consider conducting RSSCT testing on one or more contaminated wells. While the test will not necessarily predict the actual carbon usage rate, it should be capable of indicating whether the carbon usage rate is significantly less than would be expected based on performance at other water systems. It is important that a factor of safety be applied to the RSSCT test results when using them for O&M cost budgeting.
The O&M cost opinions included in this report assume a carbon usage rate of 0.1 Lb/1,000 gallons treated. It is strongly recommended that the City use a value no less than this for purposes of O&M cost budgeting. The 0.1 Lb/1,000 gallon assumption is based on computer modeling; limited full-scale treatment system operation; and RSSCT testing performed by other Central Valley water utilities. It should be noted that carbon usage predictions vary significantly from one source to another. Recent RSSCT testing performed at another Central Valley water utility resulted in carbon usage predictions ranging from 0.04 to 0.07 Lb/1,000 gallons for different wells. After applying a factor of safety to those results to account for the limitations of the RSSCT process, carbon usage rates of 0.06 to 0.1 Lb/1,000 gallons were predicted for that utility. Evoqua water technologies previously predicted a carbon usage rate of 0.1 Lb/1,000 gallons for TCP
CITY OF TULARE TCP FEASIBILITY STUDY
using a computer model and water quality characteristics for yet another Central Valley groundwater source.
If the City wishes to confirm that carbon usage rates will not be significantly greater than 0.1 Lb/1,000 gallons, it should consider performing RSSCT tests at one or more wells. This testing would cost approximately $10,000 per source and is only recommended if the City is concerned with elevated background naturally occurring organics in one or more wells or is aware of any other unusual water quality conditions not identified in this report. Based on the City’s low disinfection byproduct levels in the distribution system (1.8 µg/L and 5.4 µg/L for TTHM and HAA5 respectively), it appears that the background organic levels are typical of Central Valley waters.
7.5 Treatment Configuration
7.5.1 Empty Bed Contact Time
Empty bed contact time (EBCT) describes the time (in minutes) required for the water to pass through the volume of the carbon bed without accounting for the space occupied by the carbon media. Greater EBCT values are desirable when the mass transfer zone (MTZ) is long and preloading by other constituents in the water (e.g. naturally occurring organics) is not anticipated to be a problem. The MTZ is the portion of the bed depth where active adsorption is taking place and is bounded by a contaminant concentration equal to the influent concentration at the top of the MTZ and a contaminant concentration equal to zero at the bottom of the MTZ. The MTZ is illustrated in the following figure where dark blue represents fully exhausted carbon, white indicates carbon with full capacity remaining, and the shaded blue portion represents the MTZ where active adsorption is taking place.
Evoqua Water Technologies recommended minimum EBCTs of 10
7.5.2 Hydraulic Loading Rate
The hydraulic loading rate (HLR), measured in gpm/ftsurface area of the carbon bed(s) by the floon the head loss through the media. Higher HLRs will result in greater head loss, which in turn will result in increased pumping power costs. In extreme cases, excessive HLRs may result in short-circuiting otry to keep the HLR below 8 gpm/ft2 and preferably below 6 gpm/ft2.
7.5.3 Series – Parallel
Vessels are operated in series with the effluent of one vessel becoming the influent of a second vessel to improve carbon utilization efficiency; to improve treatment reliability; and/or to allow carbon change
Series vessels allow the carbon utilization efficiency to be improved by extending the EBCT. More specifically, series vessels should be designed such that each vessel in a series pair has a bed depth longer than the contaminant MTZ. That configuration results in the MTZ fully passing through the first/lead vessel before breakthrough out of the second/lag vessel occurslead vessel is fully saturated when it is replaced and no carbon capacity is wasted. The disadvantages of series operation are increased HLR and therefore head loss compared to parallel operation with the same EBCT, and the capital cost of additional
TCP FEASIBILITY STUDY
Evoqua Water Technologies – Westates Carbon Division and Calgon Carbon have recommended minimum EBCTs of 10 – 16 minutes for TCP removal treatment.
Hydraulic Loading Rate
The hydraulic loading rate (HLR), measured in gpm/ft2, is calculated by dividing the surface area of the carbon bed(s) by the flow rate. The most significant effect of HLR is on the head loss through the media. Higher HLRs will result in greater head loss, which in turn will result in increased pumping power costs. In extreme cases, excessive HLRs
circuiting of water through the carbon bed. A general guideline is to try to keep the HLR below 8 gpm/ft2 and preferably below 6 gpm/ft2.
operated in series with the effluent of one vessel becoming the influent of a ove carbon utilization efficiency; to improve treatment reliability;
and/or to allow carbon change-out while the system remains in operation.
Series vessels allow the carbon utilization efficiency to be improved by extending the series vessels should be designed such that each vessel in a
series pair has a bed depth longer than the contaminant MTZ. That configuration results in the MTZ fully passing through the first/lead vessel before breakthrough out of
ccurs (refer to the figure below). Therefore the carbon in the lead vessel is fully saturated when it is replaced and no carbon capacity is wasted. The disadvantages of series operation are increased HLR and therefore head loss
tion with the same EBCT, and the capital cost of additional
CITY OF TULARE TCP FEASIBILITY STUDY
Division and Calgon Carbon have 16 minutes for TCP removal treatment.
, is calculated by dividing the w rate. The most significant effect of HLR is
on the head loss through the media. Higher HLRs will result in greater head loss, which in turn will result in increased pumping power costs. In extreme cases, excessive HLRs
f water through the carbon bed. A general guideline is to
operated in series with the effluent of one vessel becoming the influent of a ove carbon utilization efficiency; to improve treatment reliability;
out while the system remains in operation.
Series vessels allow the carbon utilization efficiency to be improved by extending the series vessels should be designed such that each vessel in a
series pair has a bed depth longer than the contaminant MTZ. That configuration results in the MTZ fully passing through the first/lead vessel before breakthrough out of
. Therefore the carbon in the lead vessel is fully saturated when it is replaced and no carbon capacity is wasted. The disadvantages of series operation are increased HLR and therefore head loss
tion with the same EBCT, and the capital cost of additional
vessels to mitigate excessive HLR. With source waters high in naturally occurring organic compounds, it is also possible that the naturally occurring organics the carbon below the TCP mass transfer zone, which could reduce its capacity for TCP. Series vessel operation is recommended at the City’s wells for the following reasons:
• Given the apparent low level of NOM in the City’s source water, series vessel operation should result in ioperating costs.
• TCP can only be reliably detected when its level has risen to over seven times the public health goal. Operating the vessels in series will provide the City with more warning before TCP bsystem.
• The City requires that all of its wells remain in operation in order to maintain acceptable pressures in all parts of the distribution system. Therefore, the Citycannot remove a well from servitake several days to perform if the vessel is inspected and disinfectedvessels with the appropriate manifold piping will allow the carbon to be changedout in the lead vessel while water is still being
7.5.4 GAC Vessel Construction Features
GAC vessels should include the following construction features:
• Flow meters installed on each vessel
• Sampling ports located at the vessel inlet, outlet, and intermediate sampling ports at approximately the 25%, 50%, and 75% bed depth. The intermediate sample ports will be installed in the vessel sidewall.
• Isolation valves permitting the changeout of carbon in the lead vessel without taking the lag vessel off
TCP FEASIBILITY STUDY
vessels to mitigate excessive HLR. With source waters high in naturally occurring organic compounds, it is also possible that the naturally occurring organics
P mass transfer zone, which could reduce its capacity for TCP. Series vessel operation is recommended at the City’s wells for the following reasons:
low level of NOM in the City’s source water, series vessel operation should result in increased carbon life and therefore reduced ongoing
TCP can only be reliably detected when its level has risen to over seven times the public health goal. Operating the vessels in series will provide the City with more warning before TCP breaks through to the water entering the distribution
requires that all of its wells remain in operation in order to maintain acceptable pressures in all parts of the distribution system. Therefore, the Citycannot remove a well from service to perform carbon change-outstake several days to perform if the vessel is inspected and disinfectedvessels with the appropriate manifold piping will allow the carbon to be changedout in the lead vessel while water is still being treated through the lag vessel.
Construction Features
GAC vessels should include the following construction features:
Flow meters installed on each vessel
Sampling ports located at the vessel inlet, outlet, and intermediate sampling ports approximately the 25%, 50%, and 75% bed depth. The intermediate sample
ports will be installed in the vessel sidewall.
Isolation valves permitting the changeout of carbon in the lead vessel without taking the lag vessel off-line.
CITY OF TULARE TCP FEASIBILITY STUDY
vessels to mitigate excessive HLR. With source waters high in naturally occurring organic compounds, it is also possible that the naturally occurring organics will preload
P mass transfer zone, which could reduce its capacity for TCP. Series vessel operation is recommended at the City’s wells for the following reasons:
low level of NOM in the City’s source water, series vessel ncreased carbon life and therefore reduced ongoing
TCP can only be reliably detected when its level has risen to over seven times the public health goal. Operating the vessels in series will provide the City with
reaks through to the water entering the distribution
requires that all of its wells remain in operation in order to maintain acceptable pressures in all parts of the distribution system. Therefore, the City
outs, which may take several days to perform if the vessel is inspected and disinfected. Series vessels with the appropriate manifold piping will allow the carbon to be changed-
treated through the lag vessel.
Sampling ports located at the vessel inlet, outlet, and intermediate sampling ports approximately the 25%, 50%, and 75% bed depth. The intermediate sample
Isolation valves permitting the changeout of carbon in the lead vessel without
• Differential pressure tra
• NSF-61 certified interior coating resistant to the highly abrasive and corrosive environment created by the carbon.
7.6 Operating a GAC Treatment Plant
7.6.1 Carbon Change-Out Criteria
Because the public health goal for TCP (0.0(0.005 µg/L), the City will need to change out the carbon before TCP has been detected in the treatment plant effluent. The following figure shows the series vessel arrangement. It is assumed that the mass transcompletely through the lead vessel before TCP is detected at the 50% or 75% sampling port in the lag vessel. This assumption will need to be verified by monitoring the progression of TCP detections through both vThe City will need to schedule changeTCP is detected at either the 50% or 75% sample port in the lag vessel.
7.6.2 Carbon Change-Out Procedure
The manifold piping of the vessel skids can be configured so that the carbon in the lead vessel can be replaced while the lag vessel ihas been installed in the lead vespreviously serving as the lag vessel becomes the lead vessel.
For the vessel sizes required at the City’s wells, slurry transfer will be the most convenient and economical means of changing out the carbon.delivered to the site in the same truck that hauls truck is large – assume a 45’ empty one for the spent carbon and one full of new carbon. The truck must be parked within approximately 60’ of the furthest carreach from the truck to the vessel.
TCP FEASIBILITY STUDY
Differential pressure transducers to monitor system head loss.
61 certified interior coating resistant to the highly abrasive and corrosive environment created by the carbon.
Operating a GAC Treatment Plant
Criteria
Because the public health goal for TCP (0.0007 µg/L) is less than the detection limit g/L), the City will need to change out the carbon before TCP has been detected
in the treatment plant effluent. The following figure shows the series vessel arrangement. It is assumed that the mass transfer zone is short enough that it will pass completely through the lead vessel before TCP is detected at the 50% or 75% sampling port in the lag vessel. This assumption will need to be verified by monitoring the progression of TCP detections through both vessels when they are first brought on line. The City will need to schedule change-out of the carbon in the lead vessel when the TCP is detected at either the 50% or 75% sample port in the lag vessel.
Out Procedure
the vessel skids can be configured so that the carbon in the lead vessel can be replaced while the lag vessel is still in service. Once replacementhas been installed in the lead vessel, the vessel order is reversed
ng as the lag vessel becomes the lead vessel.
For the vessel sizes required at the City’s wells, slurry transfer will be the most convenient and economical means of changing out the carbon. New carbon is delivered to the site in the same truck that hauls the spent carbon away. The delivery
assume a 45’ – 55’ trailer. The trailer will have two compartments empty one for the spent carbon and one full of new carbon. The truck must be parked within approximately 60’ of the furthest carbon vessel so that the delivery hose will reach from the truck to the vessel.
CITY OF TULARE TCP FEASIBILITY STUDY
61 certified interior coating resistant to the highly abrasive and corrosive
g/L) is less than the detection limit g/L), the City will need to change out the carbon before TCP has been detected
in the treatment plant effluent. The following figure shows the series vessel fer zone is short enough that it will pass
completely through the lead vessel before TCP is detected at the 50% or 75% sampling port in the lag vessel. This assumption will need to be verified by monitoring the
essels when they are first brought on line. out of the carbon in the lead vessel when the
TCP is detected at either the 50% or 75% sample port in the lag vessel.
the vessel skids can be configured so that the carbon in the lead s still in service. Once replacement carbon
so that vessel
For the vessel sizes required at the City’s wells, slurry transfer will be the most New carbon is
the spent carbon away. The delivery 55’ trailer. The trailer will have two compartments – an
empty one for the spent carbon and one full of new carbon. The truck must be parked bon vessel so that the delivery hose will
CITY OF TULARE TCP FEASIBILITY STUDY
The steps involved in the carbon change-out are typically as follows. A change-out will take a minimum of 3-5 hours unless vessel inspection or disinfection is performed. If the vessels are opened up for inspection, the change-out will take two to three days.
1. The City will place an order with the carbon supplier once the change-out threshold has been reached
2. The vessel being serviced is isolated from the remaining vessels and pressurized with compressed air;
3. The compressed air forces the spent carbon liquid slurry out of the vessel and into the empty compartment of the delivery truck;
4. Excess water in the slurry will be drained out of the bottom of the delivery truck into a nearby sewer or storm drain;
5. The vessel should be opened so that the internal coating and underdrain can be inspected for damage. This should occur every carbon change-out until the City establishes the most practical inspection interval. If repairs are required, they may take several weeks;
6. If the vessel has been opened for inspection, it must be disinfected and confirmation bacteriological tests performed. This will take at least 24 hours during which time the delivery truck must either be held on-site or diverted to another GAC site for delivery of its fresh load of carbon.
7. During loading of new carbon, water provided by an on-site source (wharf hydrant) is used to wet the carbon being delivered while it is in the delivery truck. Compressed air is then used to transfer the carbon slurry out of the truck into the GAC vessel.
7.6.3 Spent Carbon Disposal
Spent carbon is typically hauled away for disposal or reactivation by the company delivering the new carbon. Before the carbon supplier can accept the spent carbon, it is necessary for them to “profile” the carbon to ensure that it can be disposed of in conformance with all Federal, State, and local regulations. In particular, it must be determined whether or not the carbon is a RCRA hazardous waste. It is the responsibility of the City to determine whether the carbon is a RCRA waste and to certify that determination. At least initially, this should be done using Toxic Characteristic Leaching Procedure (TCLP) and Waste Extraction Test (WET) tests.
It is anticipated that the spent carbon generated at the City’s wells will be a non-RCRA waste. If it is a non-RCRA waste, no chain of custody tracking is required. In the unlikely event that the spent carbon is classified as a RCRA waste, disposal through a carbon supplier’s regeneration facility will become more complicated and expensive, but should still be possible. Certain RCRA spent carbons, including those containing dioxin,
CITY OF TULARE TCP FEASIBILITY STUDY
PCBs, or those classified as corrosive, ignitable, or reactive may not be accepted by carbon suppliers. It is highly unlikely that spent carbons from municipal drinking water treatment plants will fall into any of these categories. Other RCRA classified spent carbons may need to be shipped to out-of-state regeneration facilities at greater cost.
As part of the profiling process, the City will need to complete a carbon supplier-specific form and submit it to the carbon supplier with a sample of the spent carbon. The form will include questions related to the purpose of the treatment process and the contaminants present in the water. There is a cost for profiling the spent carbon.
Once the profiling is complete, the carbon supplier can haul the spent carbon away for either recycling or reactivation. During the reactivation process, the carbon is thermally treated in a process that results in the thermal destruction of adsorbed organic contaminants. Note that the presence of DBCP may impact the disposal process at some carbon handling facilities.
7.6.4 Backwashing
Backwashing of the media must be performed after new carbon is loaded into a vessel. It may also be required if head loss builds up over time.
Newly delivered carbon must be soaked and backwashed before it is placed into service. If it is not, excessive head loss and reduced carbon adsorption capacity may result. Typically, the carbon is soaked in water for 24 hours to wet the carbon prior to the initial backwashing. Backwash flow rates will vary depending on the carbon type installed and typically range from 500 to 1,500 gpm. Backwashing new carbon accomplishes the following functions:
• Removes trapped air from the internal carbon pores and between media particles;
• Sweeps the resulting air from the carbon vessel;
• Removes carbon fines generated due to physical abrasion during transport;
• Stratifies the media bed;
• Flushes water soluble activation byproducts (e.g. ash) from the carbon.
Backwashing may also be required if the head loss through the adsorption system builds up to unacceptable levels over time. This might result if the well produces sand or other suspended solids that will accumulate in the top portion of the carbon bed. A typical “maintenance” backwash criteria is to backwash the vessels when the head loss rises to between 10 and 15 psi. However; backwashing after the initial carbon load should occur sparingly since re-stratifying the bed will disrupt the adsorption mass transfer zone and result in reduced carbon life.
Backwash water is typically supplied from the distribution system, including any water being produced by vessels that are still on-line. It is not unusual for approximately 45,000 gallons of waste washwater to be generated when new carbon is initially
CITY OF TULARE TCP FEASIBILITY STUDY
backwashed. The flow rates are almost always too high to be discharged directly to a sewer and the washwater contains fines, which usually cannot be discharged into the storm drain system. The solution for most utilities is to install a bolted steel backwash reclaim tank large enough to hold 45,000 or more gallons of washwater. To conserve water, the washwater stored in the backwash reclaim tank is pumped back into the well discharge line at a controlled rate (typically less than 10% of the well flow rate). Any fines in the washwater settle to the bottom of the reclaim tank.
7.6.5 Nitrate Sloughing
Other utilities have experienced issues with the sudden release of nitrate from activated carbon beds following vessel backwashing or periods where the system is off-line. When these events occur, the nitrate level in the GAC effluent can be significantly greater than the level in the influent water. This is known as “soughing” or “peaking”. The DDW generally considers this phenomenon to be of concern when the influent nitrate level rises to approximately one half of the MCL. The nitrate MCL is 45 mg/L reported as NO3. Wells 13, 23, 24, 37, and 43 all exceed ½ of the nitrate MCL.
The best way to mitigate nitrate sloughing is to maintain a continuous flow of water through the GAC beds. This may necessitate modifying operation of the water system so that the GAC wells become lead-wells and are not turned off during low demand periods. Regardless of operational arrangements, these treatment sites will also need to include special features to identify and resolve a nitrate sloughing event should one occur. The following special features should be required:
• Each of these sites should be equipped with an on-line nitrate analyzer that will continuously monitor the nitrate levels leaving the GAC system. The analyzer will generate an alarm if the nitrate level approaches an operator adjustable setpoint and the SCADA system will command the well off.
• These sites will need to be designed with provisions to flush the GAC system to waste for potentially several hours. If there is no nearby storm drainage facility that can handle the full well flow rate, the well will need to be equipped with a variable frequency drive or a valve that can be used to throttle the flow down to a rate that can be disposed of.
CITY OF TULARE TCP FEASIBILITY STUDY
7.6.6 Regulatory Requirements
The addition of GAC treatment to the City’s wells will result in the following regulatory requirements:
• Once a TCP MCL is established, the City will need to monitor both source water and treated water for TCP. Monitoring of the GAC vessel intermediate sample taps will also be required to track the remaining carbon life.
• The City’s water supply permit will need to be amended to include the addition of wellhead treatment. An operations plan will need to be submitted that covers each treatment plant.
• The GAC treatment plants will likely be classified by DDW as T2 facilities. This means that the City’s Chief Operator for these facilities will need to poses a T2 or higher treatment certification and any shift operators will need to poses a T1 or higher certification.
• DDW will likely require that the GAC effluent be continuously disinfected or monitored for heterotrophic plate count (HPC) bacteria to ensure that excessive levels of bacteria are not entering the distribution system. Activated carbon is a good substrate for growing bacteria.
• The City will need to comply with waste disposal characterization requirements such as RCRA hazardous waste determination for the spent carbon.
• A monthly summary of GAC operational and monitoring data will need to be submitted to DDW.
• An annual report summarizing and assessing GAC performance for the previous year will need to be submitted to DDW.
8 RECOMMENDATIONS
8.1 Treatment Process
It is recommended that each of the 13 sites evaluated in this study be treated for TCP removal using GAC adsorption. GAC is the most economical treatment solution and is also the only viable treatment alternative that can reduce the TCP concentration to below the public health goal. The GAC treatment plants should be designed utilizing a series vessel configuration and an empty bed contact time of 15 minutes.
Each treatment plant site should be equipped with backwash reclaim tanks designed to hold washwater produced during initial washing of newly delivered carbon. The washwater will be settled in the tank and the decanted water pumped back into the treatment plant. The treatment plants treating well sites 13, 23, 24, 37, and 43 should include on-line nitrate analyzers to detect nitrate sloughing.
CITY OF TULARE TCP FEASIBILITY STUDY
It is recommended that the City replace any oil-lubricated well pumps (wells 23 and 24) as part of the GAC treatment plant construction project. The City has been experiencing dropping water levels in its wells. If the water level in a well with an oil lubricated pump drops near the pump bowls, the pump will pull accumulated oil out of the well. While the oil used is food grade and will not harm consumers, it will rapidly foul the carbon requiring its replacement.
The following table lists the GAC system configuration for each of the wells sites:
8.2 Treatment Plant Siting
The impacted wells are distributed throughout the city making co-treatment impractical in most cases. Provost & Pritchard evaluated possible co-treatment options for wells 35 and 37; 13, and 38; and 43 and 44. Co-treatment is predicted to result in cost savings only for wells 43 and 44. Well sites 12, 13, 23, 24, 34, 35, 38, 43, and 44 are not large enough for construction of a GAC treatment plant and the City will therefore need to acquire additional property. Provost & Pritchard has identified preliminary proposed treatment locations for these wells based on review of aerial imagery and discussions with City staff. These locations are identified in the attached site plans (Refer to Appendix A). The proposed treatment plants for wells 11 and 37 are located next to residences. In order to facilitate Planning Department approvals for the project, it has been assumed that the GAC vessels installed at those sites will be required to be installed in 5’ deep concrete pits in order to minimize the vessel profile visible to the neighboring homes. At Well No. 37 landscaping may also be required to screen the treatment equipment.
9 COST OPINIONS
The capital cost opinions contained in this report include costs for property acquisition only for privately owned off-site properties (wells 13, 23, and 35). These property
WellFlow Rate
(gpm)
No.
Vessels
Vessel
Diameter
(ft)
Carbon Load
Per Vessel
(lb)
EBCT
(min.)
HLR
(gpm/ft2)
Back Wash
Tank Volume
(gal)
Back Wash
Tank Diameter
(ft)
8 317 2 8 10,000 15.7 6.3 30,000 18
11 885 4 12 20,000 22.5 3.9 45,000 23
12 1,441 4 12 20,000 13.8 6.4 45,000 23
13 508 2 12 20,000 19.6 4.5 45,000 23
17 1,675 6 12 20,000 17.9 4.9 45,000 23
23 433 2 12 20,000 23.0 3.8 45,000 23
24 695 2 12 20,000 14.4 6.1 45,000 23
34 1,652 6 12 20,000 18.1 4.9 45,000 23
35 1,132 4 12 20,000 17.6 5.0 45,000 23
37 1,527 4 12 20,000 13.1 6.8 45,000 23
38 1,463 4 12 20,000 13.6 6.5 45,000 23
43&44 2,895 8 12 20,000 13.8 6.4 45,000 23
Co-Treatment
CITY OF TULARE TCP FEASIBILITY STUDY
values are taken directly from County of Tulare property value assessments (Refer to Appendix B). It should be noted that these are assessed property values which may significantly underestimate the cost of property acquisition given that property owners may not be interested in selling. Provost & Pritchard is unable to accurately estimate the cost for use of public land such as schools and parks (wells 12, 24, 34, 38, and 43/44). A placeholder property value of $50,000 has been included in these cases.
The following table summarizes the estimated cost for capital improvements and ongoing operation and maintenance of the treatment plants. More detailed capital and O&M cost breakdowns are included as Appendix C.