Tunable Diode Laser Spectroscopy Application for Detection and Isotopes Ratio Measurements of UF 6 Molecules. A.Nadezhdinskii, Ya.Ponurovskii, Yu.Shapovalov, D.Stavrovskii NSC of A.M.Prokhorov General Physics Institute D. Bolyasov, G.Grigoriev, S.Malyugin, Sh.Nabiev, N.Gorshunov Institute of Molecular Physics of RRC "Kurchatov Institute"
Transcript
Tunable Diode Laser Spectroscopy Application for Detection and Isotopes Ratio
NSC of A.M.Prokhorov General Physics Institute D. Bolyasov, G.Grigoriev, S.Malyugin, Sh.Nabiev,
N.Gorshunov Institute of Molecular Physics of RRC "Kurchatov Institute"
Introduction
Beginning of Tunable Diode Laser Spectroscopy (TDLS) was related to one molecule practically in all countries. It was UF6 molecule with respect to laser uranium isotopes separation. Dramatic progress in TDLS technique achieved during last decades and success of detection of trace complex molecules again brought our intention to the same molecule because of IAEA needs related to Additional Protocol of Safeguards. There were three objectives of present paper:
1. To investigate if it is possible to use Tunable Diode Laser Spectroscopy (TDLS) technique for gaseous uranium hexafluoride enrichment measurement.
2. To analyze possibility to detect trace UF6 presence in atmosphere. 3. To detect trace HF molecule concentration due to hydrolysis of
uranium hexafluoride in atmosphere.
UF6 Absorption Bands in mid IR
0 500 1000 1500 20001E-4
1E-3
0.01
0.1
1
10
100
10000.00 0.05 0.10 0.15 0.20
ν, cm-1
!!!
E, eV
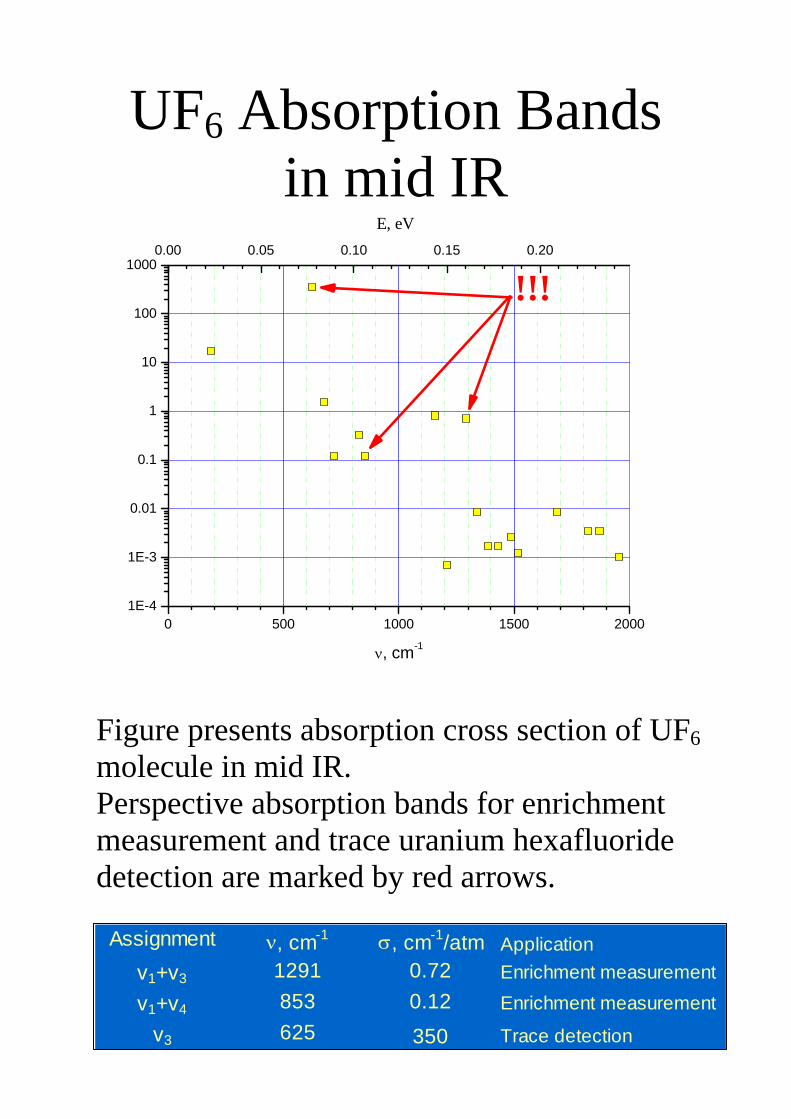
Figure presents absorption cross section of UF6 molecule in mid IR. Perspective absorption bands for enrichment measurement and trace uranium hexafluoride detection are marked by red arrows.
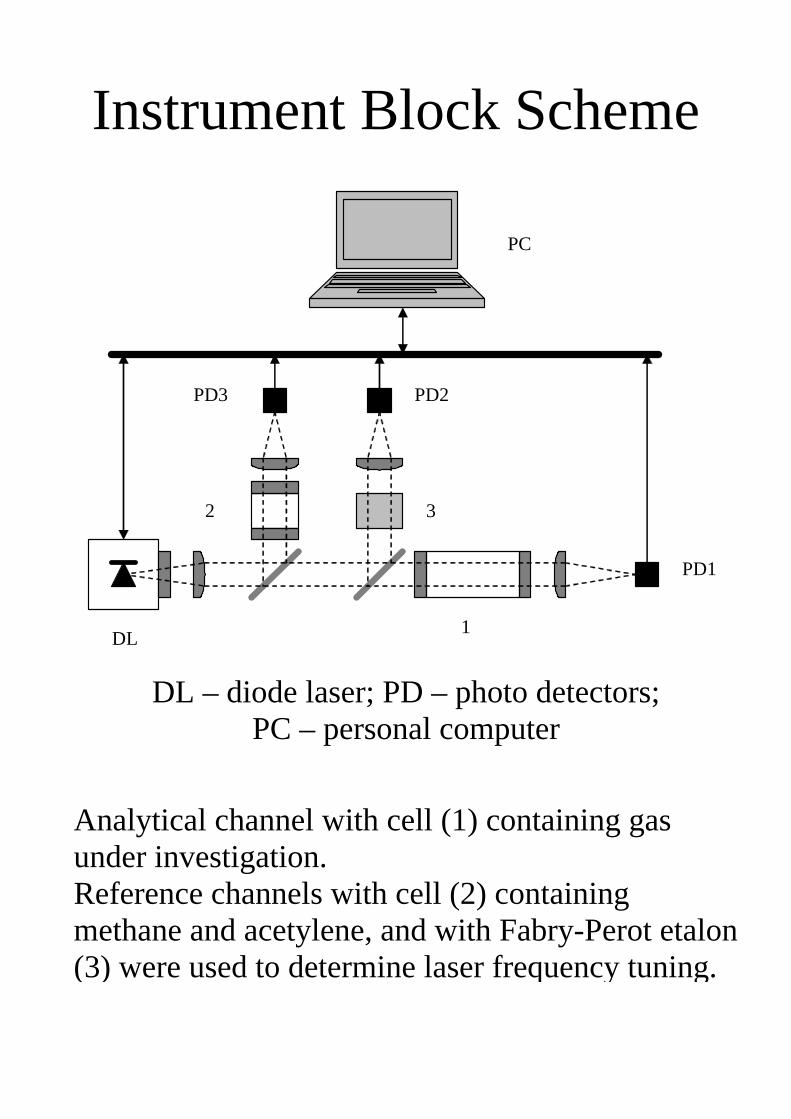
Analytical channel with cell (1) containing gas under investigation. Reference channels with cell (2) containing methane and acetylene, and with Fabry-Perot etalon (3) were used to determine laser frequency tuning.
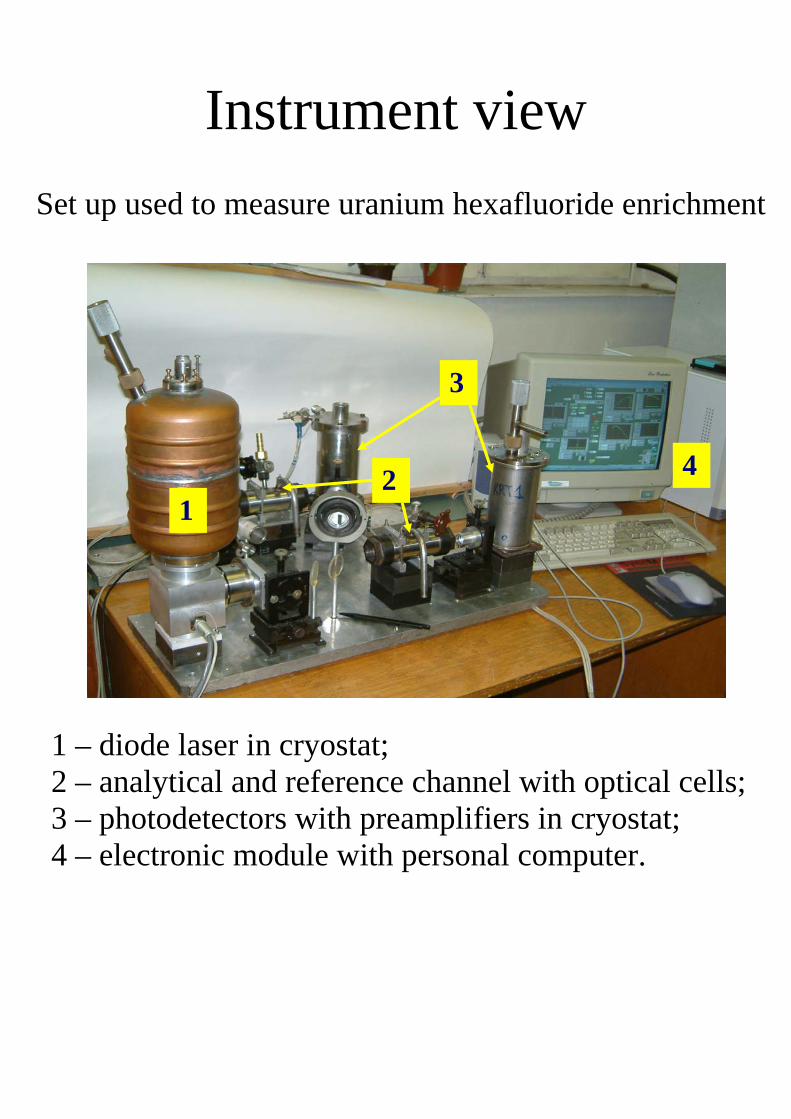
Instrument view Set up used to measure uranium hexafluoride enrichment
1 2
3
4
1 – diode laser in cryostat; 2 – analytical and reference channel with optical cells; 3 – photodetectors with preamplifiers in cryostat; 4 – electronic module with personal computer.
Instrument operation mode
0 500 1000 1500 2000
0.0
0.1
0.2
0.3
0.4
Sig
nal,
V
t, mks
Channel 1 Channel 2 Channel 3
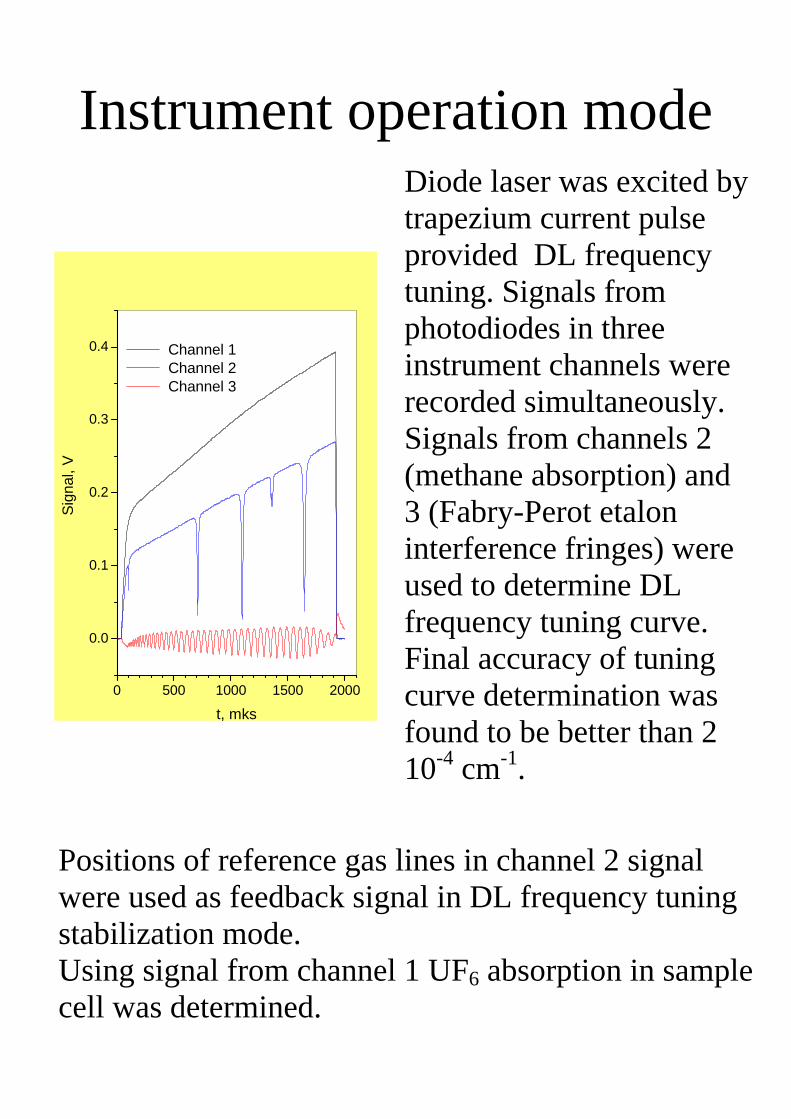
Diode laser was excited by trapezium current pulse provided DL frequency tuning. Signals from photodiodes in three instrument channels were recorded simultaneously. Signals from channels 2 (methane absorption) and 3 (Fabry-Perot etalon interference fringes) were used to determine DL frequency tuning curve. Final accuracy of tuning curve determination was found to be better than 2 10-4 cm-1.
Positions of reference gas lines in channel 2 signal were used as feedback signal in DL frequency tuning stabilization mode. Using signal from channel 1 UF6 absorption in sample cell was determined.
Software development
Users interface of software developed to measure UF6 isotope ratio.
Software was written using LabView. Software developed controlled all instruments options, recorded signals, performed data processing, and stored results obtained on hard disk.
Diode Laser Spectroscopy of UF6
1291 1292 12930.4
0.5
0.6
0.7
σ, c
m-1/a
tm
ν, cm-1
Spectra were recorded using TDL based instrument developed. Fragment of experimental absorption cross section spectrum (blue points) and model spectra for 238UF6 (black line) and 235UF6 (red line).
Problem #2: Fine structure of UF6 spectra was not included in the present model. Accurate
spectrum of 235UF6 has to be measured.
Instrument Test at IAEA UF6 Loop in Seibersdorf
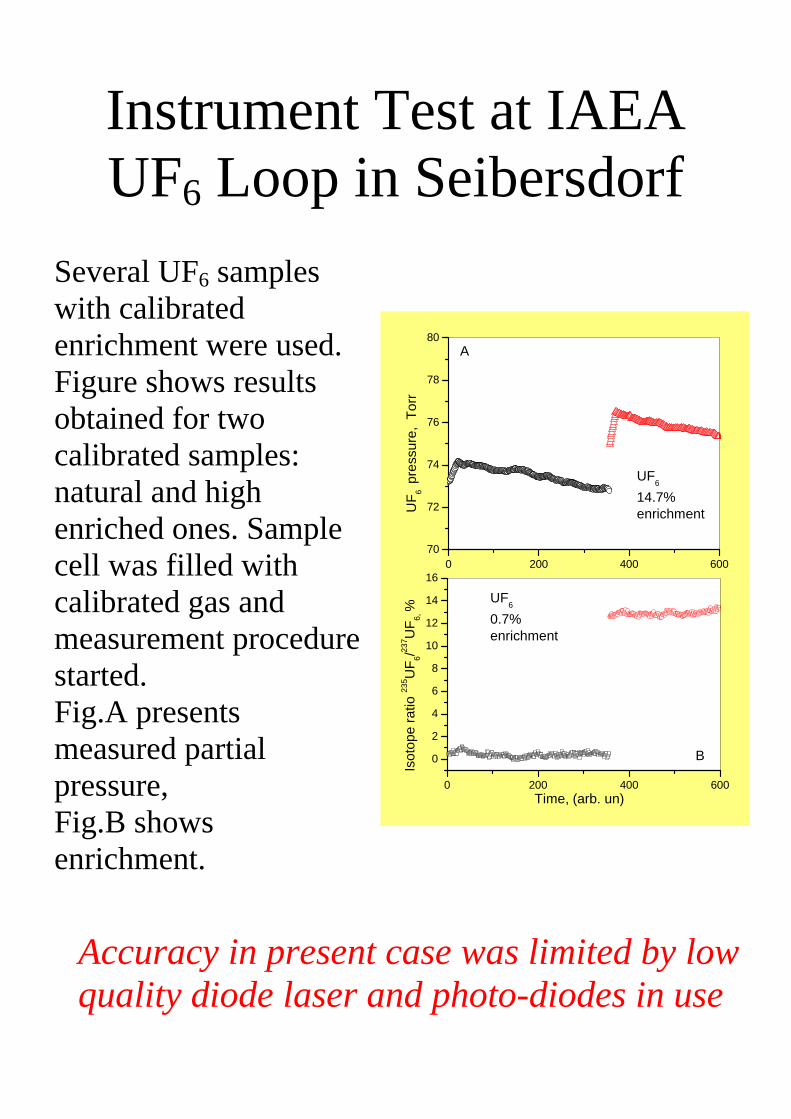
Several UF6 samples with calibrated enrichment were used. Figure shows results obtained for two calibrated samples: natural and high enriched ones. Sample cell was filled with calibrated gas and measurement procedure started. Fig.A presents measured partial pressure, Fig.B shows enrichment.
Accuracy in present case was limited by low quality diode laser and photo-diodes in use
0 200 400 60070
72
74
76
78
80
0 200 400 600
0
2
4
6
8
10
12
14
16
UF6
14.7%enrichmentU
F 6 p
ress
ure,
Tor
r
A
Isot
ope
ratio
235 U
F 6/237 U
F 6, %
Time, (arb. un)
UF6
0.7%enrichment
B
UF6 in Atmosphere
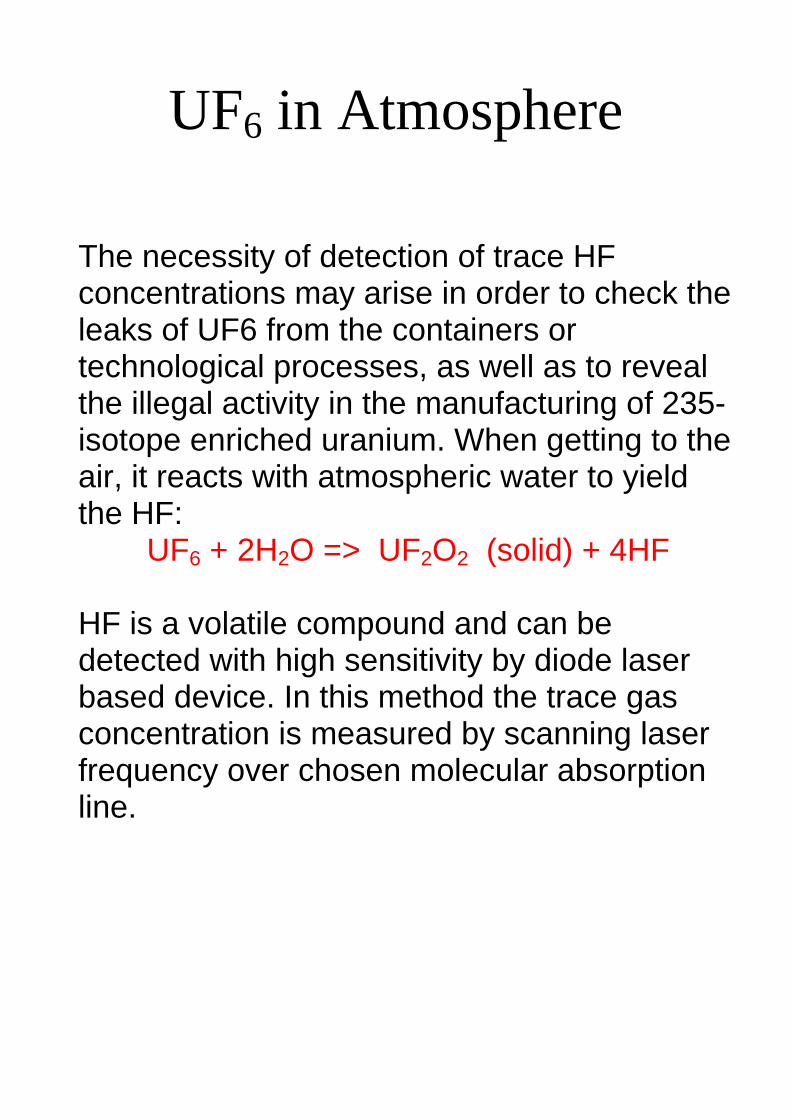
The necessity of detection of trace HF concentrations may arise in order to check the leaks of UF6 from the containers or technological processes, as well as to reveal the illegal activity in the manufacturing of 235-isotope enriched uranium. When getting to the air, it reacts with atmospheric water to yield the HF:
UF6 + 2H2O => UF2O2 (solid) + 4HF
HF is a volatile compound and can be detected with high sensitivity by diode laser based device. In this method the trace gas concentration is measured by scanning laser frequency over chosen molecular absorption line.
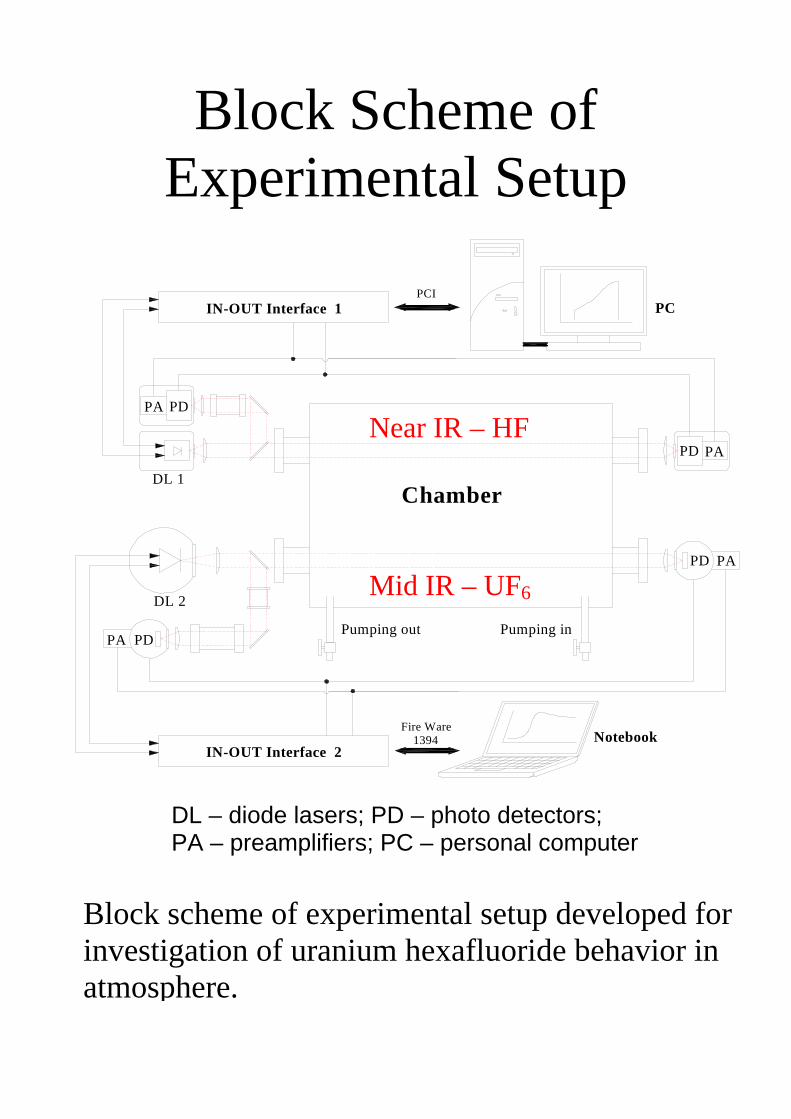
Block Scheme of Experimental Setup
DL – diode lasers; PD – photo detectors; PA – preamplifiers; PC – personal computer
Block scheme of experimental setup developed for investigation of uranium hexafluoride behavior in atmosphere.
IN-OUT Interface 1
Chamber
PD PA
PA
Fire Ware 1394
PD
PDPA
PCI
PD PA
DL 2
DL 1
Pumping out
PC
Notebook
Pumping in
IN-OUT Interface 2
Near IR – HF
Mid IR – UF6
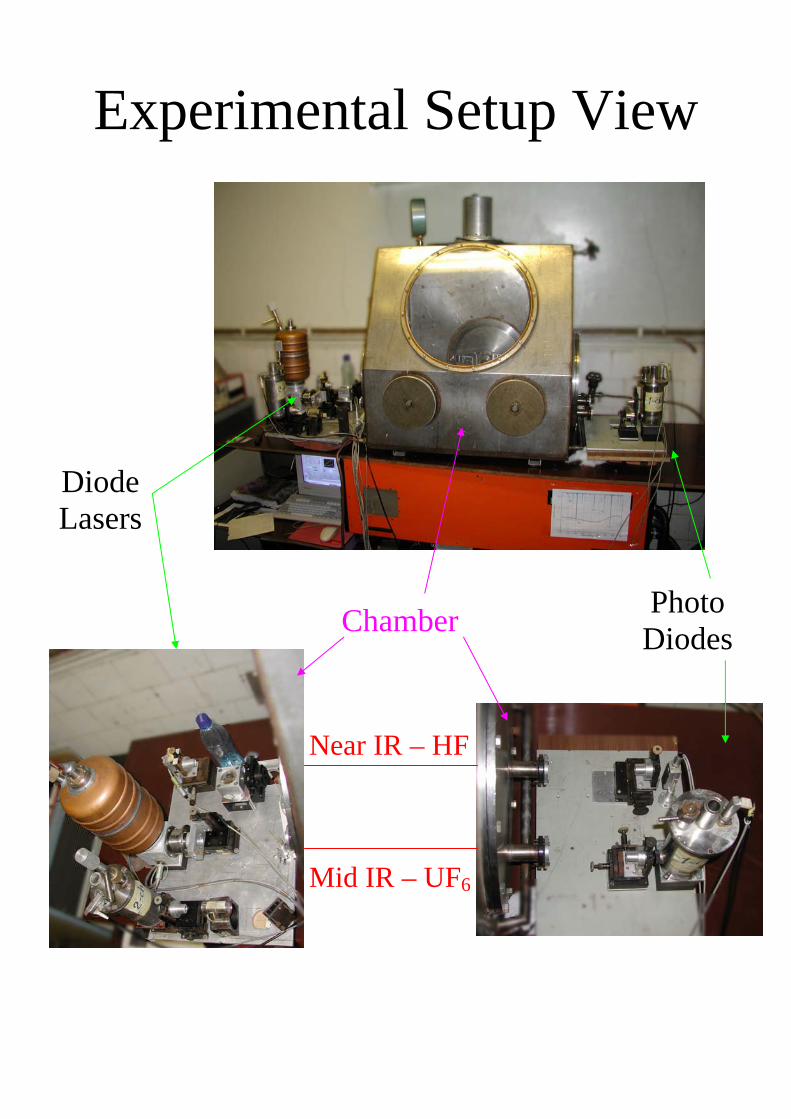
Experimental Setup View
Diode Lasers
Near IR – HF
Mid IR – UF6
Chamber Photo Diodes
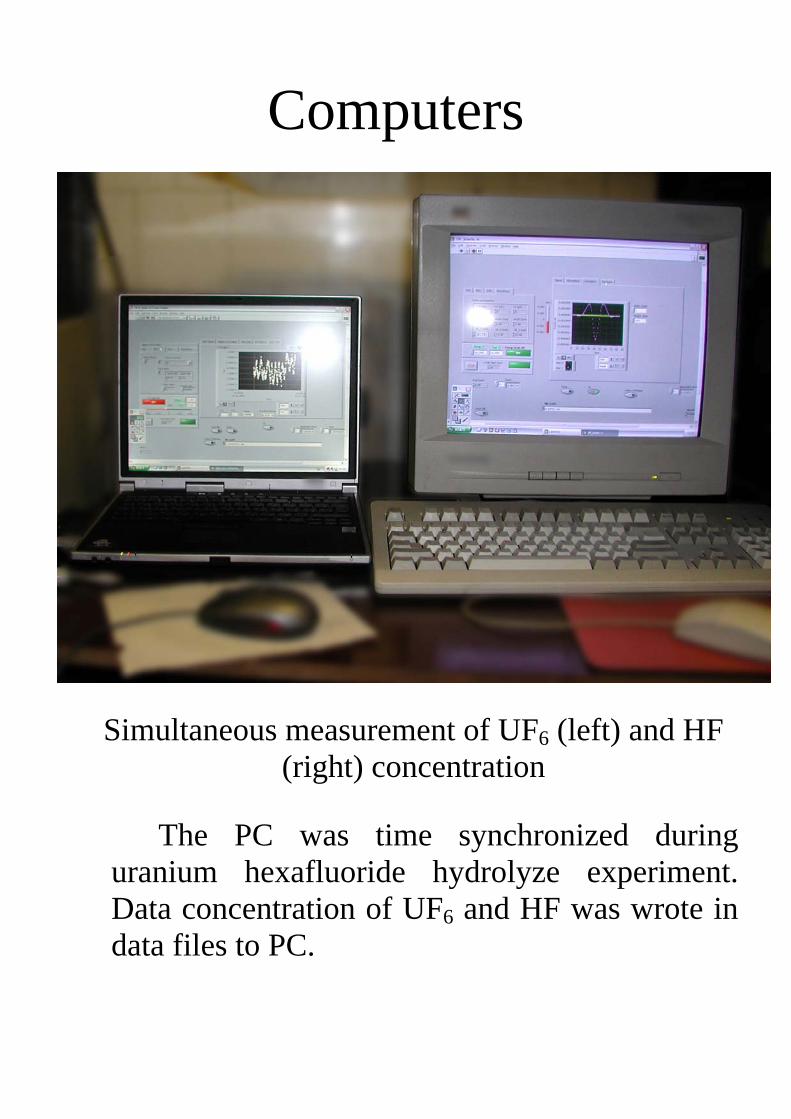
Computers
Simultaneous measurement of UF6 (left) and HF (right) concentration
The PC was time synchronized during uranium hexafluoride hydrolyze experiment. Data concentration of UF6 and HF was wrote in data files to PC.
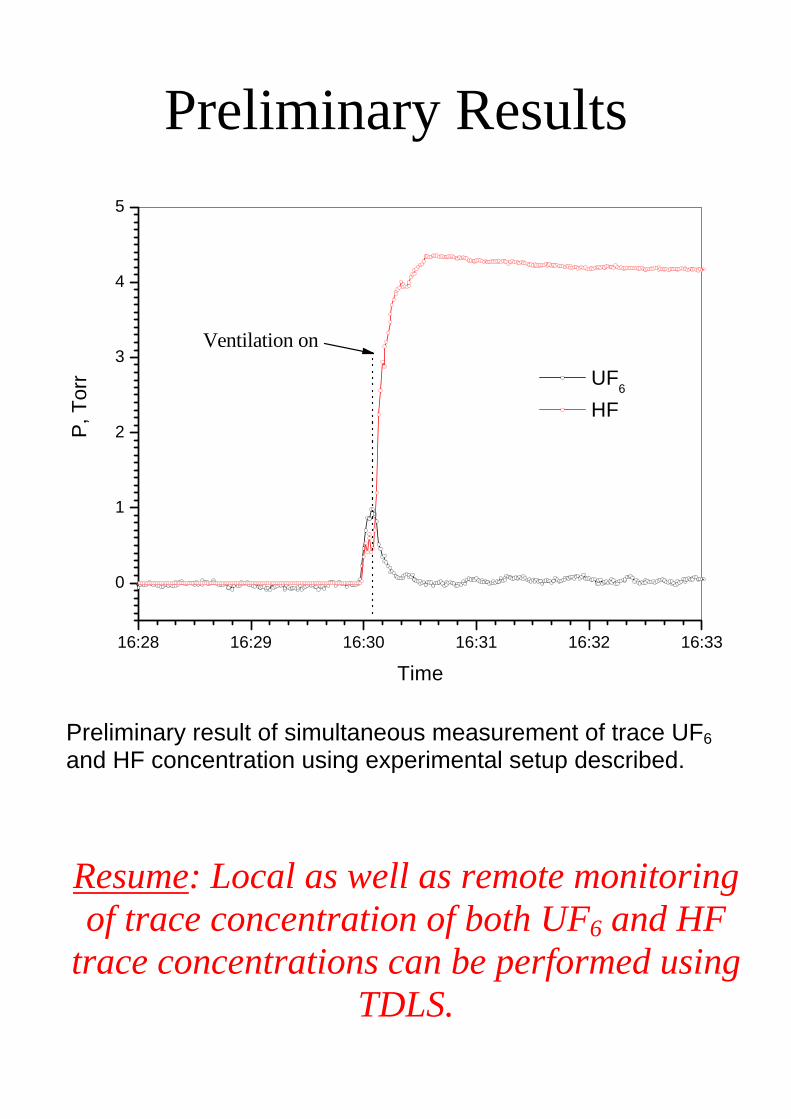
Preliminary Results
16:28 16:29 16:30 16:31 16:32 16:33
0
1
2
3
4
5
P, T
orr
Time
UF6
HF
Ventilation on
Preliminary result of simultaneous measurement of trace UF6 and HF concentration using experimental setup described.
Resume: Local as well as remote monitoring of trace concentration of both UF6 and HF
trace concentrations can be performed using TDLS.
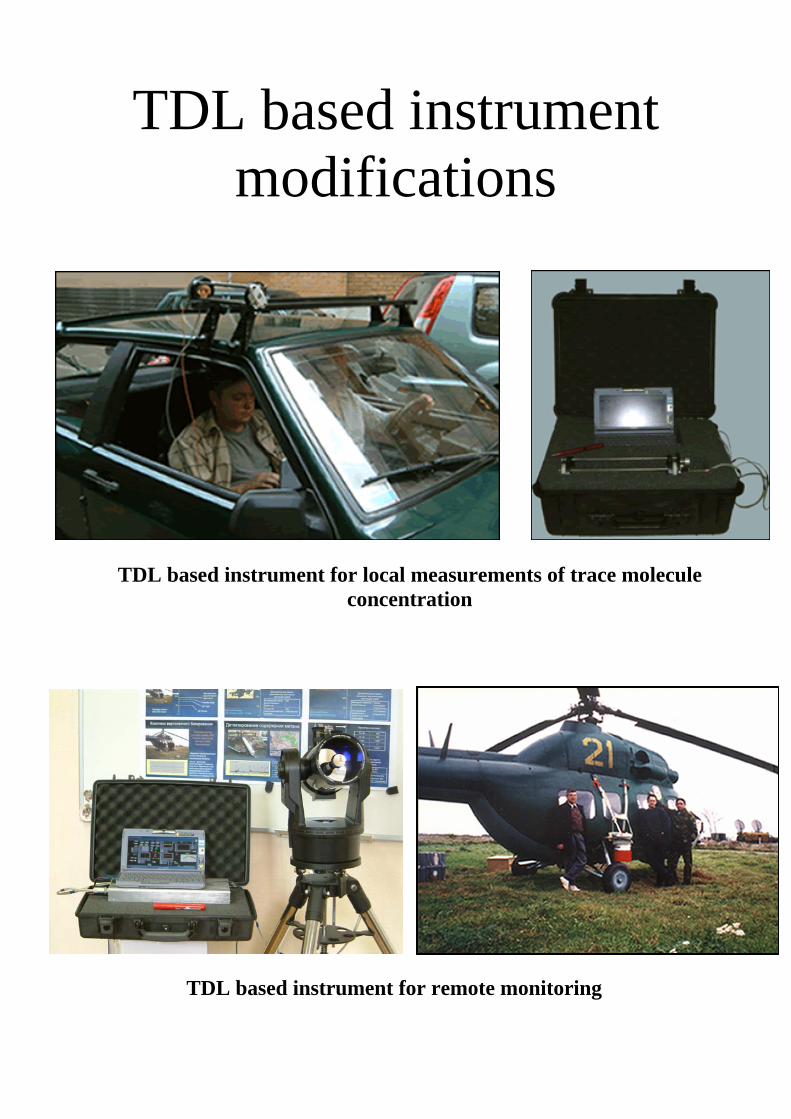
TDL based instrument modifications
TDL based instrument for local measurements of trace molecule concentration