27
Tungsten Production, Market and Forecast in the CIS 12th Edition Sample PDF Moscow July, 2017
Tungsten Production, Market
and Forecast in the CIS
12th Edition
Sample PDF
Moscow July, 2017
Tungsten Production, Market and Forecast in the CIS
INFOMINE Research Group www.infomine.ru; e-mail: [email protected]; Phone: +7 (495) 988-1123 2
This report was prepared by experts of OOO INFOMINE Research Group for information purposes only. Information contained in this report was obtained from sources which, according to experts INFOMINE, are reliable, but INFOMINE does not guarantee the accuracy or completeness of the information for any purposes. Information presented in this report should not be construed, directly or indirectly, as an information containing advice on investments. All opinions and estimates contained in this material reflect the opinions of the authors of the publication date and are subject to change without notice. INFOMINE is not responsible for the any loss or damage arising from use by any third party information contained in this report, including published opinions and conclusions, as well as effects caused by the incompleteness of information provided. Iinformation presented in this report is obtained from public sources or provided by the companies mentioned in the report. Additional information is available upon request. This document or any part thereof may not be distributed without the written permission of InfoMine or be replicated by any means. Copyright © OOO INFOMINE Research Group
Tungsten Production, Market and Forecast in the CIS
INFOMINE Research Group www.infomine.ru; e-mail: [email protected]; Phone: +7 (495) 988-1123 3
CONTENTS
Annotation .................................................................................................................. 15
Introduction ............................................................................................................... 17
1. Brief characteristic of the world market of tungsten raw materials (stocks,
production, prices)..................................................................................................... 18
2. Tungsten mineral resources in the CIS ............................................................... 28
3. The market of tungsten concentrate in the CIS ................................................. 37
3.1. Requirements to quality of tungsten concentrate, the technology of its production ................................................................................................................ 37
3.2. Russia ................................................................................................................ 39
3.2.1. Production of tungsten concentrate in Russia in 1996-2016 ............................................ 39 3.2.2. Current state of the enterprises releasing tungsten concentrate in Russia ........................ 43
OAO Primorsky GOK (OAO GRK AIR, Primorsky Krai) .................................................................................. 43 OOO Lermontovsky GOK ((Primorsky Krai) ..................................................................................................... 51 ZAO Novoorlovsky GOK (Zabaykalsky Krai) ..................................................................................................... 56 AO Zakamensk (Republic of Buryatiya).............................................................................................................. 61 OOO Staratelskaya artel Kvarts (Zabaykalsky Krai) ......................................................................................... 66 OOO Pravourmyiskoe (Khabarovsk Krai) ......................................................................................................... 68 The enterprises, which stopped production ........................................................................................................ 69
3.2.3. Export and import of tungsten concentrate in Russia in 2000-2016 ................................ 77 Export ................................................................................................................................................................. 77 Import ................................................................................................................................................................. 84
3.2.4. Consumption of tungsten concentrate in Russia in 1999-2016, balance of production and consumption ............................................................................................................................... 89
3.3. Production of tungsten concentrate in Kazakhstan ........................................... 92
3.4. Production of tungsten concentrate in Uzbekistan ........................................... 94
3.5. Production of tungsten concentrate in Kyrgyzstan ........................................... 96
3.6. Production of tungsten concentrate in Tajikistan ............................................. 99
4. Market of tungsten anhydride and ammonium paratungstate in Russia and
the CIS ...................................................................................................................... 100
4.1. Russia .............................................................................................................. 102
4.1.1. . Production of tungsten anhydride and ammonium paratungstate in 1999-2016 .......... 102 4.1.2. The current state of enterprises manufacturing ammonium paratungstate and tungsten anhydride .................................................................................................................................. 103
OAO Gidrometallurg (KBR, Nalchik) ............................................................................................................... 103 AO Kirovgrad hard alloys plant (Russia, Sverdlovsk region) .......................................................................... 113 The enterprises which stopped production of PTA ........................................................................................... 116
4.1.3. Export-import of tungsten anhydride, ammonium paratungstate, other tungstates in the Russian Federation in 1999-2016 ............................................................................................. 117
Export-import of tungsten anhydride of the Russian Federation in 1999-2016 ............................................... 117 Export-import of ammonium paratungstate in the Russian Federation in 1999-2016 ..................................... 123 Export of lead tungstate by the Russian Federation in 2007-2016 ................................................................... 126
Tungsten Production, Market and Forecast in the CIS
INFOMINE Research Group www.infomine.ru; e-mail: [email protected]; Phone: +7 (495) 988-1123 4
Export and import of other tungstates of the Russian Federation in 2012-2016 .............................................. 127 4.1.4. Balance of production and consumption of PTA and tungsten anhydride (in terms of WO3) in the Russian Federation in 1999-2016 ........................................................................ 128
4.2. Uzbekistan ....................................................................................................... 130
4.2.1. Current state of the enterprises manufacturing PTA and tungsten anhydride in Uzbekistan ................................................................................................................................ 130
OAO Uzbek combine of refractory and heat-resistant metals .......................................................................... 130
5. The state of industries consuming tungsten-containing raw materials in the
CIS ............................................................................................................................ 132
5.1. Production, export and import of ferro-tungsten in the CIS ........................... 135
5.1.1. Production of ferro-tungsten in Russia in 2009-2016 Main Russian producers ............ 135 OOO Moliren (Russia, Moscow region) ........................................................................................................... 139 OOO Unecha plant of refractory metals – UZTM (Russia, Bryansk region) ................................................... 140 OOO Buruktal nickel plant (Russia, Orenburg region) .................................................................................... 140 OOO Enterprise Kristall (Russia, Kostroma region) ....................................................................................... 141 OOO Zubtsov Machinery plant (Russia, Tver region) ...................................................................................... 142 PAO Kluchevskiy Ferroalloy Plant (Russia, Sverdlovsk region) ...................................................................... 143 OOO Vishnevogorsk metallurgical plant Severny Niobii (Russia) ................................................................... 144 Other Russian producers .................................................................................................................................. 144 Enterprises of Russia which stopped production of ferro-tungsten .................................................................. 146
5.1.2. Enterprises of Ukraine .................................................................................................... 147 5.1.3. Export and import of ferro-tungsten in the CIS in 1999-2016 ....................................... 149
Russia................................................................................................................................................................ 149 Ukraine ............................................................................................................................................................. 158 Kazakhstan ........................................................................................................................................................ 162
5.2. Production, export and import of metal tungsten in the CIS .......................... 163
5.2.1. Current state of enterprises-manufacturers of metallic tungsten and products from it in the CIS ...................................................................................................................................... 165
OAO Pobedit (Russia, N. Osetiya) .................................................................................................................... 165 AO Polema (Russia, Tula Region) .................................................................................................................... 171 AO Kirovgrad hard alloys plant (Russia, Sverdlovsk region) .......................................................................... 179 OOO Unecha plant of refractory metals .......................................................................................................... 180 (Russia, Bryansk region, Unecha) .................................................................................................................... 180 OAO Uzbek combine of refractory and heat-resistant metals (Uzbeksitan) ..................................................... 183 OAO Toreztverdosplav (Ukraine, Donetsk Region).......................................................................................... 186 SSPE Alkon-Tverdosplav (Ukraine, Kiev) ........................................................................................................ 186 The enterprises which stopped their work (Ukraine) ........................................................................................ 187
5.2.2. Export and import of metallic tungsten in the CIS in 1999-2016 .................................. 188 Russia................................................................................................................................................................ 188 Ukraine ............................................................................................................................................................. 204 Other countries.................................................................................................................................................. 212
6. Export-import prices of tungsten production in Russia in 1999-2016 ........... 217
6.1. Tungsten concentrate ...................................................................................... 217
6.2. Ferro-tungsten ................................................................................................. 219
6.3. Compounds of tungsten .................................................................................. 221
6.4. Metallic tungsten and products from it ........................................................... 223
7. Brief characteristic of the industries consuming metallic tungsten ............... 225
7.1. Production of tungsten carbide and hard alloys .............................................. 226 AO Kirovgrad hard alloys plant ....................................................................................................................... 228 OAO Pobedit (Vladikavkaz, N. Osetiya) ........................................................................................................... 232

Tungsten Production, Market and Forecast in the CIS
INFOMINE Research Group www.infomine.ru; e-mail: [email protected]; Phone: +7 (495) 988-1123 5
OAO Sandvik-MKTS ......................................................................................................................................... 232 OOO Unecha plant of refractory metals/ZAO Company Wolfram ................................................................... 233
7.2. Production of high-speed steels ...................................................................... 235
7.3. Production of corrosion-resistant, heat resistant steels and alloys. Production of heavy alloys ........................................................................................................... 237
7.4. Lighting industry ............................................................................................. 238
7.5. Electronics ....................................................................................................... 243
7.6. Others .............................................................................................................. 246
8. Projects and investments in the tungsten industry of the CIS countries ....... 249
8.1. Projects in the tungsten industry of Russia ..................................................... 249
8.1.1. Russian projects on development of new deposits ......................................................... 249 8.1.2. Russian projects on building of new productions on processing of tungsten concentrates .................................................................................................................................................. 255 8.1.3. Russian projects on production of ferro-tungsten .......................................................... 258
8.2. Project on renewal of production and processing of tungsten in Uzbekistan 259
8.3. Projects on renewal of extraction of tungsten in Kazakhstan ......................... 260
8.4. Projects on renewal of extraction of tungsten in Tajikistan ........................... 261
8.5. The project on extraction of tungsten in Kyrgyzstan ..................................... 262
9. The state and forecast of production and consumption of tungsten raw
materials in Russia till 2025.................................................................................... 263
Appendix. Telephone book of manufacturers of tungsten production .............. 270
Tungsten Production, Market and Forecast in the CIS
INFOMINE Research Group www.infomine.ru; e-mail: [email protected]; Phone: +7 (495) 988-1123 6
LIST OF TABLES
Table 1. Stocks and extraction of tungsten ores in the world in 2003-2016 (in terms of WO3), thousand tons
Table 2. The largest exporters of a tungsten concentrate in 2007-2016, tons Table 3. The largest importers of tungsten concentrate in 2007-2016, tons Table 4. Largest exporters of metallic tungsten and products from it in 2007-2016,
tons Table 5. Largest importers of metallic tungsten and products from it in 2007-2016,
tons Table 6. Dynamics of the prices of tungsten concentrates (in physical terms) of main
world exporters and importers in 2007-2016, $/kg of tungsten concentrate Table 7. Basic minerals of tungsten Table 8. Main deposits of tungsten in the territory of the CIS Table 9. The main fields of tungsten in Russia by types and by the average WO3
content in ores, % Table 10. Chemical compositions and application of tungsten concentrates (GOST
213-83) Table 11. Dynamics of production of tungsten concentrate by enterprises in Russia in
1998-2016 in physical terms and recalculated in terms of WO3, tons Table 12. Russian consumers of tungsten concentrate of production of OAO
Primorsky GOK in 2007-2016, tons Table 13. Directions of export of tungsten concentrate of OAO Primorsky GOK in
1999-2016, tons Table 14. Foreign recipients of tungsten concentrate of OAO Primorsky GOK in
2007-2016, tons Table 15. Economic indicators of activity of OAO Primorsky GOK /OAO GRK AIR
in 2012-2016 Table 16. Russian recipients of tungsten concentrate of production of OOO
Lermontovsky GOK in 2002-2016, tons Table 17. Directions of export of tungsten concentrate of OOO Lermontovsky GOK
in 1999-2012, tons Table 18. Foreign recipients of tungsten concentrate of OOO Lermontovsky GOK in
2010-2012, tons Table 19. Recipients of tungsten concentrate of production of ZAO Novoorlovsky
GOK in Russia in 2004-2016, tons Table 20. Directions of export of tungsten concentrate of ZAO Novoorlovsky GOK
in 2007-2016, tons Table 21. Foreign recipients of tungsten concentrate of ZAO Novoorlovsky GOK in
2007-2016, tons Table 22 Russian recipients of tungsten concentrate of production of AO Zakamensk
in 2010-2016, tons Table 23. Directions of export of tungsten concentrate of AO Zakamensk in 2010-
2016, tons Table 24. Foreign recipients of tungsten concentrate of AO Zakamensk in 2010-2016,
tons
Tungsten Production, Market and Forecast in the CIS
INFOMINE Research Group www.infomine.ru; e-mail: [email protected]; Phone: +7 (495) 988-1123 7
Table 25. recipients of tungsten concentrate production of OOO Staratelskaya artel Kvarts in 2002-2012, tons
Table 26. Russian recipients of tungsten concentrate of production of OAO Dzidinsky Wolfram in 2002-2006, tons
Table 27. Directions of export of tungsten concentrate from Russia in 1999-2016, tons, thousand $
Table 28. Main exporters of tungsten concentrate from Russia in 2007-2016, tons Table 29. Main foreign recipients of tungsten concentrate from Russia in 2007-2016,
tons Table 30. Countries exporting tungsten concentrate to Russia in 2000-2016, ton,
thousand $ Table 31. Main companies-exporters of tungsten concentrate to Russia in 2007-2016,
tons Table 32. Main Russian companies-importers of tungsten concentrate in 2007-2016,
tons Table 33. Balance of production and consumption of tungsten concentrate (in terms
of WO3) in Russia in 1999-2016, thousand tons Table 34. Directions of export and import of tungsten concentrate in Kazakhstan in
2006-2016, ton, thousand $ Table 35. Deliveries of domestic and imported tungsten concentrates to OAO
Gidrometallurg in 2002-2016, tons Table 36. Export of ammonium paratungstate by OAO Gidrometallurg in 1999-2016,
tons, thousand $ Table 37. Export of tungsten anhydride by OAO Gidrometallurg in 1999-2016, ton,
thousand $ Table 38. Activity indicators of OAO Gidrometallurg in 2003-2016 Table 39. SWOT analysis of OAO Gidrometallurg Table 40. Deliveries of tungsten concentrate to AO Kirovgrad hard alloys plant in
2002-2016, tons Table 41. Mass fractions of the impurity, contained in tungsten anhydride of
production of AO Kirovgrad hard alloys plant, % Table 42. Financial performance indicators of AO Kirovgrad hard alloys plant in
2007-2016 Table 43. Main exporters of tungsten anhydride from Russia in 2007-2016, tons,
thousand $ Table 44. Directions of export of tungsten anhydride from Russia in 1999-2016, tons,
thousand $ Table 45. Main foreign recipients of tungsten anhydride from Russia in 2007-2016,
tons Table 46. Countries-exporters of tungsten anhydride to Russia in 2002-2016, tons,
thousand $ Table 47. Russian recipients of tungsten anhydride in 2014-2016, tons Table 48. Directions of export of PTA from Russia in 1999-2016, tons, thousand $ Table 49. Main exportes of PTA from Russia in 2007-2016, tons Table 50. Main foreign recipients of PTA from Russia in 2007-2016, tons

Tungsten Production, Market and Forecast in the CIS
INFOMINE Research Group www.infomine.ru; e-mail: [email protected]; Phone: +7 (495) 988-1123 8
Table 51. Imports of PTA to Russia by the countries in 1999-2016, tons, thousand $ Table 52. Export of crystals of lead tungstate and the furnace charge for their
production from Russia in 2007-2016, tons, thousand $ Table 53. Dynamics of import deliveries to Russia of tungstates in 2012-2016, tond,
thousand $ Table 54. Balance of production and consumption of PTA and tungsten anhydride (in
terms of WO3) in the Russian Federation in 1999-2016, tons Table 55. Main manufacturers of tungsten-containing production in the CIS and their
range of products Table 56. . Requirements to the chemical composition of ferro-tungsten (GOST
17293-82) Table 57. Financial performance indicators of OOO Moliren in 2010-2015, million
rubles Table 58. Main financial performance indicators of OOO Buruktal nickel plant in
2011-2015, million rubles Table 59. Main financial performance indicators of OOO Kristall enterprise
(Kostroma) in 2011-2015, million rubles Table 60. Main financial performance indicators of OOO Zubtsov Machinery plant in
2011-2015, million rubles Table 61. Activity indicators of OAO Klyuchevskiy Ferroalloy Plant in 2009-2016 Table 62. Main financial performance indicators of OOO VMZ Severny Niobii in
2013-2015, million rubles Table 63. Main financial performance of OOO Kanta in 2011-2015, million rubles Table 64. Indicators of financial and economic activity of OOO Ryazan Plant of
Ferroalloys and Ligatures in 2011-2015, million rubles Table 65. Directions of exports of ferro-tungsten from Russia in 1999-2016, tons,
thousand $ Table 66. Main foreign recipients of ferro-tungsten from Russia in 2010-2016, tons Table 67. Main exporters of ferro-tungsten from Russia in 2011-2016, tons Table 68. Structure of export of ferro-tungsten by the content of metal in alloy in
2014-2016, tons, % Table 69. Countries-suppliers of ferro-tungsten to Russia in 1999-2016, tons,
thousand $ Table 70 Main companies-exporters of ferro-tungsten to Russia in 2011-2016, tons Table 71. Main Russian companies-importers of ferro-tungsten in 2009-2016, tons Table 72. Directions of export of ferro-tungsten from Ukraine in 2001-2006, tons,
thousand $ Table 73. Countries-manufacturers of ferro-tungsten imported to Ukraine in 2001-
2016, tons, thousand $ Table 74. Companies-exporters of ferro-tungsten to Ukraine in 2007-2016, tons Table 75. Ukrainian companies-recipients of ferro-tungsten in 2007-2016, tons Table 76. Directions of export of ferro-tungsten from Kazakhstan in 2011-2013, tons,
thousand $ Table 77. Directions of import of ferro-tungsten to Kazakhstan in 2007-2016, tons,
thousand $

Tungsten Production, Market and Forecast in the CIS
INFOMINE Research Group www.infomine.ru; e-mail: [email protected]; Phone: +7 (495) 988-1123 9
Table 78. Chemical composition of tungsten billets (GOST 49-19-76-81) Table 79. Financial performance indicators of OAO Pobedit in 2010-2016, thousand
rubles Table 80. SWOT analysis of OAO Pobedit Table 81. . Key domestic consumers of tungsten production of AO Polema Table 82. Financial performance indicators of AO Polema in 2008-2016 Table 83. SWOT analysis of AO Polema Table 84. Financial performance indicators of ZAO Company Wolfram in 2008-
2015, million rubles Table 85. Deliveries of tungsten production of UzKTZhM to Russia in 2001-2002,
2008-2014, tons, thousand $ Table 86. Directions of export of metallic tungsten and products from it from Russia
in 1999-2016, tons, thousand $ Table 87. Main exporters of metallic tungsten and products from it from Russia in
2007-2016, tons Table 88. Main foreign recipients of metallic tungsten and products from it from
Russia in 2007-2016, tons Table 89. Directions of import of metallic tungsten and products from it to Russia in
1999-2016, tons, thousand $ Table 90. Main companies-exporters of metallic tungsten and products from it to
Russia in 2007-2016, tons Table 91. Main Russian companies-importers of metallic tungsten and products from
it in 2007-2016, tons Table 92. Import of metallic tungsten to the Russian Federation by types of products
and main Russian recipients in 2014-2016, tons Table 93. Directions of export of metallic tungsten and products from it from Ukraine
in 2001-2016, tons, thousand $ Table 94. Main companies-exporters of metallic tungsten and products from it from
Ukraine in 2007-2016, tons Table 95. Main foreign recipients of metallic tungsten and products from it from
Ukraine in 2007-2016, tons Table 96. Directions of import of metal tungsten and products from it to Ukraine in
2001-2016, tons, thousand $ Table 97. Main companies-exporters of metallic tungsten and products from it to
Ukraine in 2007-2016, tons Table 98. Main Ukrainian companies-importers of metallic tungsten and products
from it in 2007-2016, tons Table 99. Directions of export of metal tungsten and products from it Uzbekistan in
2002-2016, tons Table 100. Directions of export and import of metallic tungsten and products from it
in Belarus in 2007-2016, tons, thousand $ Table 101. Directions of export and import of metallic tungsten and products from it
in Kyrgyzstan in 2007-2016, tons, thousand $ Table 102. Directions of import of metallic tungsten and products from it to
Kazakhstan in 2007-2016, tons, thousand $
Tungsten Production, Market and Forecast in the CIS
INFOMINE Research Group www.infomine.ru; e-mail: [email protected]; Phone: +7 (495) 988-1123 10
Table 103. Directions of import of metallic tungsten and products from it to other CIS countries in 2007-2016, tons, thousand $
Table 104. Dynamics of average annual export prices of tungsten concentrate of the main suppliers in 2007-2016, $/kg
Table 105. Dynamics of the average annual export prices of ferro-tungsten of various brands in Russia in 2008-2016, $/kg
Table 106. Dynamics of the average annual export prices of metallic tungsten and products from it in 2007-2016, $/kg
Table 107. Dynamics of average annual import prices of metallic tungsten and products from it in 2007-2016, $/kg
Table 108. SWOT analysis of AO Kirovgrad hard alloys plant Table 109. Financial performance indicators of OAO Sandvik-MKTS in 2007-2016,
million rubles Table 110. Import of tungsten wire by the main companies of the lighting industry of
Russia in 2002-2016, kg Table 111. Import of tungsten production by OAO Svetlana in 2005-2016, kg Table 112. Forecast of production and consumption of tungsten concentrate in Russia
till 2025, thousand tons (in terms of WO3)

Tungsten Production, Market and Forecast in the CIS
INFOMINE Research Group www.infomine.ru; e-mail: [email protected]; Phone: +7 (495) 988-1123 11
LIST OF FIGURES Figure 1. Structure of production of tungsten by countries in 2016, % Figure 2. Structure of consumption of tungsten by countries in 2012-2016, % Figure 3. Main tungsten deposits and distribution of tungsten trioxide stocks by
subjects of the Russian Federation, thousand tons Figure 4. Dynamics of release of tungsten concentrate in Russia in 1996-2016,
thousand tons Figure 5. Structure of release of tungsten concentrate in Russia by enterprises in
2016, % Figure 6. Dynamics of production*, export and internal deliveries of tungsten
concentrate of OAO Primorsky GOK in 1998-2016, thousand tons Figure 7. Dynamics of production*, export and internal deliveries of tungsten
concentrate of Lermontovsky GOK in 1999-2016, thousand tons Figure 8. Dynamics of production, export and internal deliveries of tungsten
concentrate of ZAO Novoorlovsky GOK in 2004-2016, thousand tons Figure 9. Dynamics of production*, export and internal railway deliveries of tungsten
concentrate of AO Zakamensk in 2010-2016, thousand tons Figure 10. Dynamics of production of tungsten concentrate of OOO Staratelskaya
artel Kvarts in 2002-2016, thousand tons (in terms of a 60% WO3 concentrate) Figure 11. Dynamics of production of tungsten concentrate (in terms of WO3) in
OOO Pravourmyiskoe in 2010-2016, tons Figure 12. Dynamics of production, export and internal deliveries of tungsten
concentrate of OAO Dalolovo in 1999-2009, tons Figure 13. Dynamics of production and export of tungsten concentrate of OOO
Kalgutinskoye Mine Administration in 2001-2008, tons Figure 14. Dynamics of production and internal deliveries of tungsten concentrate of
OAO Dzidinskyi Wolfram in 2002-2006, tons Figure 15. Dynamics of production of the tungsten concentrate at OAO Tyrnyauz
GOK in 1996-2001, thousand tons Figure 16. Dynamics of export of tungsten concentrate from Russia in 1999-2016,
tons, million $ Figure 17. Regional structure of export of tungsten concentrate from Russia in 2001-
2016, % Figure 18. Structure of export of tungsten concentrate from Russia by brands in 2007-
2016, % Figure 19. Dynamics of import of tungsten concentrate to Russia in physical and
money terms in 2000-2016, tons, thousand $ Figure 20. Structure of import of tungsten concentrate to Russia on the WO3 content
in 2007-2016, % Figure 21. Dynamics of "apparent" consumption of tungsten concentrate (in terms of
WO3) in the Russian Federation in 1999-2016, thousand tons Figure 22. Dynamics of production of PTA and tungsten anhydride (in terms of WO3)
in Russia in 1999-2016, tons Figure 23. Dynamics of release of tungsten production (in terms of WO3) in OAO
Gidrometallurg in 1999-2016, tons

Tungsten Production, Market and Forecast in the CIS
INFOMINE Research Group www.infomine.ru; e-mail: [email protected]; Phone: +7 (495) 988-1123 12
Figure 24. Dynamics of production of tungsten production, export of tungsten anhydride and of ammonium paratungstate (in terms of WO3) by OAO Gidrometallurg in 2007-2016, tons
Figure 25. Dynamics of production of tungsten anhydride at Kirovgrad plant of hard alloys in 2003-2016, tons
Figure 26. Dynamics of export of tungsten anhydride from Russia in 1999-2016, tons, million $
Figure 27. Dynamics of import of tungsten anhydride to Russia in 2002-2016, tons, thousand $
Figure 28. Dynamics of export of PTA from the Russian Federation in 1999-2016, tons, million $
Figure 29. Dynamics of "apparent" consumption of PTA and tungsten anhydride (in terms of WO3) in Russia in 1999-2016, thousand tons
Figure 30. Dynamics of supply of tungsten anhydride from the Russian Federation to Uzbekistan in 2003-2012, tons
Figure 31 Scheme of release of tungsten production and scope of its application Figure 32. Dynamics of production of ferro-tungsten in the Russian Federation
according to Rosstat in 2009-2016, tons Figure 33. Dynamics of production of ferro-tungsten in the Russian Federation in
2009-2016, tons Figure 34. Production of ferro-tungsten in OAO ChEMK (in terms of 72% of W) in
1996-1999, tons Figure 35. Dynamics of production of ferro-tungsten in Ukraine in 2004-2007, tons Figure 36. Dynamics of export and import of ferro-tungsten in Russia in 1999-2016,
tons Figure 37. Structure of exports of ferro-tungsten from Russia by brands in 2007-
2013, % Figure 38. Dynamics of export and import of ferro-tungsten in Ukraine in 2001-2016,
tonss Figure 39. Dynamics of release of tungsten production at OAO Pobedit in 1999-2016,
tons Figure 40. Dynamics of export shipments of metallic tungsten of productions of OAO
Pobedit in 2007-2016, tons Figure 41. Dynamics of release of products from tungsten in AO Polema in 1999-
2016, tonss Figure 42. Dynamics of export shipments of products from tungsten of AO Polema in
2007-2016, tons Figure 43. Dynamics of production of tungsten powders in AO Kirovgrad hard alloys
plant in 1999-2016, tons Figure 44. Dynamics of export supplies of tungsten powder of production of AO
Kirovgrad hard alloys plant in 2003-2008, kg Figure 45. Production of tungsten at OAO UzKTZhM in 1999-2016, tons Figure 46. Dynamics of the Russian export/import of metallic tungsten and products
from it in 1999-2016, tons

Tungsten Production, Market and Forecast in the CIS
INFOMINE Research Group www.infomine.ru; e-mail: [email protected]; Phone: +7 (495) 988-1123 13
Figure 47. Comparison of export shipments of metallic tungsten from the Russian Federation in 2007-2016 by different sources, tons
Figure 48. Structure of export of tungsten from Russia by types of products in 2007-2016, %
Figure 49. Main countries-importers of metallic tungsten to Russia in 2016, % Figure 50. Structure of import of tungsten to Russia by types of production in 2007-
2016, % Figure 51. Dynamics of export and import of metallic tungsten and products from it
in Ukraine in 2001-2016, tons Figure 52. Structure of the Ukrainian import of tungsten by types of production in
2007-2016, % Figure 53. Dynamics of export import of tungsten metal and products from it in
Belarus in 2007-2016, tons Figure 54. Dynamics of export and import of metallic tungsten and products from it
in Kyrgyzstan in 2007-2016, tons Figure 55. Dynamics of the average annual export-import prices on tungsten
concentrate in Russia in 2000-2016, $/kg Figure 56. Dynamics of the average annual export-import prices on ferro-tungsten in
Russia in 2000-2016, $/kg Figure 57. Dynamics of the average annual export-import prices of PTA in Russia in
1999-2016, $/kg Figure 58. Dynamics of the average annual export-import prices on tungsten
anhydride in Russia in 1999-2016, $/kg Figure 59. Dynamics of the average annual export-import prices on metallic tungsten
and products from it in Russia in 1999-2016, $/kg Figure 60. Structure of internal consumption of commodity tungsten in Russia in
2016, % Figure 61. Dynamics of the Russian export and import of tungsten carbide in 1999-
2016, tons Figure 62. Dynamics of production of alloys and mixes in AO Kirovgrad hard alloys
plant in 1996-2016, tons Figure 63. Dynamics of internal supply of hard alloys of production of AO
Kirovgrad hard alloys plant in 2002-2010, tons Figure 64. Dynamics of production of tungsten-containing and high-speed steels in
1999-2016, thousand tons Figure 65. Production of electric light bulbs in Russia in 1996-2016, mln pieces Figure 66. Dynamics of import supply of tungsten powders to ZAO Leko-Center in
2001-2016, kg Figure 67. Dynamics of import purchases of tungsten bars by OOO Abikor Bintsel
Welding Equipment in 2003-2016, kg Figure 68. Dynamics of import deliveries of tungsten crucibles of AO Monokristall in
2004-2016, kg Figure 69. Forecast of production of the tungsten concentrate (in terms of WO3) in
Russia till 2025, thousand tons
Tungsten Production, Market and Forecast in the CIS
INFOMINE Research Group www.infomine.ru; e-mail: [email protected]; Phone: +7 (495) 988-1123 14
Figure 70. Forecast of consumption of tungsten concentrate in Russia (in terms of WO3) till 2025, thousand tons
Figure 71. Forecast of consumption of tungsten anhydride in Russia till 2025, thousand tons
Figure 72. Forecast of production of tungsten anhydride in Russia till 2025, thousand tons
Tungsten Production, Market and Forecast in the CIS
INFOMINE Research Group www.infomine.ru; e-mail: [email protected]; Phone: +7 (495) 988-1123 15
Annotation The present report is the 12th edition of research of the market of tungsten in
Russia and the CIS. The monitoring of the market is conducted since 1999. Research objective is the analysis of the market of tungsten concentrates,
tungsten anhydride and ammonium paratungstate, ferro-tungsten and metallic tungsten of the CIS countries, and also of chains of their processing in the nonferrous metallurgy, ferrous metallurgy, and the lighting industry. The situation on the world market of tungsten and its raw materials is briefly considered.
Objects of a research are tungsten ores, tungsten concentrates (scheelite and wolframite), ammonium paratungstate, tungsten anhydride, ferro-tungsten and metal tungsten.
This work is a desk research. As sources of information we used the data of Rosstat, the Federal Customs Service of the Russian Federation, statistics of rail transportation of the Russian Federation, the Agency of statistics of the Republic of Kazakhstan, the State Customs Service of Ukraine; as well as materials of the US Geological service (USGS), of the database UNdata, of the branch and regional press, of annual and quarterly reports of issuers of securities, and also websites of producers of tungsten raw materials, ferro-tungsten and metal tungsten.
Chronological framework of a research: 1999-2016; the forecast – 2017-2025.
Research geography: the Russian Federation – the detailed complex analysis of the market; the Republic of Kazakhstan, Ukraine, Belarus, Uzbekistan, Kyrgyzstan, Tajikistan – the general retrospective analysis of the market; the rest of the world – general information about dynamics and characteristics of the market.
The report consists of 9 chapters, contains 272 pages, including 72 Figures, 112 Tables and 1 Appendix.
Chapter 1 of the report gives the short characteristic of the world market of tungsten raw materials and metallic tungsten (stocks, extraction, production, export and import of a concentrate and metallic tungsten by the countries, the prices).
Chapter 2 of the report discusses data on tungsten mineral resources in the CIS countries (in more detail in Russia), the structure of stocks and the characteristic of the main deposits.
Chapter 3 considers dynamics of production of the W concentrates in Russia in 1996-2016, as well as in Uzbekistan and Kazakhstan. The current state of the Russian and foreign GOKs (mining and processing combines), making tungsten concentrates is described. Besides, this chapter contains data on exports and imports of the W concentrates in the Russian Federation, Uzbekistan, Kazakhstan, and Kyrgyzstan. The balance of production and consumption of concentrates in the Russian Federation in 1999-2016 is separately considered.
Chapter 4 is devoted to the market of ammonium paratungstate (PTA) and tungsten anhydride. Data on production of these raw materials are provided for Russia and Uzbekistan. The Russian foreign trade operations with tungstates in 1999-

Tungsten Production, Market and Forecast in the CIS
INFOMINE Research Group www.infomine.ru; e-mail: [email protected]; Phone: +7 (495) 988-1123 16
2016, and also the balance of production and consumption during this period are considered in detail.
Chapter 5 of the report describes the current state of the industries consuming tungsten raw materials:
– production of ferro-tungsten (main Russian producers, a detailed analysis of the Russian export/import of FeW);
– production, exports and imports of metallic tungsten in the CIS (a description of the main Russian and Ukrainian producers, the analysis of the Russian and Ukrainian foreign trade operations with various tungsten products).
Chapter 6 is devoted to the Russian export-import prices of a tungsten concentrate, anhydride, ferro-tungsten, metallic tungsten in 1999-2016.
Chapter 7 provides short characteristics of the industries consuming ferro-tungsten and metallic tungsten.
Chapter 8 considers projects and investments into the tungsten industries of Russia and the CIS countries.
Chapter 9 gives the forecast of production and consumption of tungsten raw materials (a concentrate and anhydride) in Russia till 2025.
Contact information of the main enterprises, which are releasing and consuming tungsten raw materials, is given in the Appendix.
Target audience of a research: - participants of the market of a tungsten concentrate and chains of its further
consumption – producers, consumers, traders; - potential investors. The offered research may serve as a handbook for the services of marketing
and experts making administrative decisions at the market of tungsten raw materials.

Tungsten Production, Market and Forecast in the CIS
INFOMINE Research Group www.infomine.ru; e-mail: [email protected]; Phone: +7 (495) 988-1123 17
Introduction
Tungsten is a metal of silver-white color with a very high temperature of melting and high hardness. The tungsten density is 19.3 g/cm3, Tm = 3410±20°C, Tb = 5900°C.
This metal found its industrial application at the end of the 19th century, when its effect on improvement of properties of steel was discovered. Intensive development of the tungsten industry is connected with the invention of the high-speed steel containing tungsten, and tungsten thus became one of the major alloying metals.
Tungsten finds applications in a number of industries thanks to the unique physical properties, among which are the high hardness, and a very high density and refractory qualities. The metal is also characterized by a high corrosion resistance. In the form of pure metal, tungsten is used generally in the electronic industry, but its numerous compounds and alloys find applications in various spheres of consumption.
By the hardness tungsten is second only to diamond. Thanks to ability to keep hardness at high temperatures and a high melting point, it can be used in at high-temperatures, in particular in the electrotechnical industry, in production of incadescent lamps and electron beam tubes, and also in applications connected with heating and welding (in the gas and tungsten and arc welding or in the so-called TIG welding). Among all metals, tungsten has the highest melting point and the smallest coefficient of a linear expansion at the largest tensile strength (above 1650°C) that defines its applications in the aerospace industry for production of turbo-compressor jet engines.
In metallurgy tungsten is widely used not only for production of aviation special alloys, but also for smelting of high-speed steels, some grades of which contain up to 18% of tungsten.
Thanks to its high density tungsten, is a basis of heavy alloys, which are used for counterbalances, armor-piercing cores of subcaliber and arrow-shaped fin-stabilized shells of artillery pieces, cores of armor-piercing bullets and superfast rotors of gyroscopes for stabilization of flight of ballistic missiles.
Chemical compounds of tungsten are used in production of catalysts, inorganic pigments and high temperature (to 500°C) lubricants (on the basis of a tungsten disulfide). The tungsten carbide, which is one of the hardest carbides and has a high melting point (2770°C for WC and 2780°C for W2C), thanks to the hardness has the wide range of industrial applications: the heavy mechanical engineering, production of special alloys, wearproof abrasives and the high-speed tools, which production applies the combination of tungsten carbide with cobalt or a coating with a nitride or carbide of titanium.
Oxides of tungsten are applied at production of glaze to ceramics, and tungstates of calcium/magnesium are widely used in luminescent lighting fixtures. Crystal tungstates serve as scintillation detectors in nuclear physics and medicine. Other tungsten-containing salts find application in the chemical industry and tannic processes. "Tungsten bronze" (called so thanks to color of oxides of tungsten) is used at the paint production.
Tungsten Production, Market and Forecast in the CIS
INFOMINE Research Group www.infomine.ru; e-mail: [email protected]; Phone: +7 (495) 988-1123 18
1. Brief characteristic of the world market of tungsten raw materials
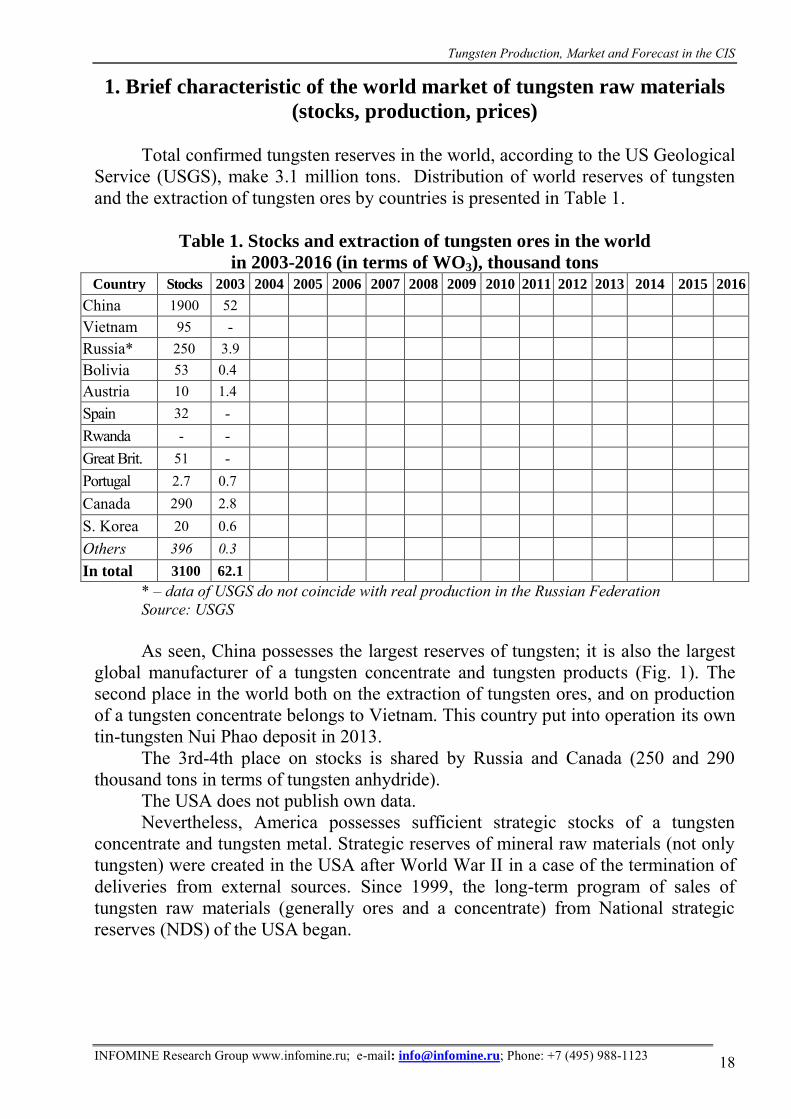
(stocks, production, prices) Total confirmed tungsten reserves in the world, according to the US Geological
Service (USGS), make 3.1 million tons. Distribution of world reserves of tungsten and the extraction of tungsten ores by countries is presented in Table 1.
Table 1. Stocks and extraction of tungsten ores in the world
in 2003-2016 (in terms of WO3), thousand tons Country Stocks 2003 2004 2005 2006 2007 2008 2009 2010 2011 2012 2013 2014 2015 2016
China 1900 52 Vietnam 95 - Russia* 250 3.9 Bolivia 53 0.4 Austria 10 1.4 Spain 32 - Rwanda - - Great Brit. 51 - Portugal 2.7 0.7 Canada 290 2.8 S. Korea 20 0.6 Others 396 0.3 In total 3100 62.1
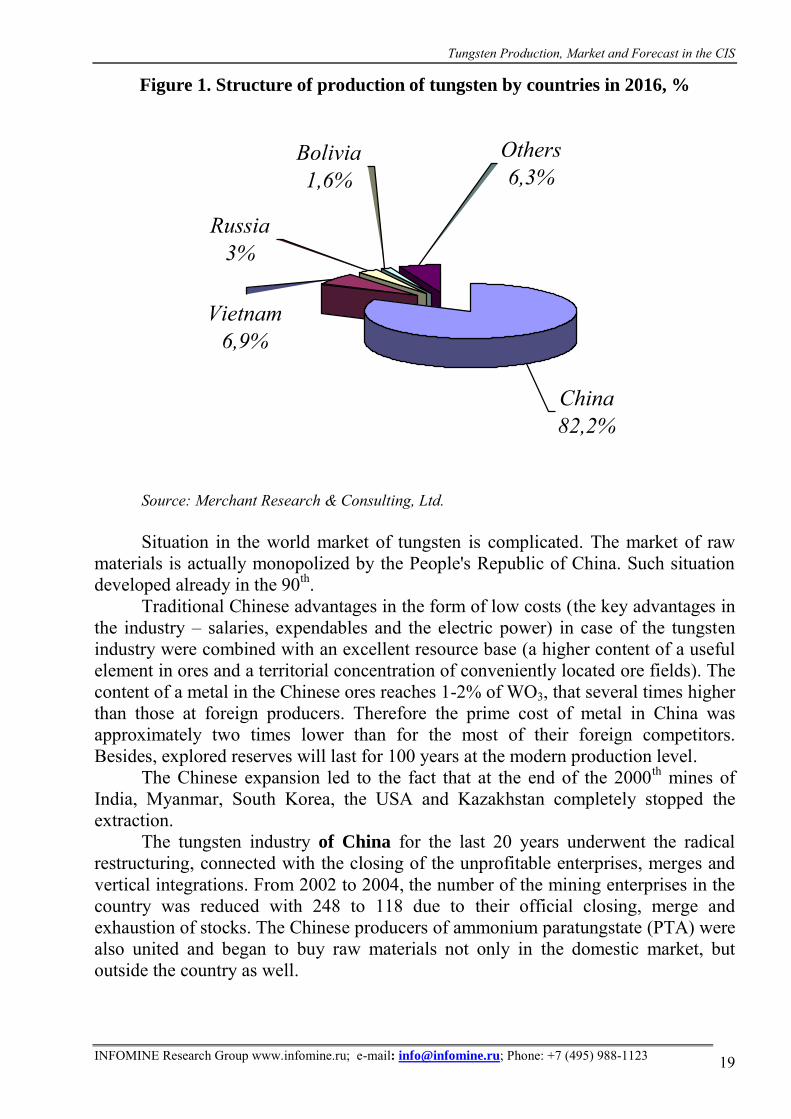
* – data of USGS do not coincide with real production in the Russian Federation Source: USGS As seen, China possesses the largest reserves of tungsten; it is also the largest
global manufacturer of a tungsten concentrate and tungsten products (Fig. 1). The second place in the world both on the extraction of tungsten ores, and on production of a tungsten concentrate belongs to Vietnam. This country put into operation its own tin-tungsten Nui Phao deposit in 2013.
The 3rd-4th place on stocks is shared by Russia and Canada (250 and 290 thousand tons in terms of tungsten anhydride).
The USA does not publish own data. Nevertheless, America possesses sufficient strategic stocks of a tungsten
concentrate and tungsten metal. Strategic reserves of mineral raw materials (not only tungsten) were created in the USA after World War II in a case of the termination of deliveries from external sources. Since 1999, the long-term program of sales of tungsten raw materials (generally ores and a concentrate) from National strategic reserves (NDS) of the USA began.
Tungsten Production, Market and Forecast in the CIS
INFOMINE Research Group www.infomine.ru; e-mail: [email protected]; Phone: +7 (495) 988-1123 19
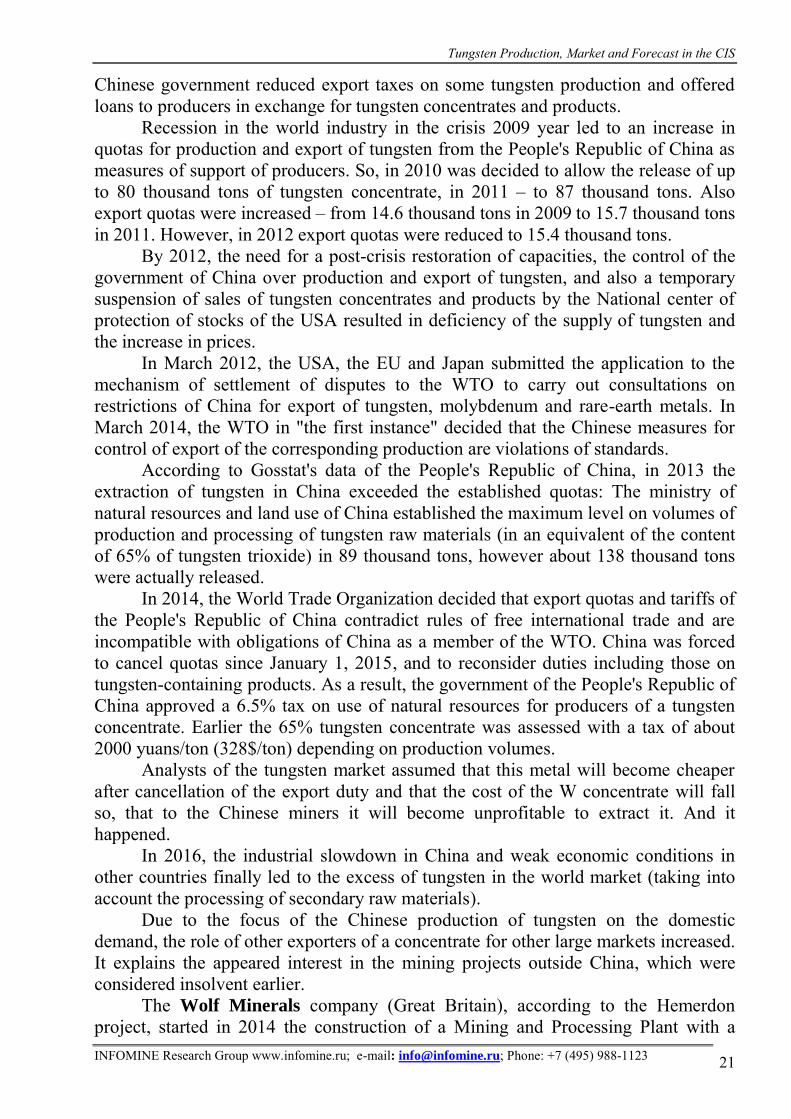
Figure 1. Structure of production of tungsten by countries in 2016, %
Bolivia1,6%
Russia3%
Others6,3%
Vietnam6,9%
China82,2%
Source: Merchant Research & Consulting, Ltd. Situation in the world market of tungsten is complicated. The market of raw
materials is actually monopolized by the People's Republic of China. Such situation developed already in the 90th.
Traditional Chinese advantages in the form of low costs (the key advantages in the industry – salaries, expendables and the electric power) in case of the tungsten industry were combined with an excellent resource base (a higher content of a useful element in ores and a territorial concentration of conveniently located ore fields). The content of a metal in the Chinese ores reaches 1-2% of WO3, that several times higher than those at foreign producers. Therefore the prime cost of metal in China was approximately two times lower than for the most of their foreign competitors. Besides, explored reserves will last for 100 years at the modern production level.
The Chinese expansion led to the fact that at the end of the 2000th mines of India, Myanmar, South Korea, the USA and Kazakhstan completely stopped the extraction.
The tungsten industry of China for the last 20 years underwent the radical restructuring, connected with the closing of the unprofitable enterprises, merges and vertical integrations. From 2002 to 2004, the number of the mining enterprises in the country was reduced with 248 to 118 due to their official closing, merge and exhaustion of stocks. The Chinese producers of ammonium paratungstate (PTA) were also united and began to buy raw materials not only in the domestic market, but outside the country as well.
Tungsten Production, Market and Forecast in the CIS
INFOMINE Research Group www.infomine.ru; e-mail: [email protected]; Phone: +7 (495) 988-1123 20
The growing economy of the People's Republic of China led to the significant growth of consumption of tungsten-containing materials for production of the finished goods intended for use in the domestic market.
Since 2005, the Chinese suppliers ceased to be exempted from taxes on import of raw materials and value added taxes, which resulted in the growth of the export prices of the processed material.
In 2006, according to the government strategy, the development of the industry of non-ferrous metals of China kept its rapid growth, and the internal consumption of tungsten production sharply increased. All this negatively affected volumes of supply of tungsten to the world market. A shortage of resources became also a main problem in 2006.
According to the Ministry of land and natural resources of China, in 2007 the government of the People's Republic of China took measures for regulation of production and export of tungsten for control over its total production, the improvement of the structure of the industry and environmental protection. The country leaders count on a gradual shift of balance of export quotas towards finished goods with the added value both at the domestic enterprises, and at joint ventures with participation of the foreign companies.
So, in 2007 the release of tungsten concentrate (with the 65% content of WO3) amounted to 59,270 tons that is by 210 tons more than in 2006.
For control, regular inspections of the enterprises making a concentrate of tungsten and rare-earth metals are carried out.
According to the new rules, which came into force in 2007, all newly created enterprises are obliged to have the annual capacity of not less than 5 thousand tons of ammonium paratungstate, 2 thousand tons of powder of tungsten or 2 thousand tons of tungsten carbide. The annual release by the separate enterprises should not be less than 100 tons of metal or 200 tons of alloys. The acting producers were also obliged to bring production into accord with new requirements.
Besides, in 2007, the government of the People's Republic of China established export duties in 5% for ammonium paratungstate, tungsten rolled products and tungsten oxide. However, this had no significant effect on the price level in the European market.
All this together with the world financial and economic crisis led to a sharp reduction of volumes of extraction of tungsten ores in China (by ~ 48-50%) in 2008-2009 and, as a result, to reduction of the worldwide extraction of tungsten ores by 40%.
In 2007-2008, the numerous companies worked on development of new and the re-start of the mothballed tungsten deposits in Asia, Australia, Europe and North America. As a result, new productions of tungsten concentrates were organized in Australia, Peru, Spain, the USA and Uzbekistan. However, the serious recession in the world financial markets in the second half of 2008 postponed the start of some planned additional productions.
In particular, at the end of 2008, in connection with the world financial and economic crisis, the development of the Chinese tungsten fields in the Provinces of Hunan and Jiangxi was suspended. In 2009, to help domestic manufacturers, the
Tungsten Production, Market and Forecast in the CIS
INFOMINE Research Group www.infomine.ru; e-mail: [email protected]; Phone: +7 (495) 988-1123 21
Chinese government reduced export taxes on some tungsten production and offered loans to producers in exchange for tungsten concentrates and products.
Recession in the world industry in the crisis 2009 year led to an increase in quotas for production and export of tungsten from the People's Republic of China as measures of support of producers. So, in 2010 was decided to allow the release of up to 80 thousand tons of tungsten concentrate, in 2011 – to 87 thousand tons. Also export quotas were increased – from 14.6 thousand tons in 2009 to 15.7 thousand tons in 2011. However, in 2012 export quotas were reduced to 15.4 thousand tons.
By 2012, the need for a post-crisis restoration of capacities, the control of the government of China over production and export of tungsten, and also a temporary suspension of sales of tungsten concentrates and products by the National center of protection of stocks of the USA resulted in deficiency of the supply of tungsten and the increase in prices.
In March 2012, the USA, the EU and Japan submitted the application to the mechanism of settlement of disputes to the WTO to carry out consultations on restrictions of China for export of tungsten, molybdenum and rare-earth metals. In March 2014, the WTO in "the first instance" decided that the Chinese measures for control of export of the corresponding production are violations of standards.
According to Gosstat's data of the People's Republic of China, in 2013 the extraction of tungsten in China exceeded the established quotas: The ministry of natural resources and land use of China established the maximum level on volumes of production and processing of tungsten raw materials (in an equivalent of the content of 65% of tungsten trioxide) in 89 thousand tons, however about 138 thousand tons were actually released.
In 2014, the World Trade Organization decided that export quotas and tariffs of the People's Republic of China contradict rules of free international trade and are incompatible with obligations of China as a member of the WTO. China was forced to cancel quotas since January 1, 2015, and to reconsider duties including those on tungsten-containing products. As a result, the government of the People's Republic of China approved a 6.5% tax on use of natural resources for producers of a tungsten concentrate. Earlier the 65% tungsten concentrate was assessed with a tax of about 2000 yuans/ton (328$/ton) depending on production volumes.
Analysts of the tungsten market assumed that this metal will become cheaper after cancellation of the export duty and that the cost of the W concentrate will fall so, that to the Chinese miners it will become unprofitable to extract it. And it happened.
In 2016, the industrial slowdown in China and weak economic conditions in other countries finally led to the excess of tungsten in the world market (taking into account the processing of secondary raw materials).
Due to the focus of the Chinese production of tungsten on the domestic demand, the role of other exporters of a concentrate for other large markets increased. It explains the appeared interest in the mining projects outside China, which were considered insolvent earlier.
The Wolf Minerals company (Great Britain), according to the Hemerdon project, started in 2014 the construction of a Mining and Processing Plant with a
Tungsten Production, Market and Forecast in the CIS
INFOMINE Research Group www.infomine.ru; e-mail: [email protected]; Phone: +7 (495) 988-1123 22
capacity of 5 thousand tons of the tungsten concentrate and 1 thousand tons of the tin concentrate. In July 2015, the enterprise was put into operation. In 2016, the company produced 700 tons of tungsten concentrate (in terms of anhydride). Website: wolfminerals.com.au.
In Vietnam, the Woulfe Mining company in 2013 (as was already noted) began production on the Sangdon field. The Sangdong plant was a large producer of tungsten for nearly 40 years, before cessation of production in 1992 due to the low prices of the metal. Woulfe Mining acquired the license for mining in 2006. Field reserves are estimated at 45.8 million tons with the WO3 content of 0.35%. The mine it is planned to extract 1.2 million tons of ore a year. The capacity of the processing plant will make 5 thousand tons of tungsten trioxide and 230 tons of a molybdenum concentrate a year. In 2016, Vietnam produced 6 thousand tons of a concentrate in terms of trioxide.
Spain and Rwanda began to operate tungsten mines. Bolivia increases the production of W concentrates.
According to data of UNdata, the world trade in tungsten concentrates in 2013 amounted to $326 million, that is by 1.5% lower than in the previous year. The main suppliers of tungsten concentrates to the world market were Canada, Russia, Bolivia and Portugal, which total share in 2012-2013 was more than 70% of the world trade with concentrates (Table 2).
In 2015, the situation changed. The world export made $445 million (taking into account the deliveries of tungsten ore). The four largest exporters of concentrate were Canada, Russia, Bolivia, and Spain. In 2016, Canada mothballed the mine and ceased the export of a concentrate.
In 2016, Russia became the largest exporter of a tungsten concentrate (5.5 thousand tons). Such a large delivery is connected with the fact that the concentrate, stored in a reserve, was sold. More detailed information on the foreign trade operations of the Russian Federation is considered in Section 3.2.3.
Let's notice that the WO3 content in concentrates of the different countries differs (range – 55-66%). Export of middling products with a lower content of tungsten trioxide is possible.

Tungsten Production, Market and Forecast in the CIS
INFOMINE Research Group www.infomine.ru; e-mail: [email protected]; Phone: +7 (495) 988-1123 23
Table 2. The largest exporters of a tungsten concentrate
in 2007-2016, tons Country 2007 2008 2009 2010 2011 2012 2013 2014 2015 2016
Russia 4726 Great Britain 36 Spain - Portugal 1466 Rwanda 2601 Malaysia - USA 221 Brazil 624 Australia 11 Germany - China 20 Peru 761 Canada 3477 India 133 Bolivia 1987 Vietnam 54 Uganda - Mexico - Italy - Russia - S. Korea 3
n/d – no data Source: UNdata Among the importers of tungsten concentrates stand out China, the United
States, and in recent years, South Korea (Table 3). We note, that Russia in 2014-2015 also increased import volumes. Purchases
by our country of an import concentrate in the presence of the own production are connected with several reasons, in particular with the difficult logistics on delivery of a concentrate from the Far East and Transbaikalia (all tungsten mining and processing plants (GOKs) are located in the east of the country) to the Central and Ural region, the where hydrometallurgical processing of raw materials is carried out.
Besides, after the introduction of the 10% export duty on export of a tungsten concentrate, which was initiated by OAO Gidrometallurg and ZAO Company Wolfram, there was a conflict between producers and consumers of these raw materials.
Tungsten Production, Market and Forecast in the CIS
INFOMINE Research Group www.infomine.ru; e-mail: [email protected]; Phone: +7 (495) 988-1123 24
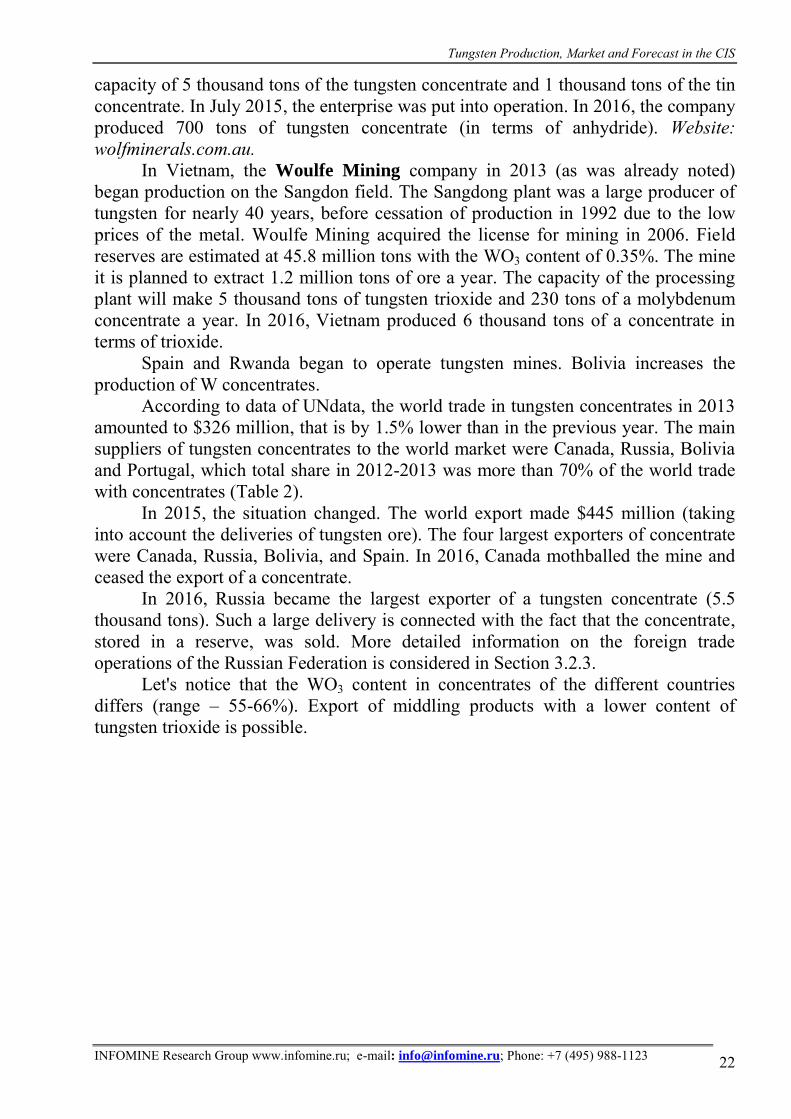
Table 3. The largest importers of tungsten concentrate
in 2007-2016, tons Country 2007 2008 2009 2010 2011 2012 2013 2014 2015 2016
USA 3884 China 9610 Russian Federation 3037
S. Korea 0.1 Malaysia - Japan - Australia - Great Britain 2 Spain 0.6 Austria 4149 Vietnam 10 Germany 604
n/d – no data Source: UNdata
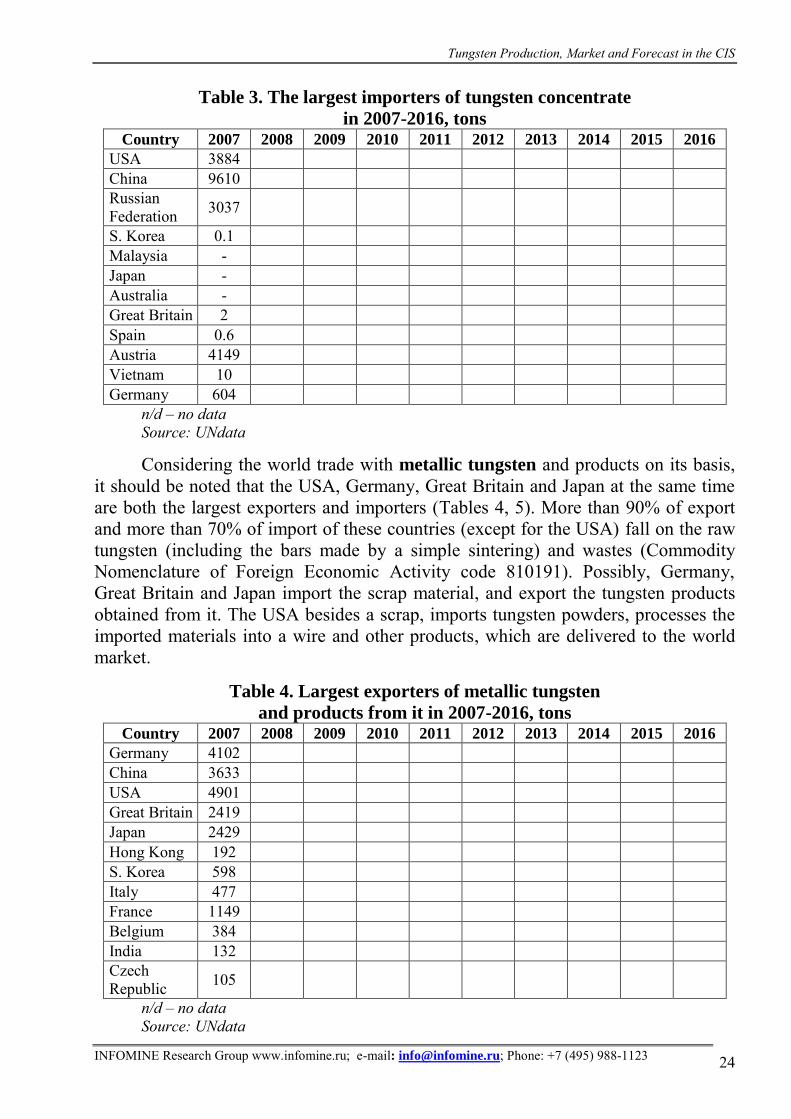
Considering the world trade with metallic tungsten and products on its basis, it should be noted that the USA, Germany, Great Britain and Japan at the same time are both the largest exporters and importers (Tables 4, 5). More than 90% of export and more than 70% of import of these countries (except for the USA) fall on the raw tungsten (including the bars made by a simple sintering) and wastes (Commodity Nomenclature of Foreign Economic Activity code 810191). Possibly, Germany, Great Britain and Japan import the scrap material, and export the tungsten products obtained from it. The USA besides a scrap, imports tungsten powders, processes the imported materials into a wire and other products, which are delivered to the world market.
Table 4. Largest exporters of metallic tungsten
and products from it in 2007-2016, tons Country 2007 2008 2009 2010 2011 2012 2013 2014 2015 2016
Germany 4102 China 3633 USA 4901 Great Britain 2419 Japan 2429 Hong Kong 192 S. Korea 598 Italy 477 France 1149 Belgium 384 India 132 Czech Republic 105
n/d – no data Source: UNdata
Tungsten Production, Market and Forecast in the CIS
INFOMINE Research Group www.infomine.ru; e-mail: [email protected]; Phone: +7 (495) 988-1123 25
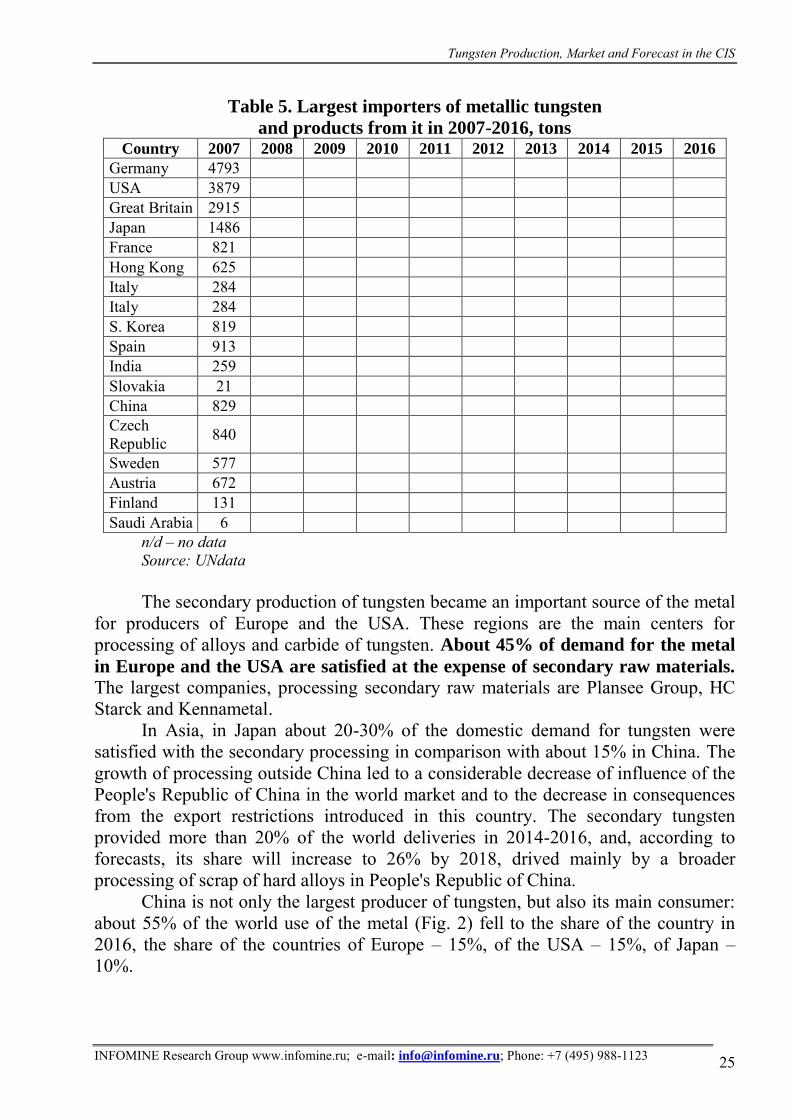
Table 5. Largest importers of metallic tungsten
and products from it in 2007-2016, tons Country 2007 2008 2009 2010 2011 2012 2013 2014 2015 2016
Germany 4793 USA 3879 Great Britain 2915 Japan 1486 France 821 Hong Kong 625 Italy 284 Italy 284 S. Korea 819 Spain 913 India 259 Slovakia 21 China 829 Czech Republic 840
Sweden 577 Austria 672 Finland 131 Saudi Arabia 6
n/d – no data Source: UNdata The secondary production of tungsten became an important source of the metal
for producers of Europe and the USA. These regions are the main centers for processing of alloys and carbide of tungsten. About 45% of demand for the metal
in Europe and the USA are satisfied at the expense of secondary raw materials. The largest companies, processing secondary raw materials are Plansee Group, HC Starck and Kennametal.
In Asia, in Japan about 20-30% of the domestic demand for tungsten were satisfied with the secondary processing in comparison with about 15% in China. The growth of processing outside China led to a considerable decrease of influence of the People's Republic of China in the world market and to the decrease in consequences from the export restrictions introduced in this country. The secondary tungsten provided more than 20% of the world deliveries in 2014-2016, and, according to forecasts, its share will increase to 26% by 2018, drived mainly by a broader processing of scrap of hard alloys in People's Republic of China.
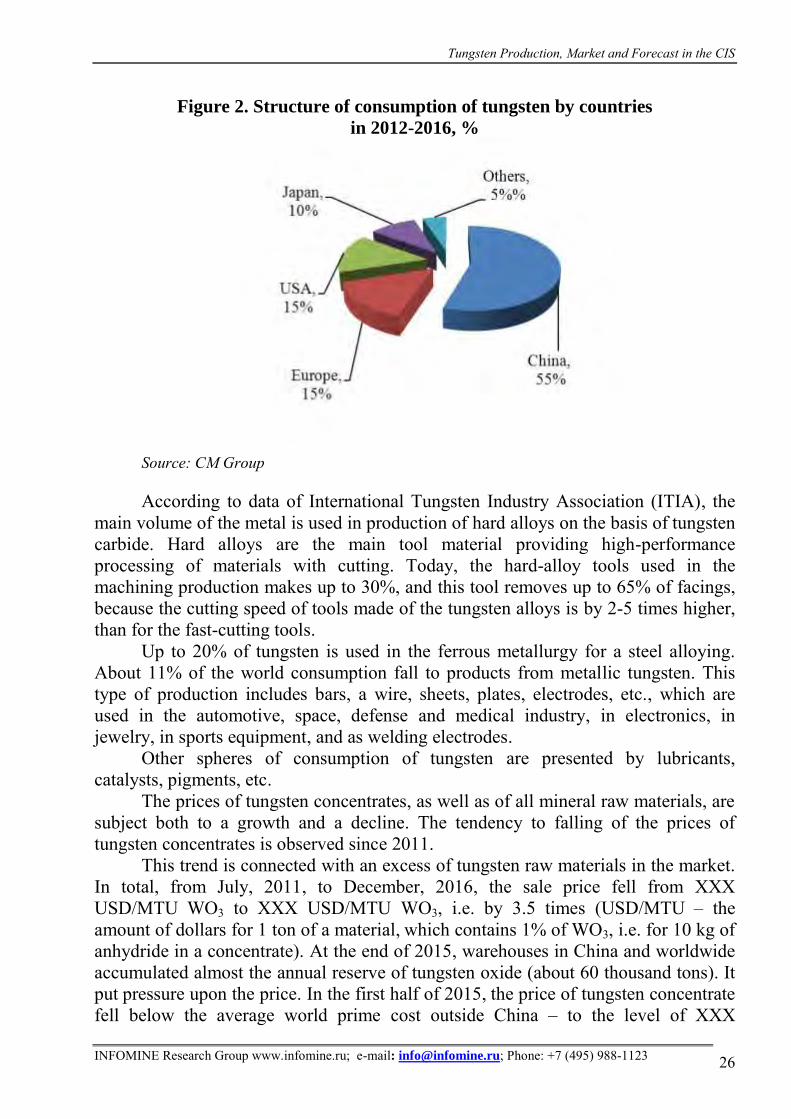
China is not only the largest producer of tungsten, but also its main consumer: about 55% of the world use of the metal (Fig. 2) fell to the share of the country in 2016, the share of the countries of Europe – 15%, of the USA – 15%, of Japan – 10%.
Tungsten Production, Market and Forecast in the CIS
INFOMINE Research Group www.infomine.ru; e-mail: [email protected]; Phone: +7 (495) 988-1123 26
Figure 2. Structure of consumption of tungsten by countries
in 2012-2016, %
Source: CM Group
According to data of International Tungsten Industry Association (ITIA), the
main volume of the metal is used in production of hard alloys on the basis of tungsten carbide. Hard alloys are the main tool material providing high-performance processing of materials with cutting. Today, the hard-alloy tools used in the machining production makes up to 30%, and this tool removes up to 65% of facings, because the cutting speed of tools made of the tungsten alloys is by 2-5 times higher, than for the fast-cutting tools.
Up to 20% of tungsten is used in the ferrous metallurgy for a steel alloying. About 11% of the world consumption fall to products from metallic tungsten. This type of production includes bars, a wire, sheets, plates, electrodes, etc., which are used in the automotive, space, defense and medical industry, in electronics, in jewelry, in sports equipment, and as welding electrodes.
Other spheres of consumption of tungsten are presented by lubricants, catalysts, pigments, etc.
The prices of tungsten concentrates, as well as of all mineral raw materials, are subject both to a growth and a decline. The tendency to falling of the prices of tungsten concentrates is observed since 2011.
This trend is connected with an excess of tungsten raw materials in the market. In total, from July, 2011, to December, 2016, the sale price fell from XXX USD/MTU WO3 to XXX USD/MTU WO3, i.e. by 3.5 times (USD/MTU – the amount of dollars for 1 ton of a material, which contains 1% of WO3, i.e. for 10 kg of anhydride in a concentrate). At the end of 2015, warehouses in China and worldwide accumulated almost the annual reserve of tungsten oxide (about 60 thousand tons). It put pressure upon the price. In the first half of 2015, the price of tungsten concentrate fell below the average world prime cost outside China – to the level of XXX
Tungsten Production, Market and Forecast in the CIS
INFOMINE Research Group www.infomine.ru; e-mail: [email protected]; Phone: +7 (495) 988-1123 27
USD/MTU WO3, and in the second half of the year, stepped over a threshold of the prime cost of most the Chinese mining enterprises – XXX USD/MTU WO3. As a result, in 2015 many mines worldwide stopped the activity or reduced the outputs because of shortage of current assets.
In 2016, a further falling of the prices of tungsten was observed. The average sale price of a concentrate fell in a year by 18% to XXX USD/MTU WO3. The minimum level of the price in 2016 was XXX USD/MTU WO3 (at the beginning of the year).
The main reason for continuation of falling of the price in 2016 is an excess of tungsten raw materials of the second processing (tungsten oxide, ammonium paratungstate and ferro-tungsten) in the world market. The excess reserve of tungsten, which was formed in 2015, was not lowered considerably, but, according to experts, it also did not grow up. As a result, the situation with the prices was stabilized, and at the end of 2016, the selling cost approached the mark of XXX USD/MTU WO3. This level is a limiting threshold of profitability of most of the Chinese producers of tungsten concentrates, so, it is a basis for formation of the world prices for tungsten. According to participants of the market, in the next several years the price, most likely, will balance around this mark, until excess reserves of tungsten raw materials are reduced to a minimum.
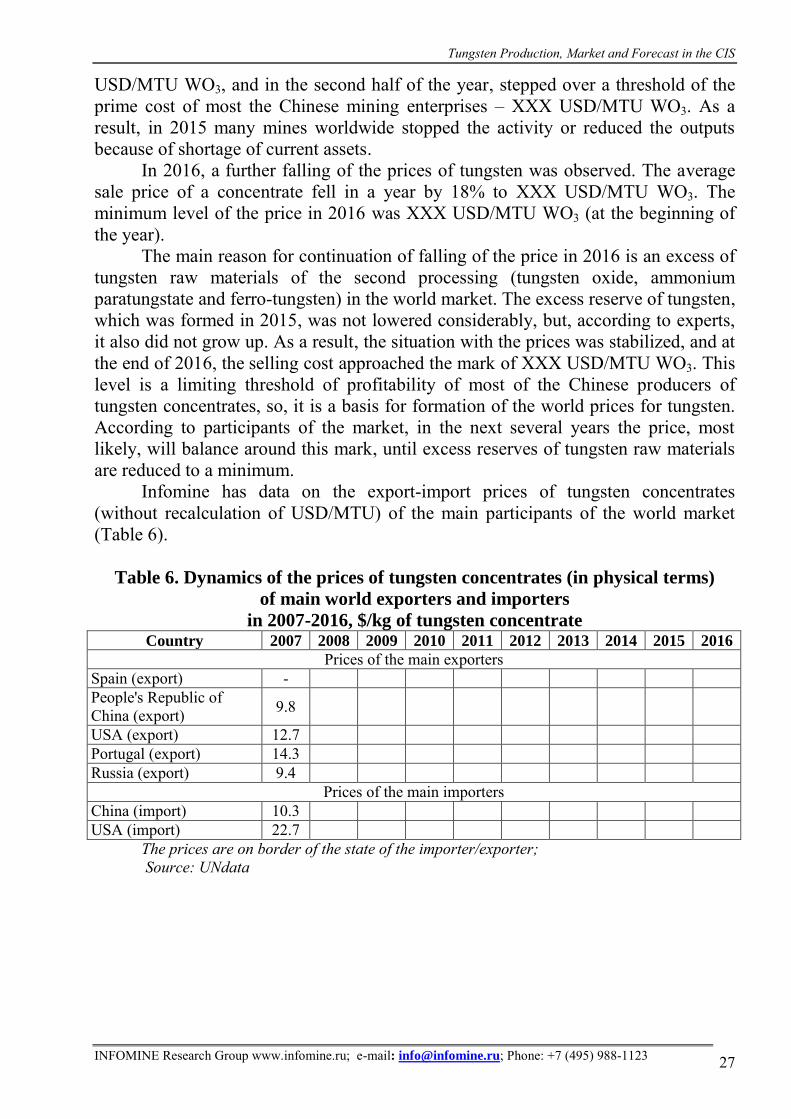
Infomine has data on the export-import prices of tungsten concentrates (without recalculation of USD/MTU) of the main participants of the world market (Table 6).
Table 6. Dynamics of the prices of tungsten concentrates (in physical terms)
of main world exporters and importers
in 2007-2016, $/kg of tungsten concentrate Country 2007 2008 2009 2010 2011 2012 2013 2014 2015 2016
Prices of the main exporters Spain (export) - People's Republic of China (export) 9.8
USA (export) 12.7 Portugal (export) 14.3 Russia (export) 9.4
Prices of the main importers China (import) 10.3 USA (import) 22.7
The prices are on border of the state of the importer/exporter; Source: UNdata


