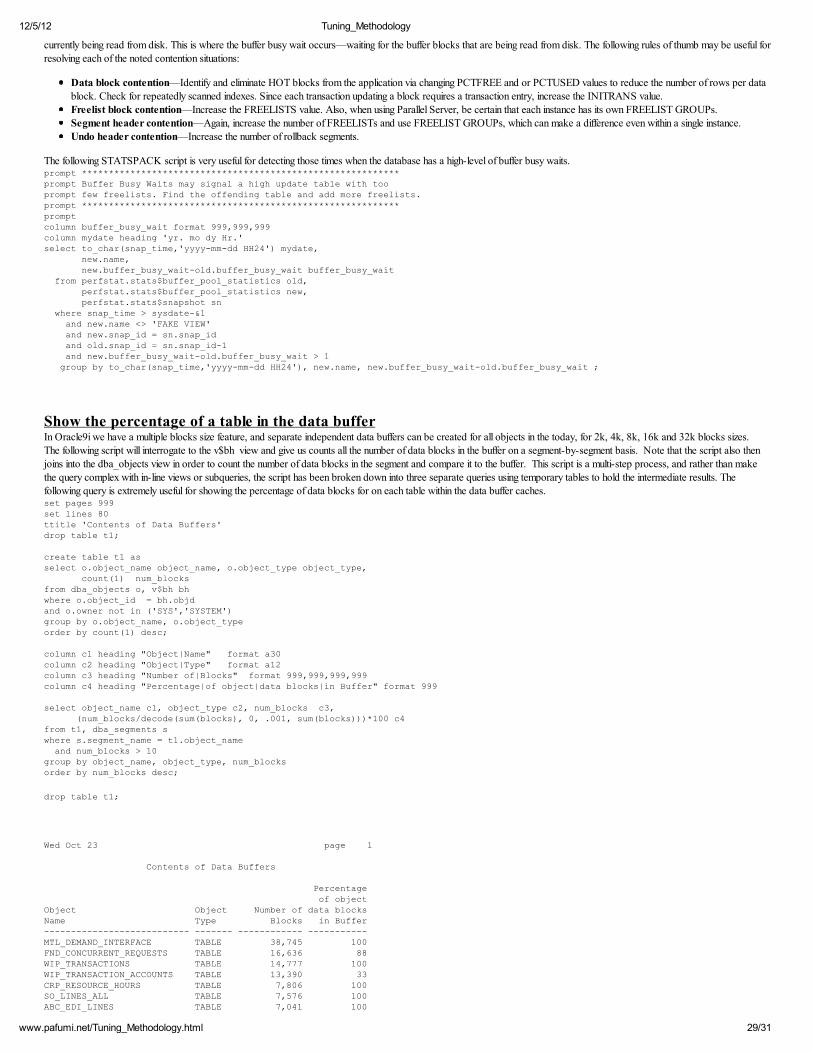
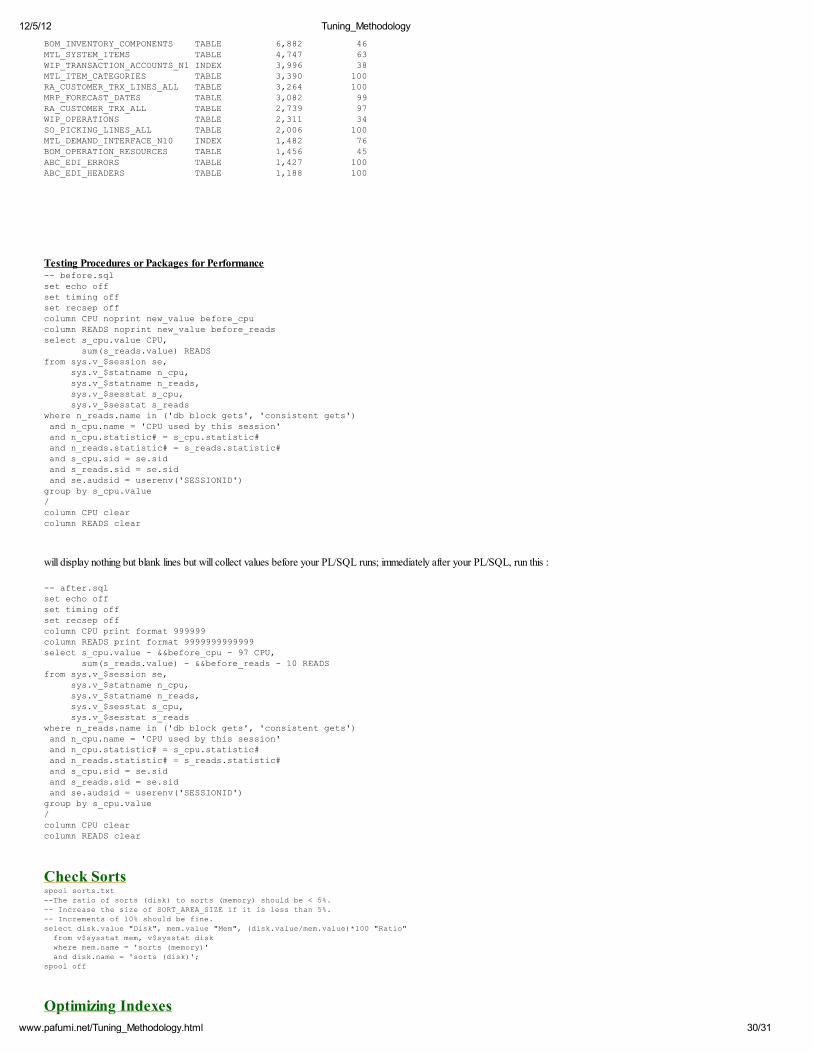
12/5/12 Tuning_Methodology 1/31 www.pafumi.net/Tuning_Methodology.html Tuning Methodology Quick thinks to check for Check Disk I/O Improper PGA Setup Modify init.ora Parameters SQL Code Tuning Collect Schema Statistics Redo Log Switches Large Full Table Scans Small Full Table Scans and Index Scans Many Indexes on Data Buffer Cache Check for skewed Indexes (unbalanced) Tuning Database Buffer Cache Fragmentation on DB Objects Size of LOG_BUFFER Size of SHARED_POOL_SIZE Allocate Files Properly (check waits on them) Checking Active Statements Use IPC for local Connections Check Undo Parameters Detect High SQL Parse Monitor Open and Cached Cursors Detect Top 10 Queries in SQL Area Allocate Objects into Multiple Block Buffers (another web page) Check for Indexes not Used and HOT Tables Detect and Resolve Buffer Busy Waits *********************** Show Porcentage of a Table in the data buffer Testing Procedures or Packages for Performance Using PGA Advice Utility Check Sorts Optimizing Indexes (creating 32k block size) Quick Things to Check for My goal is to quickly identify and correct performance problems. Here is a summary of the things that I look at first: 1 - Install STATSPACK first, and get hourly snaps working. 2 - Get an SQL access report (or plan9i.sql), an spreport during peak times, and statspack_alert.sql output. 3 - Look for "silver bullet fixes": partial schema statistics (using dbms_stats) missing indexes optimizer_index_cost_adj=15 #10-15 for OLTP systems, 50 for DW #This adjusts the optimizer to favor index access optimizer_index_caching=85 (depending on RAM for index caching, around 85) optimizer_mode=first_rows (for OLTP) parallel_automatic_tuning=TRUE (parallelizes full-table scans, Because parallel full-table scans are very fast, the CBO will give a higher cost to index access and be friendlier to full-table scans) hash_area_size too small (too many nested loop joins) 4 - Fully utilize server RAM - On a dedicated Oracle server, use all extra RAM for db_cache_size less PGA's and 20% RAM reserve for OS. 5 - Get the bottlenecks - See STATSPACK top 5 wait events - OEM performance pack reports - TOAD reports 6 - Look for Buffer Busy Waits resulting from table/index freelist shortages 7 - See if large-table full-table scans can be removed with well-placed indexes 8 - If tables are low volatility, seek an MV that can pre-join/pre-aggregate common queries. Turn-on automatic query rewrite 9 - Look for non-reentrant SQL - (literals values inside SQL from v$sql) - If so, set cursor_sharing=force Non-Use of Bind Variables A quick method of seeing whether code is being reused (a key indicator of proper bind variable usage) is to look at the values of reusable and non-reusable memory in the shared pool. A SQL for determining this comparison of reusable to non-reusable code is shown here: ttitle 'Shared Pool Utilization' spool sql_garbage select 1 nopr, to_char(a.inst_id) inst_id, a.users users, to_char(a.garbage,'9,999,999,999') garbage,
Large Full Table ScansSmall Full Table Scans and Index ScansMany Indexes on Data Buffer CacheCheck for skewed Indexes (unbalanced)Tuning Database Buffer CacheFragmentation on DB ObjectsSize of LOG_BUFFER
Size of SHARED_POOL_SIZEAllocate Files Properly (check waits on them)Checking Active StatementsUse IPC for local ConnectionsCheck Undo ParametersDetect High SQL ParseMonitor Open and Cached Cursors
Detect Top 10 Queries in SQL AreaAllocate Objects into Multiple Block Buffers (another web page)
Check for Indexes not Used and HOT TablesDetect and Resolve Buffer Busy Waits ***********************Show Porcentage of a Table in the data buffer
Testing Procedures or Packages for PerformanceUsing PGA Advice UtilityCheck Sorts
Optimizing Indexes (creating 32k block size)
Quick Things to Check forMy goal is to quickly identify and correct performance problems. Here is a summary of the things that I look at first:1 - Install STATSPACK first, and get hourly snaps working.
2 - Get an SQL access report (or plan9i.sql), an spreport during peak times, and statspack_alert.sql output. 3 - Look for "silver bullet fixes":
partial schema statistics (using dbms_stats)
missing indexesoptimizer_index_cost_adj=15 #10-15 for OLTP systems, 50 for DW #This adjusts the optimizer to favor index accessoptimizer_index_caching=85 (depending on RAM for index caching, around 85)
optimizer_mode=first_rows (for OLTP)parallel_automatic_tuning=TRUE (parallelizes full-table scans, Because parallel full-table scans are very fast, the CBO will give a higher cost to index access and be friendlierto full-table scans)hash_area_size too small (too many nested loop joins)
4 - Fully utilize server RAM - On a dedicated Oracle server, use all extra RAM for db_cache_size less PGA's and 20% RAM reserve for OS. 5 - Get the bottlenecks - See STATSPACK top 5 wait events - OEM performance pack reports - TOAD reports
6 - Look for Buffer Busy Waits resulting from table/index freelist shortages 7 - See if large-table full-table scans can be removed with well-placed indexes 8 - If tables are low volatility, seek an MV that can pre-join/pre-aggregate common queries. Turn-on automatic query rewrite 9 - Look for non-reentrant SQL - (literals values inside SQL from v$sql) - If so, set cursor_sharing=force
Non-Use of Bind VariablesA quick method of seeing whether code is being reused (a key indicator of proper bind variable usage) is to look at the values of reusable and non-reusable memory in the sharedpool. A SQL for determining this comparison of reusable to non-reusable code is shown here:ttitle 'Shared Pool Utilization'spool sql_garbageselect 1 nopr, to_char(a.inst_id) inst_id, a.users users, to_char(a.garbage,'9,999,999,999') garbage,
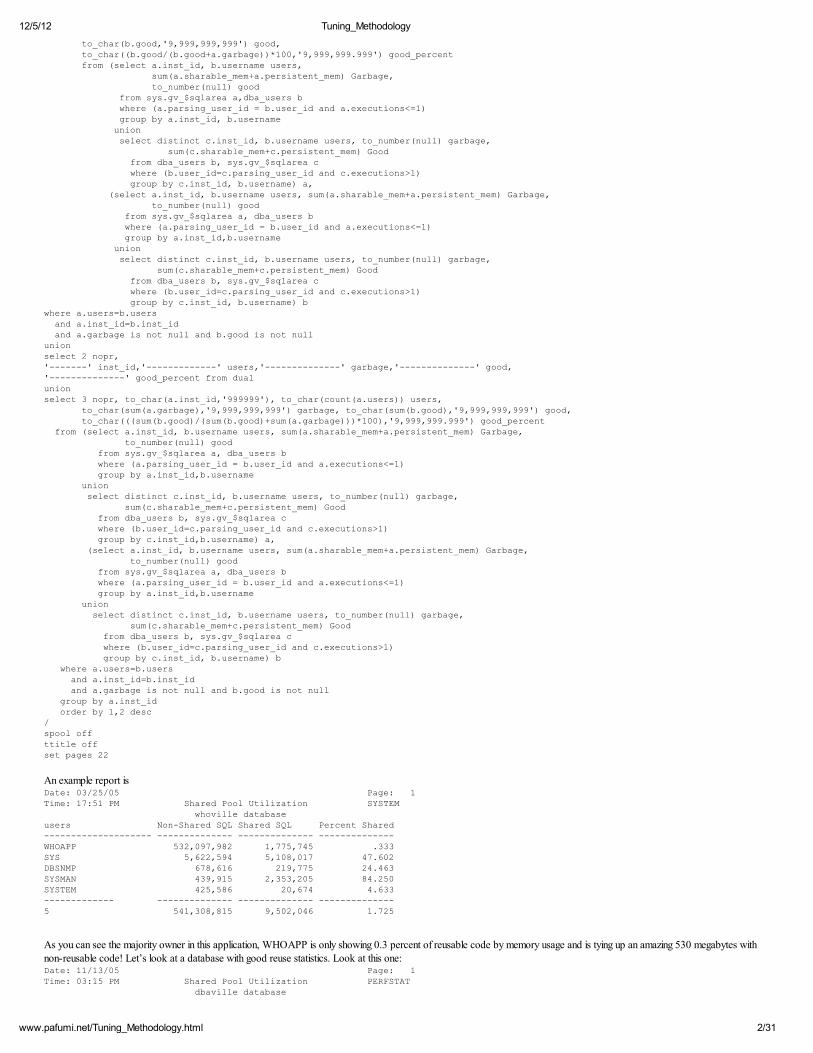
to_char(b.good,'9,999,999,999') good, to_char((b.good/(b.good+a.garbage))*100,'9,999,999.999') good_percent from (select a.inst_id, b.username users, sum(a.sharable_mem+a.persistent_mem) Garbage, to_number(null) good from sys.gv_$sqlarea a,dba_users b where (a.parsing_user_id = b.user_id and a.executions<=1) group by a.inst_id, b.username union select distinct c.inst_id, b.username users, to_number(null) garbage, sum(c.sharable_mem+c.persistent_mem) Good from dba_users b, sys.gv_$sqlarea c where (b.user_id=c.parsing_user_id and c.executions>1) group by c.inst_id, b.username) a, (select a.inst_id, b.username users, sum(a.sharable_mem+a.persistent_mem) Garbage, to_number(null) good from sys.gv_$sqlarea a, dba_users b where (a.parsing_user_id = b.user_id and a.executions<=1) group by a.inst_id,b.username union select distinct c.inst_id, b.username users, to_number(null) garbage, sum(c.sharable_mem+c.persistent_mem) Good from dba_users b, sys.gv_$sqlarea c where (b.user_id=c.parsing_user_id and c.executions>1) group by c.inst_id, b.username) bwhere a.users=b.users and a.inst_id=b.inst_id and a.garbage is not null and b.good is not nullunionselect 2 nopr,'-------' inst_id,'-------------' users,'--------------' garbage,'--------------' good,'--------------' good_percent from dualunionselect 3 nopr, to_char(a.inst_id,'999999'), to_char(count(a.users)) users, to_char(sum(a.garbage),'9,999,999,999') garbage, to_char(sum(b.good),'9,999,999,999') good, to_char(((sum(b.good)/(sum(b.good)+sum(a.garbage)))*100),'9,999,999.999') good_percent from (select a.inst_id, b.username users, sum(a.sharable_mem+a.persistent_mem) Garbage, to_number(null) good from sys.gv_$sqlarea a, dba_users b where (a.parsing_user_id = b.user_id and a.executions<=1) group by a.inst_id,b.username union select distinct c.inst_id, b.username users, to_number(null) garbage, sum(c.sharable_mem+c.persistent_mem) Good from dba_users b, sys.gv_$sqlarea c where (b.user_id=c.parsing_user_id and c.executions>1) group by c.inst_id,b.username) a, (select a.inst_id, b.username users, sum(a.sharable_mem+a.persistent_mem) Garbage, to_number(null) good from sys.gv_$sqlarea a, dba_users b where (a.parsing_user_id = b.user_id and a.executions<=1) group by a.inst_id,b.username union select distinct c.inst_id, b.username users, to_number(null) garbage, sum(c.sharable_mem+c.persistent_mem) Good from dba_users b, sys.gv_$sqlarea c where (b.user_id=c.parsing_user_id and c.executions>1) group by c.inst_id, b.username) b where a.users=b.users and a.inst_id=b.inst_id and a.garbage is not null and b.good is not null group by a.inst_id order by 1,2 desc/spool offttitle offset pages 22
As you can see the majority owner in this application, WHOAPP is only showing 0.3 percent of reusable code by memory usage and is tying up an amazing 530 megabytes with
non-reusable code! Let’s look at a database with good reuse statistics. Look at this one:Date: 11/13/05 Page: 1Time: 03:15 PM Shared Pool Utilization PERFSTAT dbaville database
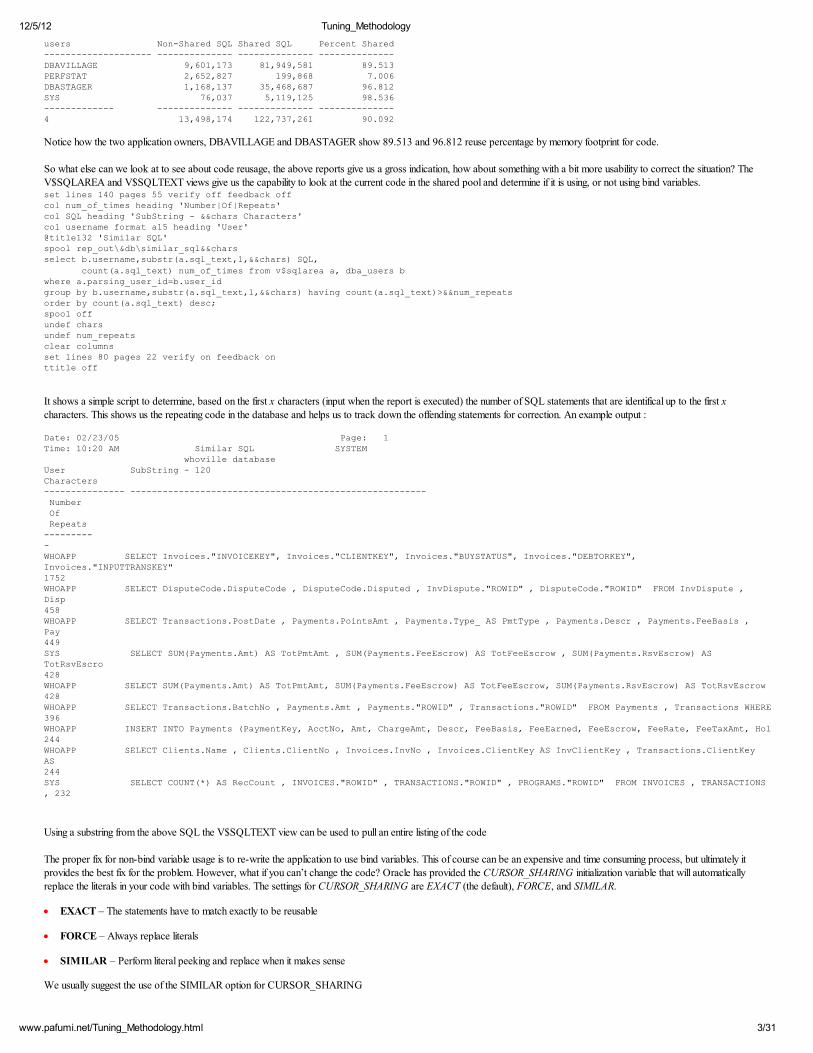
Notice how the two application owners, DBAVILLAGE and DBASTAGER show 89.513 and 96.812 reuse percentage by memory footprint for code.
So what else can we look at to see about code reusage, the above reports give us a gross indication, how about something with a bit more usability to correct the situation? The
V$SQLAREA and V$SQLTEXT views give us the capability to look at the current code in the shared pool and determine if it is using, or not using bind variables. set lines 140 pages 55 verify off feedback offcol num_of_times heading 'Number|Of|Repeats'col SQL heading 'SubString - &&chars Characters'col username format a15 heading 'User'@title132 'Similar SQL'spool rep_out\&db\similar_sql&&charsselect b.username,substr(a.sql_text,1,&&chars) SQL,
count(a.sql_text) num_of_times from v$sqlarea a, dba_users bwhere a.parsing_user_id=b.user_idgroup by b.username,substr(a.sql_text,1,&&chars) having count(a.sql_text)>&&num_repeatsorder by count(a.sql_text) desc;spool offundef charsundef num_repeatsclear columnsset lines 80 pages 22 verify on feedback onttitle off
It shows a simple script to determine, based on the first x characters (input when the report is executed) the number of SQL statements that are identifical up to the first x
characters. This shows us the repeating code in the database and helps us to track down the offending statements for correction. An example output :
Date: 02/23/05 Page: 1 Time: 10:20 AM Similar SQL SYSTEM whoville database User SubString - 120Characters --------------- ------------------------------------------------------- Number Of Repeats ---------- WHOAPP SELECT Invoices."INVOICEKEY", Invoices."CLIENTKEY", Invoices."BUYSTATUS", Invoices."DEBTORKEY",Invoices."INPUTTRANSKEY" 1752 WHOAPP SELECT DisputeCode.DisputeCode , DisputeCode.Disputed , InvDispute."ROWID" , DisputeCode."ROWID" FROM InvDispute ,Disp 458 WHOAPP SELECT Transactions.PostDate , Payments.PointsAmt , Payments.Type_ AS PmtType , Payments.Descr , Payments.FeeBasis ,Pay 449 SYS SELECT SUM(Payments.Amt) AS TotPmtAmt , SUM(Payments.FeeEscrow) AS TotFeeEscrow , SUM(Payments.RsvEscrow) ASTotRsvEscro428 WHOAPP SELECT SUM(Payments.Amt) AS TotPmtAmt, SUM(Payments.FeeEscrow) AS TotFeeEscrow, SUM(Payments.RsvEscrow) AS TotRsvEscrow428 WHOAPP SELECT Transactions.BatchNo , Payments.Amt , Payments."ROWID" , Transactions."ROWID" FROM Payments , Transactions WHERE396 WHOAPP INSERT INTO Payments (PaymentKey, AcctNo, Amt, ChargeAmt, Descr, FeeBasis, FeeEarned, FeeEscrow, FeeRate, FeeTaxAmt, Hol244 WHOAPP SELECT Clients.Name , Clients.ClientNo , Invoices.InvNo , Invoices.ClientKey AS InvClientKey , Transactions.ClientKeyAS 244 SYS SELECT COUNT(*) AS RecCount , INVOICES."ROWID" , TRANSACTIONS."ROWID" , PROGRAMS."ROWID" FROM INVOICES , TRANSACTIONS, 232
Using a substring from the above SQL the V$SQLTEXT view can be used to pull an entire listing of the code
The proper fix for non-bind variable usage is to re-write the application to use bind variables. This of course can be an expensive and time consuming process, but ultimately it
provides the best fix for the problem. However, what if you can’t change the code? Oracle has provided the CURSOR_SHARING initialization variable that will automaticallyreplace the literals in your code with bind variables. The settings for CURSOR_SHARING are EXACT (the default), FORCE, and SIMILAR.
· EXACT – The statements have to match exactly to be reusable
· FORCE – Always replace literals
· SIMILAR – Perform literal peeking and replace when it makes sense
We usually suggest the use of the SIMILAR option for CURSOR_SHARING
12/5/12 Tuning_Methodology
4/31www.pafumi.net/Tuning_Methodology.html
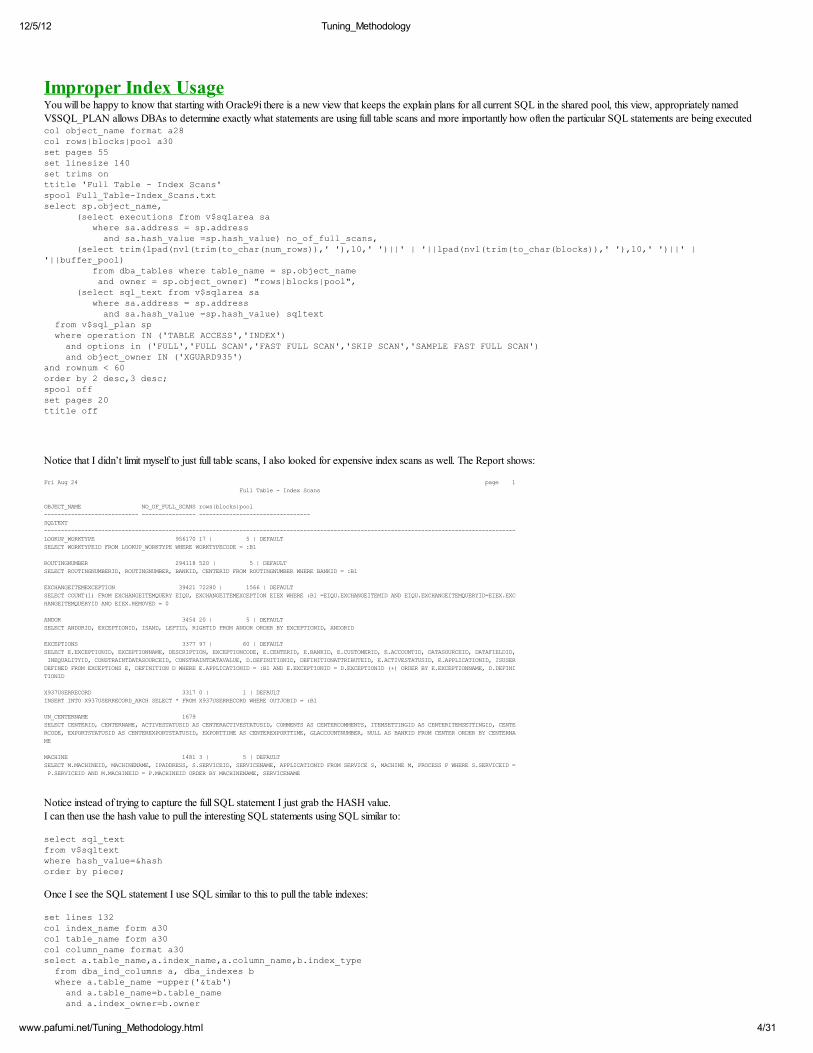
Improper Index UsageYou will be happy to know that starting with Oracle9i there is a new view that keeps the explain plans for all current SQL in the shared pool, this view, appropriately named
V$SQL_PLAN allows DBAs to determine exactly what statements are using full table scans and more importantly how often the particular SQL statements are being executedcol object_name format a28col rows|blocks|pool a30set pages 55 set linesize 140 set trims onttitle 'Full Table - Index Scans'spool Full_Table-Index_Scans.txtselect sp.object_name, (select executions from v$sqlarea sa where sa.address = sp.address and sa.hash_value =sp.hash_value) no_of_full_scans, (select trim(lpad(nvl(trim(to_char(num_rows)),' '),10,' ')||' | '||lpad(nvl(trim(to_char(blocks)),' '),10,' ')||' |'||buffer_pool) from dba_tables where table_name = sp.object_name and owner = sp.object_owner) "rows|blocks|pool", (select sql_text from v$sqlarea sa where sa.address = sp.address and sa.hash_value =sp.hash_value) sqltext from v$sql_plan sp where operation IN ('TABLE ACCESS','INDEX') and options in ('FULL','FULL SCAN','FAST FULL SCAN','SKIP SCAN','SAMPLE FAST FULL SCAN') and object_owner IN ('XGUARD935')and rownum < 60order by 2 desc,3 desc;spool offset pages 20ttitle off
Notice that I didn’t limit myself to just full table scans, I also looked for expensive index scans as well. The Report shows:
DEFINED FROM EXCEPTIONS E, DEFINITION D WHERE E.APPLICATIONID = :B1 AND E.EXCEPTIONID = D.EXCEPTIONID (+) ORDER BY E.EXCEPTIONNAME, D.DEFINI
TIONID
X937USERRECORD 3317 0 | 1 | DEFAULT
INSERT INTO X937USERRECORD_ARCH SELECT * FROM X937USERRECORD WHERE OUTJOBID = :B1
UN_CENTERNAME 1679
SELECT CENTERID, CENTERNAME, ACTIVESTATUSID AS CENTERACTIVESTATUSID, COMMENTS AS CENTERCOMMENTS, ITEMSETTINGID AS CENTERITEMSETTINGID, CENTE
RCODE, EXPORTSTATUSID AS CENTEREXPORTSTATUSID, EXPORTTIME AS CENTEREXPORTTIME, GLACCOUNTNUMBER, NULL AS BANKID FROM CENTER ORDER BY CENTERNA
ME
MACHINE 1481 3 | 5 | DEFAULT
SELECT M.MACHINEID, MACHINENAME, IPADDRESS, S.SERVICEID, SERVICENAME, APPLICATIONID FROM SERVICE S, MACHINE M, PROCESS P WHERE S.SERVICEID =
P.SERVICEID AND M.MACHINEID = P.MACHINEID ORDER BY MACHINENAME, SERVICENAME
Notice instead of trying to capture the full SQL statement I just grab the HASH value.
I can then use the hash value to pull the interesting SQL statements using SQL similar to:
select sql_text from v$sqltext where hash_value=&hashorder by piece;
Once I see the SQL statement I use SQL similar to this to pull the table indexes:
set lines 132col index_name form a30col table_name form a30col column_name format a30select a.table_name,a.index_name,a.column_name,b.index_type from dba_ind_columns a, dba_indexes b where a.table_name =upper('&tab') and a.table_name=b.table_name and a.index_owner=b.owner
12/5/12 Tuning_Methodology
5/31www.pafumi.net/Tuning_Methodology.html
and a.index_name=b.index_name order by a.table_name,a.index_name,a.column_position;set lines 80
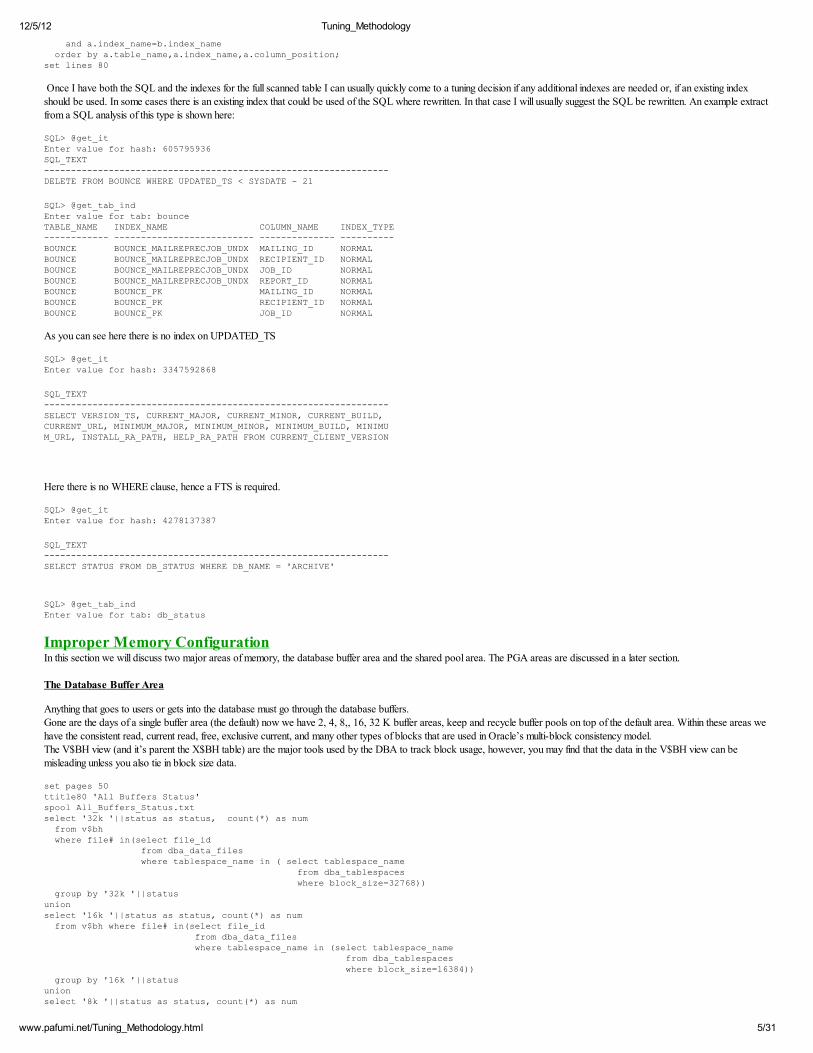
Once I have both the SQL and the indexes for the full scanned table I can usually quickly come to a tuning decision if any additional indexes are needed or, if an existing indexshould be used. In some cases there is an existing index that could be used of the SQL where rewritten. In that case I will usually suggest the SQL be rewritten. An example extract
from a SQL analysis of this type is shown here:
SQL> @get_itEnter value for hash: 605795936SQL_TEXT----------------------------------------------------------------DELETE FROM BOUNCE WHERE UPDATED_TS < SYSDATE - 21
Here there is no WHERE clause, hence a FTS is required.
SQL> @get_itEnter value for hash: 4278137387
SQL_TEXT----------------------------------------------------------------SELECT STATUS FROM DB_STATUS WHERE DB_NAME = 'ARCHIVE'
SQL> @get_tab_indEnter value for tab: db_status
Improper Memory ConfigurationIn this section we will discuss two major areas of memory, the database buffer area and the shared pool area. The PGA areas are discussed in a later section.
The Database Buffer Area
Anything that goes to users or gets into the database must go through the database buffers.Gone are the days of a single buffer area (the default) now we have 2, 4, 8,, 16, 32 K buffer areas, keep and recycle buffer pools on top of the default area. Within these areas wehave the consistent read, current read, free, exclusive current, and many other types of blocks that are used in Oracle’s multi-block consistency model.
The V$BH view (and it’s parent the X$BH table) are the major tools used by the DBA to track block usage, however, you may find that the data in the V$BH view can bemisleading unless you also tie in block size data.
set pages 50ttitle80 'All Buffers Status'spool All_Buffers_Status.txtselect '32k '||status as status, count(*) as num from v$bh where file# in(select file_id from dba_data_files where tablespace_name in ( select tablespace_name from dba_tablespaces where block_size=32768)) group by '32k '||statusunionselect '16k '||status as status, count(*) as num from v$bh where file# in(select file_id from dba_data_files where tablespace_name in (select tablespace_name from dba_tablespaces where block_size=16384)) group by '16k '||statusunionselect '8k '||status as status, count(*) as num
12/5/12 Tuning_Methodology
6/31www.pafumi.net/Tuning_Methodology.html
from v$bh where file# in( select file_id from dba_data_files where tablespace_name in (select tablespace_name from dba_tablespaces where block_size=8192)) group by '8k '||statusunionselect '4k '||status as status, count(*) as num from v$bh where file# in(select file_id from dba_data_files where tablespace_name in ( select tablespace_name from dba_tablespaces where block_size=4096)) group by '4k '||statusunionselect '2k '||status as status, count(*) as num from v$bh where file# in(select file_id from dba_data_files where tablespace_name in ( select tablespace_name from dba_tablespaces where block_size=2048)) group by '2k '||statusunionselect status, count(*) as num from v$bh where status='free'group by statusorder by 1/spool offttitle off
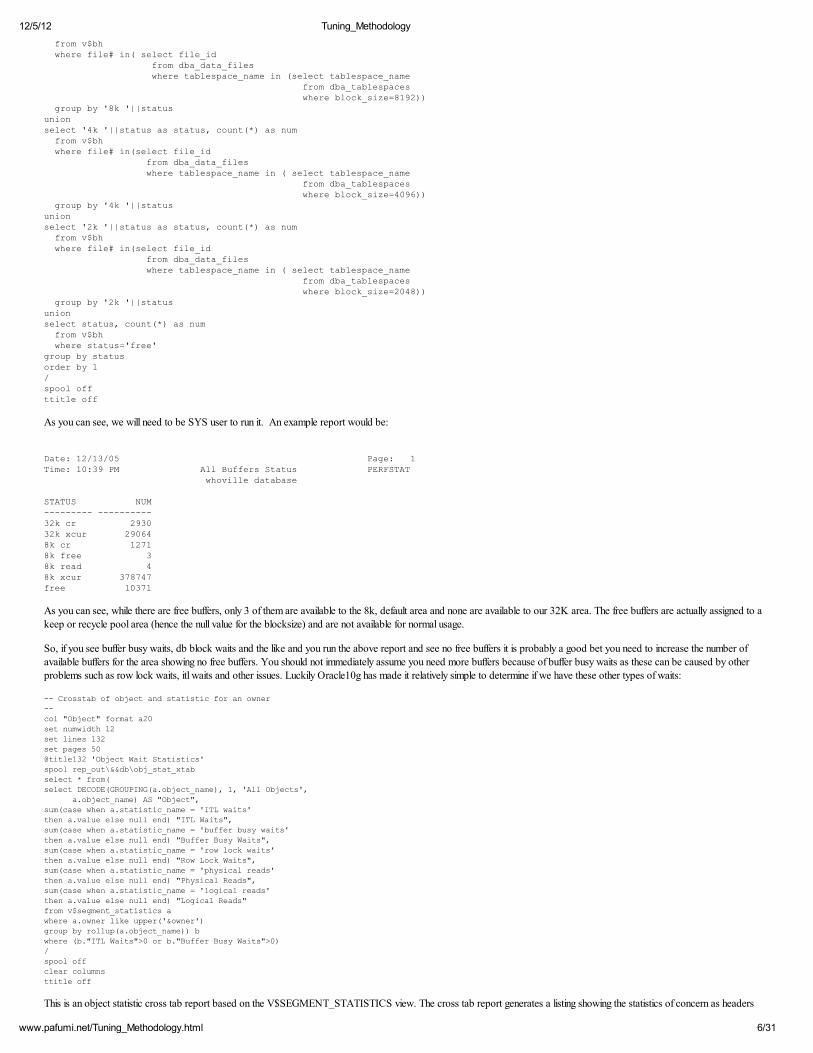
As you can see, we will need to be SYS user to run it. An example report would be:
Date: 12/13/05 Page: 1Time: 10:39 PM All Buffers Status PERFSTAT whoville database STATUS NUM --------- ---------- 32k cr 2930 32k xcur 29064 8k cr 1271 8k free 3 8k read 4 8k xcur 378747 free 10371
As you can see, while there are free buffers, only 3 of them are available to the 8k, default area and none are available to our 32K area. The free buffers are actually assigned to akeep or recycle pool area (hence the null value for the blocksize) and are not available for normal usage.
So, if you see buffer busy waits, db block waits and the like and you run the above report and see no free buffers it is probably a good bet you need to increase the number ofavailable buffers for the area showing no free buffers. You should not immediately assume you need more buffers because of buffer busy waits as these can be caused by other
problems such as row lock waits, itl waits and other issues. Luckily Oracle10g has made it relatively simple to determine if we have these other types of waits:
from v$segment_statistics awhere a.owner like upper('&owner')
group by rollup(a.object_name)) b
where (b."ITL Waits">0 or b."Buffer Busy Waits">0)/
spool offclear columns
ttitle off
This is an object statistic cross tab report based on the V$SEGMENT_STATISTICS view. The cross tab report generates a listing showing the statistics of concern as headers
12/5/12 Tuning_Methodology
7/31www.pafumi.net/Tuning_Methodology.html
across the page rather than listings going down the page and summarizes them by object. This allows us to easily compare total buffer busy waits to the number of ITL or row lockwaits. This ability to compare the ITL and row lock waits to buffer busy waits lets us see what objects may be experiencing contention for ITL lists, which may be experiencingexcessive locking activity and through comparisons, which are highly contended for without the row lock or ITL waits. An example of the output of the report, edited for length, isshown here:
In the above report the BILLING_INDX1 index has a large number of buffer busy waits but we can’t account for them from the ITL or Row lock waits, this indicates that theindex is being constantly read and the blocks then aged out of memory forcing waits as they are re-read for the next process. On the other hand, almost all of the buffer busy waitsfor the DELIVER_INDX1 index can be attributed to ITL and Row Lock waits.In situations where there are large numbers of ITL waits we need to consider the increase of the INITRANS setting for the table to remove this source of contention. If thepredominant wait is row lock waits then we need to determine if we are properly using locking and cursors in our application (for example, we may be over using the SELECT…FOR UPDATE type code.) If, on the other hand all the waits are un-accounted for buffer busy waits, then we need to consider increasing the amount of database block buffers wehave in our SGA.
As you can see, this object wait cross tab report can be a powerful addition to our tuning arsenal.By knowing how our buffers are being used and seeing exactly what waits are causing our buffer wait indications we can quickly determine if we need to tune objects or addbuffers, making sizing buffer areas fairly easy.But what about the Automatic Memory Manager in 10g? It is a powerful tool for DBAs with systems that have a predictable load profile, however if your system has rapid changesin user and memory loads then AMM is playing catch up and may deliver poor performance as a result. In the case of memory it may be better to hand the system too much ratherthan just enough, just in time (JIT).As many companies have found when trying the JIT methodology in their manufacturing environment it only works if things are easily predictable.
The AMM is utilized in 10g by setting two parameters, the SGA_MAX_SIZE and the SGA_TARGET. The Oracle memory manager will size the various buffer areas as neededwithin the range between base settings or SGA_TARGET and SGA_MAX_SIZE using the SGA_TARGET setting as an “optimal” and the SGA_MAX_SIZE as a maximum withthe manual settings used in some cases as a minimum size for the specific memory component.
Check Disks I/ODisk stress will show up on the Oracle side as excessive read or write times. Filesystem stress is shown by calculating the IO timings as shown here:
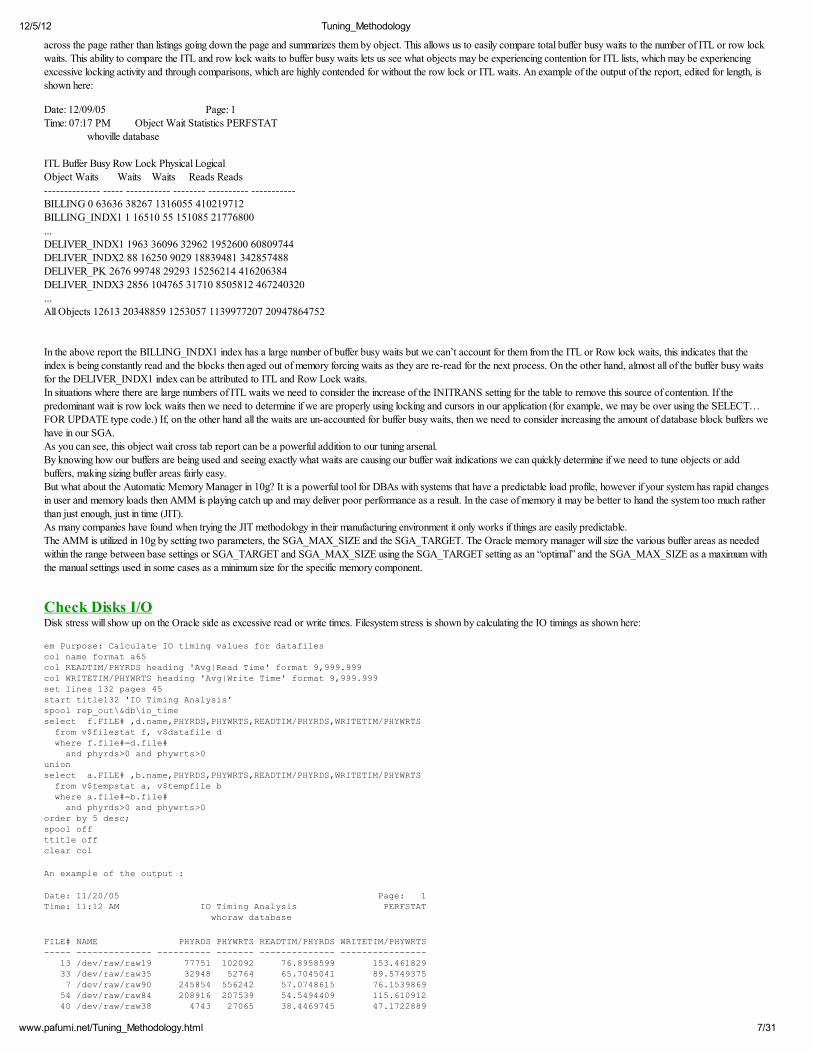
em Purpose: Calculate IO timing values for datafilescol name format a65col READTIM/PHYRDS heading 'Avg|Read Time' format 9,999.999col WRITETIM/PHYWRTS heading 'Avg|Write Time' format 9,999.999set lines 132 pages 45start title132 'IO Timing Analysis'spool rep_out\&db\io_timeselect f.FILE# ,d.name,PHYRDS,PHYWRTS,READTIM/PHYRDS,WRITETIM/PHYWRTS from v$filestat f, v$datafile d where f.file#=d.file# and phyrds>0 and phywrts>0unionselect a.FILE# ,b.name,PHYRDS,PHYWRTS,READTIM/PHYRDS,WRITETIM/PHYWRTS from v$tempstat a, v$tempfile b where a.file#=b.file# and phyrds>0 and phywrts>0order by 5 desc;spool offttitle offclear col
As you can see we are looking at an example report from a RAW configuration using single disks. Notice how both read and write times exceed even the rather large good practicelimits of 10-20 milliseconds for a disk read. However in my experience for reads you should not exceed 5 milliseconds and usually with modern buffered reads, 1-2 milliseconds.
Oracle is more tolerant for write delays since it uses a delayed write mechanism, so 10-20 milliseconds on writes will normally not cause significant Oracle waits, however, thesmaller you can get read and write times, the better!
For the money, I would suggest RAID0/1 or RAID1/0, that is, striped and mirrored. It provides nearly all of the dependability of RAID5 and gives much better write performance.You will usually take at least a 20 percent write performance hit using RAID5. For read-only applications RAID5 is a good choice, but in high-transaction/high-performanceenvironments the write penalties may be too high.
Table 1 shows how Oracle suggests RAID should be used with Oracle database files.
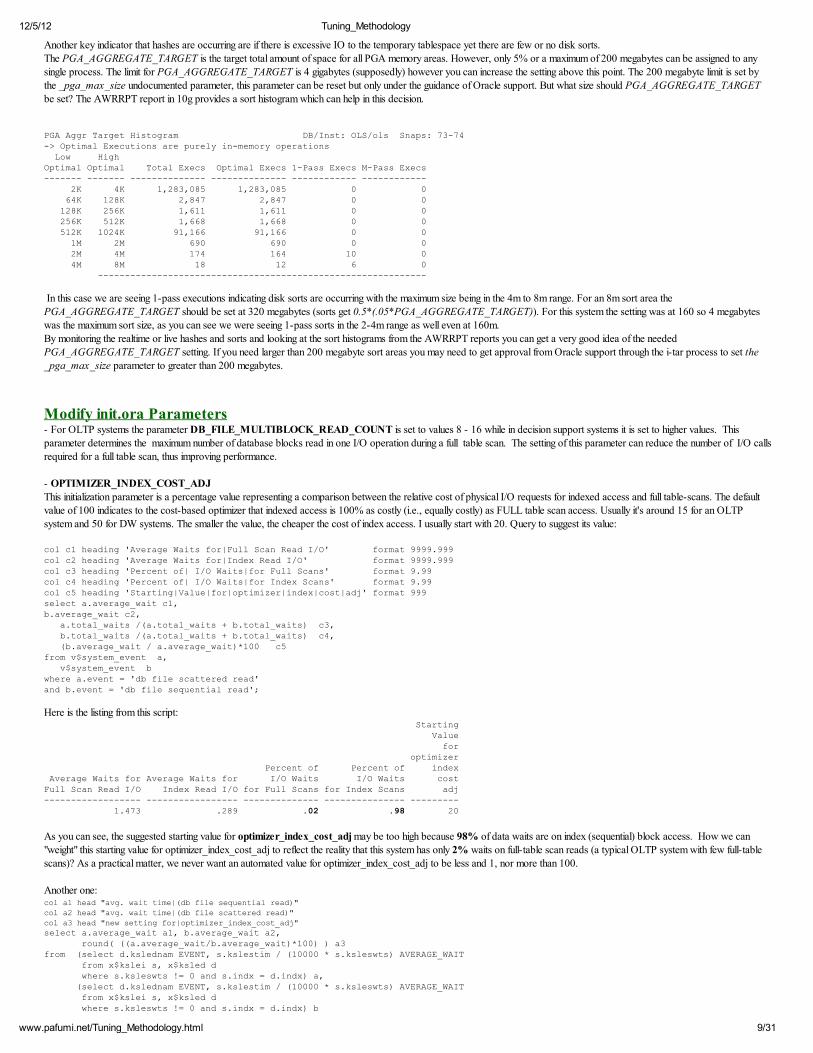
Improper PGA setupOracle provides AWRRPT or statspack reports to track and show the number of sorts. Unfortunately hashes are not so easily tracked. Oracle tracks disk and memory sorts,number of sort rows and other sort related statistics. Hashes on the other hand only can be tracked usually by the execution plans for cumulative values, and by various views for
live values. After 9i the parameter PGA_AGGREGATE_TARGET was provided to allow automated setting of the sort and hash areas. For currently active sorts or hashes thefollowing script can be used to watch the growth of temporary areas.
column now format a14column operation format a15column dt new_value td noprintset feedback offselect to_char(sysdate,'ddmonyyyyhh24miss') dt from dual;set lines 132 pages 55@title132 'Sorts and Hashes'spool rep_out\&&db\sorts_hashes&&tdselect sid,work_area_size,expected_size,actual_mem_used,max_mem_used,tempseg_size,to_char(sysdate,'ddmonyyyyhh24miss') now, operation_type operationfrom v$sql_workarea_active;spool offclear columnsset lines 80 feedback onttitle off
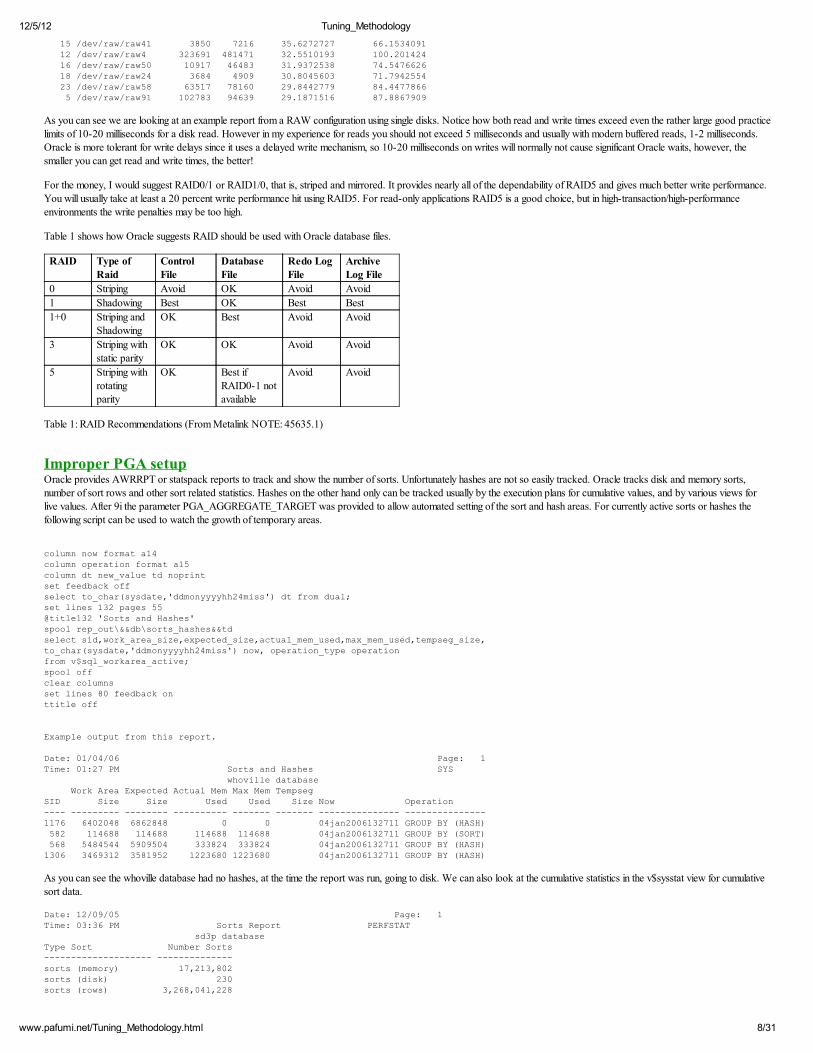
Example output from this report.
Date: 01/04/06 Page: 1Time: 01:27 PM Sorts and Hashes SYS whoville database Work Area Expected Actual Mem Max Mem TempsegSID Size Size Used Used Size Now Operation---- --------- -------- ---------- ------- ------- --------------- ---------------1176 6402048 6862848 0 0 04jan2006132711 GROUP BY (HASH) 582 114688 114688 114688 114688 04jan2006132711 GROUP BY (SORT) 568 5484544 5909504 333824 333824 04jan2006132711 GROUP BY (HASH)1306 3469312 3581952 1223680 1223680 04jan2006132711 GROUP BY (HASH)
As you can see the whoville database had no hashes, at the time the report was run, going to disk. We can also look at the cumulative statistics in the v$sysstat view for cumulativesort data.
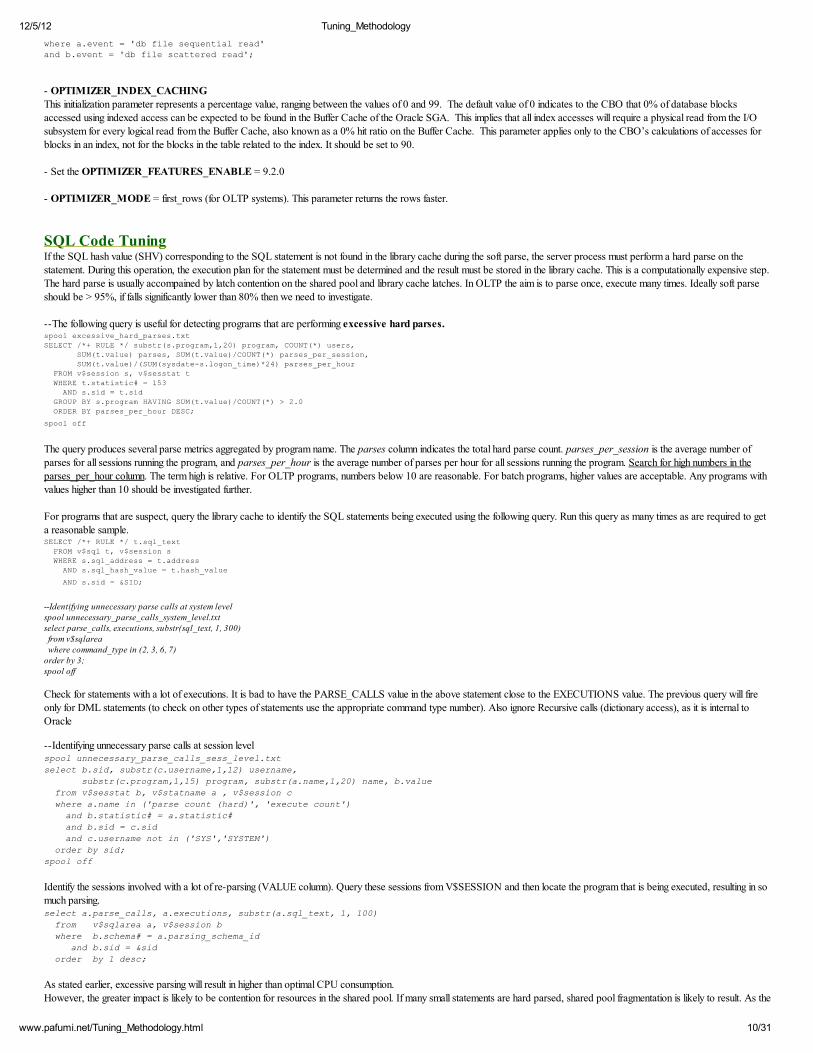
Another key indicator that hashes are occurring are if there is excessive IO to the temporary tablespace yet there are few or no disk sorts.The PGA_AGGREGATE_TARGET is the target total amount of space for all PGA memory areas. However, only 5% or a maximum of 200 megabytes can be assigned to anysingle process. The limit for PGA_AGGREGATE_TARGET is 4 gigabytes (supposedly) however you can increase the setting above this point. The 200 megabyte limit is set bythe _pga_max_size undocumented parameter, this parameter can be reset but only under the guidance of Oracle support. But what size should PGA_AGGREGATE_TARGETbe set? The AWRRPT report in 10g provides a sort histogram which can help in this decision.
In this case we are seeing 1-pass executions indicating disk sorts are occurring with the maximum size being in the 4m to 8m range. For an 8m sort area thePGA_AGGREGATE_TARGET should be set at 320 megabytes (sorts get 0.5*(.05*PGA_AGGREGATE_TARGET)). For this system the setting was at 160 so 4 megabyteswas the maximum sort size, as you can see we were seeing 1-pass sorts in the 2-4m range as well even at 160m.By monitoring the realtime or live hashes and sorts and looking at the sort histograms from the AWRRPT reports you can get a very good idea of the needed
PGA_AGGREGATE_TARGET setting. If you need larger than 200 megabyte sort areas you may need to get approval from Oracle support through the i-tar process to set the_pga_max_size parameter to greater than 200 megabytes.
Modify init.ora Parameters- For OLTP systems the parameter DB_FILE_MULTIBLOCK_READ_COUNT is set to values 8 - 16 while in decision support systems it is set to higher values. Thisparameter determines the maximum number of database blocks read in one I/O operation during a full table scan. The setting of this parameter can reduce the number of I/O callsrequired for a full table scan, thus improving performance.
- OPTIMIZER_INDEX_COST_ADJ
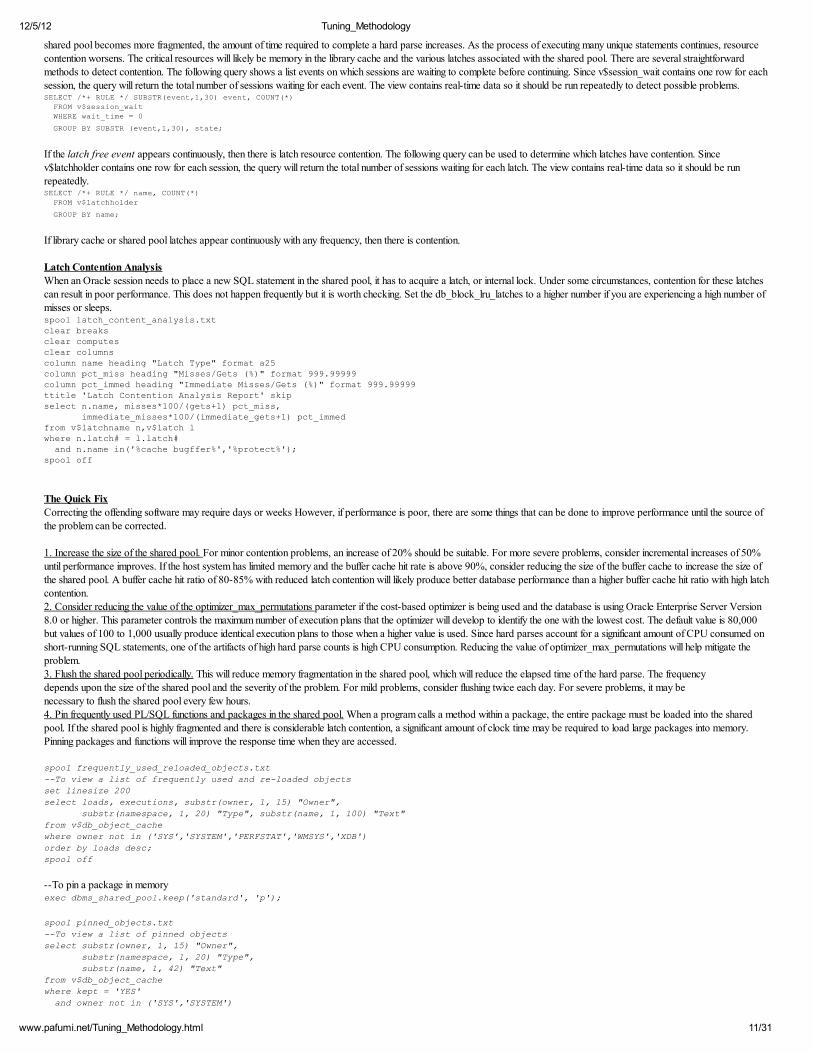
This initialization parameter is a percentage value representing a comparison between the relative cost of physical I/O requests for indexed access and full table-scans. The defaultvalue of 100 indicates to the cost-based optimizer that indexed access is 100% as costly (i.e., equally costly) as FULL table scan access. Usually it's around 15 for an OLTPsystem and 50 for DW systems. The smaller the value, the cheaper the cost of index access. I usually start with 20. Query to suggest its value:
col c1 heading 'Average Waits for|Full Scan Read I/O' format 9999.999col c2 heading 'Average Waits for|Index Read I/O' format 9999.999col c3 heading 'Percent of| I/O Waits|for Full Scans' format 9.99col c4 heading 'Percent of| I/O Waits|for Index Scans' format 9.99col c5 heading 'Starting|Value|for|optimizer|index|cost|adj' format 999select a.average_wait c1,b.average_wait c2, a.total_waits /(a.total_waits + b.total_waits) c3, b.total_waits /(a.total_waits + b.total_waits) c4, (b.average_wait / a.average_wait)*100 c5from v$system_event a, v$system_event bwhere a.event = 'db file scattered read'and b.event = 'db file sequential read';
Here is the listing from this script: Starting Value for optimizer Percent of Percent of index Average Waits for Average Waits for I/O Waits I/O Waits costFull Scan Read I/O Index Read I/O for Full Scans for Index Scans adj------------------ ----------------- -------------- --------------- --------- 1.473 .289 .02 .98 20
As you can see, the suggested starting value for optimizer_index_cost_adj may be too high because 98% of data waits are on index (sequential) block access. How we can"weight" this starting value for optimizer_index_cost_adj to reflect the reality that this system has only 2% waits on full-table scan reads (a typical OLTP system with few full-tablescans)? As a practical matter, we never want an automated value for optimizer_index_cost_adj to be less and 1, nor more than 100.
Another one:col a1 head "avg. wait time|(db file sequential read)"
col a2 head "avg. wait time|(db file scattered read)"col a3 head "new setting for|optimizer_index_cost_adj"
select a.average_wait a1, b.average_wait a2, round( ((a.average_wait/b.average_wait)*100) ) a3from (select d.kslednam EVENT, s.kslestim / (10000 * s.ksleswts) AVERAGE_WAIT from x$kslei s, x$ksled d where s.ksleswts != 0 and s.indx = d.indx) a, (select d.kslednam EVENT, s.kslestim / (10000 * s.ksleswts) AVERAGE_WAIT from x$kslei s, x$ksled d where s.ksleswts != 0 and s.indx = d.indx) b
- OPTIMIZER_INDEX_CACHINGThis initialization parameter represents a percentage value, ranging between the values of 0 and 99. The default value of 0 indicates to the CBO that 0% of database blocksaccessed using indexed access can be expected to be found in the Buffer Cache of the Oracle SGA. This implies that all index accesses will require a physical read from the I/Osubsystem for every logical read from the Buffer Cache, also known as a 0% hit ratio on the Buffer Cache. This parameter applies only to the CBO’s calculations of accesses forblocks in an index, not for the blocks in the table related to the index. It should be set to 90.
- Set the OPTIMIZER_FEATURES_ENABLE = 9.2.0
- OPTIMIZER_MODE = first_rows (for OLTP systems). This parameter returns the rows faster.
SQL Code TuningIf the SQL hash value (SHV) corresponding to the SQL statement is not found in the library cache during the soft parse, the server process must perform a hard parse on thestatement. During this operation, the execution plan for the statement must be determined and the result must be stored in the library cache. This is a computationally expensive step.The hard parse is usually accompained by latch contention on the shared pool and library cache latches. In OLTP the aim is to parse once, execute many times. Ideally soft parseshould be > 95%, if falls significantly lower than 80% then we need to investigate.
--The following query is useful for detecting programs that are performing excessive hard parses.spool excessive_hard_parses.txt
GROUP BY s.program HAVING SUM(t.value)/COUNT(*) > 2.0
ORDER BY parses_per_hour DESC;
spool off
The query produces several parse metrics aggregated by program name. The parses column indicates the total hard parse count. parses_per_session is the average number ofparses for all sessions running the program, and parses_per_hour is the average number of parses per hour for all sessions running the program. Search for high numbers in theparses_per_hour column. The term high is relative. For OLTP programs, numbers below 10 are reasonable. For batch programs, higher values are acceptable. Any programs withvalues higher than 10 should be investigated further.
For programs that are suspect, query the library cache to identify the SQL statements being executed using the following query. Run this query as many times as are required to geta reasonable sample.SELECT /*+ RULE */ t.sql_text
FROM v$sql t, v$session s
WHERE s.sql_address = t.address
AND s.sql_hash_value = t.hash_value
AND s.sid = &SID;
--Identifying unnecessary parse calls at system levelspool unnecessary_parse_calls_system_level.txtselect parse_calls, executions, substr(sql_text, 1, 300) from v$sqlarea where command_type in (2, 3, 6, 7)order by 3; spool off
Check for statements with a lot of executions. It is bad to have the PARSE_CALLS value in the above statement close to the EXECUTIONS value. The previous query will fireonly for DML statements (to check on other types of statements use the appropriate command type number). Also ignore Recursive calls (dictionary access), as it is internal toOracle
--Identifying unnecessary parse calls at session levelspool unnecessary_parse_calls_sess_level.txt
where a.name in ('parse count (hard)', 'execute count')
and b.statistic# = a.statistic#
and b.sid = c.sid
and c.username not in ('SYS','SYSTEM')
order by sid;
spool off
Identify the sessions involved with a lot of re-parsing (VALUE column). Query these sessions from V$SESSION and then locate the program that is being executed, resulting in somuch parsing.select a.parse_calls, a.executions, substr(a.sql_text, 1, 100)
from v$sqlarea a, v$session b
where b.schema# = a.parsing_schema_id
and b.sid = &sid
order by 1 desc;
As stated earlier, excessive parsing will result in higher than optimal CPU consumption.However, the greater impact is likely to be contention for resources in the shared pool. If many small statements are hard parsed, shared pool fragmentation is likely to result. As the
12/5/12 Tuning_Methodology
11/31www.pafumi.net/Tuning_Methodology.html
shared pool becomes more fragmented, the amount of time required to complete a hard parse increases. As the process of executing many unique statements continues, resourcecontention worsens. The critical resources will likely be memory in the library cache and the various latches associated with the shared pool. There are several straightforwardmethods to detect contention. The following query shows a list events on which sessions are waiting to complete before continuing. Since v$session_wait contains one row for eachsession, the query will return the total number of sessions waiting for each event. The view contains real-time data so it should be run repeatedly to detect possible problems.SELECT /*+ RULE */ SUBSTR(event,1,30) event, COUNT(*)
FROM v$session_wait
WHERE wait_time = 0
GROUP BY SUBSTR (event,1,30), state;
If the latch free event appears continuously, then there is latch resource contention. The following query can be used to determine which latches have contention. Sincev$latchholder contains one row for each session, the query will return the total number of sessions waiting for each latch. The view contains real-time data so it should be runrepeatedly.SELECT /*+ RULE */ name, COUNT(*)
FROM v$latchholder
GROUP BY name;
If library cache or shared pool latches appear continuously with any frequency, then there is contention.
Latch Contention AnalysisWhen an Oracle session needs to place a new SQL statement in the shared pool, it has to acquire a latch, or internal lock. Under some circumstances, contention for these latchescan result in poor performance. This does not happen frequently but it is worth checking. Set the db_block_lru_latches to a higher number if you are experiencing a high number of
misses or sleeps. spool latch_content_analysis.txtclear breaksclear computesclear columnscolumn name heading "Latch Type" format a25column pct_miss heading "Misses/Gets (%)" format 999.99999column pct_immed heading "Immediate Misses/Gets (%)" format 999.99999ttitle 'Latch Contention Analysis Report' skipselect n.name, misses*100/(gets+1) pct_miss, immediate_misses*100/(immediate_gets+1) pct_immedfrom v$latchname n,v$latch lwhere n.latch# = l.latch# and n.name in('%cache bugffer%','%protect%'); spool off
The Quick FixCorrecting the offending software may require days or weeks However, if performance is poor, there are some things that can be done to improve performance until the source ofthe problem can be corrected.
1. Increase the size of the shared pool. For minor contention problems, an increase of 20% should be suitable. For more severe problems, consider incremental increases of 50%until performance improves. If the host system has limited memory and the buffer cache hit rate is above 90%, consider reducing the size of the buffer cache to increase the size ofthe shared pool. A buffer cache hit ratio of 80-85% with reduced latch contention will likely produce better database performance than a higher buffer cache hit ratio with high latchcontention.2. Consider reducing the value of the optimizer_max_permutations parameter if the cost-based optimizer is being used and the database is using Oracle Enterprise Server Version8.0 or higher. This parameter controls the maximum number of execution plans that the optimizer will develop to identify the one with the lowest cost. The default value is 80,000but values of 100 to 1,000 usually produce identical execution plans to those when a higher value is used. Since hard parses account for a significant amount of CPU consumed on
short-running SQL statements, one of the artifacts of high hard parse counts is high CPU consumption. Reducing the value of optimizer_max_permutations will help mitigate theproblem.3. Flush the shared pool periodically. This will reduce memory fragmentation in the shared pool, which will reduce the elapsed time of the hard parse. The frequencydepends upon the size of the shared pool and the severity of the problem. For mild problems, consider flushing twice each day. For severe problems, it may benecessary to flush the shared pool every few hours.4. Pin frequently used PL/SQL functions and packages in the shared pool. When a program calls a method within a package, the entire package must be loaded into the sharedpool. If the shared pool is highly fragmented and there is considerable latch contention, a significant amount of clock time may be required to load large packages into memory.
Pinning packages and functions will improve the response time when they are accessed.
spool frequently_used_reloaded_objects.txt
--To view a list of frequently used and re-loaded objects
where owner not in ('SYS','SYSTEM','PERFSTAT','WMSYS','XDB')
order by loads desc;
spool off
--To pin a package in memoryexec dbms_shared_pool.keep('standard', 'p');
spool pinned_objects.txt
--To view a list of pinned objects
select substr(owner, 1, 15) "Owner",
substr(namespace, 1, 20) "Type",
substr(name, 1, 42) "Text"
from v$db_object_cache
where kept = 'YES'
and owner not in ('SYS','SYSTEM')
12/5/12 Tuning_Methodology
12/31www.pafumi.net/Tuning_Methodology.html
order by 1,3;
spool off
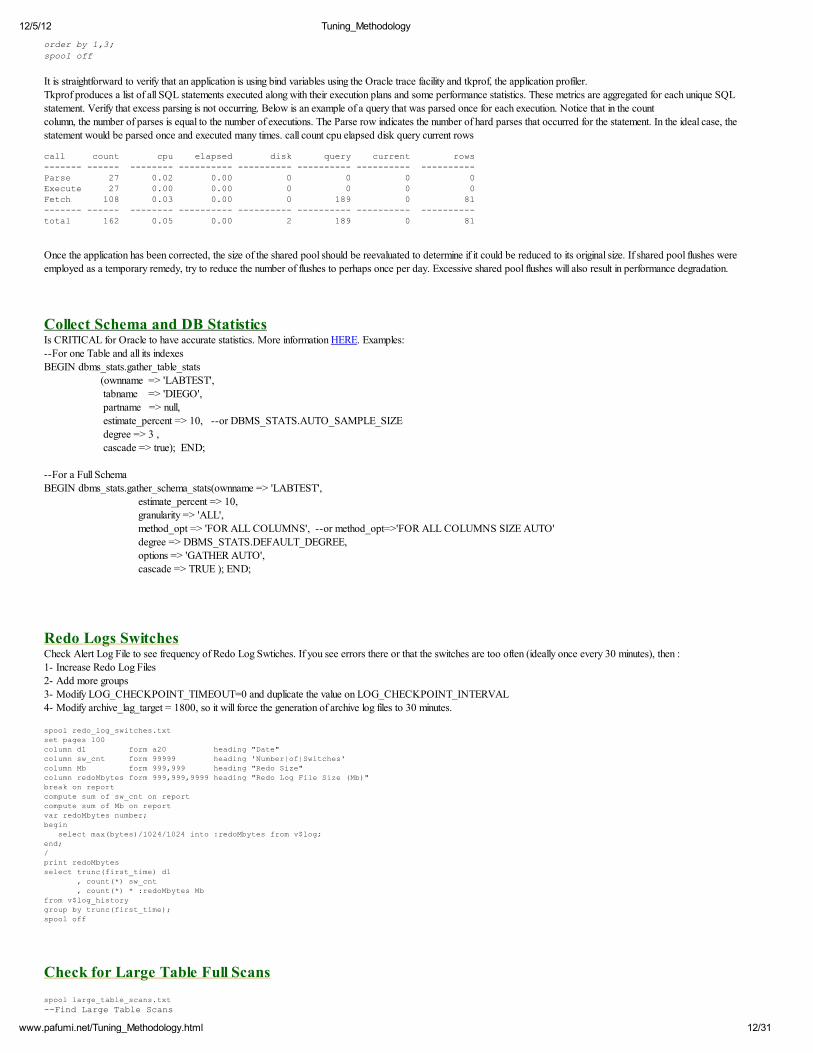
It is straightforward to verify that an application is using bind variables using the Oracle trace facility and tkprof, the application profiler.Tkprof produces a list of all SQL statements executed along with their execution plans and some performance statistics. These metrics are aggregated for each unique SQLstatement. Verify that excess parsing is not occurring. Below is an example of a query that was parsed once for each execution. Notice that in the countcolumn, the number of parses is equal to the number of executions. The Parse row indicates the number of hard parses that occurred for the statement. In the ideal case, the
statement would be parsed once and executed many times. call count cpu elapsed disk query current rows
Once the application has been corrected, the size of the shared pool should be reevaluated to determine if it could be reduced to its original size. If shared pool flushes wereemployed as a temporary remedy, try to reduce the number of flushes to perhaps once per day. Excessive shared pool flushes will also result in performance degradation.
Collect Schema and DB StatisticsIs CRITICAL for Oracle to have accurate statistics. More information HERE. Examples:--For one Table and all its indexesBEGIN dbms_stats.gather_table_stats (ownname => 'LABTEST', tabname => 'DIEGO', partname => null, estimate_percent => 10, --or DBMS_STATS.AUTO_SAMPLE_SIZE degree => 3 , cascade => true); END;
--For a Full SchemaBEGIN dbms_stats.gather_schema_stats(ownname => 'LABTEST', estimate_percent => 10,
Redo Logs SwitchesCheck Alert Log File to see frequency of Redo Log Swtiches. If you see errors there or that the switches are too often (ideally once every 30 minutes), then :1- Increase Redo Log Files2- Add more groups3- Modify LOG_CHECKPOINT_TIMEOUT=0 and duplicate the value on LOG_CHECKPOINT_INTERVAL4- Modify archive_lag_target = 1800, so it will force the generation of archive log files to 30 minutes.
spool redo_log_switches.txt
set pages 100
column d1 form a20 heading "Date"
column sw_cnt form 99999 heading 'Number|of|Switches'
column Mb form 999,999 heading "Redo Size"
column redoMbytes form 999,999,9999 heading "Redo Log File Size (Mb)"
break on report
compute sum of sw_cnt on report
compute sum of Mb on report
var redoMbytes number;
begin
select max(bytes)/1024/1024 into :redoMbytes from v$log;
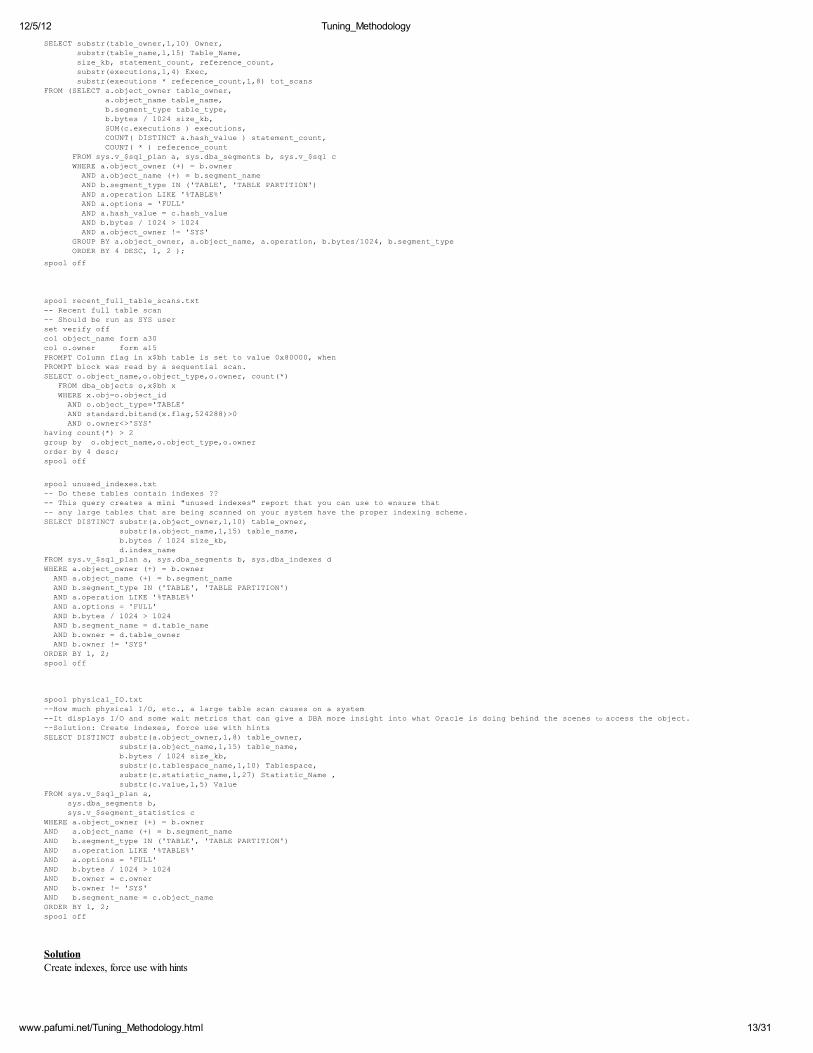
(select distinct address, object_owner owner, object_name name
from v$sql_plan
where operation = 'INDEX'
and options = 'UNIQUE SCAN') p
where d.index_name = p.name
and s.address = p.address
having sum(s.executions) > 9
group by p.owner, d.table_name, p.name
order by sum(s.executions) desc;
spool off
SolutionCheck if is it OK those access. Pin those tables and indexes. Example: alter table/index …. Storage (buffer_pool keep);
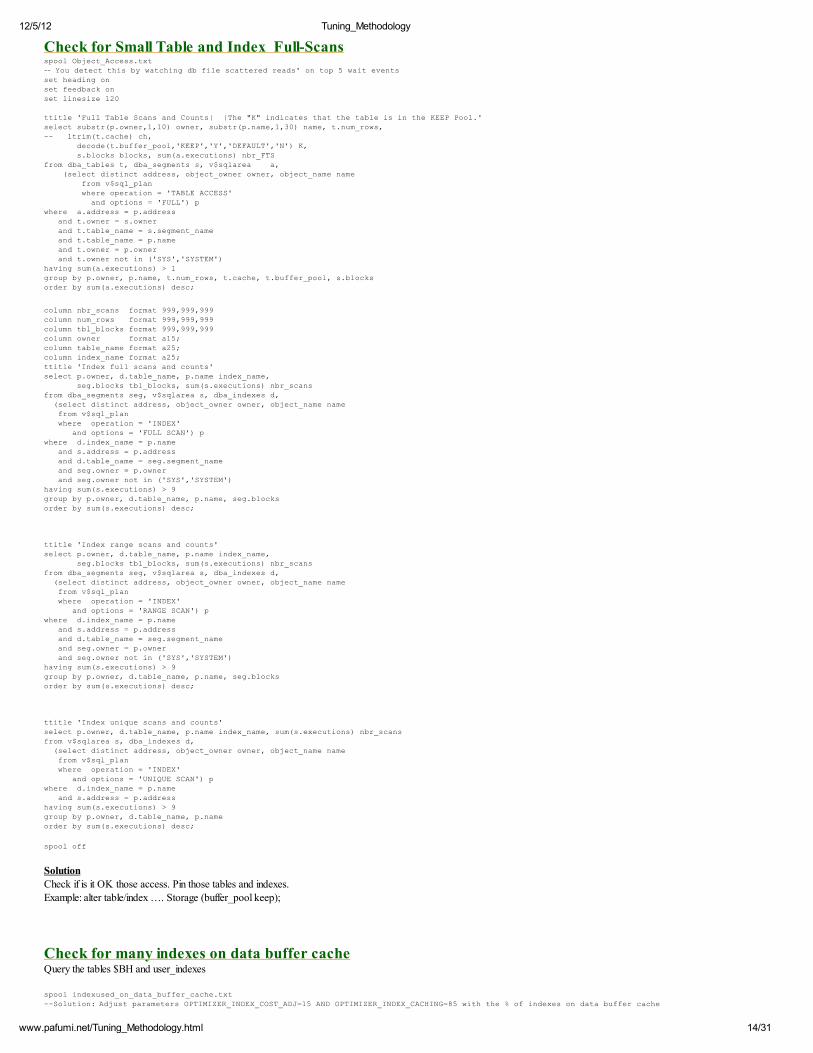
Check for many indexes on data buffer cacheQuery the tables $BH and user_indexes
spool indexused_on_data_buffer_cache.txt
--Solution: Adjust parameters OPTIMIZER_INDEX_COST_ADJ=15 AND OPTIMIZER_INDEX_CACHING=85 with the % of indexes on data buffer cache
/* Recently used indexes */
/* Should be run as SYS user */
set serverout on size 1000000
set verify off
column owner format a20 trunc
column segment_name format a30 trunc
select distinct b.owner, b.segment_name
from x$bh a, dba_extents b
where b.file_id=a.dbarfil
and a.dbablk between b.block_id
and b.block_id+blocks-1
and segment_type='INDEX'
and b.owner = upper('&OWNER')
/
spool off
SolutionAdjust parameters OPTIMIZER_INDEX_COST_ADJ=15 AND OPTIMIZER_INDEX_CACHING=85 with the % of indexes on data buffer cache
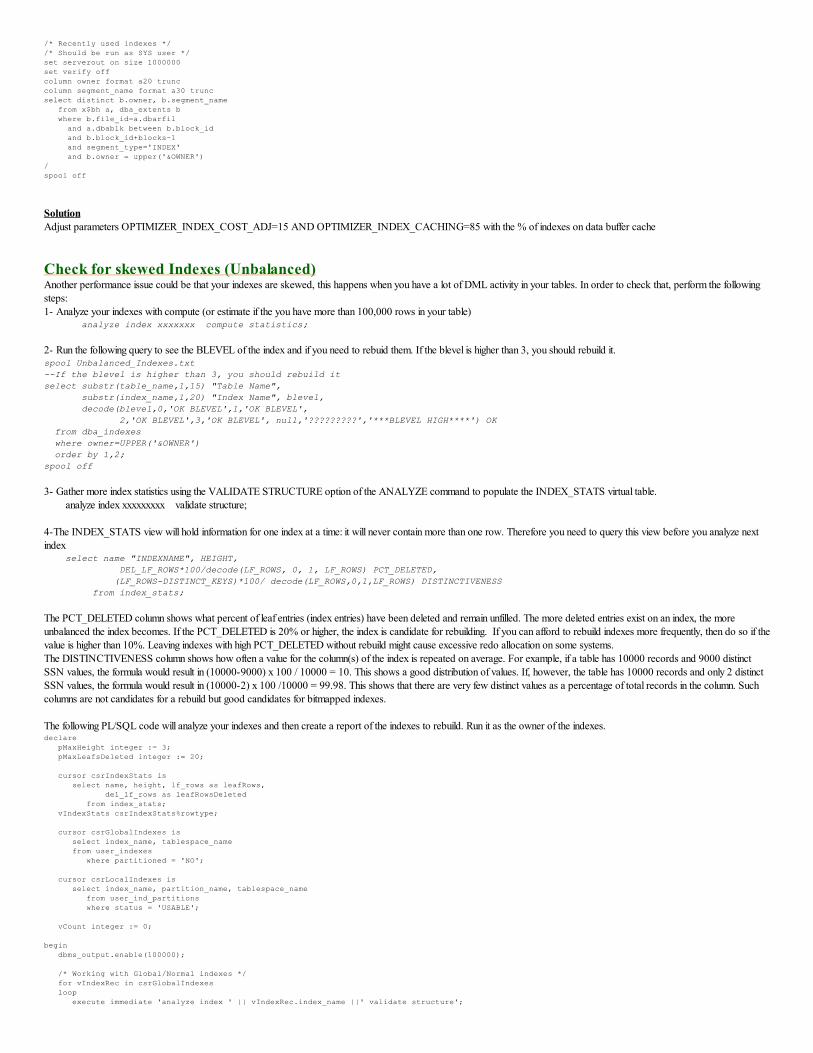
Check for skewed Indexes (Unbalanced)Another performance issue could be that your indexes are skewed, this happens when you have a lot of DML activity in your tables. In order to check that, perform the followingsteps:1- Analyze your indexes with compute (or estimate if the you have more than 100,000 rows in your table) analyze index xxxxxxx compute statistics;
2- Run the following query to see the BLEVEL of the index and if you need to rebuid them. If the blevel is higher than 3, you should rebuild it.spool Unbalanced_Indexes.txt
--If the blevel is higher than 3, you should rebuild it
select substr(table_name,1,15) "Table Name",
substr(index_name,1,20) "Index Name", blevel,
decode(blevel,0,'OK BLEVEL',1,'OK BLEVEL',
2,'OK BLEVEL',3,'OK BLEVEL', null,'?????????','***BLEVEL HIGH****') OK
from dba_indexes
where owner=UPPER('&OWNER')
order by 1,2;
spool off
3- Gather more index statistics using the VALIDATE STRUCTURE option of the ANALYZE command to populate the INDEX_STATS virtual table. analyze index xxxxxxxxx validate structure;
4-The INDEX_STATS view will hold information for one index at a time: it will never contain more than one row. Therefore you need to query this view before you analyze nextindex select name "INDEXNAME", HEIGHT,
The PCT_DELETED column shows what percent of leaf entries (index entries) have been deleted and remain unfilled. The more deleted entries exist on an index, the moreunbalanced the index becomes. If the PCT_DELETED is 20% or higher, the index is candidate for rebuilding. If you can afford to rebuild indexes more frequently, then do so if thevalue is higher than 10%. Leaving indexes with high PCT_DELETED without rebuild might cause excessive redo allocation on some systems. The DISTINCTIVENESS column shows how often a value for the column(s) of the index is repeated on average. For example, if a table has 10000 records and 9000 distinct SSN values, the formula would result in (10000-9000) x 100 / 10000 = 10. This shows a good distribution of values. If, however, the table has 10000 records and only 2 distinctSSN values, the formula would result in (10000-2) x 100 /10000 = 99.98. This shows that there are very few distinct values as a percentage of total records in the column. Suchcolumns are not candidates for a rebuild but good candidates for bitmapped indexes.
The following PL/SQL code will analyze your indexes and then create a report of the indexes to rebuild. Run it as the owner of the indexes.declare
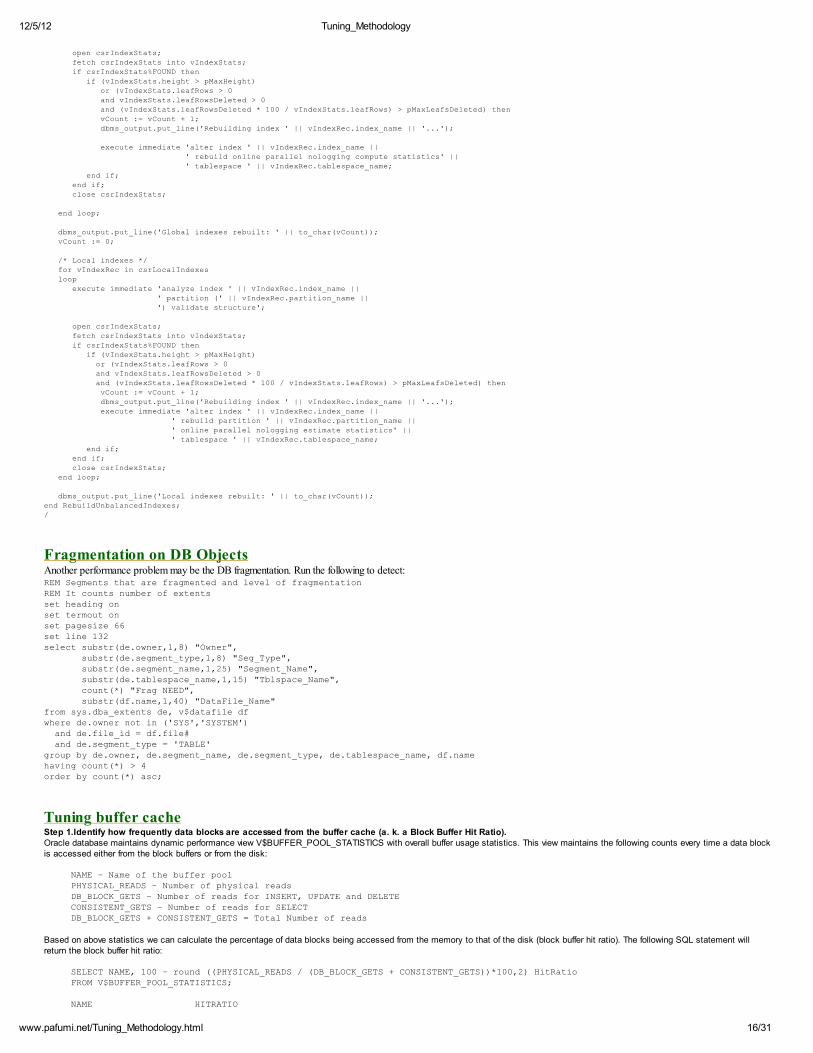
Fragmentation on DB ObjectsAnother performance problem may be the DB fragmentation. Run the following to detect:REM Segments that are fragmented and level of fragmentation REM It counts number of extentsset heading on set termout on set pagesize 66 set line 132 select substr(de.owner,1,8) "Owner", substr(de.segment_type,1,8) "Seg_Type", substr(de.segment_name,1,25) "Segment_Name", substr(de.tablespace_name,1,15) "Tblspace_Name", count(*) "Frag NEED", substr(df.name,1,40) "DataFile_Name" from sys.dba_extents de, v$datafile df where de.owner not in ('SYS','SYSTEM') and de.file_id = df.file# and de.segment_type = 'TABLE' group by de.owner, de.segment_name, de.segment_type, de.tablespace_name, df.name having count(*) > 4 order by count(*) asc;
Tuning buffer cacheStep 1.Identify how frequently data blocks are accessed from the buffer cache (a. k. a Block Buffer Hit Ratio).Oracle database maintains dynamic performance view V$BUFFER_POOL_STATISTICS with overall buffer usage statistics. This view maintains the following counts every time a data blockis accessed either from the block buffers or from the disk:
NAME – Name of the buffer poolPHYSICAL_READS – Number of physical readsDB_BLOCK_GETS – Number of reads for INSERT, UPDATE and DELETECONSISTENT_GETS – Number of reads for SELECT DB_BLOCK_GETS + CONSISTENT_GETS = Total Number of reads
Based on above statistics we can calculate the percentage of data blocks being accessed from the memory to that of the disk (block buffer hit ratio). The following SQL statement willreturn the block buffer hit ratio:
Before measuring the database buffer hit ratio, it is very important to check that the database is running in a steady state with normal workload and no unusual activity has taken place. Forexample, when you run a SQL statement just after database startup, no data blocks have been cached in the block buffers. At this point, Oracle reads the data blocks from the disk andwill cache the blocks in the memory. If you run the same SQL statement again, then most likely the data blocks will still be present in the cache, and Oracle will not have to perform diskIO. If you run the same SQL statement multiple times you will get a higher buffer hit ratio. On the other hand, if you either run SQL statements that rarely query the same data, or run aselect on a very large table, the data block may not be in the buffer cache and Oracle will have to perform disk IO, thereby lowering the buffer hit ratio.
A hit ratio of 95% or greater is considered to be a good hit ratio for OLTP systems. The hit ratio for DSS (Decision Support System) may vary depending on the database load. A lower hitratio means Oracle is performing more disk IO on the server. In such a situation, you can increase the size of database block buffers to increase the database performance. You may haveto increase the physical memory on the server if the server starts swapping after increasing block buffers.
Step 2: Identify frequently used and rarely used data blocks. Cache frequently used blocks and discard rarely used blocks.
If you have a low buffer hit ratio and you cannot increase the size of the database block buffers, you can still gain some performance advantage by tuning the block buffers and efficientlycaching the data block that will provide maximum benefits. Ideally, we should cache data blocks that are either frequently used in SQL statements, or data blocks used by performancesensitive SQL statements (A SQL statement whose performance is critical to the system performance). An ad-hoc query that scans a large table can significantly degrade overall databaseperformance. A SQL on a large table may flush out frequently used data blocks from the buffer cache to store data blocks from the large table. During the peak time, ad-hoc queries thatselect data from large tables or from tables that are rarely used should be avoided. If we cannot avoid such queries, we can limit the impact on the buffer cache by using RECYCLE bufferpool.
A DBA can create multiple buffer pools in the SGA to store data blocks efficiently. For example, we can use RECYCLE pool to cache data blocks that are rarely used in the application.Typically, this will be a small area in the SGA to store data blocks for current SQL statement / transaction that we do not intend to hold in the memory after the transaction is completed.Similarly, we can use KEEP pool to cache data blocks that are frequently used by the application. Typically, this will be big enough to store data blocks that we want to always keep inmemory. By storing data blocks in KEEP and RECYCLE pools you can store frequently used data blocks separately from the rarely used data blocks, and control which data blocks areflushed from the buffer cache. Using RECYCLE pool, we can also prevent a large table scan from flushing frequently used data blocks. You can create the RECYCLE and KEEP pools byspecifying the following init.ora parameters:
DB_KEEP_CACHE_SIZE = <size of KEEP pool>DB_RECYCLE_CACHE_SIZE = < size of RECYCLE pool>
When you use the above parameters, the total memory allocated to the block buffers is the sum of DB_KEEP_CACHE_SIZE, DB_RECYCLE_CACHE_SIZE, and DB_CACHE_SIZE.
Step 3: Assign tables to KEEP / RECYCLE pool. Identify buffer hit ratio for KEEP, RECYCLE, and DEFAULT pool. Adjust the initialization parameters for optimumperformance.
By default, data blocks are cached in the DEFAULT pool. The DBA must configure the table to use the KEEP or the RECYCLE pool by specifying BUFFER_POOL keyword in theCREATE TABLE or the ALTER TABLE statement. For example, you can assign a table to the recycle pool by using the following ALTER TABLE SQL statement.
ALTER TABLE <TABLE NAME> STORAGE (BUFFER_POOL RECYCLE)
The DBA can take help from application designers in identifying tables that should use KEEP or RECYCLE pool. You can also query X$BH to examine the current block buffer usage bydatabase objects (You must log in as SYS to query X$BH).
spool tables_to_RECYCLE_Pool.txt
--The following query returns a list of tables that are rarely used and can be assigned to the RECYCLE pool. Col owner format a14Col object_name format a36Col object_type format a15SELECT o.owner, object_name, object_type, COUNT(1) buffers FROM SYS.x$bh, dba_objects o WHERE (tch = 1 OR (tch = 0 AND lru_flag < 8)) AND obj = o. object_id AND o.owner upper('&OWNER') GROUP BY o.owner, object_name, object_type ORDER BY buffers;spool off
spool tables_to_KEEP_Pool.txt--The following query will return a list of tables that are frequently -- used by SQL statements and can be assigned to the KEEP pool. Col owner format a14Col object_name format a36Col object_type format a15SELECT o.owner, object_name, object_type, COUNT(1) buffers FROM SYS.x$bh, dba_objects o WHERE tch > 10 AND lru_flag = 8 AND obj = o.object_id AND o.owner = upper('&OWNER') GROUP BY o.owner, object_name, object_type ORDER BY buffers;spool off
Once you have setup the database to use KEEP and RECYCLE pools, you can monitor the buffer hit ratio by querying V$BUFFER_POOL_STATISTICS and V$DB_CACHE_ADVICE toadjust the buffer pool initialization parameters.
Step 4: Identify the amount of memory needed to maintain required performance.
Oracle 9i maintains block buffer advisory information in V$DB_CACHE_ADVICE. This view contains simulated physical reads for a range of buffer cache sizes. The DBA can query thisview to estimate buffer cache requirement for the database. The cache advisory can be activated by setting DB_CACHE_ADIVE initialization parameter.
DB_CACHE_ADVICE = ON
There is a minor overhead associated with cache advisory collection. Hence, it is not advisable to collect these statistics in production databases until there is a need to tune the buffer
12/5/12 Tuning_Methodology
18/31www.pafumi.net/Tuning_Methodology.html
cache. The DBA can turn on DB_CACHE_ADVISE dynamically for the duration of sample workload period and collect advisory statistics.
Conclusion
Using this methodical approach, a DBA can easily identify the problem areas, and tune the database block buffers. The DBA can create the following buffer pool to efficiently cache datablocks in SGA:
1. KEEP: Cache tables that are very critical for system performance. Typically, lookup tables are very good candidates for the KEEP pool. The DBA should create the KEEP poollarge enough to maintain 99% buffer hit ratio on this pool.
2. RECYCLE: Cache tables that are not critical for system performance. Typically, a table containing historical information that is either rarely queried or used by batch process is a
good candidate for the RECYCLE pool. The DBA should create the RECYCLE pool large enough to finish the current transaction.
3. DEFAULT: Cache tables that do not belong to either KEEP or RECYCLE pool.
The DBA can setup OEM jobs, Oracle statspack, or custom monitoring scripts to monitor your production database block buffer efficiency, and to identify and tune the problem area.
Check Size of LOG_BUFFERBigger is better and reduces I/O
Check ML 147471.1 item 4. Check for contention on 'redo allocation latch', 'redo copy latch'. Using that query check if 'redo log space request' not near 0, process had to wait for space in the buffer If you get 'redo allocation latch', then increase LOG_PARALLELISMIf you get 'redo copy latch', then increase _LOGSIMULTANEOUS_COPIES (default is 2 times # of CPU)
Check Size of SHARED_POOL_SIZE VariableUsually we want this variable to be around 250-300MB.Using the v_$SGASTAT, check if you see a large value under "shared pool free memory", if so, reduce it. You don't want to have a big space with lot of SQL Staments that are
not re-used. If you have that, then Oracle is going to take too long to find those statements in memory.
Allocate Files properly (Tuning buffer busy waits by file)Check for Buffer busy Waits.This view (based on X$KCBWAIT) reports the number of times an instance has had buffer busy waits on different classes of blocks since the instance was started. Oracle also provides a companion view called X$KCBFWAIT which duplicates the function of X$KCBWAIT, but summarises the waits by file id.
SPOOL file_wait.txt
SET linesize 180
SET pagesize 9000
COLUMN filename FORMAT a40 HEAD "File Name"
COLUMN file# FORMAT 99 HEAD "F#"
COLUMN ct FORMAT 999,999,999 HEAD "Waits"
COLUMN time FORMAT 999,999,999 HEAD "Time"
COLUMN avg FORMAT 999.999 HEAD "Avg Time"
SELECT indx+1 file#
, b.name filename
, count ct
, time
, time/(DECODE(count,0,1,count)) avg
FROM x$kcbfwait a, v$datafile b
WHERE indx < (select count(*) from v$datafile)
AND a.indx+1 = b.file#
order by ct desc
/
spool off
Checking ACTIVE Statementsspool Active_Statements.txtset linesize 110--Extracting the active SQL a user is executing select sesion.sid,
substr(sesion.username,1,15) username,
substr(optimizer_mode,1,10) opt_mode,
hash_value,
address,
cpu_time,
elapsed_time,
sql_text
from v$sqlarea sqlarea, v$session sesion
where sesion.sql_hash_value = sqlarea.hash_value
and sesion.sql_address = sqlarea.address
and sesion.username is not null;
--I/O being done by an active SQL statement select sess_io.sid,
sess_io.block_gets,
sess_io.consistent_gets,
sess_io.physical_reads,
12/5/12 Tuning_Methodology
19/31www.pafumi.net/Tuning_Methodology.html
sess_io.block_changes,
sess_io.consistent_changes
from v$sess_io sess_io, v$session sesion
where sesion.sid = sess_io.sid
and sesion.username is not null;
-- If by chance the query shown earlier in the V$SQLAREA view did not show your full SQL text -- because it was larger than 1000 characters, this V$SQLTEXT view should be queried -- to extract the full SQL. It is a piece by piece of 64 characters by line, -- that needs to be ordered by the column PIECE. -- SQL to show the full SQL executing for active sessions select sesion.sid,
sql_text
from v$sqltext sqltext, v$session sesion
where sesion.sql_hash_value = sqltext.hash_value
and sesion.sql_address = sqltext.address
and sesion.username is not null
order by sqltext.piece;
spool off
Use IPC for local connectionsWhen a process is on the same machine as the server, use the IPC protocol for connectivity instead of TCP. Inner Process Communication on the same machine does not have theoverhead of packet building and deciphering that TCP has. I've seen a SQL job that runs in 10 minutes using TCP on a local machine run as fast as one minute using an IPCconnection. You can set up your tnsnames file like this on a local machine so that local connection with use IPC connections first and then TCP connection second. PROD = (DESCRIPTION = (ADDRESS_LIST =
Check undo parametersWhen you are working with UNDO, there are two important things to consider: The size of the UNDO tablespace The UNDO_RETENTION parameter.To get information of your current settings you can use the following query:set serveroutput onDECLARE tsn VARCHAR2(40); tss NUMBER(10); aex BOOLEAN; unr NUMBER(5); rgt BOOLEAN; retval BOOLEAN;BEGIN retval := dbms_undo_adv.undo_info(tsn, tss, aex, unr, rgt); dbms_output.put_line('UNDO Tablespace is: ' || tsn); dbms_output.put_line('UNDO Tablespace size is: ' || TO_CHAR(tss));
IF aex THEN dbms_output.put_line('Undo Autoextend is set to: TRUE'); ELSE dbms_output.put_line('Undo Autoextend is set to: FALSE'); END IF;
dbms_output.put_line('Undo Retention is: ' || TO_CHAR(unr));
IF rgt THEN dbms_output.put_line('Undo Guarantee is set to: TRUE'); ELSE dbms_output.put_line('Undo Guarantee is set to: FALSE'); END IF;END;/
There are two ways to proceed to optimize your resources.
You can choose to allocate a specific size for the UNDO tablespace and then set the UNDO_RETENTION parameter to an optimal value according to the UNDO size and thedatabase activity. If your disk space is limited and you do not want to allocate more space than necessary to the UNDO tablespace, this is the way to proceed. If you are not limited by disk space, then it would be better to choose the UNDO_RETENTION time that is best for you (for FLASHBACK, etc.). Allocate the appropriate sizeto the UNDO tablespace according to the database activity. This tip help you get the information you need whatever the method you choose.spool Check_Undo_Parameters.txt
select 'Number of "ORA-01555 (Snapshot too old)" encountered since the last startup of the instance : ' || sum(ssolderrcnt)
from v$undostat;
spool off
Detect High SQL parse callsOne of the first things that an Oracle DBA does when checking the performance of any database is to check for high-use SQL statements. The script below will display all SQLwhere the number of parse calls is more than twice the number of SQL executions. The output from this script is a good starting point for detailed SQL tuning. This query can alsobe modified to display the most frequently executed SQL statements that reside in the library cache. prompt ********************************************************** prompt SQL High parse calls prompt ********************************************************** select sql_text, parse_calls, executions from v$sqlarea where parse_calls > 300 and executions < 2*parse_calls and executions > 1;
This script is great for finding non-reusable SQL statements that contain embedded literals. As you may know, non-reusable SQL statements place a heavy burden on the Oraclelibrary cache. When cursor_sharing=FORCE, Oracle8i will re-write the SQL with literal values so it can use a host variable instead. This is a great “silver bullet” for system wherethe literal SQL cannot be changed.
Monitor Open and Cached CursorsOpen cursors take up space in the shared pool, in the library cache. To keep a renegade session from filling up the library cache, or clogging the CPU with millions of parserequests, we set the parameter OPEN_CURSORS. OPEN_CURSORS sets the maximum number of cursors each session can have open, per session. For example, if OPEN_CURSORS is set to 1000, then each session can haveup to 1000 cursors open at one time. If a single session has OPEN_CURSORS # of cursors open, it will get an ora-1000 error when it tries to open one more cursor.The default is value for OPEN_CURSORS is 50, but Oracle recommends that you set this to at least 500 for most applications. Some applications may need more, eg. webapplications that have dozens to hundreds of users sharing a pool of sessions. Tom Kyte recommends setting it around 1000.
If SESSION_CACHED_CURSORS is not set, it defaults to 0 and no cursors will be cached for your session. (Your cursors will still be cached in the shared pool, but yoursession will have to find them there.) If it is set, then when a parse request is issued, Oracle checks the library cache to see whether more than 3 parse requests have been issued forthat statement. If so, Oracle moves the session cursor associated with that statement into the session cursor cache. Subsequent parse requests for that statement by the same sessionare then filled from the session cursor cache, thus avoiding even a soft parse. (Technically, a parse can't be completely avoided; a "softer" soft parse is done that's faster and
requires less CPU.)
The obvious advantage to caching cursors by session is reduced parse times, which leads to faster overall execution times. This is especially so for applications like Oracle Forms
applications, where switching from one form to another will close all the session cursors opened for the first form. Switching back then opens identical cursors. So caching cursorsby session really cuts down on reparsing.There's another advantage, though. Since a session doesn't have to go looking in the library cache for previously parsed SQL, caching cursors by session results in less use of thelibrary cache and shared pool latches. These are often points of contention for busy OLTP systems. Cutting down on latch use cuts down on latch waits, providing not only anincrease in speed but an increase in scalability.
12/5/12 Tuning_Methodology
21/31www.pafumi.net/Tuning_Methodology.html
This will give the number of currently opened cursors, by session:--total cursors open, by sessionselect a.value, s.username, s.sid, s.serial# from v$sesstat a, v$statname b, v$session s where a.statistic# = b.statistic# and s.sid=a.sid and b.name = 'opened cursors current';
If you're running several N-tiered applications with multiple webservers, you may find it useful to monitor open cursors by username and machine:--total cursors open, by username & machineselect sum(a.value) total_cur, avg(a.value) avg_cur, max(a.value) max_cur, s.username, s.machine from v$sesstat a, v$statname b, v$session s where a.statistic# = b.statistic# and s.sid=a.sid and b.name = 'opened cursors current' group by s.username, s.machine order by 1 desc;
The best advice for tuning OPEN_CURSORS is not to tune it. Set it high enough that you won't have to worry about it. If your sessions are running close to the limit you've set forOPEN_CURSORS, raise it. If you set OPEN_CURSORS to a high value, this doesn't mean that every session will have that number of cursors open. Cursors are opened on anas-needed basis
To see if you've set OPEN_CURSORS high enough, monitor v$sesstat for the maximum opened cursors current. If your sessions are running close to the limit, up the value ofOPEN_CURSORS.select max(a.value) as highest_open_cur, p.value as max_open_cur from v$sesstat a, v$statname b, v$parameter p where a.statistic# = b.statistic# and b.name = 'opened cursors current' and p.name= 'open_cursors' group by p.value;HIGHEST_OPEN_CUR MAX_OPEN_CUR---------------- ------------ 1953 2500
Monitoring the session cursor cachev$sesstat also provides a statistic to monitor the number of cursors each session has in its session cursor cache.
--session cached cursors, by sessionselect a.value, s.username, s.sid, s.serial#from v$sesstat a, v$statname b, v$session swhere a.statistic# = b.statistic# and s.sid=a.sidand b.name = 'session cursor cache count' ;
You can also see directly what is in the session cursor cache by querying v$open_cursor. v$open_cursor lists session cached cursors by SID, and includes the first few charactersof the statement and the sql_id, so you can actually tell what the cursors are for.
Tuning SESSION_CACHED_CURSORSIf you choose to use SESSION_CACHED_CURSORS to help out an application that is continually closing and reopening cursors, you can monitor its effectiveness via two morestatistics in v$sesstat. The statistic "session cursor cache hits" reflects the number of times that a statement the session sent for parsing was found in the session cursor cache,meaning it didn't have to be reparsed and your session didn't have to search through the library cache for it. You can compare this to the statistic "parse count (total)"; subtract
"session cursor cache hits" from "parse count (total)" to see the number of parses that actually occurred.
select cach.value cache_hits, prs.value all_parses, prs.value-cach.value sess_cur_cache_not_used from v$sesstat cach, v$sesstat prs, v$statname nm1, v$statname nm2 where cach.statistic# = nm1.statistic# and nm1.name = 'session cursor cache hits' and prs.statistic#=nm2.statistic# and nm2.name= 'parse count (total)' and cach.sid= &sid and prs.sid= cach.sid ;
Enter value for sid: 947old 8: and cach.sid= &sid and prs.sid= cach.sidnew 8: and cach.sid= 947 and prs.sid= cach.sid
Monitor this in concurrence with the session cursor cache count.
--session cached cursors, for a given SID, compared to maxselect a.value curr_cached, p.value max_cached, s.username, s.sid, s.serial# from v$sesstat a, v$statname b, v$session s, v$parameter2 p where a.statistic# = b.statistic# and s.sid=a.sid and a.sid=&sid and p.name='session_cached_cursors' and b.name = 'session cursor cache count' ;
12/5/12 Tuning_Methodology
22/31www.pafumi.net/Tuning_Methodology.html
Detect Top 10 Queries in SQL Area
spool top10_sqlarea.txt
/*This script queries the SQL area ordered by the the average cost of the statement. The "Avg Cost" row is basically the No. of Buffer Gets per Rows processed. Where no rows are processed, all Buffer Gets are reported for the statement. The script also lists any potential candidates for a converting to stored procedures by running a case insensitive query.*/set pagesize 66 linesize 132
set echo off
column executions heading "Execs" format 99999999
column rows_processed heading "Rows Procd" format 99999999
column loads heading "Loads" format 999999.99
column buffer_gets heading "Buffer Gets"
column disk_reads heading "Disk Reads"
column elapsed_time heading "Elasped Time"
column cpu_time heading "CPU Time"
column sql_text heading "SQL Text" format a120 wrap
column avg_cost heading "Avg Cost" format 99999999
column gets_per_exec heading "Gets Per Exec" format 99999999
column reads_per_exec heading "Read Per Exec" format 99999999
column rows_per_exec heading "Rows Per Exec" format 99999999
break on report
compute sum of rows_processed on report
compute sum of executions on report
compute avg of avg_cost on report
compute avg of gets_per_exec on report
compute avg of reads_per_exec on report
compute avg of row_per_exec on report
PROMPT
PROMPT Top 10 most expensive SQL by Elapsed Time...
PROMPT
select rownum as rank, a.*
from ( select elapsed_Time, executions, buffer_gets, disk_reads, cpu_time, hash_value, sql_text
from v$sqlarea
where elapsed_time > 20000
order by elapsed_time desc) a
where rownum < 11;
PROMPT
PROMPT Top 10 most expensive SQL by CPU Time...
PROMPT
select rownum as rank, a.*
from ( select elapsed_Time, executions, buffer_gets, disk_reads, cpu_time, hash_value, sql_text
from v$sqlarea
where cpu_time > 20000
order by cpu_time desc) a
where rownum < 11;
PROMPT
PROMPT Top 10 most expensive SQL by Buffer Gets by Executions...
where decode(rows_processed,0,1,1) * buffer_gets/ decode(rows_processed,0,1,rows_processed) > 10000
order by 5 desc) a
where rownum < 11;
rem Check to see if there are any candidates for procedures or
rem for using bind variables. Check this by comparing UPPER
rem
rem This May be a candidate application for using the init.ora parameter
rem CURSOR_SHARING = FORCE|SIMILAR
select rownum as rank, a.*
from (select upper(substr(sql_text, 1, 65)) sqltext, count(*)
from v$sqlarea
group by upper(substr(sql_text, 1, 65))
having count(*) > 1
order by count(*) desc) a
where rownum < 11;
prompt Output spooled to top10_sqlarea.txt
spool off
If you want to see the full text of the sql statement, you can run the following query:select v2.sql_text, v2.addressfrom v$sqlarea v1, v$sqltext v2where v1.address=v2.addressand v1.sql_text like 'SELECT COUNT(*) FROM DEPT%'order by v2.address, v2.piece;
The next query returns the SQL text from a hash value that must be determined from each v$sqlarea row in question.select sql_textfrom v$sqltextwhere hash_value=&hash_valueorder by piece;
Check for Indexes not Used and HOT TablesIf you want to know if an index has ever been used since instance startup, or the use of a specific table, the solution is quite easy.
Simply query V$SEGMENT_STATISTICS to see if there has even been a physical read on the index in question. Queries similar to the following can help:select index_name from all_indexes where owner = 'FRAUDGUARD' and index_name not in ( select object_name from v$segment_statistics where owner='FRAUDGUARD' and statistic_name='physical reads');
If you get no rows, that means that all your indexes has been used.
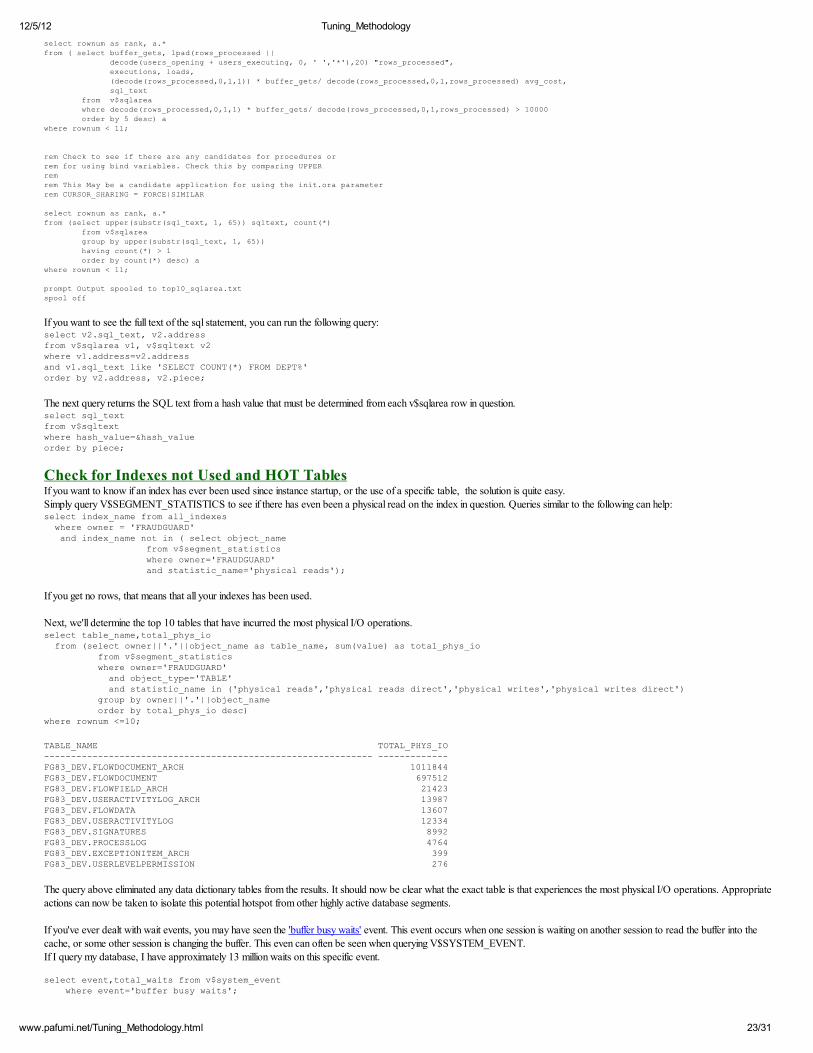
Next, we'll determine the top 10 tables that have incurred the most physical I/O operations. select table_name,total_phys_io from (select owner||'.'||object_name as table_name, sum(value) as total_phys_io from v$segment_statistics where owner='FRAUDGUARD' and object_type='TABLE' and statistic_name in ('physical reads','physical reads direct','physical writes','physical writes direct') group by owner||'.'||object_name order by total_phys_io desc)where rownum <=10;
The query above eliminated any data dictionary tables from the results. It should now be clear what the exact table is that experiences the most physical I/O operations. Appropriate
actions can now be taken to isolate this potential hotspot from other highly active database segments.
If you've ever dealt with wait events, you may have seen the 'buffer busy waits' event. This event occurs when one session is waiting on another session to read the buffer into thecache, or some other session is changing the buffer. This even can often be seen when querying V$SYSTEM_EVENT.
If I query my database, I have approximately 13 million waits on this specific event.
select event,total_waits from v$system_event where event='buffer busy waits';
The big question is to determine which segments are contributing to this overall wait event. Querying V$SEGMENT_STATISTICS can help us determine the answer.
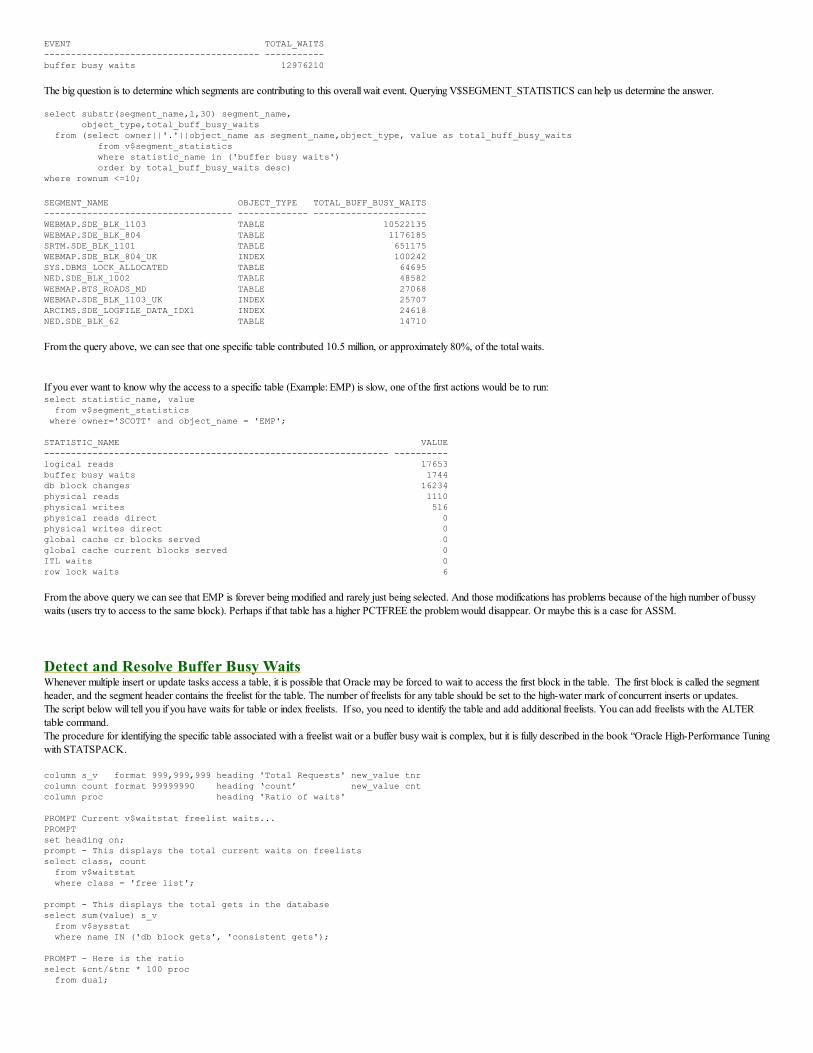
select substr(segment_name,1,30) segment_name, object_type,total_buff_busy_waits from (select owner||'.'||object_name as segment_name,object_type, value as total_buff_busy_waits from v$segment_statistics where statistic_name in ('buffer busy waits') order by total_buff_busy_waits desc)where rownum <=10;
SEGMENT_NAME OBJECT_TYPE TOTAL_BUFF_BUSY_WAITS----------------------------------- ------------- ---------------------WEBMAP.SDE_BLK_1103 TABLE 10522135WEBMAP.SDE_BLK_804 TABLE 1176185SRTM.SDE_BLK_1101 TABLE 651175WEBMAP.SDE_BLK_804_UK INDEX 100242SYS.DBMS_LOCK_ALLOCATED TABLE 64695NED.SDE_BLK_1002 TABLE 48582WEBMAP.BTS_ROADS_MD TABLE 27068WEBMAP.SDE_BLK_1103_UK INDEX 25707ARCIMS.SDE_LOGFILE_DATA_IDX1 INDEX 24618NED.SDE_BLK_62 TABLE 14710
From the query above, we can see that one specific table contributed 10.5 million, or approximately 80%, of the total waits.
If you ever want to know why the access to a specific table (Example: EMP) is slow, one of the first actions would be to run:select statistic_name, value from v$segment_statistics where owner='SCOTT' and object_name = 'EMP';
STATISTIC_NAME VALUE---------------------------------------------------------------- ----------logical reads 17653buffer busy waits 1744db block changes 16234physical reads 1110physical writes 516physical reads direct 0physical writes direct 0global cache cr blocks served 0global cache current blocks served 0ITL waits 0row lock waits 6
From the above query we can see that EMP is forever being modified and rarely just being selected. And those modifications has problems because of the high number of bussywaits (users try to access to the same block). Perhaps if that table has a higher PCTFREE the problem would disappear. Or maybe this is a case for ASSM.
Detect and Resolve Buffer Busy WaitsWhenever multiple insert or update tasks access a table, it is possible that Oracle may be forced to wait to access the first block in the table. The first block is called the segment
header, and the segment header contains the freelist for the table. The number of freelists for any table should be set to the high-water mark of concurrent inserts or updates.
The script below will tell you if you have waits for table or index freelists. If so, you need to identify the table and add additional freelists. You can add freelists with the ALTERtable command.
The procedure for identifying the specific table associated with a freelist wait or a buffer busy wait is complex, but it is fully described in the book “Oracle High-Performance Tuningwith STATSPACK.
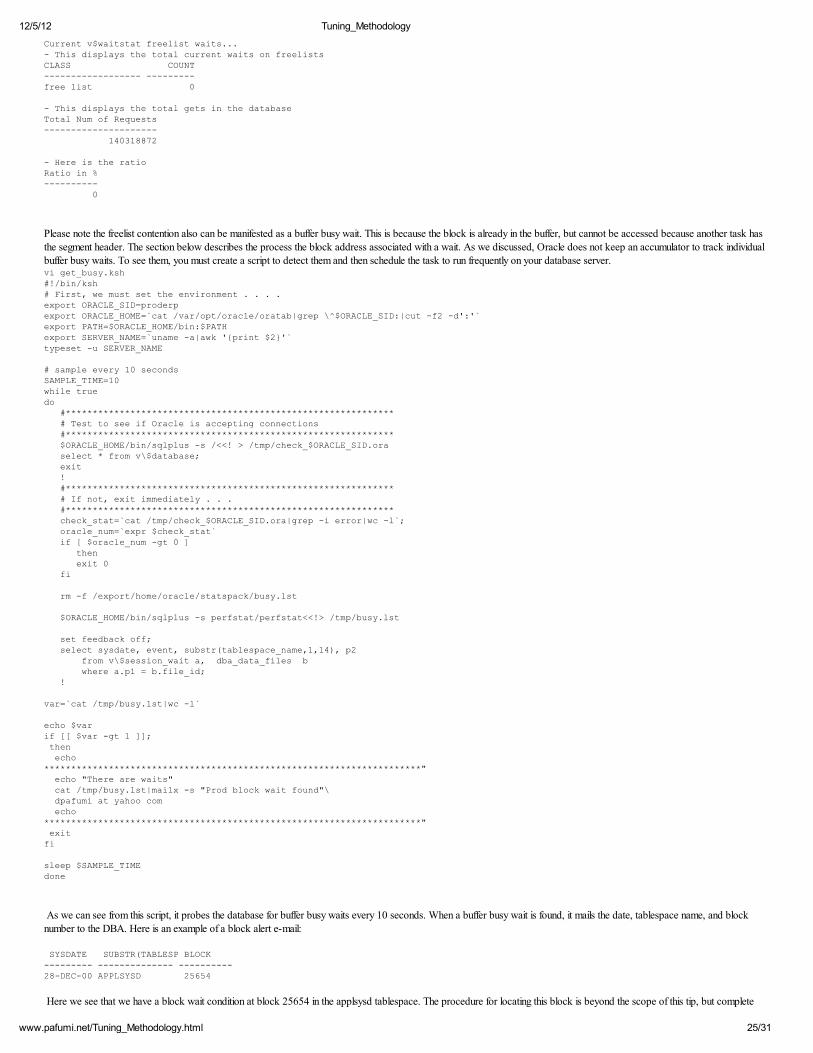
column s_v format 999,999,999 heading 'Total Requests' new_value tnrcolumn count format 99999990 heading ‘count’ new_value cntcolumn proc heading 'Ratio of waits' PROMPT Current v$waitstat freelist waits...PROMPT set heading on;prompt - This displays the total current waits on freelistsselect class, count from v$waitstat where class = 'free list'; prompt - This displays the total gets in the databaseselect sum(value) s_v from v$sysstat where name IN ('db block gets', 'consistent gets'); PROMPT - Here is the ratioselect &cnt/&tnr * 100 proc from dual;
12/5/12 Tuning_Methodology
25/31www.pafumi.net/Tuning_Methodology.html
Current v$waitstat freelist waits...- This displays the total current waits on freelistsCLASS COUNT------------------ ---------free list 0
- This displays the total gets in the databaseTotal Num of Requests--------------------- 140318872
- Here is the ratioRatio in %---------- 0
Please note the freelist contention also can be manifested as a buffer busy wait. This is because the block is already in the buffer, but cannot be accessed because another task hasthe segment header. The section below describes the process the block address associated with a wait. As we discussed, Oracle does not keep an accumulator to track individual
buffer busy waits. To see them, you must create a script to detect them and then schedule the task to run frequently on your database server.vi get_busy.ksh#!/bin/ksh# First, we must set the environment . . . .export ORACLE_SID=proderpexport ORACLE_HOME=̀cat /var/opt/oracle/oratab|grep \̂$ORACLE_SID:|cut -f2 -d':'̀export PATH=$ORACLE_HOME/bin:$PATHexport SERVER_NAME=̀uname -a|awk '{print $2}'̀typeset -u SERVER_NAME
# sample every 10 secondsSAMPLE_TIME=10while truedo #************************************************************* # Test to see if Oracle is accepting connections #************************************************************* $ORACLE_HOME/bin/sqlplus -s /<<! > /tmp/check_$ORACLE_SID.ora select * from v\$database; exit ! #************************************************************* # If not, exit immediately . . . #************************************************************* check_stat=̀cat /tmp/check_$ORACLE_SID.ora|grep -i error|wc -l̀; oracle_num=̀expr $check_stat̀ if [ $oracle_num -gt 0 ] then exit 0 fi
set feedback off; select sysdate, event, substr(tablespace_name,1,14), p2 from v\$session_wait a, dba_data_files b where a.p1 = b.file_id; !
var=̀cat /tmp/busy.lst|wc -l̀
echo $varif [[ $var -gt 1 ]]; then echo **********************************************************************" echo "There are waits" cat /tmp/busy.lst|mailx -s "Prod block wait found"\ dpafumi at yahoo com echo **********************************************************************" exitfi
sleep $SAMPLE_TIMEdone
As we can see from this script, it probes the database for buffer busy waits every 10 seconds. When a buffer busy wait is found, it mails the date, tablespace name, and blocknumber to the DBA. Here is an example of a block alert e-mail:
Here we see that we have a block wait condition at block 25654 in the applsysd tablespace. The procedure for locating this block is beyond the scope of this tip, but complete
12/5/12 Tuning_Methodology
26/31www.pafumi.net/Tuning_Methodology.html
directions are in Chapter 10 of Oracle High Performance Tuning with STATSPACK
One of the most confounding problems with Oracle is the resolution of buffer busy wait events. Buffer busy waits are common in an I/O-bound Oracle system, as evidenced by any
system with read (sequential/scattered) waits in the top-five waits in the Oracle STATSPACK report, like this:
Top 5 Timed Events % Total Event Waits Time (s) Ela Time --------------------------- ------------ ----------- ----------- db file sequential read 2,598 7,146 48.54 db file scattered read 25,519 3,246 22.04 library cache load lock 673 1,363 9.26 CPU time 2,154 934 7.83 log file parallel write 19,157 837 5.68
The main way to reduce buffer busy waits is to reduce the total I/O on the system. This can be done by tuning the SQL to access rows with fewer block reads (i.e., by addingindexes). Even if we have a huge db_cache_size, we may still see buffer busy waits, and increasing the buffer size won't help.
In order to look at system-wide wait events, we can query the v$system_event performance view. This view, shown below, provides the name of the wait event, the total numberof waits and timeouts, the total time waited, and the average wait time per event.
spool Wait_Events.txtselect substr(event,1,25) event, total_waits, total_timeouts, time_waited, average_waitfrom v$system_eventwhere event like '%wait%'order by 2 desc;spool off
The type of buffer that causes the wait can be queried using the v$waitstat view. This view lists the waits per buffer type for buffer busy waits, where COUNT is the sum of all waits
for the class of block, and TIME is the sum of all wait times for that class:
select * from v$waitstat;
CLASS COUNT TIME ------------------ ---------- ---------- data block 1961113 1870278 segment header 34535 159082 undo header 233632 86239
undo block 1886 1706
Buffer busy waits occur when an Oracle session needs to access a block in the buffer cache, but cannot because the buffer copy of the data block is locked. This buffer busy waitcondition can happen for either of the following reasons:
The block is being read into the buffer by another session, so the waiting session must wait for the block read to complete.
Another session has the buffer block locked in a mode that is incompatible with the waiting session's request.
Because buffer busy waits are due to contention between particular blocks, there's nothing you can do until you know which blocks are in conflict and why the conflicts areoccurring. Tuning therefore involves identifying and eliminating the cause of the block contention.
The v$session_wait performance view, shown below, can give some insight into what is being waited for and why the wait is occurring.
SQL> desc v$session_wait Name Null? Type ----------------------------------------- -------- ---------------------
SID NUMBER SEQ# NUMBER EVENT VARCHAR2(64) P1TEXT VARCHAR2(64) P1 NUMBER P1RAW RAW(4)
P2TEXT VARCHAR2(64) P2 NUMBER P2RAW RAW(4) P3TEXT VARCHAR2(64) P3 NUMBER P3RAW RAW(4) WAIT_TIME NUMBER
SECONDS_IN_WAIT NUMBER STATE VARCHAR2(19)
The columns of the v$session_wait view that are of particular interest for a buffer busy wait event are:
P1—The absolute file number for the data file involved in the wait.
P2—The block number within the data file referenced in P1 that is being waited upon. P3—The reason code describing why the wait is occurring.
Here's an Oracle data dictionary query for these values:
If the output from repeatedly running the above query shows that a block or range of blocks is experiencing waits, the following query should show the name and type of the
segment:
select owner, segment_name, segment_type
12/5/12 Tuning_Methodology
28/31www.pafumi.net/Tuning_Methodology.html
from dba_extentswhere file_id = &P1 and &P2 between block_id and block_id + blocks -1;
Once the segment is identified, the v$segment_statistics performance view facilitates real-time monitoring of segment-level statistics. This enables a DBA to identify performanceproblems associated with individual tables or indexes, as shown below.
We can also query the dba_data_files to determine the file_name for the file involved in the wait by using the P1 value from v$session_wait for the file_id.
SQL> desc dba_data_files
Name Null? Type ----------------------------------------- -------- ----------------------------
FILE_NAME VARCHAR2(513) FILE_ID NUMBER TABLESPACE_NAME VARCHAR2(30) BYTES NUMBER BLOCKS NUMBER STATUS VARCHAR2(9) RELATIVE_FNO NUMBER
AUTOEXTENSIBLE VARCHAR2(3) MAXBYTES NUMBER MAXBLOCKS NUMBER INCREMENT_BY NUMBER USER_BYTES NUMBER USER_BLOCKS NUMBER
Interrogating the P3 (reason code) value from v$session_wait for a buffer busy wait event will tell us why the session is waiting. The reason codes range from 0 to 300 and can bedecoded, as shown in Table A.
Table A
Code Reason for wait
- A modification is happening on a SCUR or XCUR buffer but has not yetcompleted.
0 The block is being read into the buffer cache.
100 We want to NEW the block, but the block is currently being read by anothersession (most likely for undo).
110 We want the CURRENT block either shared or exclusive but the block is beingread into cache by another session, so we have to wait until its read() iscompleted.
120 We want to get the block in current mode, but someone else is currently readingit into the cache. Wait for the user to complete the read. This occurs duringbuffer lookup.
130 Block is being read by another session, and no other suitable block image wasfound, so we wait until the read is completed. This may also occur after a buffercache assumed deadlock. The kernel can't get a buffer in a certain amount oftime and assumes a deadlock. Therefore it will read the CR version of the block.
200 We want to NEW the block, but someone else is using the current copy, so wehave to wait for that user to finish.
210 The session wants the block in SCUR or XCUR mode. If this is a bufferexchange or the session is in discrete TX mode, the session waits for the firsttime and the second time escalates the block as a deadlock, so does not showup as waiting very long. In this case, the statistic: "exchange deadlocks" isincremented, and we yield the CPU for the "buffer deadlock" wait event.
220 During buffer lookup for a CURRENT copy of a buffer, we have found the bufferbut someone holds it in an incompatible mode, so we have to wait.
230 Trying to get a buffer in CR/CRX mode, but a modification has started on thebuffer that has not yet been completed.
231 CR/CRX scan found the CURRENT block, but a modification has started on thebuffer that has not yet been completed.
Reason codes
As I mentioned at the beginning of this article, buffer busy waits are prevalent in I/O-bound systems. I/O contention, resulting in waits for data blocks, is often due to numeroussessions repeatedly reading the same blocks, as when many sessions scan the same index. In this scenario, session one scans the blocks in the buffer cache quickly, but then a block
has to be read from disk. While session one awaits the disk read to complete, other sessions scanning the same index soon catch up to session one and want the same block
12/5/12 Tuning_Methodology
29/31www.pafumi.net/Tuning_Methodology.html
currently being read from disk. This is where the buffer busy wait occurs—waiting for the buffer blocks that are being read from disk. The following rules of thumb may be useful forresolving each of the noted contention situations:
Data block contention—Identify and eliminate HOT blocks from the application via changing PCTFREE and or PCTUSED values to reduce the number of rows per data
block. Check for repeatedly scanned indexes. Since each transaction updating a block requires a transaction entry, increase the INITRANS value. Freelist block contention—Increase the FREELISTS value. Also, when using Parallel Server, be certain that each instance has its own FREELIST GROUPs.
Segment header contention—Again, increase the number of FREELISTs and use FREELIST GROUPs, which can make a difference even within a single instance. Undo header contention—Increase the number of rollback segments.
The following STATSPACK script is very useful for detecting those times when the database has a high-level of buffer busy waits. prompt *********************************************************** prompt Buffer Busy Waits may signal a high update table with too prompt few freelists. Find the offending table and add more freelists. prompt *********************************************************** prompt column buffer_busy_wait format 999,999,999 column mydate heading 'yr. mo dy Hr.' select to_char(snap_time,'yyyy-mm-dd HH24') mydate, new.name, new.buffer_busy_wait-old.buffer_busy_wait buffer_busy_wait from perfstat.stats$buffer_pool_statistics old, perfstat.stats$buffer_pool_statistics new, perfstat.stats$snapshot sn where snap_time > sysdate-&1 and new.name <> 'FAKE VIEW' and new.snap_id = sn.snap_id and old.snap_id = sn.snap_id-1 and new.buffer_busy_wait-old.buffer_busy_wait > 1 group by to_char(snap_time,'yyyy-mm-dd HH24'), new.name, new.buffer_busy_wait-old.buffer_busy_wait ;
Show the percentage of a table in the data bufferIn Oracle9i we have a multiple blocks size feature, and separate independent data buffers can be created for all objects in the today, for 2k, 4k, 8k, 16k and 32k blocks sizes.The following script will interrogate to the v$bh view and give us counts all the number of data blocks in the buffer on a segment-by-segment basis. Note that the script also then
joins into the dba_objects view in order to count the number of data blocks in the segment and compare it to the buffer. This script is a multi-step process, and rather than makethe query complex with in-line views or subqueries, the script has been broken down into three separate queries using temporary tables to hold the intermediate results. The
following query is extremely useful for showing the percentage of data blocks for on each table within the data buffer caches.set pages 999set lines 80ttitle 'Contents of Data Buffers'drop table t1; create table t1 asselect o.object_name object_name, o.object_type object_type, count(1) num_blocksfrom dba_objects o, v$bh bhwhere o.object_id = bh.objdand o.owner not in ('SYS','SYSTEM')group by o.object_name, o.object_typeorder by count(1) desc; column c1 heading "Object|Name" format a30column c2 heading "Object|Type" format a12column c3 heading "Number of|Blocks" format 999,999,999,999column c4 heading "Percentage|of object|data blocks|in Buffer" format 999 select object_name c1, object_type c2, num_blocks c3, (num_blocks/decode(sum(blocks), 0, .001, sum(blocks)))*100 c4from t1, dba_segments swhere s.segment_name = t1.object_name and num_blocks > 10group by object_name, object_type, num_blocksorder by num_blocks desc;
drop table t1;
Wed Oct 23 page 1
Contents of Data Buffers
Percentage of object Object Object Number of data blocks Name Type Blocks in Buffer --------------------------- ------- ------------ ----------- MTL_DEMAND_INTERFACE TABLE 38,745 100 FND_CONCURRENT_REQUESTS TABLE 16,636 88 WIP_TRANSACTIONS TABLE 14,777 100 WIP_TRANSACTION_ACCOUNTS TABLE 13,390 33 CRP_RESOURCE_HOURS TABLE 7,806 100 SO_LINES_ALL TABLE 7,576 100 ABC_EDI_LINES TABLE 7,041 100
Testing Procedures or Packages for Performance-- before.sqlset echo offset timing offset recsep offcolumn CPU noprint new_value before_cpucolumn READS noprint new_value before_readsselect s_cpu.value CPU, sum(s_reads.value) READSfrom sys.v_$session se, sys.v_$statname n_cpu, sys.v_$statname n_reads, sys.v_$sesstat s_cpu, sys.v_$sesstat s_readswhere n_reads.name in ('db block gets', 'consistent gets') and n_cpu.name = 'CPU used by this session' and n_cpu.statistic# = s_cpu.statistic# and n_reads.statistic# = s_reads.statistic# and s_cpu.sid = se.sid and s_reads.sid = se.sid and se.audsid = userenv('SESSIONID')group by s_cpu.value/column CPU clearcolumn READS clear
will display nothing but blank lines but will collect values before your PL/SQL runs; immediately after your PL/SQL, run this :
-- after.sqlset echo offset timing offset recsep offcolumn CPU print format 999999column READS print format 9999999999999select s_cpu.value - &&before_cpu - 97 CPU, sum(s_reads.value) - &&before_reads - 10 READSfrom sys.v_$session se, sys.v_$statname n_cpu, sys.v_$statname n_reads, sys.v_$sesstat s_cpu, sys.v_$sesstat s_readswhere n_reads.name in ('db block gets', 'consistent gets') and n_cpu.name = 'CPU used by this session' and n_cpu.statistic# = s_cpu.statistic# and n_reads.statistic# = s_reads.statistic# and s_cpu.sid = se.sid and s_reads.sid = se.sid and se.audsid = userenv('SESSIONID')group by s_cpu.value/column CPU clearcolumn READS clear
Check Sortsspool sorts.txt
--The ratio of sorts (disk) to sorts (memory) should be < 5%.
-- Increase the size of SORT_AREA_SIZE if it is less than 5%.