Page 1
Turbidites in the Upper Carboniferous Ross Formation, Western Ireland
- reconstruction of a sinuous channel and sandy spillover system
TROND LIEN, ROGER G. WALKER* AND OLE J. MARTINSEN
Norsk Hydro Research Centre, 5020 Bergen, Norway (E-mail: [email protected] )
ABSTRACT
The Shannon Group was deposited in the extensional Clare Basin of western Ireland.
The basin is floored by the Carboniferous Limestone, and the basin fill succession
begins with the deep water Clare Shales. These are overlain by various turbidite
facies of the Ross Formation (460 m thick). The Ross is overlain by the muddier Gull
Island Formation, which grades up into shallow marine and continental deposits of the
Central Clare Group. The lower 170 m of the Ross contains tabular turbidites with no
channels. There is an overall tendency to become sandier upward, but there are no
small scale thickening- or thinning-upward successions. The upper 290 m of the Ross
consists of turbidites, commonly arranged in thickening-upward packages, and
amalgamated turbidites that form channel fills up to about 10 m thick. The upper
Ross channels commonly have an initial lateral accretion phase with interbedded
sandstone and mudstone deposits, and a subsequent vertical aggradation phase with
thick-bedded amalgamated turbidites. As the channels filled, more and more turbidites
spilled farther and farther overbank. Superb outcrops show that thickening-upward
packages developed when channels initially spilled mudstones and thin-bedded
turbidites up to 1 km overbank, followed by thick bedded amalgamated turbidites that
spilled close to the channel margins. Channel sinuosity is low, but is indicated by the
lateral accretion deposits and by the paleocurrent directions associated with the
amalgamated channel fills. Stacks of channels and packages may show significant
paleocurrent variability at the same stratigraphic interval at different locations. This
suggest that individual sinuous channels were stacked into channel belts (25 - 40 m
thick), and that the belts also followed sinuous patterns. Reservoir elements of the
*Present address; Roger Walker Consulting Inc., 83 Scimitar View NW, Calgary, Alberta T3L 2B4,
Canada (E-mail: [email protected] )
1
Page 2
Ross system include tabular turbidites, channel fill deposits, thickening-upward
packages that formed as spillover lobes, and on a larger scale, sinuous channel belts.
The belts are about 2.5 to 5 km wide, and contain the sinuous channels flanked by
spillover lobes. The edges of the belts can be defined where well-packaged spillover
deposits pass laterally into muddier, poorly-packaged tubular turbidites. The sinuous
channel belts appear to pass downstream into unchannellized, tabular turbidites (lower
Ross).
Keywords Ross Formation, Ireland, turbidites, turbidite channels, sinuous channel
belts, spillover lobes, turbidite reservoir elements
INTRODUCTION
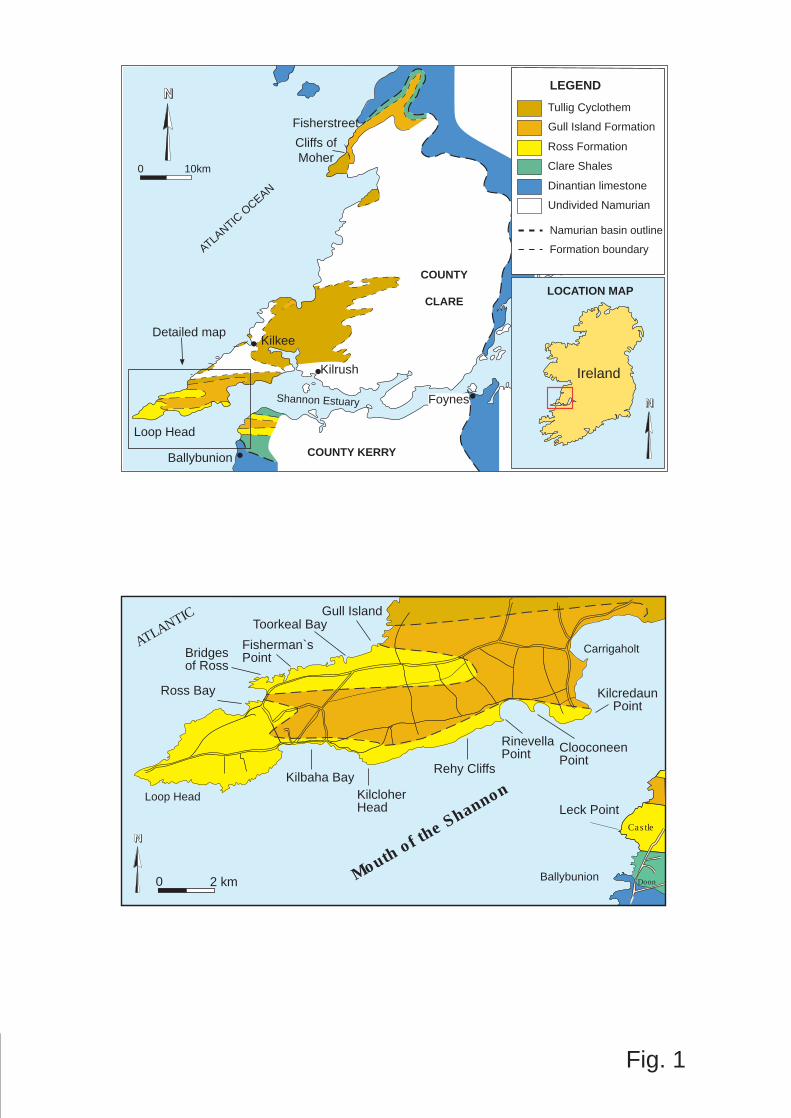
This paper presents new, detailed observations from a much-visited area in County Clare,
Western Ireland (Fig. 1). Here, the Upper Carboniferous (Namurian) turbidites of the Ross
Formation are superbly exposed in sea cliffs around the coast of County Clare, and on the south
side of the Shannon Estuary at Ballybunion (Fig. 1). Continuous, unbroken vertical sections up to
200 m thick can be observed in detail, and in places, beds can be walked laterally for over 1 km.
Both sheet-like and channellized turbidites are present. Channel stacking occurs in several
places, and the transitions from channellized to sheet-like geometries can be observed at channel
margins. Folding makes the soles of the beds easily accessible for paleocurrent measurement,
and our basin model relies extensively on the relationships of paleocurrents to the facies in which
they were measured. The purpose of this paper, therefore, is to integrate these various data into a
reconstruction of the basin at the time of turbidite deposition. Emphasis will be placed on the
geometric forms of the various facies that may be analogous to reservoir elements in the
subsurface, in settings such as offshore mid-Norway and offshore Angola.
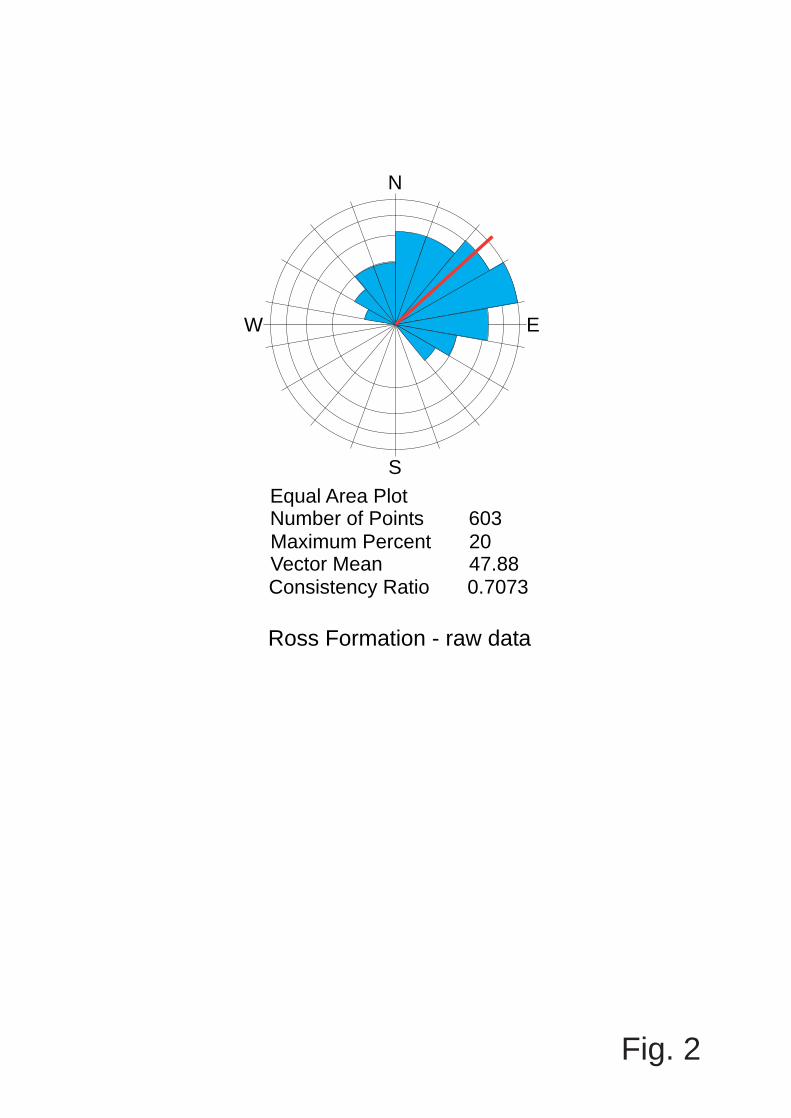
In County Clare, the general dispersal pattern is indicated by paleoflow readings taken
from 603 beds. The grand vector mean of 048o (Fig. 2) is an areally and stratigraphically averaged
direction. All of the local paleoflow directions presented in the paper should be evaluated in the
context of a general northeastward dispersal.
STRATIGRAPHY
The stratigraphy of the Namurian section is shown in Fig. 3. The biostratigraphy is based on
goniatite-bearing marine bands, as determined by Hodson (1954a, b), Hodson and Lewarne
(1961) and Collinson et al. (1991). The lithostratigraphy was proposed by Rider (1974). In the
2
Page 3
Shannon Estuary area, the Shannon Group consists of the Clare Shales (180 m), overlain by the
Ross Formation, estimated in this paper to be about 460 m thick. The overlying Gull Island
Formation is about 550 m thick. Northward (north Clare, Fig. 3), the Clare Shales thin dramatically
to about 10 m, the Ross Formation is condensed into shales, and the Gull Island thins to about
130 m.
This is a basin-filling succession, with the Clare Shales representing monotonous deep
water deposition. The overlying Ross Formation contains sheet-like and channellized turbidites,
and the Gull Island is characterized by slumps and slides, with some turbidites in the lower part.
After the basin filled, five shallow water to non-marine cyclothems developed (Central Clare
Group, Fig. 3).
The base of the Ross Formation is only exposed at Ballybunion, and is taken at the first
sandstone horizon above the monotonous black Clare Shales. This bed occurs just south of the
large waterfall made by Glenachoor Stream as it falls over the cliffs, about 3.3 km north of the
castle in Ballybunion. No single lithological criterion can be used to separate the Ross Formation
and the overlying Gull Island Formations. The Ross Formation is sandier than the Gull Island, and
is dominated by turbidite deposits, with only three main slump/slide horizons. The Gull Island also
contains some turbidites, but is muddier than the Ross and is dominated by slump/slide horizons.
For practical reasons, therefore, the top of the Ross Formation is taken at the R. dubium
marine band (Collinson et al., 1991). In the Loop Peninsula (Fig. 1), the R. dubium and R.
paucicrenulatum marine bands occur less than 1 m apart, whereas at Ballybunion they are
separated by up to 70 m of sandstones and mudstones (Fig. 4).
Subdivision of the Ross Formation
In this paper, we informally divide the Ross Formation into lower and upper parts. The lower Ross
is only exposed at Ballybunion. It is about 170 m thick, and is characterized by tabular,
non-channellized turbidites, with only one slumped horizon near the base. There is no
well-developed packaging of the turbidites into thickening-upward successions. The contact with
the upper Ross is taken at the base of thicker amalgamated beds about 170 m above the base of
the Ross Formation (Fig. 4). The upper Ross occurs around the Loop Peninsula. It is about 290
m thick, and contains sheet-like and channellized turbidites, as well as at least three major
slump/slide horizons. Packaging of the turbidites into thickening-upward successions (average
scale about 2 - 5 m) is common.
PREVIOUS WORK
The biostratigraphy was set up by Hodson (1954a, b) and Hodson and Lewarne (1961) in
the northern Clare area. No data were presented from the Loop Head or Ballybunion areas. The
3
Page 4
first sedimentological work was by Gill and Kuenen (1958) who described the spectacular sand
volcanoes that occur on top of many of the slumped horizons. This work was expanded by Gill in
1979. The present lithostratigraphy (Fig. 3) was set up by Rider (1974), who established the deep
water origin of the Clare Shales and turbidite origin of the Ross Formation. He noted that the
paleocurrents showed a "definitely south-westerly origin" for the turbidity currents.
More detailed work on the Ross and Gull Island Formations was undertaken by a group
from the University of Bergen (Bakken, 1987; Kloster, 1987; Martinsen, 1987, 1989; Martinsen and
Bakken, 1990), summarized by Collinson et al. (1991). It was established that the slump and slide
horizons in the Gull Island had generally moved southeastward into the basin, with the Ross
Formation turbidity currents flowing northeasterly along the axis of the basin. The Ross turbidites
were regarded as basin floor deposits, and the Gull Island slumps and slides represented the
prograding slope. The Clare basin appears to have developed as a result of extension and
collapse above the position of the former Iapetus suture, as discussed by Collinsion et al., 1991
and Martinsen et al., 2000.
The superb outcrops have attracted research groups from various oil companies, but few
of these studies have been published. However, Chapin et al. (1994) presented the Shell work
and suggested that the Ross represented an "aggradational, sand-rich fan within a rapidly
subsiding basin, with small, coalescing mid-outer fan lobes with multiple shallow channels"
(Chapin et al., 1994, p. 53). They noted that "the distribution of bed thickness in vertical profile is
mostly random; small-scale thinning- and thickening-upward trends within sets of 5-20 beds were
occasionally observed within sheet sandstones". Also, "sheet sandstones [are] stacked in a
vertically disorganized fashion (i.e., neither fining/thinning up nor coarsening/thickening up)".
Chapin et al. (1994, p. 62) described the megaflutes, and interpreted them as the result of
"increased turbulence associated with hydraulic jump near channel-lobe transitions". Most lobe
deposits interpreted in the literature show thickening upward successions (Mutti and Ricci Lucchi,
1972; Mutti and Ghibaudo, 1972), but these were only "occasionally observed" (Chapin et al.,
1994) in the Ross Formation. Nevertheless, they (1994, p. 67) suggested that "small, ephemeral
lobes were fed from shallow channels that switched position often".
More recently, descriptions of the Ross Formation have been given by Elliott et al. (2000).
With respect to the sheet-like turbidite element, they noted (p. 6) that "at a scale of 1-3 m thin- and
thick-bedded intervals commonly alternate and the element could be viewed as comprising
small-scale thickening/coarsening upwards packages. Channels and megaflute erosion
surfaces...are rare in this element". They also noted (p. 6) that beds in the sheet-like turbidite
element were "deposited beyond the downcurrent limits of channels and the alternation of thin-
and thick-bedded intervals may suggest that they represent turbidite lobes". They commented (p.
6) that "turbidite channels are....more important than previously recognized, dominating the mid-
and upper parts of the formation", and suggested that "a significant proportion of the sheet
sandstones recognized by previous researchers [can be] reinterpreted as laterally extensive wings
4
Page 5
to turbidite channels, and unconfined turbidites are largely restricted to lower parts of the
formation" (Elliott et al., 2000, p. 6).
MEASURED SECTIONS AND CORRELATIONS
Detailed sections (Fig. 4) were measured on the north side of the Loop Peninsula at Ross Bay
(south side), Bridges of Ross, Toorkeal Bay and near Gull Island (Fig. 1). On the south side of the
Loop Peninsula, sections were measured at Kilbaha Bay, Kilcloher Head, Rinevella Point,
Cloonconeen Point and Kilcredaun Point. A complete section of the Ross Formation was
measured on the south side of the Shannon Estuary at Ballybunion (Fig. 1). The R. dubium
marine band was used as datum in the correlation diagram (Fig. 4) for the sections at Gull Island,
Cloonconeen Point, Kilcredaun Point and Ballybunion. The sections at Ross Bay and Bridges of
Ross can be correlated with Gull Island using the position of the Ross Slide. The section at
Rinevella Point has been correlated with the sections at Cloonconeen Point and Kilcloher Head in
the manner suggested by Kloster (1987). The Kilcloher - Rinevella correlation is supported by the
presence of an undeformed mudstone layer almost 5 m thick in both sections - this can be seen
about 100 m above the base of the Kilcloher section in Fig. 4. Thus Rinevella section has been
placed just below the Cloonconeen section, and they are presented as one composite section in
Fig. 4.
The Kilcloher Head section occurs below the R. dubium and R. paucicrenulatum marine
bands. The accessible measured section has been extended downward into a thick shale horizon
by observation of the cliffs from a boat (lowest 15 m of the Kilcloher section in Fig. 4). This shale
can be traced along the cliffs below Rehy Hill (observations from a boat), and occupies a position
estimated to be about 50 m below the channel at Rinevella Point.
The Kilbaha Bay section can be precisely correlated with the Kilcloher Head section by
mapping and measuring in the eastern part of Kilbaha Bay. The section at Toorkeal Bay is the
most difficult to place. It is suggested here that it belongs immediately below the uppermost
slump/slide in the Gull Island section, but otherwise as high as possible stratigraphically. This is
so that the two slump/slide horizons at Toorkeal are not positioned much lower than the other
slump/slide horizons in the upper Ross Formation.
Where accessible, the sections were measured at the scale of individual beds, noting
sandstone and mudstone thicknesses, internal sedimentary structures and paleocurrent directions.
Sole marks were easy to measure, but measurements on the tops of beds were only made where
the trends of ripple crests were unambiguous, or if the full curvature of ripple cross lamination
could be seen within ripple troughs ("rib and furrow"). The grand vector mean of readings taken
from 603 beds is 048o, or northeastward (Fig. 2).
Where sections cropped out in inaccessible cliffs (parts of Ballybunion and Gull Island),
thicknesses were measured by tape on the cliff top. Generalized descriptions were made using
5
Page 6
binoculars from the cliff top, and from photomosaics of the cliff taken from a small boat. At
Ballybunion, about 180 m of the total (460 m) was measured on the cliff top.
LOWER ROSS FORMATION
The lower Ross Formation is only exposed at Ballybunion. It is estimated to be about 170 m thick,
and the lowest 145 m is superbly and continuously exposed in the cliffs and on the wave-cut
platform. The section consists of interbedded sandstones and mudstones, with an extremely
tabular, sheet-like bedding style and no indications of channelling (Fig. 5). The sandstone and
mudstone beds do not have any significant changes in geometry or thickness across the
roughly-300-m width of outcrop. The average sandstone bed is 14 cm thick, the thickest individual
bed is 1.27 m, and the thickest amalgamated bed consists of three individual beds with an
aggregate thickness of 1.74 m. Most beds are stuctureless (Bouma's division A), with only about
10 percent showing Bouma divisions B and/or C.
The lowest 35 m of section consists mostly of mudstone. There is a general tendency for
more amalgamated beds to occur stratigraphically higher in the section, giving an overall
sandier-upward nature to the lower Ross. Nevertheless, there are also some apparently random
occurrences of thicker beds (up to almost 1 m) in the lower part of the section.
We did not observe any convincing trends of bed thickness (e.g., thickening-upward
successions) on the scale of a few metres. This is a major contrast with the upper Ross, which is
characterized by such successions, on a 2 - 5 m scale. The lower Ross contains only one thin
slumped horizon, about 10 m above the base.
Lower Ross Paleoflow
Flow directions were measured on 91 beds at Ballybunion, using flutes, rill marks, grooves, prods
and other miscellaneous tool marks. We first plotted flow directions against stratigraphic height
(Fig. 6A). There appears to be a gradual shift from flows directed toward 060o to flows toward
180o in the lower 60 m of section. There is then a sudden shift to flows toward 100o and a gradual
overall change toward about 040o through the section from 65 m to 145 m. The sudden shift at
about 60 m coincides with a concretionary dark shale that we interpret as the H. smithi marine
band. The paleoflows from below and above the black shale could be interpreted to form two
distinct data sets, and the data in each set were smoothed using a 3-bed moving average of the
paleoflow directions. The vector mean of the three beds was plotted against the stratigraphic
height of the middle bed of the three. The trends are highlighted by arrows in Fig. 6B.
Examination of the smoothed trends in Fig. 6B suggest the possibility of smaller-scale trends,
shown with arrows in Fig. 6C. Between 67 and 87 m, flows consistently swing from about 090o to
060o, and between 88 and 115 m, flows swing from about 090o to 040o. The data between 115
6
Page 7
and 145 m appear more random.
It is important to point out possible trends in the data, although some readers may accept
the analysis of Fig. 6B while rejecting 6C. Interpretations of these trends will be presented later.
UPPER ROSS FORMATION
The upper Ross has an overall thickness of about 290 m. It is characterized by thickening-upward
packages of turbidites, poorly-packaged turbidites, channels, and slump/slide horizons. Sections
were measured at Bridges of Ross (35 m), the south side of Ross Bay (79 m), Toorkeal Bay (47
m), near Gull Island (84 m), Cloonconeen Point (117 m), Rinevella Point (27 m), Kilbaha Bay (42
m), Kilcredaun Point (82m) and at Kilcloher Head (plus part of Rehy Cliff, with thicknesses
estimated from a photomosaic and totalling about 224 m). The upper Ross was also measured at
Ballybunion (290 m), where it is continuously exposed, but partly in inaccessible cliffs.
UPPER ROSS THICKENING-UPWARD PACKAGES
Parts of the upper Ross are characterized by packaging of turbidites into thickening-upward
successions. Other parts can be termed poorly-packaged or non-packaged, and are discussed
later. Where the packages are well-developed (e.g., Kilbaha Bay, Ross Bay), they contain four
parts from top to base (Figs. 7, 8),
4) an upper surface characterized by megaflutes (Fig. 8).
3) thick-bedded amalgamated turbidites
2) thin-bedded turbidites
1) gray mudstones with thin silty laminations
Packages are commonly stacked. This can best be seen at Kilbaha Bay, Ross Bay and Kilcloher
Head (Fig. 7). Packages without prominent stacking are exposed in all of the other upper Ross
sections (Fig. 4). The average thickness of 165 packages is 2.13 m (range 0.44 to 7.42 m, Tables
1 and 2).
The importance of packaging has been underemphasized by previous authors, as
discussed in the earlier section on previous work. Collinson et al. (1991) noted that "sand rich
sediments occur in packages, [but] around 70% of the [137] packages are randomly organized
with respect to vertical changes in sandstone bed thickness and sandstone/mudstone ratio".
Chapin et al. (1994, p. 56) and Elliott et al. (2000), in work quoted above, have also
underestimated the abundance and importance of the thickening-upward packages. Particularly,
Elliott et al. (2000, p.6) claimed that "channels and megaflute erosion surfaces....are rare in this
element " (i.e., small scale thickening/coarsening upward packages). In contrast to this
observation, we will show that thickening-upward packages are commonly associated with
channels, and are commonly associated with and capped by megaflute erosion surfaces.
7
Page 8
Basal mudstones
The basal mudstones do not occur in every package. They commonly overlie megaflute surfaces
(Fig. 8), and drape the sides of the megaflutes. Interbedded turbidites on a cm-scale may be
interbedded with the mudstones, and may also form part of the fill of the megaflutes, where they
commonly onlap the margins of the flute. Where megaflutes are not present, the mudstones are
flat-bedded and the interbedded thin turbidites are very continuous. At Kilbaha and Ross Bay, the
average thickness of the mudstones is 48 cm (range 10 - 140 cm). The thickest interval of
mudstones (140 cm) occurs at Ross Bay (33 m in the measured section, Fig. 4), where they are
black, very fine grained, and lack silty laminations. This lithology is very similar to that of the
marine bands in other locations.
Thin-bedded turbidites
Thin-bedded turbidites were measured in 126 packages (Table 1). Individual sandstone beds
average 5.2 cm thick, and the interbedded mudstones average 6.5 cm (1468 beds measured,
Table 2). Groups of thin-bedded turbidites average 115 cm thick (range 10 - 420 cm) in each of
the 126 packages. Individual beds are variable in geometry - some are continuous across the
outcrop but others may pinch and swell, and may disappear entirely across the width of an
outcrop. Some of the thinner beds may be restricted to megaflute fills, and may onlap the erosion
surface adjacent to the megaflutes (Fig. 8). Small sole marks are common, and many beds begin
with Bouma's division A and have thin, single sets of ripple cross lamination at the top (division C).
Climbing ripples and convolute lamination are rare.
Thick-bedded amalgamated turbidites
The thick-bedded amalgamated turbidites are normally structureless (division A). Amalgamation
surfaces are shown up by horizontal, gently scoured (Fig. 8) or loaded parting planes within beds.
These are commonly cryptic, and difficult to trace along the beds, making the identification of
individual beds impossible in places. Elsewhere, the cryptic parting planes may become better
defined, and draped by mm-scale layers of mudstone, or thin layers of mudstone clasts. Bearing
in mind the difficulty of defining individual beds, we estimate their individual thicknesses to average
about 27 cm. Maximum thicknesses of individual beds may be as great as a couple of metres.
The average thickness of amalgamated turbidites in a package is about 130 cm (range 23 - 612
cm; 125 packages measured). Sole marks are most easily measured on the lowest surface of a
group of amalgamated beds, but measurements can also be obtained where thin mudstone
partings have weathered out within groups of beds. Flutes up to 5 - 6 cm wide are commoner on
8
Page 9
the bases of amalgamated beds than on thin-bedded turbidites.
Megaflutes and megaflute erosion surfaces
Megaflutes (Figs. 8, 9, 10) have been described in detail in former publications (Elliott, 2000a, b).
They are 1 - 40 m wide, several metres to at least 25 m long, and up to about 3 m deep. They
have the same morphology (bulbous nose and downstream flare) as normal sized flutes seen on
the soles of sandstones. They are most easily observed on the weathered-out uppermost
surfaces of packages (Figs. 8 and 9), but we emphasize that megaflutes can be found at any
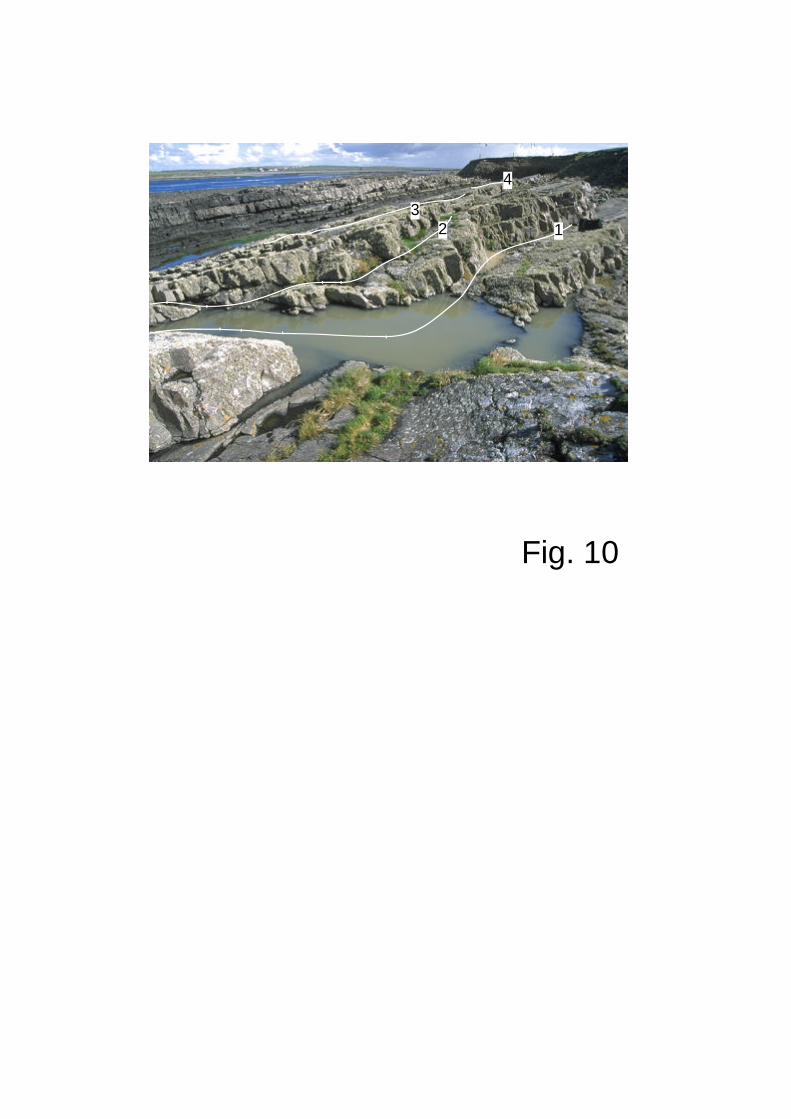
stratigraphic horizon within the upper amalgamated turbidites of a package (Fig. 10). Within the
packages the megaflutes can normally only be observed in cross section. One spectacular
exception occurs at Ross Bay (40 m above base of section in Fig. 4), where megaflutes occur at
four stratigraphic levels within a group of amalgamated turbidites about 3 m thick (Fig. 10). The
uppermost surface contains the "classic" megaflute (Fig. 9, number (4)), but flutes within the
sandstones are shown in Fig. 10. It is important to emphasize this point because the latest
description of the megaflutes, Elliott (2000) states that "the megaflutes are therefore local
ornamentations of widespread erosional surfaces that occur on the tops of selected sandstone
units....the vertical spacing of megaflute surfaces varies from 5 m to several tens of metres".
Megaflutes are commonly more closely spaced than "5m to several tens of metres" (Fig. 10), and
are not restricted to single widespread surfaces that "occur on the tops of selected sandstone
units".
The surfaces that have been scoured by the megaflutes commonly display plan views of
well developed ripples (Fig. 9). The beds that fill the megaflutes onlap the walls of the flutes (Fig.
8), and may also be rippled. Elliott (2000, his fig. 2) and Elliott et al. (2000, their fig. 5) illustrate
the "classic" megaflute at Ross Bay (our Fig. 9) and ask the reader to "note the linguoid
asymmetrical ripples that ornament the remainder of the bedding surface and the local descent of
the ripples into the scour" [our emphasis] (caption of fig. 5 in Elliott et al., 2000). It is very clear
(Fig. 9) that the sinuous-crested ripples do not descend into the scour, and that the rippled
surface formed before the megaflute was cut (Fig. 9). The first sediment within the flute consists
of a mudstone parting about 2 cm thick (arrow in Fig. 9), and the bed with straight-crested ripples
within the flute overlies this mudstone. We do not agree with Elliott's observations, nor with his
suggestion that "the ripple bedform fields [record] the waning stages of [the single turbidity
currents that cut the megaflutes]". Careful observation of the "classic" megaflute (Fig. 9) indicates
that 1) a thick amalgamated sandstone with a rippled upper surface was deposited, followed by 2)
megaflute erosion into this bed by a subsequent, different flow. Finally 3) the megaflute was
initially filled with 2 cm of mudstone (arrowed, Fig. 9).
The inferences that Elliott (2000) and Elliott et al. (2000) draw from their observations are
very different from the inferences that we draw from our observations. The implications of the
9
Page 10
megaflutes will be discussed below when we build an interpretation of the relationship between
packages and adjacent channels.
LATERAL RELATIONSHIPS WITHIN UPPER ROSS PACKAGES
Kilbaha Bay
There are many locations where individual beds, groups of beds, and packages can be walked
laterally for hundreds of metres. The best locations are Kilbaha Bay and Ross Bay. Kilbaha Bay
strikes essentially east-west (Figs. 1 and 11) and the vector mean flow direction is 010o (n = 81
beds). Thus the lateral view of the beds is almost exactly perpendicular to the flow direction. Our
stratigraphic panel (Fig. 11) is based on 1) the detailed measurement of 10 vertical sections, and
the walking out of individual beds and packages between sections. The beds in the panel are 100
percent exposed in the cliff and in gently dipping bedding planes that are mostly accessible only at
low tide. We recognized four minor faults, and could correlate bed by bed across all four.
The section can be divided in 20 thickening-upward packages, as described above. The
packages are lettered A through R, with D and D1, and O1, O2 and O3 as possible composite
packages. The average thickness of the mudstones and thin-bedded turbidites is 73 cm, and the
average thickness of the amalgamated sandstones is 114 cm. Thus the packages are a little
thinner than those at Ross Bay (Table 1). The average thin-bedded turbidite is 5.3 cm, and the
overlying mudstone 3.2 cm (Table 2, n = 435 beds). In the amalgamated sandstones, the average
bed thickness is about 31 cm (Table 2, n = 287 beds). The sand percentage in the mudstones
and thin-bedded turbidites is 65%, and is about 99% in the amalgamated sandstones. The
average for the entire section is about 84% sandstone.
Megaflutes occur on the tops of 10 packages, and broad scouring without well defined
flutes occurs on three more packages. Elliott et al. (2000, p. 35) refer to three channels at
Kilbaha, and also refer specifically to Megaflutes surfaces 1, 2 and 3. They note that "traced
laterally across the panel each megaflute surface ties to a turbidite channel at a slightly higher,
perched level than the master erosion surface that defines the axial sector of the channel". Elliott
et al. (2000) have underestimated the number of megaflute surfaces, and are incorrect in stating
that "each surface ties to a turbidite channel". Most of the ones we walked out do not tie to
channels in the Kilbaha Bay outcrop.
The panel diagram of Fig. 11 shows several subtle changes in package thickness, partly
controlled by the megaflute erosion surfaces, and partly controlled by original changes in bed
thickness and facies within packages. Some of the important lateral changes are shown in Figs.
12 and 13.
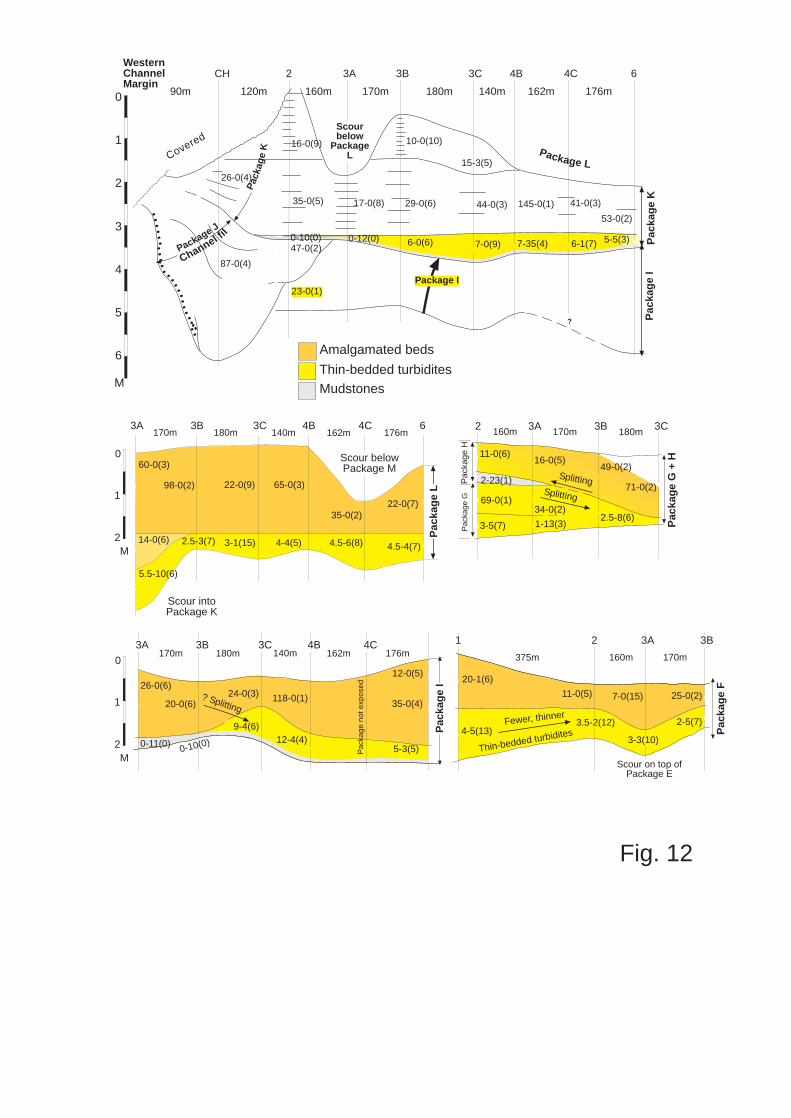
In Package F (Fig. 12(F)), the thin bedded portion thins progressively from 117 to 49 cm
over a lateral distance of about 700 m. The number of individual beds also decreases from 13 to
10
Page 11
7. The overlying amalgamated beds also show an eastward thinning, but with an anomalous
thickness in section 3A. In this section, there is a scour of package F into package E (Fig. 12(F)).
It appears that the thin-bedded turbidites evenly drape the scour, whereas the thick-bedded
amalgamated turbidites fill in the scour.
Figure 12 (G+H) shows that packages G and H combine eastward over a distance of about
500 m into a single package (G+H). The facies relationships suggest that the two thick
amalgamated beds in section 3C split westward into 11 amalgamated beds in section 2.
Mudstones occur beneath the amalgamated beds in section 2 (25 cm, including one 2-cm
sandstone) and section 3A (11 cm mudstone). These mudstones initiate package H, and their
absence in sections 3B and 3C suggests erosion at the base of the amalgamated sandstones. In
package G, the stratigraphic relationships (Fig. 12(G+H)) suggest that the amalgamated turbidites
in section 2 split eastward into thin bedded turbidites in section 3B, with continued thinning and
reduction in number of beds to section 3C.
Lateral changes in Package I are shown in Fig. 12(I). Note the thinning in section 3B,
where the lower thin-bedded turbidite unit is reduced to 10 cm of mudstone. Between 3B and 3C
there is a minor thickness increase from 130 to 150 cm, but major relative thickness changes
involving the thin-bedded and amalgamated turbidites. It is possible that the lower amalgamated
turbidites in 3B split laterally into thin-bedded turbidites with mudstone interbeds in 3C. This
suggestion is supported by the observation that there are 6 amalgamated beds in 3B and only 3
amalgamated beds in 3C.
Package K includes the upper part of the Kilbaha channel fill, and its continuation to the
east. The general setting is shown in Fig. 11, and a detailed diagram of the beds is given in Fig.
12(K). The channel itself is discussed later. Figure 12(K) shows that within the channel, the thick
amalgamated beds of packages J and K cannot be distinguished. At the eastern channel margin,
a thin mudstone parting appears (section 2 in Fig. 12(K)) that can be traced eastward into the unit
of mudstones and thin-bedded turbidites that marks the base of package K. Near the channel
axis, and toward the eastern edge of the channel, the fill consists of thick amalgamated
sandstones (4 and 5 beds identified in sections CH and 2 respectively). Eastwards, in sections 3A
and 3B, these amalgamated beds have split into 8 and 6 thinner distinct beds, respectively.
Farther to the east, fewer beds can be identified, possibly because of the difficulty of observing
amalgamation surfaces. The pattern of bedding in package K therefore appears to represent
onlap of mudstones and thin-bedded turbidites toward the east. In a westward direction, the beds
within the thick-bedded amalgamated facies appear to become thicker and fewer toward the
channel axis (at least from section 3B to section CH), probably by increasing amalgamation
between successive beds.
Lateral changes in Package L are shown in Fig. 12(L). The amalgamated thick-bedded
turbidites show little thickness change over their 830 m lateral extent, except where they have
been scoured before deposition of Package M. There are major thickness changes in the lower
11
Page 12
part of Package L, due to the infilling of a major scour into Package K (Fig. 11). The thin bedded
turbidites appear to drape the scoured topography, thinning from 93 to 67 cm between sections 3A
and 3B. The main infilling of the scour is by the central unit of package L, which consists of 6
amalgamated beds averaging 14 cm in thickness. Scour infilling by amalgamated turbidites,
rather than thin-bedded turbidites, was also seen in Package F (Fig. 12(F)).
Ross Bay
Lateral changes within one package have been studied in detail at Ross Bay (Fig. 13). The
package occurs about 10 m below the paucicrenulatum marine band in Fig. 4, and is capped by
the "classic" megaflute shown in Figs. 9 and 13 (at the circled number 4). It also contains three
other megaflute surfaces (Fig. 10; Fig. 13, numbered 1-3) below the "classic" surface. General
paleoflow in the package is about 040o, but the outcrop and the sketch (Fig. 13) trend 090-270o,
oblique to flow. Four sections were measured in detail (arrows along top of Fig. 13), and all of the
beds were walked out laterally (only possible at low tide). The lowest part of the package consists
mostly of mudstones with a few very thin-bedded turbidites. In places, these mudstones fill
megaflutes cut into the top of the previous package. The middle of the package consists of
thin-bedded turbidites, which are sharply overlain by thick-bedded amalgamated turbidites about
3.8 m thick in section 1 (Fig. 13). No significant thickness changes in the mudstones and
thin-bedded turbidites could be detected, but the thick-bedded amalgamated turbidites become
thinner westward from about 3.8 m (section 1) to 1.8 m (at 60 m from the weatern end of the
outcrop). Farther west (section 1) the amalgamated beds began to split into thinner bedded
turbidites with mudstone partings. The megaflutes are only present where the upper beds are
amalgamated, at the eastern end of the outcrop.
Lateral relationships within packages - summary
The overall cross section (Fig. 11) and the detailed package studies (Figs. 12 and 13) at Kilbaha
and Ross Bay suggest seven generalizations.
(1) The thin-bedded turbidite facies can thin laterally and pass into mudstones within about
200 m (packages D1 and F).
(2) The number of individual beds within a thin-bedded turbidite unit can decrease as the
unit thins laterally (package F).
(3) Amalgamated thick-bedded turbidites can split laterally and pass into thinner turbidites
with interbedded mudstones within about 500 m (packages G and H, and possibly package I).
The same change is seen in an eastward direction from the axis of the Kilbaha channel in package
K, and in the Ross Bay package shown in Fig. 13.
(4) Thin-bedded turbidites and mudstones tend to drape an underlying scoured
12
Page 13
topography. The topography is filled in by deposition of amalgamated thick-bedded turbidites
(packages F and L).
(5) Major thickness changes are associated with the filling of scours, on the scale of
megaflutes (up to about 10 m wide) up to broad regional scours over 150 m wide (package L
between sections 3A and 3B).
(6) The basal sediments in each package consist of mudstones, or more commonly,
mudstones with a few cm-scale turbidite sandstones.
(7) The thin, lower parts of packages (mudstones and thin-bedded turbidites) can
disappear along strike, either by erosion at the base of overlying amalgamated sandstones, or by
lateral amalgamation and facies change. Either of these possibilities could explain the lateral
changes seen in packages G and H (Fig. 12(G+H)).
Incomplete packages
Many of the packages observed are incomplete - that is, they do not have all four of the elements
that make up a perfect package (mudstones, thin bedded turbidites, amalgamated turbidites, and
a megaflute surface). This does not invalidate the package concept, any more than finding
Bouma AE, or ACE beds invalidates the complete ABCDE Bouma sequence.
Only about half of the packages have undisputed megaflutes on top of the package, or
within the amalgamated turbidite portion of the package. Ten out of twenty packages at Kilbaha
and four out of twelve packages at Ross Bay have megaflutes. In other locations, without
extensive gently-dipping bedding planes to examine, megaflutes may be impossible to observe.
The recording of basal mudstones as a distinct part of the package is somewhat
dependent on their thickness, and on the thickness of sandstones within the mudstones. Ideally,
the mudstones will be 10 cm or more in thickness, with or without sharp-based sandy or silty
laminations less than 1 cm thick (very thin-bedded turbidites). As the mudstones become thinner,
and the interbedded sandstones thicker, they will be recorded as thin-bedded turbidites. Many
packages begin with thin bedded turbidites rather than with a distinct mudstone horizon.
In some places, the thick-bedded amalgamated turbidites rest abruptly on mudstones, with
poor or no development of thin-bedded turbidites. In these cases, the progressive upward
increase in bed thickness cannot be observed. In some cases, the thin-bedded turbidite facies
may be missing due to erosion at the base of the thick-bedded amalgamated facies, but erosive
relationships are rarely observed in outcrop.
Poorly-packaged or non-packaged sections
In some parts of the upper Ross (and throughout the lower Ross), there are sections up to about
30 m thick that do not display any form of packaging. Mudstones, thin-bedded turbidites, and
13
Page 14
amalgamated beds appear to be randomly interbedded. The 25 m thick section immediately
above the Ballybunion slump/slide at Cloonconeen (Fig. 4) is a good example. Here, the beds
consist dominatly of mudstones and thin-bedded turbidites, with only one or two horizons of
thick-bedded amalgamated turbidites. There are no apparent thickening-upward trends. Note that
this section above the Ballybunion slump/slide at Cloonconeen (Fig. 4) is correlative with an
extremely well-packaged section at Kilbaha Bay, and reasonably well packaged sections at
Kilcloher Head and Kilcredaun Point.
Lower in the Kilcloher Head (95 to 130 m above the base, Fig. 4), there is another
non-packaged interval. It contains a 5-m thick dark mudstone interval (correlated with a similar
interval at Rinevella, Fig. 4), thin-bedded turbidites, and several horizons of amalgamated
turbidites, but there are no consistent thickening-upward trends. The lower 25 m at Toorkeal Bay
contain two slumped horizons along with dominatly thin-bedded turbidites, but there are no
thickening-upward trends.
UPPER ROSS CHANNELS
Channels up to about 10 m thick and 100 m wide have been observed at several locations in the
upper Ross Formation, particularly at Bridges of Ross (2 locations), Kilbaha Bay, Cloonconeen
Point, Rinevella Point and in the cliffs below Rehy Hill. Their downchannel lengths are unknown.
These channels are described below, emphasizing the nature of the fill, the channel margins, and
the relationships to adjacent packages.
Cloonconeen Point Channel
Description. The margin of a large channel complex is well exposed at Cloonconeen Point (Fig.
14). The centre of the complex fill is 17 m thick and consists exclusively of amalgamated
sandstones, with only a thin mudstone clast conglomerate at the base. The channel margin is
slightly tectonized and mineralized, but relationships suggest three phases of channelling and
filling. The fill of Phase 1 is overstepped by the base of Phase 2A, and the strike of the channel
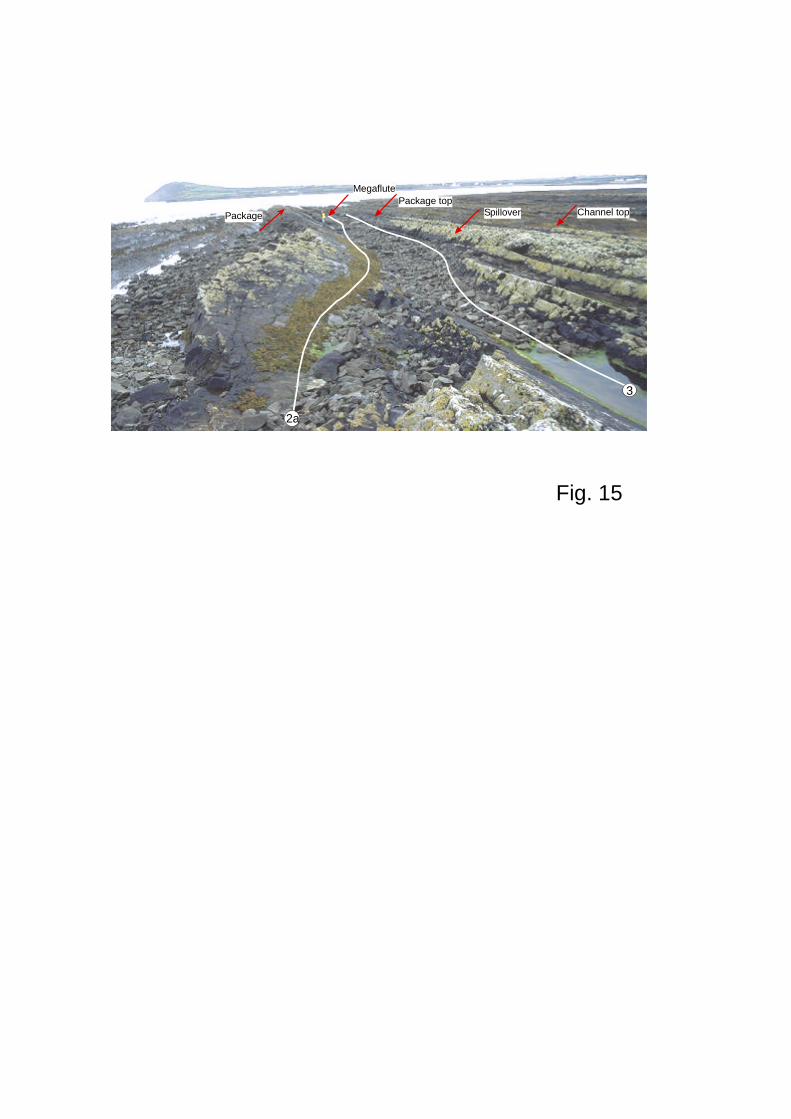
wall of Phase 2A suggest flow toward 050o (Fig. 14). The basal surface of Phase 2A can be
traced laterally from the channel. It truncates a thick amalgamated sandstone, and continues to
rise stratigraphically away from the channel margin, truncating a thin sandstone, and then a thin
mudstone-sandstone package (Fig. 15). The top of the package is defined by the Phase 2A
surface, and there is a prominent megaflute (flow direction 054o) on this surface. A thick
sandstone (the base is the Phase 2B surface, Fig. 14) onlaps the Phase 2A surface. This
sandstone and the Phase 2A surface with megaflutes are draped with dark mudstone. The
mudstone can be traced toward the centre of the channel complex, but is cut out by the surface
that defines the base of Phase 3.
14
Page 15
Channel deposition resumed at the same location with deposition of Phase 3. The lower
two beds cut into the underlying mudstones, but higher beds spread from the channel (Fig. 15).
About 100 m to the west, the uppermost 3.5 m thick amalgamated channel fill sandstone thins to
about 70 cm, where the bed forms the upper part of a thickening-upward package (Fig. 15).
Interpretation. The Cloonconeen channel illustrates that packages can aggrade as a result of
spillover from the channel itself (Figs. 14 and 15). Phases 1 and 2 may have contributed to the
aggradation of packages to the west, but because of erosion at the channel wall, the exact
relationships cannot be determined. It is clear that the Phase 2A surface was created as the
channel wall stepped westward. Turbidity currents spilled mud onto the megaflute surface, but
sand was restricted to the base of the channel. Even the Phase 2B sandstone onlaps and pinches
out against the Phase 2A surface, without major sand overspill (Fig. 14). It appears that during the
main phase of channel aggradation, only mudstone (and perhaps thin-bedded turbidites) spills
over the bank. Thick sandstones only spill overbank after most of the depth of the channel has
been filled with sandstones.
Rinevella Point Channel
Description. The channel complex (Fig. 14) was defined by measuring nine sections, and walking
out individual beds between sections. Paleoflow averages about 012o, and the outcrop strikes
east-west, roughly perpendicular to flow.
The bulk of the outcrop is made up of Western and Eastern channel fill deposits (Fig. 14).
The Western channel has an erosive, stepped base with an initial relief of at least 5 m (between
180-220 m in Fig. 14). The lower 10 m of fill consists of thick amalgamated sandstones, overlain
by about 4 m of interbedded turbidites and mudstones (e.g., at 130 m). These turbidites are
truncated by a scoured, megaflute surface (circled number 1 in Fig. 14) below package 1 (125 m
to the gully). This megaflute surface can be traced eastward to the base of the Eastern channel.
The scouring and megaflutes become unrecognizable west of about 110 m (Fig. 14), and the
surface passes conformably into regional bedding. It is overlain by thin, tabular thickening-upward
packages, of which numbers 1 and 2 (Fig. 14) can be traced eastward into the fill of the Eastern
channel (between about 180-210 m).
The Eastern channel overlies an extensive mudstone layer about 1 m thick. The channel
base is planar (at about the 12 m stratigraphic level, Fig. 14), and is overlain at the eastern end by
a wedge of laterally accreting sandstones (290-320 m in Fig. 14; Fig. 16). After a phase of lateral
accretion, the fill became aggradational. The first aggrading sandstone is restricted to the base of
the channel, but passes laterally eastward into a thin mudstone that drapes the lateral accretion
surface (circled number 3, Fig. 14, 300-320 m). The bulk of the fill consists of 10-11 m of
amalgamated sandstones (e.g., at 240 m), but these thin eastward to about 2 m at the
15
Page 16
easternmost end (where the outcrop is lost beneath the sea). The uppermost surface (circled
number 4) between 205-325 m is an erosional, megaflute surface. The overlying beds onlap
progressively to the west (Fig. 17). Thick tabular sandstones continue to the 25 m level, when the
entire channel complex is overlain by at least 4 m of mudstones. At the western end of the
Eastern channel (180-210 m), the amalgamated sandstones split into thickening-upward packages
1 and 2 (Fig. 14). The scoured megaflute surface is overlain by mudstone, and amalgamated
channel sandstones cut into this mudstone at about 200 m (circled number 5). Above the
mudstone, the amalgamated channel sandstones spill overbank and split into the thinner bedded
turbidites and mudstones in packages 1 and 2.
Interpretation. The most important relationships are shown by the Eastern channel, which is
interpreted to have first accreted laterally toward the west. The initial phase of lateral accretion
was followed by a phase of vertical accretion. The first turbidity currents transported sand close to
the channel floor, with some mud spilling up onto the eastern channel margin (the former lateral
accretion surface, circled number 3 in Fig. 14; Fig. 16). This supports the interpretation that mud
can spill out of the channel during aggradation, as is seen on the megaflute surface west of about
200 m. The channel fill aggraded without any suggestion of sand spilling overbank, to the point
where channel fill sand cut into overbank mud (circled number 5 in Fig. 14). With the channel
mostly filled, flows were able to spill extensively over the banks to form packages 1 and 2 that
continue to the western end of the outcrop. The top of the second package is the erosion surface
that dips eastward across the top of the Eastern channel (circled number 4 in Fig. 14).
The Rinevella channel shows some of the same features as the Cloonconeen channel,
namely that turbidity current sand is at first restricted to the base of the channel and only mud can
be spilled overbank. Sand can only spill overbank after considerable channel aggradation. When
it does so, it commonly overlies mudstone, and contributes to the building of thickening-upward
packages.
Kilbaha Bay Channel
Description. The channel at Kilbaha Bay (Fig. 11, section CH) was reconstructed from measured
sections and a photomosaic (Fig. 14). The observed depth of incision is about 3 m, and the
channel fill facies totals about 6 m. Small scours and flutes at the base of the channel give an
average paleoflow direction of 003o. The base of the channel is relatively flat and follows the
mudstones at the bases of packages H and I. The western side of the channel base is marked by
a mudstone clast conglomerate up to 1 m thick and 150 m wide. The conglomerate also contains
two elongated sandstone blocks up to 3.5 m long and 35 cm thick. Within the channel there are
several broad scoured surfaces marked in places by mudstone clasts. The channel fill consists of
amalgamated thick-bedded sandstones.
16
Page 17
The relationship of the channel fill to beds outside the channel is not exposed on the
western side. On the eastern side the thick, amalgamated channel-fill sandstones split laterally
into thinner bedded sandstones separated by thin mudstone partings. The most prominent parting
has been used to separate the main, amalgamated channel fill (assigned to package J) from the
fill defined as package K (Fig. 12(J+K)). Note that package K can be traced laterally from the
channel continuously for about 990 m to section 6, as discussed above.
Interpretation. Lateral facies changes (Fig. 12(J+K)) suggest that mudstone and thin-bedded
turbidites spilled over the eastern channel wall, initiating deposition of package K. Powerful flows
continued in the channel axis, with aggradation of amalgamated structureless sandstones, but
these beds split eastward into interbedded sandstones and mudstones. This relationship suggests
overbank spill of sand and mud to the east, forming the upper part of package K at the same time
as the channel deposits are aggrading into a succession of uninterrupted amalgamated
sandstones (section CH in Fig. 11).
Bridges of Ross
The channel lies about 500 m WNW of the parking lot at Bridges of Ross (Fig. 1). It is exposed in
a long cliff face that stands up above a very continuous bedding plane that forms a dip surface into
the sea (Fig. 18). This bedding plane can be traced south (left) and west of the cliff shown in Fig.
18, and the channel can be examined in detail on all three faces of the cliff. The channel steps
shown in Fig. 18 are deceptive with respect to flow direction - the cliff strikes north-south, but
paleoflow is generally northwestward, or diagonally to the right into the photograph (Fig. 18).
There appear to be at least three distinct channels at Bridges of Ross (Fig. 19). Viewed from the
south, the base of the first channel is marked by a prominent mudstone clast conglomerate. The
fill consists of amalgamated sandstones totalling about 6 m in thickness. There are several
mudstone clast horizons (Fig. 19), which mark the steps seen in Fig. 18. The second channel
partially cuts into the first, and can be seen to truncate the basal mudstone clast conglomerate.
The wall of the truncation trends 330-150o. On the south side of the outcrop, the south wall of the
channel is well exposed, with erosional relief of at least 2 m. Directions obtained from strike of the
wall are 310-130 and 320-140o.
The third channel cuts into the fill of the second channel, and has a measured thickness of
5.4 m (Fig. 19). The fill consists entirely of amalgamated sandstones. At least three small steps
(ST in Figs. 18 and 19) can be seen at the base of the channel, trending east-west (see caption of
Fig. 19 for details). On the western side of the outcrop, small flutes occur on the base of the
channel fill, with northwestward flow directions (caption, Fig. 19). Because the flutes indicate a
northwesterly flow direction, we interpret the strike of the wall of the second channel (330-150,
310-130 and 320-140o) to imply northwestward rather than southeastward flow. The direction of
17
Page 18
050o given by Elliott et al. (2000, p. 15) appears to be based on the assumption that the channels
at Bridges of Ross and "Fisherman's Point" (see below) are in fact the same channel - a line
drawn between them strikes 050o. Our actual paleocurrent measurements indicate that these are
not "serial cross sections through the channel complex" (Elliott et al., 2000, p. 15), but are distinct
and separate channels that occur at roughly the same stratigraphic level.
Because the channels are preserved in an isolated blocky cliff (Fig. 19), contacts between
the channel fill and surrounding facies are generally not exposed. The wall of channel 2 as seen
on the west face of the cliff is a spectacular exception. Here, the channel wall strikes
northwestward, and dips as steeply as 54o to the northeast. The depth of incision is at least 5 m,
with the channel cutting into thick bedded turbidites with thin mudstone partings. There are
mudstone clast conglomerates at the margin, as well as some steeply dipping but otherwise
undeformed sandstones that drape the channel wall. The channel is filled with thick amalgamated
sandstones, and beds in the upper part of the fill spill over the margin (Fig. 20) and become
conformable with the beds outside the channel.
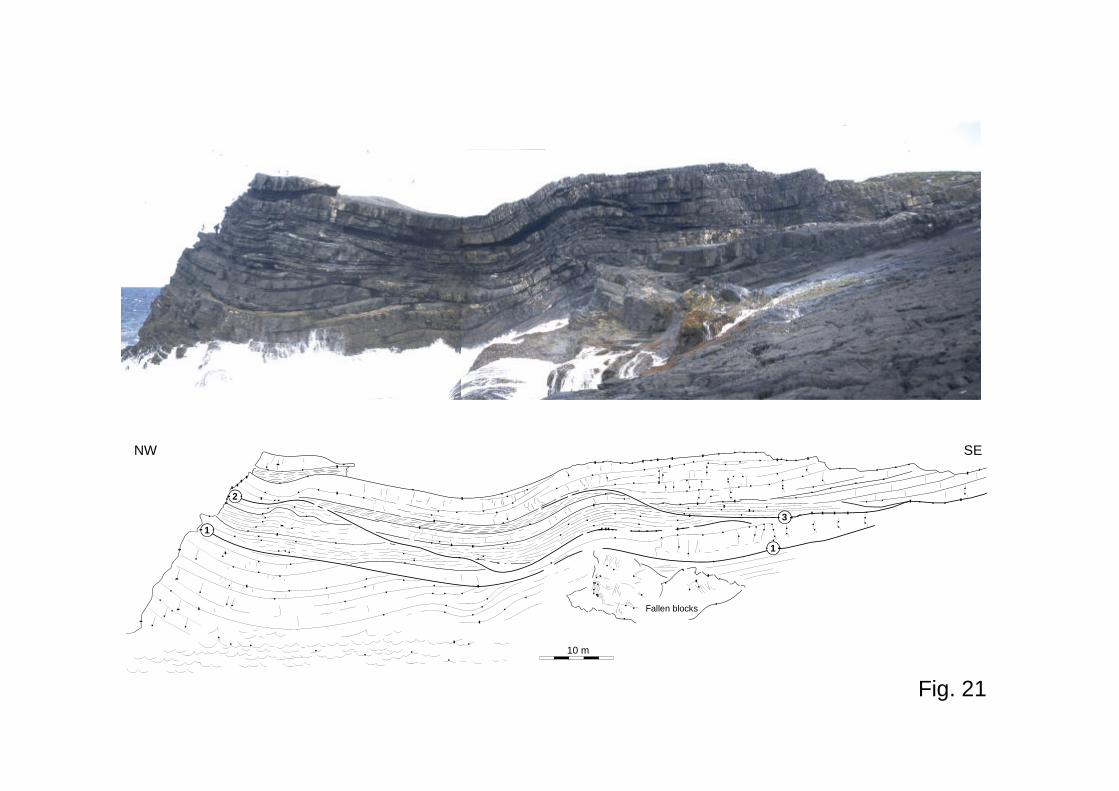
"Fisherman's Point"
This informally-named outcrop is about 1.2 km ENE of Bridges of Ross (Fig. 1), and presents an
impressive view of bedding discordances in the cliff. The wide bedding plane in the foreground
(Fig. 21) is the top of the Ross Slide (where several superbly developed sand volcanoes can be
examined).
Three discordances are identified in Fig. 21. Note that discordance 1 is almost planar over
the northwestern half of the outcrop, and that it truncates a broad syncline and minor
anticline-syncline pair in the centre of the outcrop. The beds must have been folded before
discordance 1 developed, and it is therefore interpreted as a thrust fault, not a channel margin.
This interpretation is supported by the presence of mineralization and slickensides along the
discordance plane.
Discordance 2 is mostly inaccessible. Discordance 3 is also characterized by extensive
mineralization and slickensides, and there are minor drag folds that suggest some thrust
movement toward 350o. However, on the southeastern side of the fault, several beds clearly onlap
the plane of discordance, and the thin-bedded turbidites northwest of the discordance cannot be
matched across the discordance. We therefore interpret discordance 3 as a channel margin, with
later minor thrusting. The nature of the fill above discordance 3 can best be seen in a continuous
accessible section that can be measured at the southeastern end of the outcrop shown in Fig. 21.
Here, the channel fill is about 13.5 m thick, and consists dominantly of amalgamated sandstones.
The base is marked by a prominent mudstone clast conglomerate almost 1 m thick in places (but
thicknesses may have been altered due to thrusting).
There are few paleoflow indicators, but two sole marks (including small flutes in rows,
18
Page 19
resembling rill marks) just above the base suggest flow toward 290o. Ripple crests in the thinner
bedded unit about 3 m above the base indicate flows toward 055o, and a broad, rippled surface 2
m below the top indicates flow toward 090o. The variety of directions suggests that the lower 3.25
m of fill, immediately above the mudstone clast conglomerate, was deposited in a channel heading
almost westward. The main part of the fill may represent a different channel, stacked on top of the
lower one, heading northeast to east. The relationships of channel fill to beds outside the channel
cannot be seen.
Cliffs below Rehy Hill
The cliffs below Rehy Hill are mostly inaccessible, but they can be observed from a boat. The
beds are generally flat-lying, but in one location, interbedded sandstones and mudstones dip at
about 5o with respect to horizontal (Fig. 22). The thickness of the dipping interval is estimated at 6
- 8 m, and the lateral extent is about 200 m. The dipping beds are sigmoidal and lenticular, with
each bed pinching out at the lower downlap surface, and apparently also at the upper surface
(which is partly covered). At the eastern end, the dipping beds consist of interbedded sandstones
and mudstones, but toward the west, the section contains more amalgamated sandstones. The
set of dipping beds is interpreted as a lateral accretion deposit.
Channellization - summary
Channel fills, channel margin relationships and lateral accretion deposits can best be observed at
Cloonconeen Point, Rinevella Point, Kilbaha Bay, Bridges of Ross and "Fisherman's Point") and in
the cliffs below Rehy Hill. Channel margins are commonly steep and stepped, with a visible relief
of up to 5 m. Each channel fill is underlain by a mudstone clast conglomerate, and the bulk of the
fill is characterized by a thick succession of vertically-aggraded amalgamated sandstones that
onlap or scour into the channel margin. On the opposite "point bar" side of the channel, lateral
accretion deposits may be present. The upper part of the channel wall commonly flattens out and
passes laterally into a bedding surface with megaflutes - a good example is the western side of the
Eastern channel at Rinevella Point (Fig. 14), where the gently rising megafluted margin extends
more than 100 m from the channel before passing into a bedding plane.
A tentative generalization from these observations is that in other outcrops of the upper
Ross Formation, where clear evidence of channel margins and channellization is not present, a
succession of thick amalgamated sandstones underlain by a mudstone clast conglomerate
nevertheless indicates a channel fill environment.
SLUMPS AND SLIDES
19
Page 20
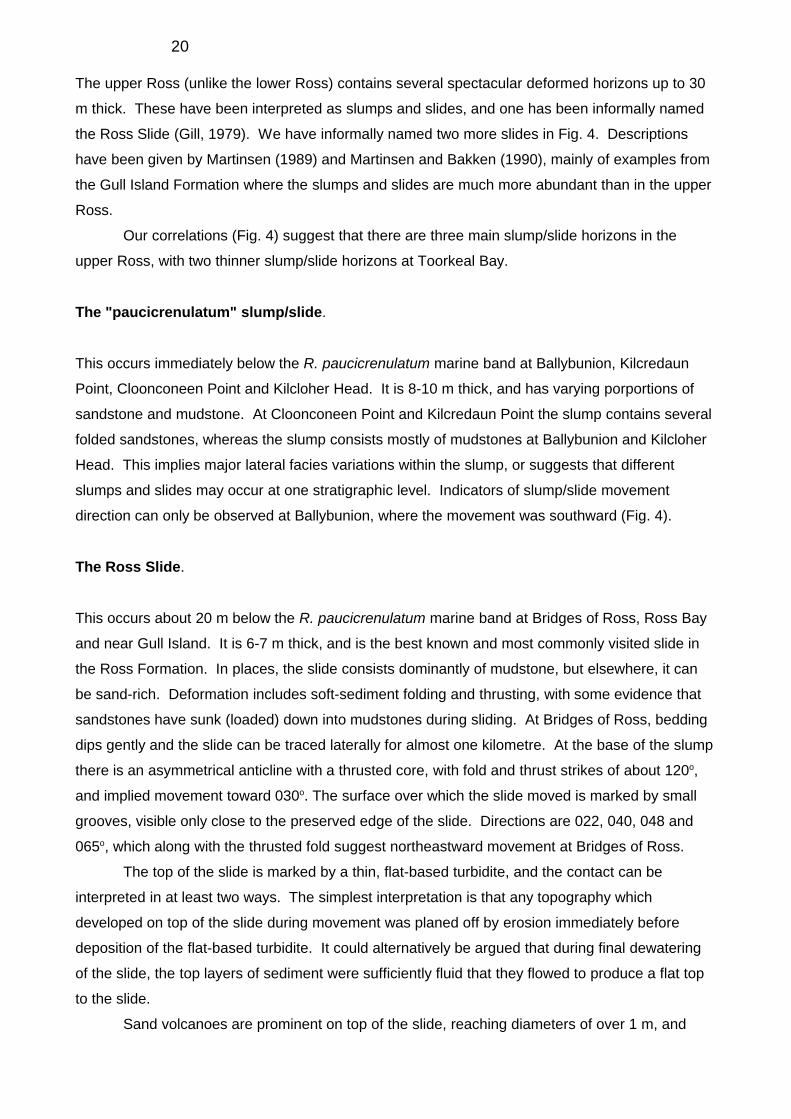
The upper Ross (unlike the lower Ross) contains several spectacular deformed horizons up to 30
m thick. These have been interpreted as slumps and slides, and one has been informally named
the Ross Slide (Gill, 1979). We have informally named two more slides in Fig. 4. Descriptions
have been given by Martinsen (1989) and Martinsen and Bakken (1990), mainly of examples from
the Gull Island Formation where the slumps and slides are much more abundant than in the upper
Ross.
Our correlations (Fig. 4) suggest that there are three main slump/slide horizons in the
upper Ross, with two thinner slump/slide horizons at Toorkeal Bay.
The "paucicrenulatum" slump/slide.
This occurs immediately below the R. paucicrenulatum marine band at Ballybunion, Kilcredaun
Point, Cloonconeen Point and Kilcloher Head. It is 8-10 m thick, and has varying porportions of
sandstone and mudstone. At Cloonconeen Point and Kilcredaun Point the slump contains several
folded sandstones, whereas the slump consists mostly of mudstones at Ballybunion and Kilcloher
Head. This implies major lateral facies variations within the slump, or suggests that different
slumps and slides may occur at one stratigraphic level. Indicators of slump/slide movement
direction can only be observed at Ballybunion, where the movement was southward (Fig. 4).
The Ross Slide.
This occurs about 20 m below the R. paucicrenulatum marine band at Bridges of Ross, Ross Bay
and near Gull Island. It is 6-7 m thick, and is the best known and most commonly visited slide in
the Ross Formation. In places, the slide consists dominantly of mudstone, but elsewhere, it can
be sand-rich. Deformation includes soft-sediment folding and thrusting, with some evidence that
sandstones have sunk (loaded) down into mudstones during sliding. At Bridges of Ross, bedding
dips gently and the slide can be traced laterally for almost one kilometre. At the base of the slump
there is an asymmetrical anticline with a thrusted core, with fold and thrust strikes of about 120o,
and implied movement toward 030o. The surface over which the slide moved is marked by small
grooves, visible only close to the preserved edge of the slide. Directions are 022, 040, 048 and
065o, which along with the thrusted fold suggest northeastward movement at Bridges of Ross.
The top of the slide is marked by a thin, flat-based turbidite, and the contact can be
interpreted in at least two ways. The simplest interpretation is that any topography which
developed on top of the slide during movement was planed off by erosion immediately before
deposition of the flat-based turbidite. It could alternatively be argued that during final dewatering
of the slide, the top layers of sediment were sufficiently fluid that they flowed to produce a flat top
to the slide.
Sand volcanoes are prominent on top of the slide, reaching diameters of over 1 m, and
20
Page 21
heights above the slide surface of at least 20 cm (Gill and Kuenen, 1957; Gill, 1979). The circular
shapes of the volcanoes, their radial symmetry, and their well preserved central craters suggest
eruption of sand at the sediment-water interface, rather than after deposition of overlying
mudstones. None of the volcanoes shows any sign of erosion, suggesting that the next turbidity
current failed to erode the top of the slide or of the volcanoes themselves. In conclusion, we
suggest that the top of the slide flattened out by soft-sediment flowage during dewatering. In
places, the flowage moved enough sand and water to the slide surface to produce the volcanoes.
The top of the slide was buried by mudstone, which helped to protect the volcanoes from erosion
by the next turbidity current.
The Ballybunion slump/slide.
This occurs about 40-50 m below the R. paucicrenulatum marine band at Ballybunion (Fig. 23),
Kilcredaun Point and Cloonconeen Point. It is mostly covered by seaweed at Cloonconeen Point.
At Ballybunion it is well exposed in three dimensions and is readily accessible at low tide. There
are several distinct styles of deformation within the 30 m thick unit. Toward the base, a thick
sandstone horizon has been folded and thrusted within the slide. Fold axes strike 155, 110, 110
and 150o (mean 138o), with vergence and implied movement toward northeast. This horizon is
overlain by deformed mudstones, and a second sandstone horizon that appears to be deformed
mainly by large-scale lateral breaking-up of the bed by loading (Fig. 23). Above the sandstone
there is a capping layer of mudstones. These contain long (about 50 cm) narrow sandstone dikes
that have injected upward from a sandstone layer that has essentially disappeared (Fig. 23, arrow
D). After dike injection, several syn-sedimentary thrusts were formed (Fig. 23, arrow T). The
strike of the thrust planes is 060, 064, 065, 070 and 075o (mean 067o), with movement toward the
SE. Small folds (axes trend 055, 060 and 060o) also suggest movement toward the SE. The
different directions in the lower and upper parts of the slump suggest that there may be two
different slumps superimposed. Alternatively, different parts of the slump may have moved in
different directions, perhaps as the centre moved forward and the margins spread laterally.
PALEOFLOW
Paleoflow measurements have been obtained from 603 beds, and have a grand vector mean of
048o (Fig. 2). It is both possible and necessary to break down the paleoflow data in different
ways, extracting much more information than simply a grand vector mean for all of the Ross
Formation.
Flow directions related to facies
21
Page 22
At Ross Bay and Kilbaha Bay, there are sufficient data to plot separately the paleoflows for the
thin-bedded turbidite facies, and the amalgamated thick-bedded facies. At Ross Bay, 74 beds
were measured, with an overall vector mean of 048o. When the data are separated (Fig. 24), it
can be seen that the spread of readings is much greater for the thin-bedded facies (285 to 135o)
than the thick-bedded amalgamated facies (345 to 115o). In the thick-bedded amalgamated
facies, 88 % of the readings fall in the central part of the distribution (025 to 085o), compared with
only 64 % for the thin-bedded facies. The vector means for the two facies are similar (053o
amalgamated, and 047o thin-bedded).
A similar distribution (Fig. 24) is seen at Kilbaha Bay, where the vector mean for all 81
readings is 010o. Although the overall spread for each facies is similar, the distribution is much
more peaked for the amalgamated facies, with almost one third of the readings falling in the
355-005o range. The vector means for the two facies are similar (006o amalgamated, and 014o
thin-bedded)
It appears that most of the flow directions for the amalgamated facies are concentrated in a
much narrower spread than those of the thin-bedded turbidite facies, regardless of the overall
vector mean (048o at Ross Bay, 010o at Kilbaha) of the data.
INTERPRETATION - FACTS TO BE CONSIDERED
All of the features described above will be built into the overall interpretation. These include 1) the
absence of packaging in the lower Ross and parts of the upper Ross, 2) the abundance of
packaging and megaflute surfaces in the upper Ross, 3) the lateral facies changes detailed at
Kilbaha and Ross Bay, particularly the splitting of amalgamated sandstones into turbidites
interbedded with mudstones, and the thinning and loss of turbidites laterally into mudstones, 4) the
facies relationships within channels and at channel margins, 5) the detailed relationships between
channel fills and adjacent packages, 6) flow directions in the thin bedded turbidite and thick
bedded amalgamated sandstone facies, and 7) the nature of the interbedded slump/slide horizons.
INTERPRETATION OF PACKAGING - THE CHANNEL SPILLOVER MODEL
Many parts of the upper Ross are characterized by thickening upward packages (Fig. 7), similar to
those traditionally interpreted as prograding lobe deposits (Mutti and Ricci Lucchi, 1972; Mutti and
Ghibaudo, 1972). The successions in the Ross, averaging a little over 2 m, would probably have
been considered typical of a lobe fringe in the 1970s. However, we suggest that lobe
interpretations are unlikly because 1) thick amalgamated sandstones would not be expected at the
lobe fringe, 2) thin lobe fringe deposits would not commonly be closely associated with channel fill
deposits, 3) megaflute erosion surfaces would not normally be associated with abandonment of
the lobe fringe, and 4) the lobe or lobe fringe interpretation does not explain the paleocurrent
differences between the thin-bedded and amalgamated facies (Fig. 24).
22
Page 23
Because of the intimate relationship between packages and channels we suggest that the
thickening upward successions seen in packages indicate the progressive lateral migration,
approach and filling of a channel. The thick-bedded amalgamated turbidites indicate overbank
deposition closest to the channel itself. The megaflutes appear to represent scouring at channel
margins. The amalgamated sandstones split laterally into thin-bedded turbidites (Fig. 12),
suggesting deposition farther from the channel. The thinning and disappearance of thin-bedded
turbidites, and their passage into mudstones indicates more distal locations of overbank
deposition. In this interpretation, the gently dipping surfaces described from the eastern channel
at Rinevella (Fig. 14) and from the cliffs under Rehy Hill can be considered as lateral accretion
surfaces (Fig. 22).
The lateral extent of some of the amalgamated sandstones and thin-bedded turbidites (at
least 1 km, Fig. 11) could be taken to indicate that similar distances of channel migration might be
necessary in order to build the vertical facies successions in the packages (i.e., distal mudstones
overlain by thin-bedded turbidites and finally by amalgamated sandstones at the channel margin).
However, there are no outcrop indications of long-distance channel migration, and the width of the
dipping surfaces at Rehy Hill is only a few hundred metres. We therefore propose a two-stage
channel migration and filling model (Fig. 25).
The first phase involves avulsion of a channel into a new area, the development of a
sinuous pattern, and the beginning of lateral accretion at channel bends. Turbidity currents erode
the cut bank side of the channel, and sand and mud can spill onto the point bar side and be
deposited (Fig. 25). The upper parts of some of the flows can also spill over the cut bank and
deposit mudstones and thin-bedded turbidites close to the channel, as at Cloonconeen and
Rinevella (Fig. 14). There is no evidence in the field for the development of topographic relief
(levees) at the channel margins, hence the terminology of spillover rather than levee. Lateral
accretion deposits appear to be rare in the upper Ross, and hence the first stage of package
development may be relatively brief.
The second phase involves vertical aggradation and channel filling. The first in-channel
deposits may be restricted to the channel floor, but as the channel fills, more and more sand may
spill over the margin (Fig. 14), resulting in the superposition of amalgamated turbidites on
thin-bedded turbidites (Fig. 7) Scouring at the channel margin may form megaflutes, which have
been preserved both within sets of amalgamated beds (Fig. 10), and on their uppermost surface
(Figs. 8, 9). The two phases of the model account for the vertical succession observed in the
packages without necessitating a kilometre or more of lateral migration. This model for the origin
of thickening upward packages will be referred to as the channel-spillover model (Fig. 26).
In the context of a spillover model, it is possible that progressive loss of sand overbank
results in progressively thinner and lower density flows downstream. This change in flow may be
the trigger that leads to deposition in the channels, and the beginning of vertical aggradation and
channel filling.
23
Page 24
INTERPRETATION OF PALEOFLOW IN PACKAGES
The packages at Kilbaha and Ross Bay have been analysed for paleoflow, separating the data for
1) the thin-bedded turbidites and 2) the amalgamated sandstones (Fig. 24). Note that in both
areas, the directions for the thin-bedded turbidites are more widely spread, and the directions for
the amalgamated sandstones are more closely clustered at the centre of the distribution.
Nevertheless, the vector means for both facies are essentially the same in each area.
These paleoflow data reinforce the channel-spillover model. The amalgamated
thick-bedded sandstones were interpreted as having been deposited closest to the channel, and
hence their paleoflow directions more closely reflect those of the channel itself. The thin-bedded
turbidites spread farther from the channel, and may be expected to have a wider fan of flow
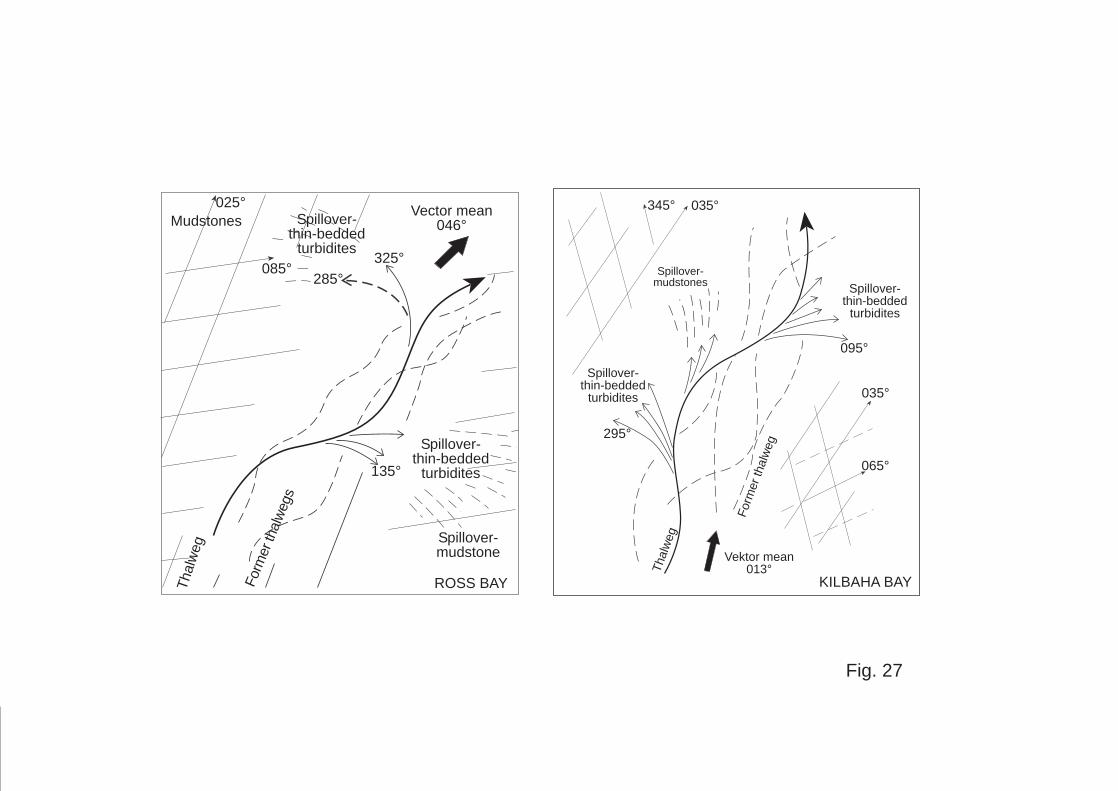
directions. This is shown in Fig. 27.
At Ross Bay, directions for the amalgamated sandstones are concentrated in the 025 -
085o range, shown as the backgroun grid in Fig. 27. The channel thalweg, and postulated former
thalweg positions, have been superimposed on the grid, with the channel sinuosity limited to the
025 - 085o range. The thin-bedded turbidites have the same vector mean, but a range of readings
from 325 - 135o (with one reading at 285o). These directions are interpreted to represent spillover
at channel bends (Fig. 27), with mudstones deposited even more distally than the thin-bedded
turbidites. Note that spillover diverges up to 50-60o on either side of the limits of channel sinuosity.
A similar diagram for Kilbaha is shown in Fig. 27. The background grid shows flow
directions for the amalgamated sandstones between 345 and 045o (perhaps 065o - see Fig. 24),
roughly defining the channel sinuosity. Spillover of thin-bedded turbidites is from 295 to 095o,
diverging about 50-60o on either side of the limits of channel sinuosity (the same relationship as at
Ross Bay).
Regardless of the local vector mean flow directions (010o at Kilbaha, and 046o at Ross
Bay), the channels appear restricted to a range of about 50-60o. The channel length divided by
the straight-line down-dip length, measured in Fig. 27, gives a (low) sinuosity of 1.12. The
overbank spill of thin-bedded turbidites is limited to about 50-60o beyond the limits of sinuosity.
Channel and spillover relationships are shown in Fig. 26. Arrows indicate overbank spill at
channel bends, and the megaflutes are interpreted as having formed by scouring at overspill
locations. Implied facies relationships and flow directions have been discussed above. The
sandbody geometry implied by this model is 1) a low sinuosity shoestring that formed as the
channel filled by vertical aggradation, and 2) spillover lobes that alternate from side to side of the
channel, and that generally become thinner-bedded and muddier diagonally away from the
channel. This model implies progressive loss of sand from the turbidity currents in the down
channel direction, due to spillover. The channel itself may become shallower downstream (as
suggested in Fig. 26) because of loss of sand and erosive power in the turbidity currents, and
24
Page 25
construction of smaller spillover lobes.
CHANNEL BELTS
There appears to be a larger scale variation of paleoflow directions associated with some of the
channels and packages. This can be seen, for example, in the succession about 45-80 m below
the R.pausicrenulatum marine band (just below the postulated R.circumplicatile marine band),
through a 30-40 m thickness of section that includes Kilbaha Bay (Fig. 4). At this stratigraphic
level, the Kilbaha flows are mostly northward, whereas the Gull Island and Kilcredaun flows are
eastward. The implication is that a stack of sinuous channels at Kilbaha all head roughly
northward, whereas a stack of packages at about the same stratigraphic level at Gull Island
consistently head eastward. The channels and associated packages thus appear to lie within a
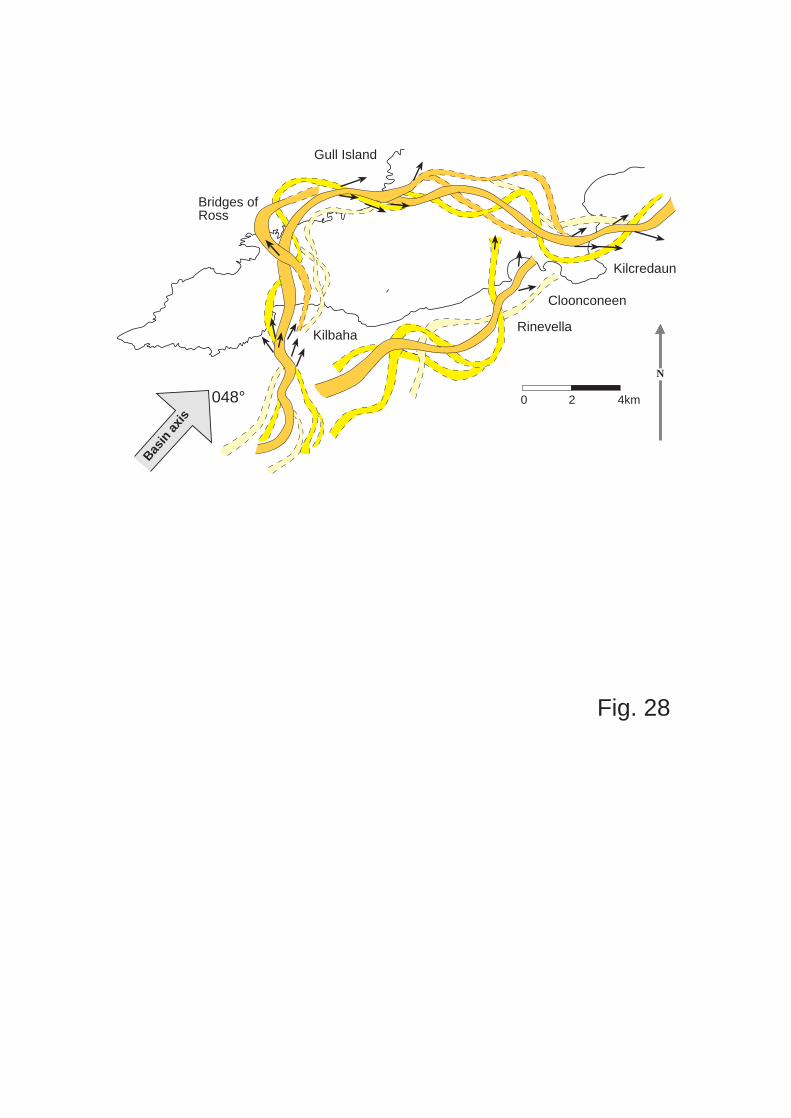
persistent channel belt, and the channel belt itself is sinuous, as shown in the interpretation of Fig.
28.
In this figure, the various locations are shown in correct geographic position, and the
overall vector mean flow direction (Fig. 2) has been superimposed as the basin axis. Only the
most generalized age relationships are implied by the positions of the channel belts. One channel
at Kilbaha is coloured orange, and overbank spill is shown by arrows. Other Kilbaha channels
within the channel belt are shown in yellow. Yellow and orange channels within the channel belt
are shown at Gull Island and Kilcredaun, preserving the general shape of the belt. Local channel
directions are accurate, as are the spillover arrows.
At Bridges of Ross, the channels are younger than those at Kilbaha. The diagram
presents one interpretation of northwestward flow at Bridges of Ross within the overall basin
setting, as well as a nearby northeastward flow in the channel at "Fisherman's Point". Similarly, for
older channels, a northward flow at Rinevella is shown adjacent to a northeastward flow at
Cloonconeen.
Similar sinuous channels in channel belts can be seen in 3-D seismic attribute maps from
offshore Angola (Fig. 29). Two sinuous belts can be seen, with the yellow and red colours
suggesting the latest and sandiest channel positions. Green and blue colours indicate former
channel patterns. Note that the youngest channel in each belt is less sinuous than the older
channels. Individual channel widths are 100 - 200 m, similar to the Ross channels, but the
sinuousity is greater in this Angolan example.
Deposition farther from channel belts
By restricting the sinuous channels to specific channel belts, with total aggraded thicknesses of 25
- 35 m, the question remains as to the style of deposition outside the belts (e.g., the central white
area in Fig. 29). In this figure, the flow directions at Kilbaha, Gull Island and Kilcredaun are from a
25
Page 26
30-m thick section of the upper Ross immediately below the circumplicatile marine band (Fig. 4).
In this section, note (Fig. 4) that channels and packages occur at Gull Island, Kilbaha Bay,
Kilcloher Head and Kilcredaun Point. However, the equivalent section at Cloonconeen consists of
unpackaged or poorly-packaged mudstones and thin-bedded turbidites. It is therefore suggested
that well-developed packages occur close (perhaps 1-2 km) to the channel belts, and that farther
from the belts, spillover results in random successions of unpackaged, finer-grained beds. The
randomness of these successions would largely result from different distances to specific sinuous
channels in the belt, as well as variations in sediment that spills over at cut bank and point bar
channel margins .
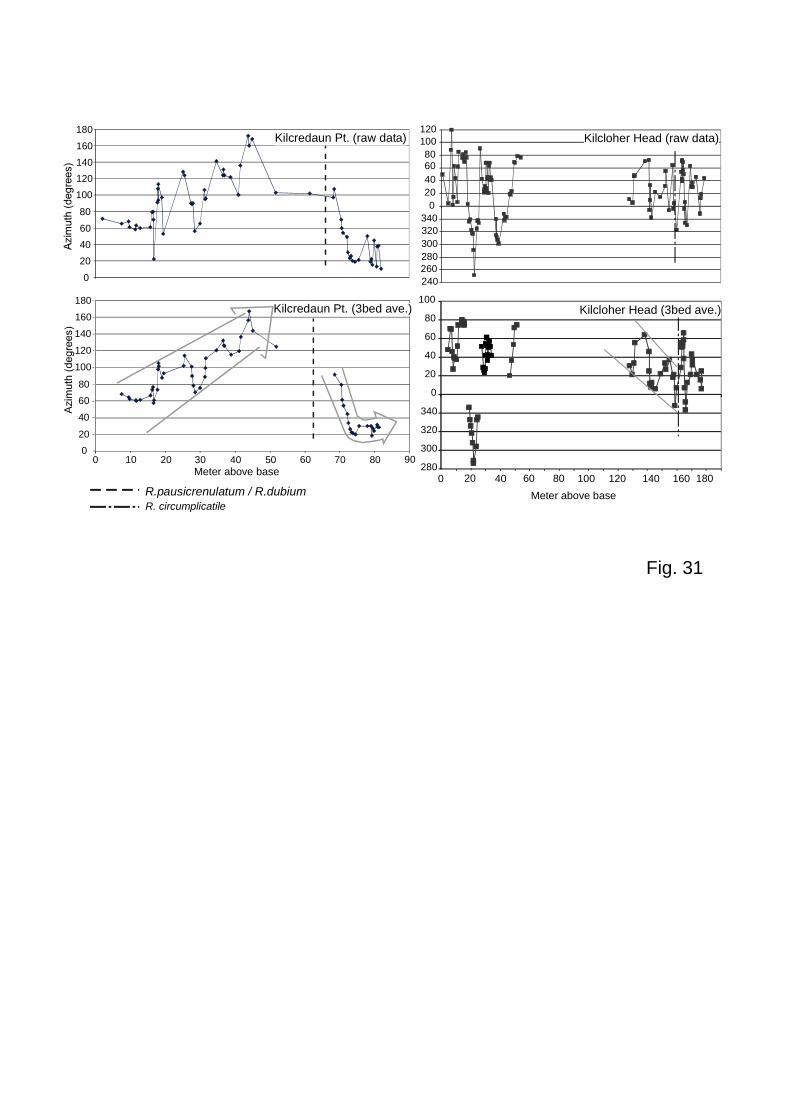
VERTICAL CHANGES IN PALEOFLOW DIRECTIONS
The depositional model has been developed without reference to long term vertical trends in
paleoflow. Vertical changes in the Ballybunion section were presented in Fig. 6, and similar trends
are illustrated from other sections. The trends must be interpreted in the light of the model
developed. In analysing the trends, it appears useful 1) to plot the raw data against their
stratigraphic position, 2) to examine the raw data for trends and discontinuities, and 3) to average
the flow directions using a 3-bed moving average through the trends, but not across the
discontinuities. These techniques have been applied at Ballybunion (Fig. 30), Ross Bay (Fig. 30),
Kilcredaun Point (Fig. 31), Kilcloher Head (Fig. 31), Toorkeal Bay (Fig. 32), Gull Island (Fig. 32)
and Cloonconeen Point (Fig. 33). The diagrams are self-explanatory. The major long-term trends
of paleocurrent change are shown with arrows, and the positions of marine bands, mudstone and
slump horizons are also indicated.
INTERPRETATION OF VERTICAL PALEOFLOW TRENDS
The paleocurrent data in Figs. 6 and 30 - 33 show trends (gray arrows) with superimposed "noise",
and abrupt changes of paleoflow between trends. In the light of the model developed above, the
"noise" can be interpreted as due to channel sinuosity and overbank spill.
Progressive trends in paleoflow
Progressive changes in flow direction are particularly well displayed at Ballybunion (Fig. 6),
Ross Bay (Fig. 30), Kilcredaun Head (Fig. 31) and Toorkeal Bay (Fig. 32). The amount of change
varies from 50o (upper trend at Ballybunion, Fig. 30) to 90o (lower trend at Ross Bay, Fig. 30).
The trends may be caused by processes entirely contained within the channel system (autocyclic),
or superimposed from outside (allocyclic).
The autocyclic interpretation is shown in a conceptual reconstruction of the sinuous
26
Page 27
channel belt (Fig. 34). It is suggested that progressive downstream and lateral shifts in position of
each sinuous channel will result in a gradual shifting of the entire channel belt. The resulting
vertical paleoflow changes are shown by three arrows in the centre-north part of the figure,
associated with positions 1 (red), 2 (blue) and 3 (green) of the sinuous channels. Note the gradual
shift in flow directions (the trend) from northeast (1), via north (2) to northwest (3). The "noise"
associated with this trend would reflect the local sinuosities and overbank spill directions
associated with the stack of channels.
Fig. 34 also shows the extent of well-developed packages, for a distance of 1 - 2 km from
the sinuous channel belt. The gradually fading colours indicate passage from amalgamated
sandstones into thin-bedded turbidites. Beyond these packages are areas characterized by
"unsystematic spillover" - non-packaged to poorly packaged successions whose almost random
facies sequences are due to shifts of individual sinuous channels, and various styles and volumes
of spillover at channel bends.
At Ballybunion, well developed paleoflow trends were defined in the lower Ross (Fig. 6)
where there are no packages and no channel fill deposits. The model can be used to explain
these trends autocyclically, by proposing that the trends reflect progressive changes in flow
directions on a smooth unchannellized basin floor, influenced by shifting mouths of sinuous
channels farther upstream. Note the change from channels 1, 2 and 3 sketched in the
northeastern part of Fig. 34.
The vertical trends in paleoflow might also be interpreted allocyclically. One way to do this
might involve gradual tectonic tilting of the basin floor. If this were the case, the flow trends in all
sections (Fig. 4) should be roughly the same at any stratigraphic level. This is clearly not the case,
except immediately above the dubium marine band, where an "easterly swinging to northerly"
trend has been documented at Ross Bay, Gull Island, Cloonconeen and Kilcredaun (Fig. 4). For
all of the Ross Formation, below the paucicrenulatum marine band, the autocyclic interpretation is
favoured.
Abrupt changes in paleoflow trend
Abrupt changes across marine bands are seen at Ballybunion (about 65 m, Figs. 6, 30, and at 358
m, Fig. 30), possibly at Ross Bay (51 m, Fig. 30), Kilcloher Head (160 m, Fig. 31), Kilcredaun
Head (62 m, Fig. 31), Gull Island (38m and 84 m, Fig. 32) and Cloonconeen Point (113 m, Fig.
33). One possible interpretation is that the basinal changes required for the development of
marine bands also involved the shifting of channel patterns, and the abrupt superimposition of a
new channel belt on top of an older one with a different flow direction. This is shown in the
southwestern corner of Fig. 34.
Abrupt changes in paleoflow direction are also associated with thick mudstone horizons
(Ross Bay, 24 m, Fig. 30) and slump/slide horizons (minor changes at Toorkeal Bay, 20m, Fig.
27
Page 28
32). At Toorkeal, flows were consistently in the 040-080o range below the slump, but become part
of a progressive change above the slump, with a shift from about 050 to 130o. It could be argued
that channel avulsions (Fig. 34, lower left) resulted in diversion of turbidity currents to other parts
of the basin floor, with mudstone deposition and changes in flow direction as a consequence of
avulsion. Alternatively, tectonic movements may have triggered slumps and locally blocked and
diverted some of the channels. Slump blockage and channel shifting has been documented on
the Rhone Fan (Droz and Bellaiche, 1985).
CONCLUSIONS
1 The Ross Formation can be divided into lower and upper parts. The lower Ross is
characterized by extensive tabular turbidites with no channels, and no small scale thinning- or
thickening-upward successions. The upper Ross is characterized by channels, thickening-upward
packages (2 - 4 m scale), and slump/slide horizons.
2 The channels are well displayed at five locations. They are up to 100 m wide, and have
fills 5 - 10 m thick. Facies relationships suggest that channel filling began with deposition of lateral
accretion deposits on the "point bar" side of the channel, with simultaneous erosion on the "cut
bank" side, and spill of mud and thin turbidites onto the overbank side. There was then a phase of
vertical accretion, with deposition of thick amalgamated sandstones. As the channel filled, more
and more sand spilled overbank, particularly on the cut bank side, forming channel margin
thick-bedded sandstones with megaflutes. These beds can be traced laterally from the channels
into the thick amalgamated turbidites that form the upper parts of packages.
3 Upper Ross packages consist (base to top) of mudstones, thin-bedded turbidites,
thick-bedded amalgamated turbidites and a sharp uppermost surface that is commonly scoured
and displays megaflutes. Paleoflow directions associated with the thick-bedded turbidites have a
much smaller range than those associated with the thin-bedded turbidites. Although the
megaflutes are prominent on the upper scoured surfaces, they also occur within the thick-bedded
amalgamated turbidites. This implies that the megaflutes are related to scouring at channel
margins, rather than forming from single, large, channel-initiating flows (as suggested by Elliott,
2000 and Elliott et al., 2000).
4 At certain correlative stratigraphic intervals about 30 m thick, flows may be geographically
variable - for example, consistently northward at Kilbaha Bay but consistently eastward at Gull
Island and Kilcredaun Point. Within the 30 m interval, there may be a stack of four or five
channels and/or packages. This suggests a persistent tendency for flows to head northward or
eastward through this stratigraphic interval, thus defining a sinuous channel belt composed of
stacked individual sinuous channels and packages.
5 It is concluded that on the largest architectural scale, the upper Ross Formation consists of
sinous channel belts with poorly packaged or non-packaged turbidites beyond the edges of the
belts. An individual channel belt may aggrade a few tens of metres before local avulsion or
28
Page 29
channel reorganization closer to source shifts the channel belt to a new position. A channel belt
consists of a stack of about four or five individual channels with their spillover lobes (packages).
The channels are about 100 m wide, or perhaps up to 200 m allowing for lateral accretion, and the
packages are 1 - 2 km wide. It follows that an individual channel-package system may be a little
over 4 km wide, and the stack of such channels may form a channel belt of the order of 5 km wide.
6 The Ross Formation is unusually well exposed, and can be reconstructed in three
dimensions. The reconstruction suggests that it should form an excellent outcrop analog for
sandy, sinuous channnel systems with sandy spillover deposits but no large muddy levees. Such
systems have been observed in 3-D seismic studies of West Africa and other continental passive
margin settings.
REFERENCES
Bakken, B. (1987) Sedimentology and syndepositional deformation of the Ross Slide, Western
Irish Namurian basin, Ireland. Unpublished Cand. Scient thesis, Geological Institute, University of
Bergen.
Chapin, M.A., Davies, P., Gibson, J.L. and Pettingill, H.S. (1994) Reservoir architecture of
turbidite sheet sandstones in laterally extensive outcrops, Ross Formation, Western Ireland. In:
Submarine Fans and Turbidite Systems, pp. 53-68. Gulf Coast Section, Society of Economic
Paleontologists and Mineralogists, 15th Annual Research Conference.
Collinson, J.D., Martinsen, O., Bakken, B. and Kloster, A. (1991) Early fill of the western Irish
Namurian basin: a complex relationship between turbidites and deltas. Basin Research, 3,
223-242.
Droz, L. and Bellaiche, G. (1985) Rhone Deep-Sea Fan: Morphostructure and Growth Pattern
AAPG Bulletin 69 Issue 1, 460-479.
Elliott, T. (2000) Megaflute erosion surfaces and the initiation of turbidite channels. Geology, 28,
119-122.
Elliott, T., Pulham, A.J. and Davies, S.J. (2000) Sedimentology, sequence stratigraphy and
spectral gamma ray expression of turbidite, slope, and deltaic depositional systems in an Upper
Carboniferous basin-fill succession, western Ireland. In: IAS Dublin September 2000. Field Trip
Guidebook (Ed. by J.R. Graham and A. Ryan), pp. 1-40. The Department of Geology, Trinity
College Dublin.
29
Page 30
Gill, W.D. (1979)
Gill, W.D. and Kuenen, P.H. (1958) Sand volcanoes on slumps in the Carboniferous of County
Clare, Ireland. Q.J. Geol. Soc. London, 113, 441-460.
Hodson, F. (1954a) The beds above the Carboniferous Limestone in northwest County Clare,
Eire. Q.J.Geol. Soc. London, 109, 259-283.
Hodson, F. (1954b) The Carboniferous rocks of Foynes Island, Co. Limerick. Geol. Mag., 91,
153-160.
Hodson, F. and Lewarne, G.C. (1961) A mid-Carboniferous Namurian basin in parts of the
counties of Limerick and Clare, Ireland. Q.J. Geol. Soc. London, 117, 307-333.
Kloster, A. (1987) Facies analysis of the Ross Formation: A turbidite sequence (Namur H2 Age).
The Western Irish Namurian Basin, Ireland. Unpublished Cand. Scient. thesis, Geological Institute,
University of Bergen
Martinsen, O.J. (1987) Sedimentary and syndepositional deformation of the Gull Island Formation
(Namurian R1), western Irish Namurian Basin, Ireland - with notes on the basin evolution.
Unpublished Cand. Sci. thesis, University of Bergen, Norway, 327 pp.
Martinsen, O.J. (1989) Styles of syndepositional deformation on a Namurian (Carboniferous)
delta slope, western Irish Namurian basin, Ireland. In: Deltas - Sites and Traps of Fossil Fuels
(Ed. by M.H. Whateley and T.T. Pickering). Spec. Pub., Geol. Soc. London, 41, 167-177.
Martinsen, O.J. and Bakken, B. (1990) Extensional and compressional zones in slumps and
slides - examples from the Namurian of County Clare, Ireland. J. Geol. Soc. London, 146,
153-164.
Martinsen, O.J., Walker, R., Lien, T (2000) Upper Carboniferous Deep Water Sediments,
Western Ireland: Analogues for Rifted Margin Turbidite Plays. GCSSEPM
Mutti, E. and Ghibaudo, G. (1972)Un esempio di torbiditi di conoide sottomarina esterna: le
arenarie di San Salvatore (Formazione di Bobbio, Micene) nell'Appennino di Piacenza: Memorie
dell'Accademia delle Scienze di Torino, Classe di Scienze Fisiche. Matematiche e Naturali 4, 16,
40p.
30
Page 31
Mutti, E. and Ricci Lucchi, F. (1972) Le torbiditi dell'Appennino settentrionale: introduzione
all'analisi di facies. Mem. Geol. Soc. Italy, 11, 161-199.
Rider, M.H. (1974) The Namurian of west County Clare. Proc. Royal Irish Academy, 74B,
125-142.
ROSS MANUSCRIPT - FIGURES
Fig. 1. Location map of Ireland, with square showing enlarged area of County Clare. Map below
shows the Loop Peninsula and Ballybunion areas, with the Ross Sandstone in yellow. All areas
mentioned in the text are shown.
Fig. 2. Ross Formation paleoflow, summarizing readings taken from 603 beds. Grand Vector
Mean is 048o.
Fig. 3. Stratigraphy of the Clare Basin and adjacent areas. See text for details in the Shannon
Estuary region.
Fig. 4. Measured sections of the Ross Formation. Locations shown on inset map, lower left.
Datum is taken as the R.dubium marine band, which is also the boundary of the Ross and Gull
Island Formations. Note that the complete Ballybunion section occupies two columns, with the
lower/upper Ross boundary in the right hand column. Scale is shown on left, with individual ticks
on sections 5 m apart. Note also that the horizontal scale on the sections represents bed
thickness, not grain size (which is a very uniform fine sand).
Fig. 5. Tabular turbidites at Ballybunion. Photo shows section from about 38 to 53 m (Fig. 4).
Fig. 6. Paleoflow at Ballybunion. 6A, raw data (91 paleoflow measurements) plotted against
stratigraphic position of the observation. 6B, 3-bed moving average of the raw data shown in Fig.
6A. The data below about 65 m were included in one moving average, and the data above 65 m
were included in a separate moving average. Background arrows suggest possible long-term
trends in the data. The apparent break between the two trends appears to coincide with the
position of the H.smithi / H. proteus marine band. 6C, same 3-bed moving averages as 6B, but
arrows show the possible interpretation of three trends rather than the two shown in 6B.
Fig. 7. Sandier- and thickening-upward packages at Kilcloher Head, about 30 m below the
interpreted position of the circumplicatile marine band (Fig. 4). There are no megaflutes on the
31
Page 32
scoured surface in the foreground.
Fig. 8. Megaflute at Ross Bay, with 15 cm scale in nose of flute. Fill begins with gray mudstones,
followed by a few thin-bedded turbidites, and capped by amalgamated sandstones.
Fig. 9. "Classic" megaflute at Ross Bay, about 10 m below the paucicrenulatum/dubium marine
bands (Fig. 4). Note that the sinuous crested ripples are eroded by the flute, and that the ripples
do not descend into the flute itself. The first sediment to line the flute is mudstone (indicated by
white arrow), which forms a thin layer beneath the turbidites with straight-crested ripples that onlap
the edges of the flute. Large red arrow shows paleoflow direction, metre scale in top left.
Fig. 10. Amalgamated sandstones at top of package at Ross Bay. A sketch of this package with
its megaflutes is shown in Fig. 13. The "classic" megaflute shown in Fig. 9 occurs on the top
surface of this package at the eastern (right) end of the outcrop. Note that megaflutes are not
restricted to the top surface of the package; three have been outlined within the amalgamated
sandstones, with a prominent mudstone lining on the upper one (flute locations in Fig. 13).
Fig. 11. Lateral variability within packages at Kilbaha Bay. Location of sections shown inset upper
left. Scale of bed thickness shown lower left. Details of facies relationships, megaflute surfaces
and channel (section CH) are discussed in the text
Fig. 12. Lateral changes in packages F, G+H, I, J+K and L at Kilbaha. Section numbers shown
along top, with spacing between them in metres. Spacing is to scale, except for packages I, J and
K where the scale has been increased bwteen the western channel margin and section 2. Within
beds, the numbers, e.g., 4.5-6(8), indicate average sandstone thickness - average mudstone
thickness (number of beds). Thus the 4.5-6(8) unit is 84 cm thick. Details of lateral relationships
of beds discussed in text.
Fig. 13. Lateral facies changes at Ross Bay, in package about 10 m below the
paucicrenulatum/dubium marine bands (Fig. 4). Megaflute 4 is the "classic" megaflute in Fig. 9,
and megaflutes 1 and 2 are shown in Fig. 10. Note the lateral thinning of the amalgamated
sandstones, and the splitting into thinner-bedded turbidites. Sketch is to scale, with 5x vertical
exaggeration.
Fig. 14. Sketches of stacked channels at Rinevella Point, Cloonconeen Point and Kilbaha Bay.
Rinevella and Cloonconeen are shown with a 2x vertical exaggeration, and Kilbaha with a 5x
exaggeration. See text for details.
32
Page 33
Fig. 15. Channel margin and spillover at Cloonconeen Point, with view approximately to west.
White line shows surface 2A, viewed from the channel toward the west. Megaflute arrowed is
about 25 m from western end of outcrop (Fig. 14). White line cuts down through the thickest
amalgamated sandstone (12.5 m level in Fig. 14) at 80 m from western end of outcrop (Fig. 14).
Note onlap of channel fill against this erosion surface below surface 3, and spillover and onlap of
higher beds (above surface 3) toward the west. The top of the channel fill passes into the top of a
package toward the west (Fig. 14).
Fig. 16. Base of channel at Rinevella Point rests on thick mudstone. First deposits above the
channel base consist of laterally accreting (L.A.) sandstone. The uppermost L.A. surface is
onlapped by the first vertical accretion sandstone (V.A., onlap to right) which passes into
mudstone up the channel wall (i.e., the lateral accretion surface). Bulk of channel fill consists of
amalgamated sandstones (left side of photo, 10 m thick).
Fig. 17. Sandstones onlapping the megafluted erosion surface, top of eastern channel at
Rinevella Point (Fig. 14).
Fig. 18. Eastern cliff face at Bridges of Ross, oriented 200-020o. Photo and sketch show multiple
small channel incisions marked by mudstone clast conglomerates. Paleoflow arrows are oriented
with respect to the orientation of the face (up the page = 020o). ST indicates small steps at the
base of channel 3. See text and Fig. 19.
Fig. 19. Sketch of blocky cliff at Bridges of Ross. Face on right is shown in Fig. 18, with ST
indicating the steps at the base of channel 3 (paleoflow 270-090, 270-090 and 275-095o). Channel
1 (circled) is cut by channel 2 (wall trends 330-150, 310-130 and 320-140o), and the margin of
channel 2 is well exposed on the west face of the cliff. Both channels 1 and 2 have multiple
internal surfaces marked by mudstone clast conglomerates. The rollout and spillover of the
channel 2 fill (Fig. 20) is indicated at the "channel-margin spillover". On the western side of the
outcrop small flutes occur on the base of the channel fill, with flow directions of 272, 275, 277, 280,
285, 290 and 290o.
Fig. 20. West facing cliff at Bridges of Ross (Fig. 19), showing wall of channel 2. Beds dip
steeply against the wall (defined by the truncation of sandstone on which field assistant sits), and
white arrows show beds spilling out of the channel and flattening into regional bedding outside the
channel.
Fig. 21. Photo and sketch of cliff at "Fisherman's Point" - note fisherman (and 10 m bar) for scale.
Surface 1 is almost planar and truncates folded rocks, so it is best interpreted as a thrust rather
33
Page 34
than a channel wall. Note onlap of thick amalgamated beds against surface 3, suggesting channel
incision. However, surface 3 is also mineralized and slickensided. The original channel wall has
formed a surface picked up by subsequent minor thrusting.
Fig. 22. Inaccessible ciff below Rehy Hill. Regional bedding is horizontal - note mudstones and
sandstones gently dipping to left at cliff top. The sandstones pinch out toward the top, and at the
lower downlap surface, giving sigmoidal bed shapes. Thickness of set of dipping beds about 6 - 8
m, and lenght of set about 200 m. Dipping beds are interpreted as lateral accretion deposits - see
text for details.
Fig. 23. Ballybunion slump/slide at Ballybunion. Only the upper, muddier part of the slump/slide is
shown. Note the thrusts developed within the mudstones (T), and the sandstone dikes (D) in the
lower part of the mudstones.
Fig. 24. Histograms of flow directions from Ross Bay (left) and Kilbaha Bay (right). Upper
histograms show data for the amalgamated thick-bedded facies, and lower histograms show data
for the thin-bedded facies. Note concentration of most of the data into a much narrower
paleocurrent range for the amalgamated thick-bedded facies.
Fig. 25. Two stage channel filling model. Phase 1 shows lateral accretion, minimal aggradation,
and spill of mudstones and thin-bedded turbidites over the cut bank. Phase 2 shows vertical
aggradation, with individual beds scouring into the cut bank, forming steps (Fig. 14). The fill
consists of amalgamated sandstones. The more the channel aggrades, the more scouring
(megaflutes) and spillover of thick-bedded amalgamated sandstones. The model is based on
detailed observations, and boxes give figure references to the constituent parts of the model.
Fig. 26. Block diagram showing development of spillover lobes. At cut-bank channel corners,
spillover forms amalgamated thick-bedded turbidites closest to the channel. These beds pass
laterally away from the channel into thin-bedded turbidites and mudstones. On point bar corners,
the spillover is probably muddier. Note the proposed association of megaflutes with channel wall
scouring and amalgamated sandstone deposition. Note also the small curves indicating a stepped
channel wall on the cut bank side (top of diagram). Not to scale - channel width before lateral
shifting is about 100 m, and sandy spillover deposits (orange and yellow) may be about 2 km
diameter.
Fig. 27. Interpretation of paleocurrent data (shown in histograms of Fig. 24) from packages at
Ross Bay and Kilbaha. The background grid shows the range of flow directions associated with
the data in the central part of the histogram for the amalgamated sandstone facies. It is assumed
34
Page 35
that the directions associated with this facies represent those of the channel thalweg and the most
proximal overbank spill (Fig. 26). The thalweg, and former thalweg positions, are shown within this
grid. The wider spread of directions associated with the thin-bedded turbidite facies represents
increasing divergence of the overbank spill thin-bedded turbidites from the thalweg trend. Limits of
spill agree with limits of data in histograms (Fig. 24).
Fig. 28. Stacks of channels and packages at Kilbaha have northerly flow directions, whereas at
the same stratigraphic interval (see text) they have easterly flow directions at Gull Island and
Kilcredaun. This can be interpreted in terms of sinuous channel belts, shown in orange and yellow
colours. Note that at a different stratigraphic interval, the sinuous channel belt model
accommodates northwestward and northeastward flow directions for channels at Bridges of Ross
and "Fisherman's Point". At yet another stratigraphic interval, the model accounts for northerly
and northeasterly directions at Rinevella and Cloonconeen. The various locations are shown in
with reference to an outline of the Loop Peninsula, and the overall 048o paleoflow direction for the
Ross Formation is shown as the Basin Axis.
Fig. 29. Sinuous channels belts seen in a reflection strength seismic attribute map from offshore
Angola. Flow is toward upper right. Note the individual channels within the channel belts, and the
tendency for the latest channels (red and yellow colours) to follow straighter paths than the earlier,
very sinuous channels )see pronounced meander loops and point bars in lower left).
Fig. 30. Paleocurrent data and 3-bed moving average trends for Ballybunion and Ross Bay. At
Ballybunion, 30 readings were taken in the upper part of the section. Flow directions appear to
change abruptly across the inferred poaition of the circumplicatile marine band, but there are no
long terme trends of paleocurrent change. At Ross Bay, readings were taken on 74 beds. There
is clearly a discontinuity at about 23 m, across the Ross Slide (Fig. 4), with one well developed
long-term trend below the slide, and two trends above the slide (separated by the
paucicrenulatum/dubium marine bands).
Fig. 31. Paleocurrent data and 3-bed moving average trends for Kilcredaun Point and Kilcloher
Head. At Kilcredaun Point, 59 beds were measured. The 3-bed moving averages reveal two long
term changes in paleocurrent trends, one below and one above the paucicrenulatum/dubium
marine bands. At Kilcloher Head, 104 beds were measured. The lower part of the section is
characterized by 90o shifts in flow directions between groups of beds (northeast to northwest), with
internal changes of 30-40o within each group. The data in the upper part (125-159 m) shows a
gradual change from 050 to 010o, but no trend can be seen above the inferred position of the
circumplicatile marine band.
35
Page 36
Fig. 32. Paleocurrent data and 3-bed moving average trends for Toorkeal Bay and Gull Island. At
Toorkeal Bay, 37 beds were measured. There may be discontinuities across the slumped
horizons, and there is a definite trend in the upper 25 m of the section. At Gull Island, 52 beds
were measured. There appear to be two groups of data, separated by the R. circumplicatile
marine band, but no long term trends in paleoflow directions are apparent.
Fig. 33. Paleocurrent data and 3-bed moving average trends for Cloonconeen point. Readings
were taken on 23 beds. No long term trends can be seen.
Fig. 34. Conceptual model of a sinuous channel belt, passing downstream into an unchannellized
basin floor. Only three channels are shown within the belt, numbered 1 through 3 and coloured
red, blue and green. Each channel has overbank spill lobes at channel bends - some, but not all
of these are shown. Northward flows and preponderance of spillover lobes (packages) are shown
diagrammatically for Kilbaha Bay, and eastward flows are suggested for Gull Island.
Northwestward and northeastward flows are shown at Bridges of Ross, and unconfined tabular
turbidites are shown at Ballybunion. Abrupt paleoflow changes may result from avulsion and/or
changes in relative sea level associated with marine bands. In some of the sections, prominent
long term trends of paleoflow direction were shown (e.g., Fig. 30) - these trends are indicated by
curved arrows, and are interpreted to be the result of progressive downdip movement of sinuous
channel belts, or progressive changes in the direction of supply to the basin floor (top right).
Table 1. Thicknesses of units of mudstones and thin-bedded turbidites, and units of amalgamated
thick-bedded sadnstones within 126 packages.
Table 2. Average thicknesses of individual beds within packages.
36
Page 37
Table 1
130 cm (23-612): 125 units115 cm (10-420): 126 unitsALL DATA
48 cm (23-60): 11 units 84 cm (19-207): 11 unitsKilcredaun 14mabove marine band
71 cm (29-196): 22 units111 cm (18-242): 23 unitsBridges of Ross 42mbelow marine band
154 cm (70-210): 5 units 69 cm (20-128): 3 unitsBridges of Ross below slide 10,5m
114 cm (25-264): 20 units 73 cm (10-216): 19 unitsKilbaha42 m section
225 cm (52-612): 14 units173 cm (60-420): 13 unitsRoss Bay66,5 m section
227 cm (140-394): 9 units211 cm (65–403): 9 unitsToorkeal Bay46,5 m section
122 cm (30-273): 23 units 95 cm (19-304): 24 unitsKilcloher Headupper 52 m of section
145 cm (26-521): 21 units122 cm (16-399): 24 unitsKilcloher Headlowest 61m of section
Amalgamated sandstones:
average unit thickness (range) and
# units
Thin-bedded turbidites and
mudstones: average unit thickness
(range) and # units
Sections
Page 38
Table 2
619649723~127,11468~6,55,2ALL DATA
699555263,119,01145,84,4Kilcredaun 14mabove mar.ba.
709753753,220,23186,84,2Kilcredaun 42mbelow mar.ba.
969990282.717.7162.83.9Bridges of Rossabove slide 24m
282.717.7282.83.9Bridges of Rossbelow slide 11m
849965287trace31.14353.25.3Kilbaha 42m section
5799451421.221.01496.85.6Ross Bay 66,5m section
618444571.230.62074.55.7Toorkeal Bay46,5m section
709842802,936,62019,96,3Kilcloher H.(lowest 60m)
5214,1Ballybunion145 m section
Total%
Thick%
Thin%
No.beds
Mst (cm)
Sst (cm)
No.beds
Mst (cm)
Sst (cm)
centperSand Thick amalgamated
sandstones
Thin-bedded turbidites and
interbedded mudstonesSections
N.B. It is a coincidence, not an error, that both the two rows at Bridges of Ross, and thetwo at Kilcredaun are so similar
Page 39
Fig. 1
Ennis
Detailed map
0 10km
0 2 km
Loop Head
Kilbaha BayKilcloherHead
RinevellaPoint
Ross Bay
Bridgesof Ross
ATLANTIC
Carrigaholt
KilcredaunPoint
Castle
Ballybunion DoonMouth of the Shannon
ClooconeenPoint
Fisherman`sPoint
Gull Island
Rehy Cliffs
Leck Point
Toorkeal Bay
Kilrush
Kilkee
Ballybunion
Foynes
Fisherstreet
Cliffs ofMoher
Loop Head
COUNTY KERRY
COUNTY
CLARE
ATLANTIC
OCEAN
Shannon Estuary
Tullig Cyclothem
Ross Formation
Dinantian limestone
Clare Shales
Gull Island Formation
Undivided Namurian
Namurian basin outline
Formation boundary
LEGEND
Ireland
LOCATION MAP
Page 40
Ross Formation - raw data
S
N
EW
Maximum Percent 20Vector Mean 47.88Consistency Ratio 0.7073
Equal Area PlotNumber of Points 603
Fig. 2
Page 41
Collap
sing
Iapetu
s Sutu
re
60 km 80 kmN S
Upper
0 40km
North Clare
North Cork
Namurianoutcrop
ShannonEstuary
500m
0
North Clare Shannon Estuary region North Cork(Morton, 1965)
R. stubblefieldi
R. paucicrenulat. - R. subreticulat.
R. stubblefieldi
R. paucicrenulatum-R. dubium
Hd. proteus/H.smithi
TULLIG CYCLOTHEM
GULL ISLAND FORMATION
ROSS FORMATION
CLARE SHALES
CA
RB
ON
IFE
RO
US
SIL
ES
IAN
Nam
uria
nD
INA
NT
IAN
Vis
ean
Carboniferous Limestone
SH
AN
NO
N G
RO
UP
CE
NT
RA
L C
LAR
E G
RO
UP
Zone
R2a
-R2c
R1a
-R1c
H2a
-H2b
E1a
-H
1b
CUMMER FORMATIONROSS FORMATION/CLARE SHALES EQUIV.
ROSS FORMATION
Hd. proteus/H.smithi
Fig. 3
Lower
Page 42
Fig 4
“paucicrenulatumslump/slide”
Ross Formation
Clare Shales
scale on sections
Mud clast breccia
Slump direction,folds or faults
Bridgesof Ross
KilcloherHead
Toorkeal
Gull Island Formation
R. circumplicatile
D5
D6
Rinevella
Wall
Ch.wall
15
Kilcredaun
Ballybunion
Ross Bay
Kilbaha
Gull Island
ClooconeenRinevellaKilbaha
Thin-bedded sandstones and mudstons
Amalgamated sandstones
MudstonesSlump horizon
Paleoflow direction
Correlation lines
Marine bandsIdentifiedPostulated
Thickening upward succession
Major channels
Ballybunionlower part
Kilcloher HeadBridges of Ross Kilcredaun Ballybunionupper part
Kilbaha Bay
Toorkeal Bay
Ross Bay
R. paucicrenulatum
R. circumplicatile
R. dubium
Ht.prereticulatus
marine band
Ross Fm.
Clare shales
H. smithi
Castle
R. paucicrenulatum/R. dubium
Clooconeen
Fisherman`sPoint
ChannelPoint
“paucicrenulatum”slump/slide
Rossslide
Ballybunionslump/slide
Gull Island
0m
50m
100m
20 40 8060 100+MstBed thickness (cm)
Page 44
Fig. 6
South
West
North
South
West
North
A
0
20
40
60
80
100
120
140
160
180
200
B
0
20
40
60
80
100
120
140
160
180
Meters above base
South
West
North
H. smithi marine band
C
0
20
40
60
80
100
120
140
160
180
0 10 20 30 40 50 60 70 80 90 100 110 120 130 140 150
Page 45
12
3
41
2
3
Scoured surface with giant flutes
Package 3
Package 1
Package 2
Fig. 7
Page 49
F
E
1DDC
B
A
G
IJ
I
K
LMN
O2
P
R
Q
O1
O3
W E
1
CH 2
3A3B
4B 4C
6
3C
7
0m 200m 400m 600m 800m 1000m 1200m 1400m
H
Fig. 11
Ross Formation500 m
Kilbaha
Kilbaha Bay
Kilcloher Head
1 CH2 2 3A3B 3C 4B 4C 6
7Cloghaunbeg
Location of sections
Amalgamated sandstones
Thin-bedded turbidites and mudstones
Erosional surfaces with megaflutes
Mud conglomerate
Paleoflow directionsTop packages correlation surfaces
MST5 10 20 40 60 cmBed thickness
Page 50
0
1
2M
4C4B3C3B3A 6176m170m 180m 140m 162m
60-0(3)
22-0(9) 65-0(3)
22-0(7)
3-1(15)14-0(6) Pac
kag
e L
4.5-4(7)
5.5-10(6)
Scour intoPackage K
98-0(2)
4-4(5) 4.5-6(8)
35-0(2)
Scour belowPackage M
2.5-3(7)
4C176m
4B3C3B170m 180m 140m 162m
26-0(6)
20-0(6)24-0(3) 118-0(1)
12-0(5)
5-3(5)12-4(4)
9-4(6)
0-10(0)0-11(0)
? Splitting
Pac
kag
e I
Pac
kage
not
exp
osed
35-0(4)
3A160m 170m375m
3B3A21
20-1(6)11-0(5) 7-0(15) 25-0(2)
2-5(7)
3-3(10)4-5(13) P
acka
ge
FFewer, thinner
Thin-bedded turbidites3.5-2(12)
Scour on top ofPackage E
176m170m 180m 140m 162m160m120m90m
4C4B3C3B 63A2CH
0
1
2
M
3
4
5
6
26-0(4)
87-0(4)
WesternChannelMargin
35-0(5)
47-0(2)
23-0(1)
16-0(9) 10-0(10)
17-0(8) 29-0(6)
6-0(6)0-12(0) 7-0(9)
Package I
7-35(4) 6-1(7)
41-0(3)145-0(1)44-0(3)
15-3(5)
5-5(3)
53-0(2)
?
Package LCovered
Scourbelow
PackageL
Pac
kag
e K
Pac
kag
e I
Package J
Channel fil
Pac
kage
K
ss
ss
ss
ss
ss
s
s
ss
ss
ss
ss
s
s sss
0-10(0)
0
1
2M
SplittingSplitting
170m 180m160m
11-0(6)16-0(5)
71-0(2)69-0(1)
Pac
kag
e G
+ H
34-0(2)
2-23(1)
3-5(7) 1-13(3)
49-0(2)P
acka
ge H
Pac
kage
G
2.5-8(6)
3C3B3A2
Amalgamated bedsThin-bedded turbiditesMudstones
Fig. 12
Page 51
Fig. 13
43
21
Amalgamated sandstones
Mudstones and thin-bedded sandstones
Thin-bedded sandstones Measured sections
Lateral thinning and splitting of amalgamated unit
012345
M
2 140m 50m 100m 150m 200m 250 m
(x 5 vertical scale)3
3
Page 52
Section 2
20
15
10
5
0
EASTERN CHANNEL
WESTERN CHANNEL
3
Section CH2
25
Meter
25
20
15
10
5
0
W EMeter
Covered
Gul
ly
202
15
0 10 20 30 40 50 60 70 80 90 100 110 120 130 140 150 160 170 180 190 200 210 220 230 240 250 260 270 280 290 300 310 320
1
? ?
I
H
G
K
L
F
MeterWMeter
Covered
Rinevella Bay 2 x vertical scale
low tide level
4
I
L
GH
J
E6
4
2
0
6
4
2
0
Kilbaha Bay 5 x vertical scale
0 10 20 30 40 50 60 70 80 90 100 110 120 130 140 150 160 170 180 190 200 210 220 230 240 250
15
10
5
0
2B
2A
I
II
W EMeter
1
3
Meter
Covered
0 10 20 30 40 50 60 70 80 90 100 110 120 130 140 150 160 170 180 190 200
15
10
5
0
Clooconeen Point 2 x vertical scale
III
2b
2a
Thickening upward package
MudconglomerateMudstone and thin-bedded turbidites
Amalgamated turbidites
Erosional surface
Paleoflow direction
Thin-bedded turbidites
Fig. 14
Page 53
Fig. 15
Channel topSpilloverPackage top
Megaflute
Package
2a
3
Page 54
Fig. 16
Fig. 17
Mudstone
L.A.
V.A.
Page 55
200S 20N
20
279280
310
10 m
10 m
ST.
paleoflow direction
ST.
Fig. 18
Page 56
Amalgamated bedschannel fill
Packages, tabular
Mud conglomerates
Paleoflow direction
020°Channel-marginspillover
N0
10 m
12
3 ST.
Fig. 19
Page 58
NW SE
10 m
Fig. 21
3
1
1
2
Fallen blocks
Page 61
Fig. 24
0
5
10
15
20
25
30
35
0
5
10
15
20
25
30
35
285 305 325 345 5 25 45 65 85 105 1250
5
10
15
20
25
30
35
0
5
10
15
20
25
30
35
Vector mean006°
Amalgamatedsandstones
Rea
ding
s (p
erce
nt)
62%
KILBAHA BAY
Azimuth (degrees)
Vector mean015°
Thin-beddedturbidites
Rea
ding
s (p
erce
nt)
56%
295 315 335 355 015 035 055 075 095
64%
Thin-beddedturbidites
Azimuth (degrees)
Vector mean047°
88%
Amalgamatedsandstones
Vector mean053°
ROSS BAY
n=81 n=73
Page 62
Amalgamated beds
Thinbedded turbiditesThick to thin-bedded turbidites
Mudstones
Fig. 25
PHASE 1
Thin-bedded turbidites
Overbank spill duringlateral channel migration
Sandstones and mudstones on gently-dipping lateral accretion surface
Lateral migration with minimumchannel floor aggradation
Verticalaggradationmostly mudstone
Amalgamated turbidites
Lateral Accretion distance
Mudstones
Lateral Accretion distanceLateral Accretion distance
Giant flutes within amalgamatedsandstones and on erosional by pass surface
Thick bedded fill oncut-bank side of channel
Mudstone drape onby-pass surface
Surface of erosionalby-pass with giant flutes
Onlap of verticalaccretion deposits
Sandstones pass laterally into mudstonesas they onlap the lateral accretion surface
Lateral accretion deposits
AM
AM
PHASE 2
Completesandier-upward package Rinevella Figs.16,17
Rehy Cliff Fig.22Clooconeen Fig.14,15
Ross Bay Fig.10,13
Page 63
Fig. 26
Amalgamated thick-bedded turbidites
Overbankmudstones
Giantflutes
Overbankmudstones
Thin-beddedturbidites
Page 64
345° 035°
095°
035°
065°
Spillover-mudstones
Spillover-thin-bedded
turbidites
295°
Form
er th
alw
eg
Thal
weg
Spillover-thin-bedded
turbidites
Vektor mean013°
KILBAHA BAY
Spillover-mudstone
Spillover-thin-bedded
turbidites135°
Form
er th
alw
egs
Thal
weg
285°325°
085°
Spillover-thin-bedded
turbidites
Mudstones025° Vector mean
046°
ROSS BAY
Fig. 27
Page 65
Fig. 28
Basin
axi
s
0 2 4km
Kilbaha
Bridges ofRoss
Rinevella
Cloonconeen
Kilcredaun
Gull Island
N
048°
Page 67
mudslump
R. dubium
R. paucicrenulatum
R. circumplicatile
Ht. prereticulatus
Fig. 30
260 280 300 320 340 360 380 400 420 440 460Meter above base
3203400
20406080
100120140160
Meter above base
0 10 20 30 40 50 60 70 80320
340
0
20
40
60
80
100
120
140
160
280300320340
020406080
100120140160180200
BALLYBUNION
ROSS BAY (Raw data)
ROSS BAY (3bed ave.)
Page 68
R. circumplicatile
0 10 20 30 40 50 60 70 80 900
20
40
60
80
100
120
140
160
180
0
20
40
60
80
100
120
140
160
180
240260280300320340
020406080
100120
1800 20 40 60 80 100 120 140 160
Kilcloher Head (raw data)
Kilcloher Head (3bed ave.)
Kilcredaun Pt. (raw data)
Kilcredaun Pt. (3bed ave.)
280
300
320
340
0
20
40
60
80
100
Fig. 31
Meter above base
Meter above baseR.pausicrenulatum / R.dubium
Page 69
50
R. pausicrenulatum / R.dubium
R. circumplicatile
340
0
20
40
60
80
100
120
0 20 40 60 80 100Meter above base
320
340
0
20
40
60
80
100
120
140Gull Island (raw data)
Gull Island (3bed ave.)
340
0
20
40
60
80
100
120
140
160
180Toorkeal Bay (raw data)
0
20
40
60
80
100
120
140
160
0 10 20 30 40
Meter above base
Toorkeal Bay (3bed ave.)
Fig 32
Page 70
Fig 33
R. posicrenulatum / R.dubium
R. circumplicatile
320
340
0
20
40
60
80
100
120
140
0
20
40
60
80
100
120
0 20 40 60 80 100 120 140 160
Clooconeen Pt. (raw data)
Clooconeen Pt. (3bed ave.)
Meter above base
Page 71
Fig. 34
Sinuous beltRe-established aftersea level fluctuation(marine band)
Gull Island
Sinuous belt ofchannels and packages
Kilbaha Bay
Area of non-packagedand poorly packagedtabular turbidites
Abrupt Paleoflowchange
Systematictrend ofPaleocurrent change
Transitionto basinfloor
Bridges of Ross
Area ofnon-packaged andpoorly-packagedtabular turbidites
Systematictrend ofPaleocurrent change
Non-packagedtabular turbidites
Sinuous belt width ~ 5 km
Ballybunion
Avulsion