Page 1
1
Warsaw University of technology Katholieke Hogeschool Brugge-Oostende
Faculty of Power and Department Industriële wetenschappen
Aeronautical Engineering & Technologie
Nowowiejska 21/25 Zeedijk 101
00-665 Warsaw 8400 Oostende
Poland België
Turbofan design for the commercial aircraft
Written by:
Hans De Ryck
Promoter : Prof. D.Sc. Ph.D. Andrzej Teodorczyk
Reviewer : Ph.D. Eng. Miroslaw Muszyński May 2008
Page 2
2
Contents
1. Statement ............................................................................................................................... 6
2. Abstract ................................................................................................................................. 6
3. Introduction ........................................................................................................................... 7
Software used for calculations .................................................................................................. 8
4. List of symbols ...................................................................................................................... 9
5. Review of the turbofan engines used to power the A380 airplane ................................ 12
Pratt & Whitney GP 7000 .................................................................................................... 15
Technical description of the GP 7000 .............................................................................. 16
Emissions ................................................................................................................................ 20
Noise ....................................................................................................................................... 20
LPT ......................................................................................................................................... 21
6. Rolls-Royce Trent 900 ....................................................................................................... 22
Technical description of the TRENT 900 ............................................................................ 26
Fan system ........................................................................................................................... 26
Compressor ......................................................................................................................... 26
Combustor ........................................................................................................................... 27
Turbines .............................................................................................................................. 27
Contra-rotation .................................................................................................................... 28
Health monitoring ............................................................................................................... 28
Predictability ....................................................................................................................... 29
7. Comparison of engine characteristics .............................................................................. 30
Aircaft performance ............................................................................................................. 31
Characteristics of the commercial aircraft equipped with turbofan engines. ................. 31
Relationships for performance of an aircraft .................................................................... 32
Lift and drag .......................................................................................................................... 32
Lift-drag polar ................................................................................................................... 36
Determination of Stall, Take-off speed and Landing speed ....................................... 37
Fuel Consumption: ................................................................................................................ 39
Estimation of the TSFC ........................................................................................................ 40
Endurance .............................................................................................................................. 41
Range ...................................................................................................................................... 42
CL/CD - relationship ............................................................................................................... 45
Page 3
3
8. Schematic diagram of a high Bypass ratio turbofan engine. ...................................... 47
9. Parametric cycle analysis of ideal engines....................................................................... 48
Equations used in Parametric cycle analysis of ideal engines ........................................... 48
Total pressure .......................................................................................................................... 49
Ratios ...................................................................................................................................... 49
Total / static temperature ratio – free stream........................................................................... 50
Total / static pressure ratio – free stream ................................................................................ 50
Burner exit / ambient enthalpy ratio ........................................................................................ 50
Assumptions of ideal cycle analysis ..................................................................................... 51
Design inputs........................................................................................................................... 52
Parametric cycle analysis for the ideal turbofan engine .................................................... 52
Assumption for ideal cycle analysis ..................................................................................... 52
The thrust of the ideal turbofan engine is ............................................................................ 53
The core stream of the turbofan engine ............................................................................... 53
The law of energy for the steady state flow applied on the burner ..................................... 54
Defining fuel to air ratio ...................................................................................................... 55
Output power of the turbine ................................................................................................ 55
Power required to drive the compressor .............................................................................. 55
Power required to drive the fan ........................................................................................... 55
Specific thrust of the ideal turbofan .................................................................................... 56
Thermal efficiency of the ideal turbofan ............................................................................. 56
Thermal efficiency of the ideal turbofan ............................................................................. 56
Thrust ratio .......................................................................................................................... 57
Optimum Bypass Ratio ....................................................................................................... 57
Optimum Fan pressure Ratio ............................................................................................. 58
Description of the Computer calculated performance for an ideal turbofan engine using the PARA v3.10 program ..................................................................................................... 58
Calculation of the ideal engine parameters ........................................................................ 63
Input data for the PARA program ...................................................................................... 63
Results obtained from the PARA program........................................................................ 63
Calculation of the minimum specific thrust at cruising speed M = 0,83 ............................ 65
Determination of the maximum airflow in the engine ........................................................ 66
Calculation of the maximum allowable uninstalled thrust specific fuel consumption ........ 67
10. Engine component performance ...................................................................................... 67
Page 4
4
Assumptions for the turbofan engine cycle analysis with losses ....................................... 69
Formulas used in the analysis of the real engine ..................................................................... 69
Engine core stream .................................................................................................................. 70
Application of the first law of thermodynamics to the burner ............................................ 71
Isentropic turbine efficiency ............................................................................................... 73
Compressor Temperature ratio in faction of compressor pressure ratio ............................ 73
Isentropic compressor efficiency ........................................................................................ 73
Temperature ratio of the combustion chamber ................................................................... 73
Fan temperature ratio .......................................................................................................... 73
Fan polytropic efficiency .................................................................................................... 73
Engine thermal efficiency ................................................................................................... 74
Engine propulsive efficiency ............................................................................................... 74
Description of the Computer calculated performance for a real turbofan engine using the PARA v4.0 program ....................................................................................................... 75
Calculation of the real engine parameters .......................................................................... 78
Input data for the PARA program ...................................................................................... 78
Results obtained from the PARA program........................................................................ 80
Engine performance analysis .................................................................................................. 81
Reference values for engine performance analysis ................................................................. 83
Assumptions for engine performance analysis....................................................................... 84
Performance of the turbofan engine ........................................................................................ 84
Formulas used for engine performance analysis ................................................................... 85
Low pressure compressor (��� , ���) ................................................................................ 86
Low pressure turbine (��� , ���) ....................................................................................... 86
Bypass ratio αααα .................................................................................................................... 87
Engine core stream .............................................................................................................. 87
Engine Fan stream ............................................................................................................... 87
Engine mass flow ................................................................................................................ 87
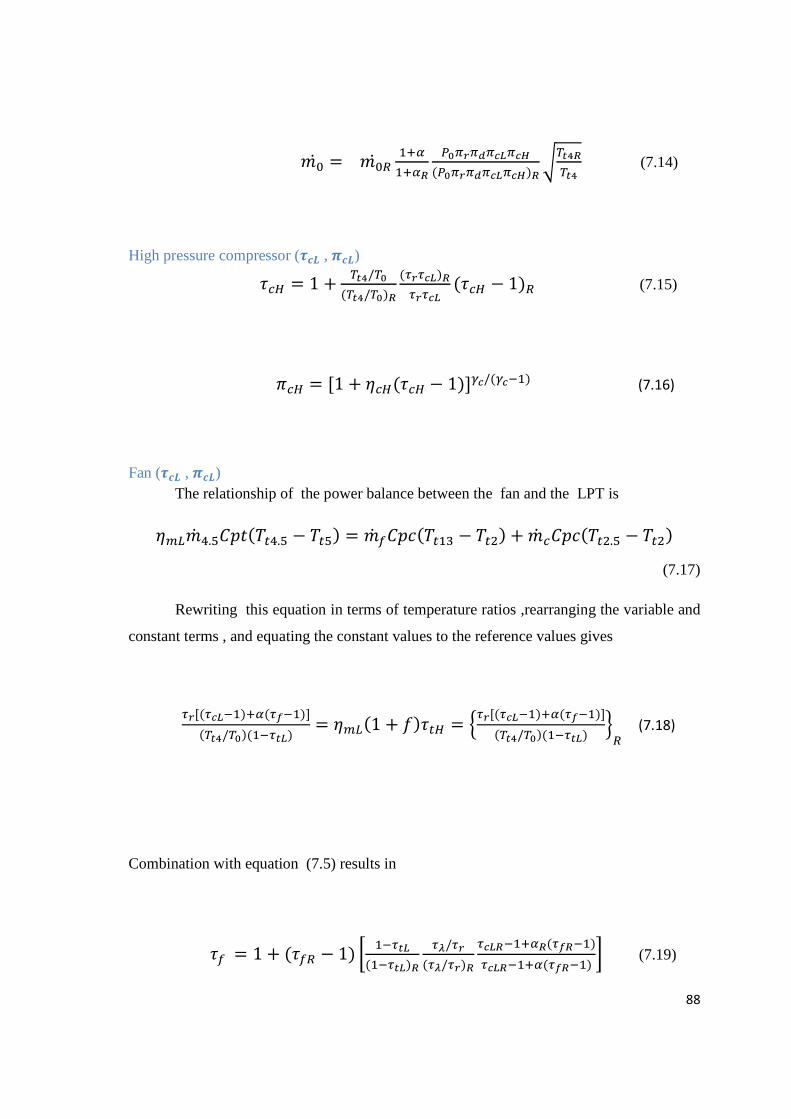
High pressure compressor (��� , ���) ............................................................................... 88
Fan (��� , ���) ................................................................................................................... 88
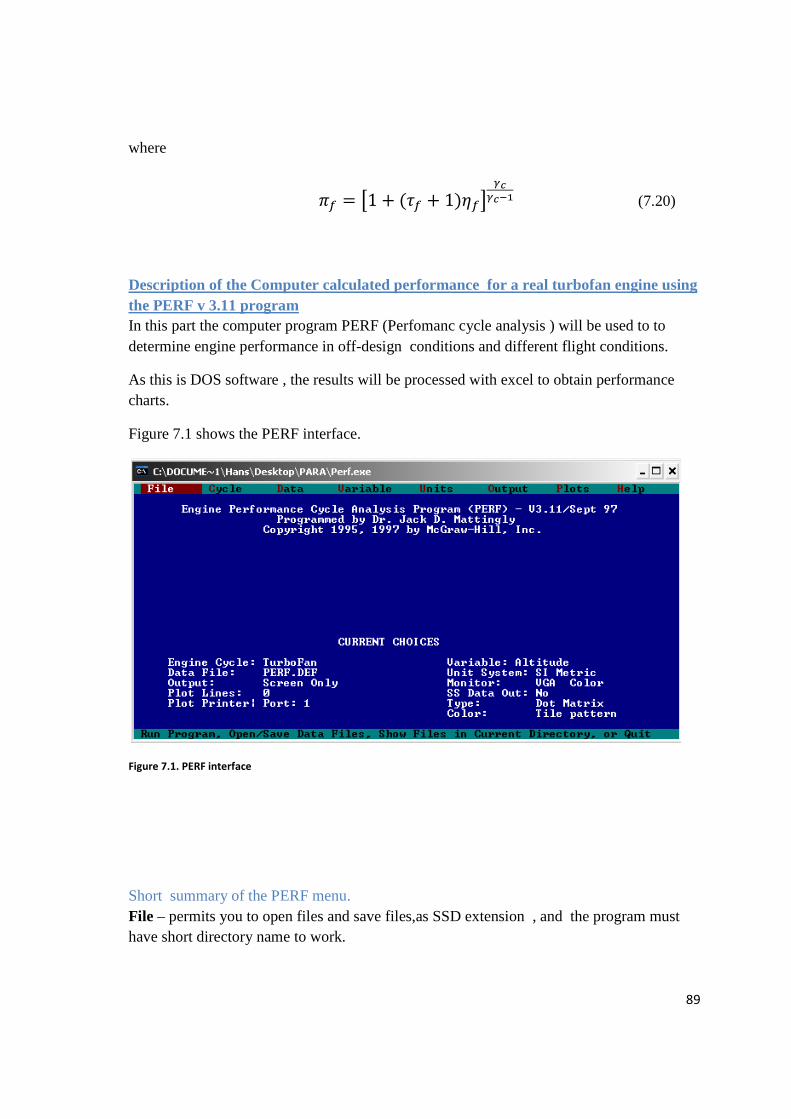
Description of the Computer calculated performance for a real turbofan engine using the PERF v 3.11 program .............................................................................................................. 89
Short summary of the PERF menu. .................................................................................... 89
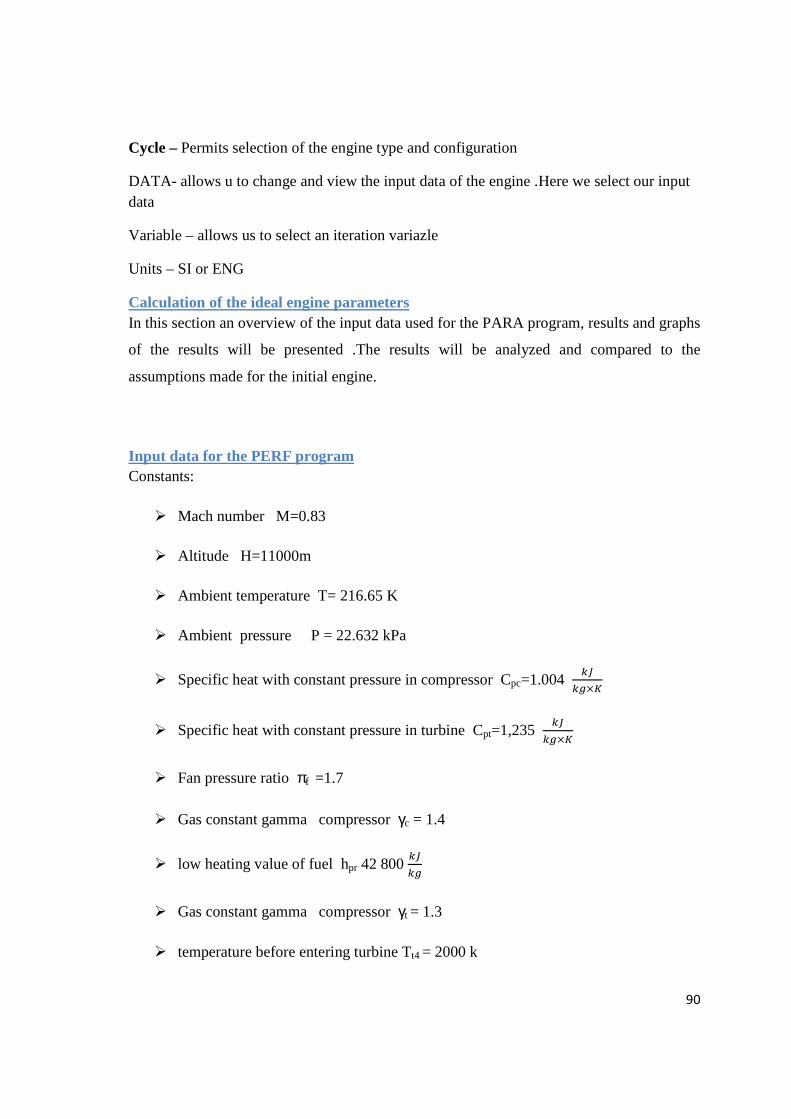
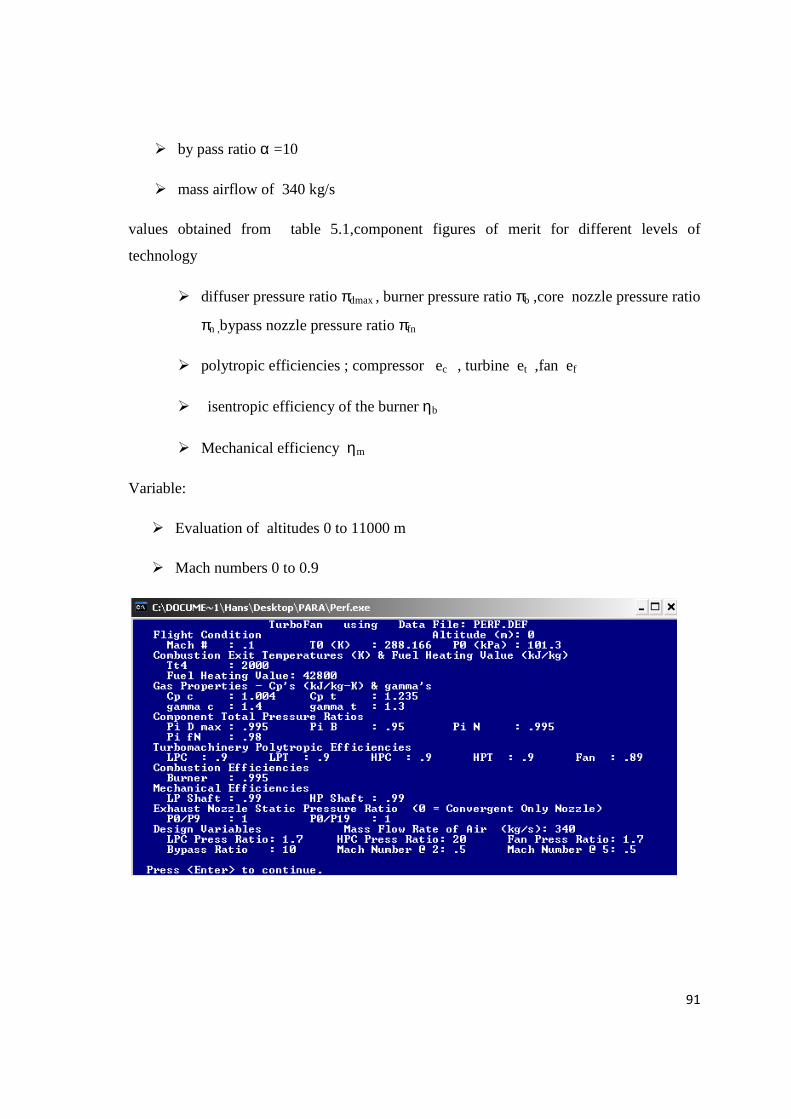
Calculation of the ideal engine parameters ............................................................................. 90
Input data for the PERF program ............................................................................................ 90
Page 5
5
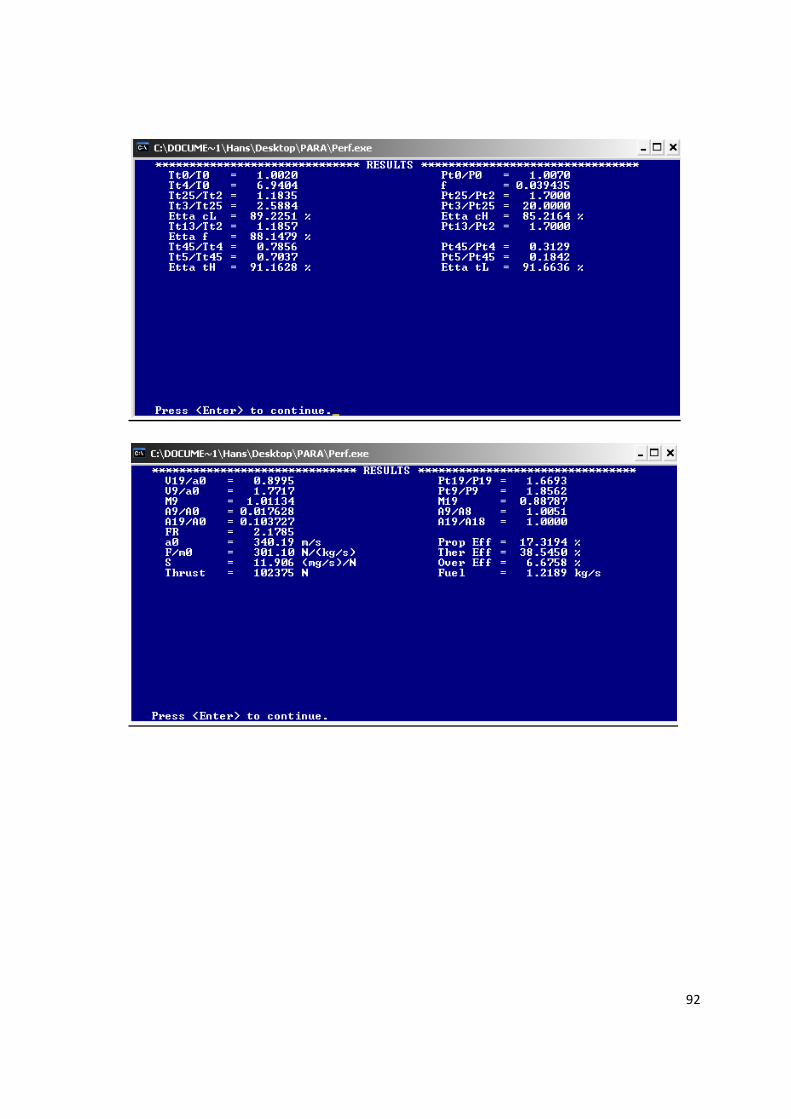
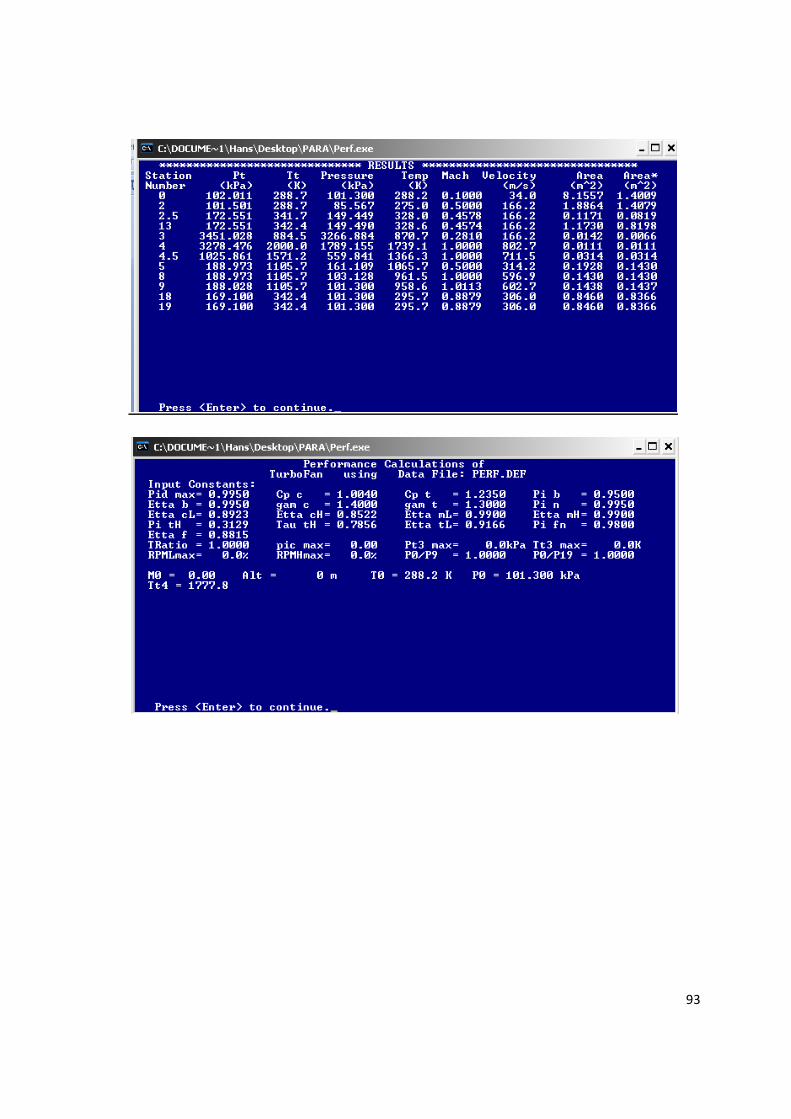
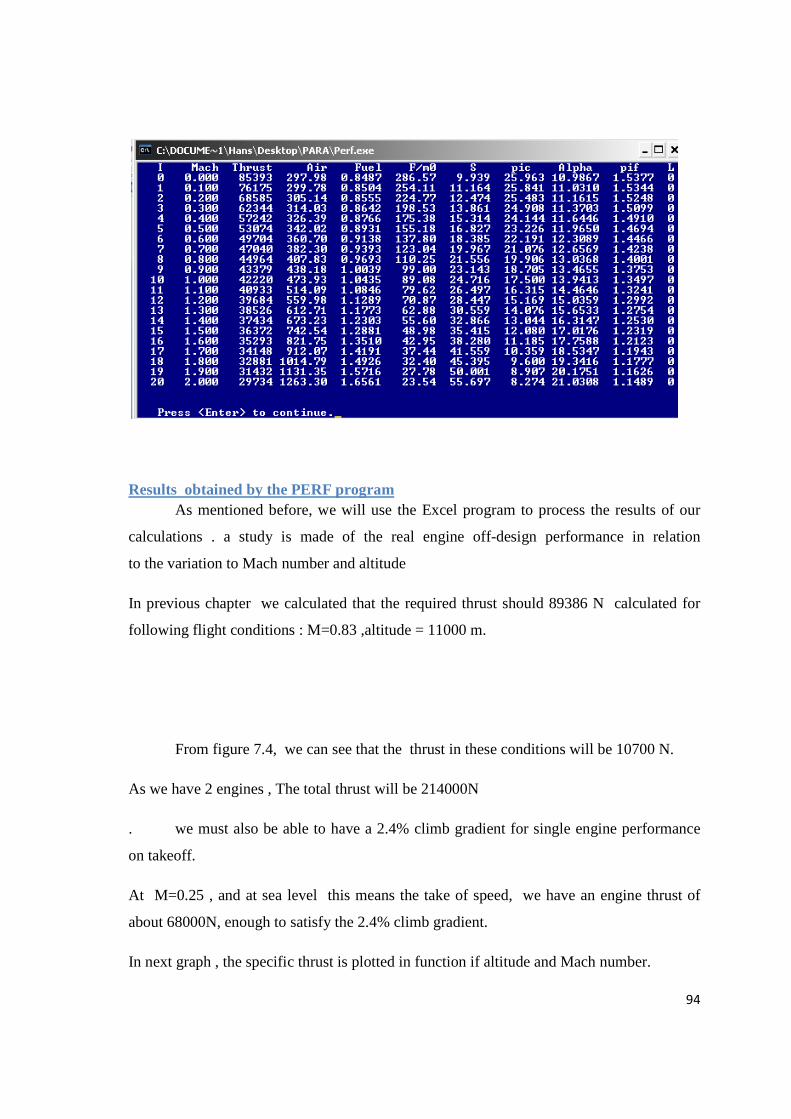
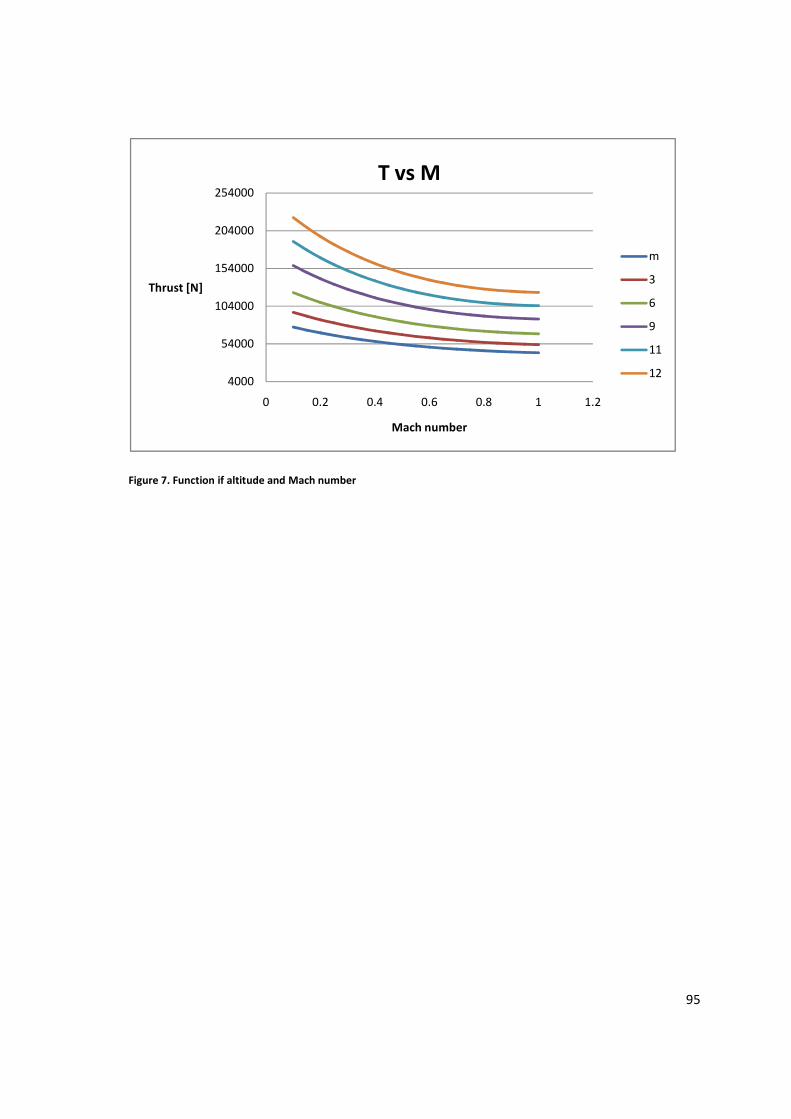
Results obtained by the PERF program ................................................................................. 94
11. References ........................................................................................................................... 98
Page 6
6
Statement This thesis was an examination .The remarks made during the defense of this project
are not recorded in this document.
Abstract In the first part of this work ,an overview is presented of the powerplant used to power
the AIRBUS A-380 and the technologies used to construct these performant engines. A
short comparison is made between the engines available when ordering those aircraft.
In the next part the process is studied to design a high bypass turbofan engine ,starting
by defining the design parameters.
Step by step the design of the engine is explained starting from the ideal model to the
real model in on design conditions. This will be done by using the PARA computer
software .
Finally ,real engine performance in off design conditions will be analyzed by using the
PERF computer software
Page 7
7
Introduction In this work we will study the basic parameters and the methods used for the
conception and design of high performance power plants, in particular for high bypass
ratio turbofan engines.
The production process of a new engine ,from conception to finished
operational reliable product , is a process which involves a lot of research and
development and a small army of engineers. To increase engine performance the
industry is very dependent of innovative technologies , for example new alloys which
are more heat resistant or cooling so that the turbine inlet temperature can be increased.
This work only discusses a part of this process, as the complete process is a big team
effort.
In the first chapter of this thesis we take a look at the power plants that are used
to power one of the most modern aircraft, the AIRBUS A-380. Attention will be paid
to the construction of the two different engines which are available on the aircraft. Some
of the new technologies used in these engines also will be discussed.
The second chapter will regard aircraft performance and determines some of the
basis requirements that the engine must be able fulfill. The specifications of the aircraft
will be determined here, like aircraft dimension and weight ,and calculation
of minimum take off and landing speed. The aerodynamic properties of the aircraft are
also calculated in this part
Chapter three specifies the station numbering of the turbofan engine that will be
adopted throughout this work in the formulas.
In chapter four , parametric cycle analysis is done for the ideal turbofan engine
using the PARA program to analyze the data. This cycle analysis considers on design
conditions.
Chapter five regards the individual components of the engine. As the
components of the engine determine the overall efficiency of the engine, attention must
be paid to the design of each component of the engine. an overview is given of figure of
merits per component in function of the technological evolution.
Page 8
8
In the sixth chapter , parametric cycle analysis is done for the real turbofan
engine using the PARA program to analyze the data. The results obtained from this
analysis will be compared with those obtained from the ideal engine analysis.
In the last chapter, engine performance in off design conditions is studied. This
data analysis will be done using the PERFO software
Software used for calculations � PARA program. This software allows us to make parametric cycle
analysis of the real and ideal engine in design conditions .The variation
of parameters like Mach numbers and compression ratio can be
calculated and the change in engine performance evaluated.
� PERF program. This software allows us to make calculations of real
engine performance in off design conditions .In this way the influence of
different flight conditions can be studied and evaluated.
Page 9
9
List of symbols
A - area; constant
a - speed of sound; constant
b - burner
C D - coefficient of drag
CD 0 - zero lift drag coefficient
CL - coefficient of lift
CL* - coefficient of lift corresponding to max ( CL / CD ) ratio
cp - specific heat at constant pressure
c - compressor
D - drag
d - diffuser
e - energy per unit mass; polytrophic efficiency
F - uninstalled thrust
f - fuel/air ratio; fan
gc - Newton's constant
g0 - acceleration of gravity at sea level
h - enthalpy per unit mass; height
hPR - low heating value of fuel
HPC - high pressure compressor
HPT - high pressure turbine
IPC - intermediate pressure compressor
IPT - intermediate pressure turbine
Page 10
10
K1 - constant in lift-drag polar equation
K2 - constant in lift-drag polar equation
L - lift
LPC - low pressure compressor
LPT - low pressure turbine
M - Mach number
m� - mass flow rate
n - nozzle, load factor
P - pressure
Po - ambient pressure
Pr - reduced pressure
Pt - total pressure
q - dynamic pressure
R - gas constant; additional drag
S - uninstalled thrust specific fuel consumption
Sw - wing platform area
s - spatium
T - installed thrust; temperature
Tt - total temperature
TSCF - installed thrust specific fuel consumption
t - time, turbine
V - velocity
W - weight
Page 11
11
Greek
α - angle of incidence ;by pass ratio
γ - ratio of specific heats
δ - dimensionless static pressure (=P/Pref)
δ0 - dimensionless toal pressure
ηi - isentropic efficiency ,isentropic evolution indicated by „i”
η0 - overall efficiency
ηp - propulsive efficiency
η t - thermal efficiency
ρ - density
σ - dimensionless static density (=p/pref)
τ - total temperature ratio
τi - total temperature ratio, isentropic evolution
θ - dimensionless temperature ratio (=T/Tref)
φinlet - dimensionless inlet loss coefficient
φnozzle - nozzle loss coeficient
Page 12
12
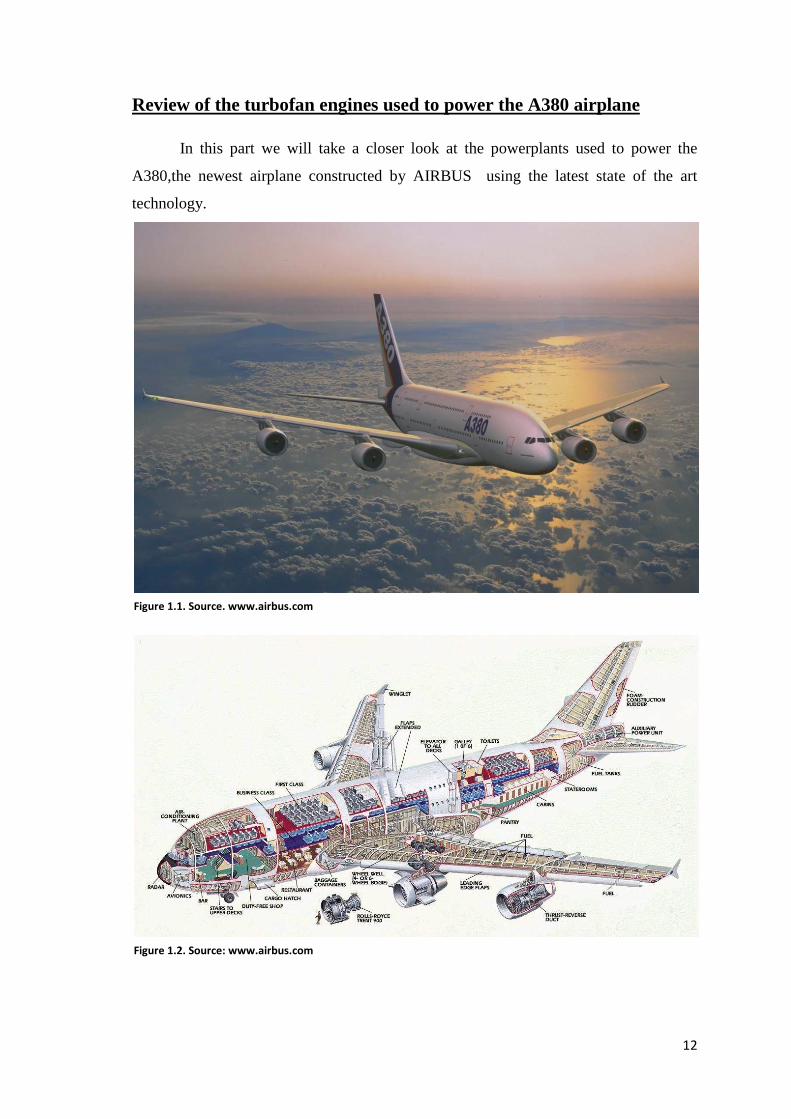
Review of the turbofan engines used to power the A380 airplane
In this part we will take a closer look at the powerplants used to power the
A380,the newest airplane constructed by AIRBUS using the latest state of the art
technology.
Figure 1.1. Source. www.airbus.com
Figure 1.2. Source: www.airbus.com
Page 13
13
The answer to this wide body jet was the conception and development of the
B787 Dreamliner by Boeing
Airbus developed the A380 as the most spacious and efficient airliner ever
conceived. This 525-seat aircraft will deliver an unparalleled level of comfort while
retaining all the benefits of commonality with Airbus’ other fly-by-wire aircraft
Families.
By incorporating the latest advances in structures and materials, the A380 offers
a direct operating cost per passenger that is 15 per cent lower than the competing large
airliner. Reliability and maintainability will be further increased through the use of new
technologies such as an enhanced onboard central maintenance system and variable
frequency generators (which simplify the large aircraft’s electrical generation network).
New-generation engines, combined with an advanced wing and landing gear
design, will make the A380 significantly quieter than today's largest airliner – enabling
the very large aircraft to meet strict local regulations at airports around the world.
A goal of the A380 program from the start has been to offer double-digit
improvements in fuel burn and operating costs when compared with today’s largest
commercial aircraft.
The A380 has the potential to increase an operator’s return by as much as 35%.
Its increased capacity and longer range provide airlines with significantly more seat-
miles on every flight. And because Airbus has maximized the boarding and deplaning
process by cutting out choke points, the significantly shorter turn-round time for airport
processing of an A380 allows schedules to be kept tight and extra flights flown.
Thanks to the incorporation of the latest advances in structures, materials,
aerodynamics, systems and engine design, the A380 will provide a direct operating cost
per seat which is 15-20 per cent lower than the 747-400.
Despite its ability to carry 35 per cent more passengers than its competitor, the
A380 burns 12 per cent less fuel per seat – reducing operating costs and minimizing its
effects on the environment at the same time through fewer emissions. The A380 burns
fuel per passenger at a rate comparable to that of an economical family car.
Page 14
14
Airbus’ 21st century flagship introduces a new era of airline transportation,
carrying 525 passengers aboard the most advanced, spacious and efficient aircraft ever
conceived. The world’s first true double-deck jetliner, the A380 will have a maximum
takeoff weight of 590 metric tons (1,300,000 lb.) and a range of 15,200 km/8,200 nm.
The A380 also benefits from the latest innovations in aerodynamics, reducing
drag to the minimum and improving fuel efficiency further. Moreover, the A380 is
fitted with new state of the art high by-pass engines that contribute to the overall
reduction in fuel burn. The combination of 21st Century aerodynamic standards and
advanced digital design tools enables the A380 to offer unsurpassable performance
standards. A highly efficient wing design allows the A380 to take-off and land in less
distance than today's largest aircraft. As a result the A380 uses existing runways while
carrying 40 per cent more passengers per flight.
Table 1.1 Basic A380 data. Source: www.airbus.com
Page 15
15
Pratt & Whitney GP 7000
Two of the most respected engine manufacturers in the industry,
Pratt & Whitney and General Electric, bring the new GP7000 engine family to A380
customers. GP7000 is derived from some of the most successful wide body engine
programs in aviation history - the GE90 and PW4000 families. These engines
demonstrated industry leading ETOPS reliability from service entry and forged a record
of over 250 million hours of superior performance. Building on the GE90 core and the
PW4000 low spool heritage, the GP7000 is a refined derivative with a responsible
infusion of new technologies. On the Airbus 380, the GP7000 will exceed the high
standards of in-service reliability and performance expected by tomorrow's operators.
• Best of GE Aircraft Engines and Pratt & Whitney technologies.
• Two-spool simplicity for reliability and maintainability.
• Best payload capability, performance and performance retention.
• Quietest.
• Lowest emissions.
• Twice the capabilities of any one engine manufacturer ensure technical
commitments will be met on schedule.
MTU Aero Engines is Germany’s largest aero engine manufacturer.
MTU is a partner of General Electric and Pratt & Whitney, who in 1996 established the
Engine Alliance for this GP7000 engine program. MTU is responsible for the
development and manufacture of the turbine center frame and the low-pressure turbine
as well as for the production of high-pressure turbine parts.
Engine models:
• GP7270 • GP7277
Planes powered by GP7200:
• Airbus A380-800
• Airbus A380-800F
Page 16
16
Technical description of the GP 7000
MTU share (22.5 %):
5.0 % HP Turbine 5.0 % Turbine Center Frame
12.5 % LP Turbine Program shares: 30.0 % P&W 30.0 % GE 22.5 % MTU 10.0 % Snecma 7.5 % Techspace Aero GP7200 Engine Features
Figure 1.3. Source: www.enginealliance.com
Figure 1.4. Source:
www.enginealliance.com
Page 17
17
1. Fan Module/Blade Containment
Built on PW4084 foundation
• FOD and erosion resistant, swept wide chord hollow titanium fan blade with 3D
aerodynamic design
• Lightweight and durable Kevlar-aluminum containment system
• Improved fan/exit guide vane spacing for optimum noise
• Indwidual fan blade reparability and on- wing replacement
2. Low Pressure Compressor
Built on PW4084 foundation
• 3D aerodynamic airfoil design for reduced fuel bum and increased EGT Margin
and life
• Low dirt and debris particle ingestion design for improved durability and long
on-wing life
3. High Pressure Compressor
Built on GE90 foundation
• 3D aerodynamic airfoil design for improved efficiency, FOD resistance and
superior stall-free operation
• Thermally matched casing and rotors for improved performance retention
through blade rub reduction
• Wide chord, forward swept stage 1 integrally bladed disk for reduced
maintenance cost and on-wing repair
4. Low Emission Combuster
Derived from GE CF6 and CFM Technologies
• Low emission technology with singular combustor (SAC) design simplicity
• Meets all current and future CAEP4 emission requirements with significant
margin
Page 18
18
• Lowest Nox emissions forA380 aircraft
5. High Pressure Turbine
Built on GE90 foundation
• 3D aerodynamic design, split blade cooling for optimum performance and
durability
• Thermally matched casing and rotors for performance retention through tighter
blade-tip clearances
• Thermal barrier coated Rene N5 single crystal airfoils for improved durability
and performance
• Boltless rotor architecture reduces part count and increases disk life, reducing
overall maintenance costs
6. Low Pressure Turbine
Built on PW4000 foundation
• 3D aerodynamic airfoil design for reduced fuel bum and increased EG T Margin
and life
• Axial gap optimization / low stage acoustic cut-off design for noise reduction
• Hollow airflows for increased turbine efficiency and reduced weight
7. Bearing & Lube System
Built on GE90 and PW4000 technologies
• Simple two spool engine architecture results in better overall reliability and
reduced maintenance costs
• Shorty one piece tower shaft for improved accessory drive train reliability
• Carbon seals reduce oil consumption and fuel bum
• Low pressure, unregulated lube system allows easier system servicing and
reduced oil volume
Page 19
19
8. Digital Engine Control
Based on GE90 and CFM technologies
• FADEC III Engine Control System builds upon experience of previous Iwo
generations
• Advanced condition motoring system integration with A380 aircraft sets new
standards in performance trending and remote diagnostic compatibility
• Advanced processing capability and redundant critical monitoring sensors
results
in significant reduction potential in aircraft delays and cancellations
9. Accessory Gearbox
Based on PW4000 proven design
• Core mounted architecture maintains shorter, less complex tower shaft
configuration for improved maintainability
• Internally cored lubrication passage minimizes external plumbing and oil
leakage potential
• Proven gear, bearing and steel design for long life and durability
10. Transportability / Propulsor Option
Based on GE90 and PW4000 designs and maintainability
• Engine split-ship capability to facilitate module transport by most wide-body
combi and freighter aircraft
• Propulsor configuration option available to support out-station engine change-
out and minimize spare engine investments
Page 20
20
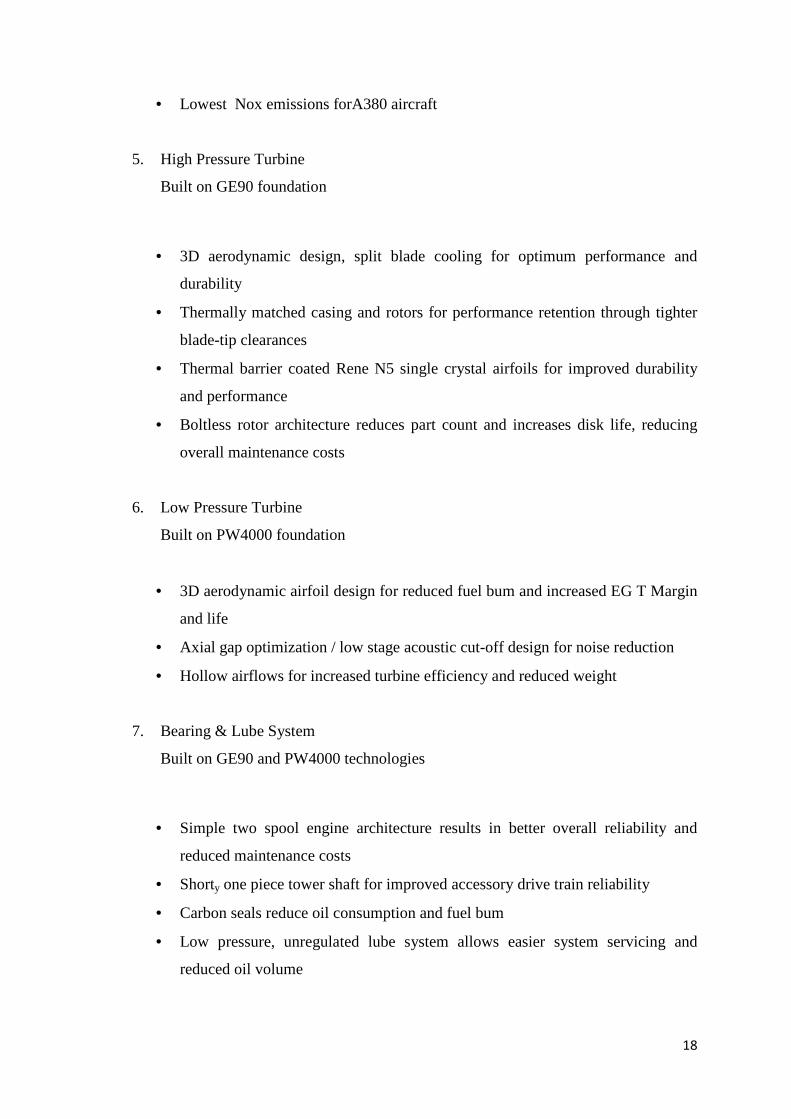
Emissions The environmentally friendly GP7200 meets all ICAO gaseous emissions standards with substantial margin.
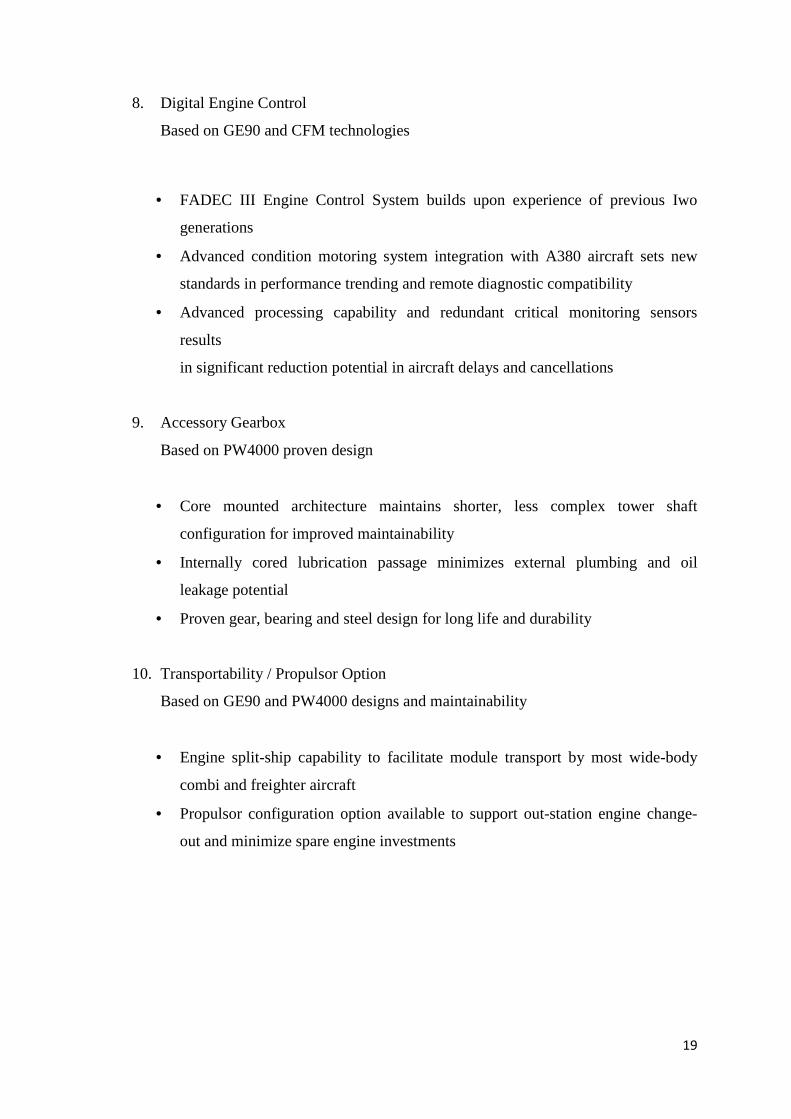
Noise The GP7200 is a good neighbor, allowing the A380 to meet current Stage 3 and proposed Stage 4 noise level standards with margin.
Figure 1.5. Source: www.enginealliance.com
Figure 1.6. Source: www.enginealliance.com
Page 21
21
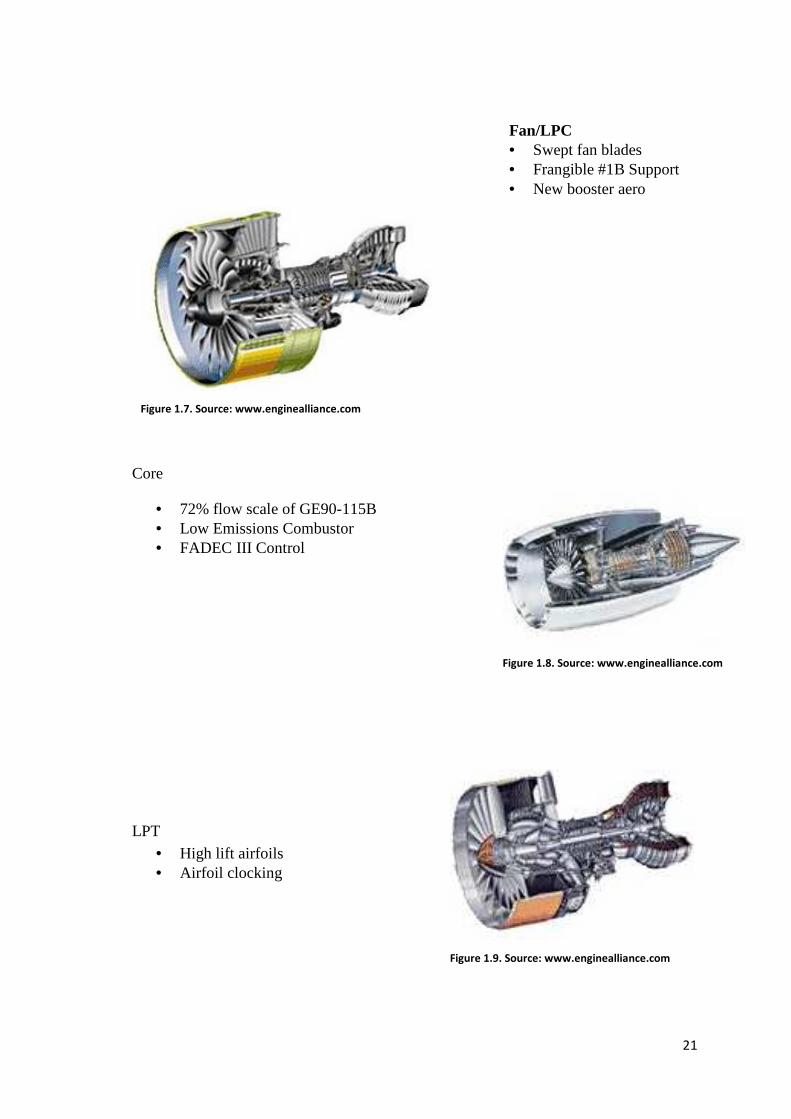
Fan/LPC
• Swept fan blades • Frangible #1B Support • New booster aero
Core
• 72% flow scale of GE90-115B • Low Emissions Combustor • FADEC III Control
LPT
• High lift airfoils • Airfoil clocking
Figure 1.7. Source: www.enginealliance.com
Figure 1.8. Source: www.enginealliance.com
Figure 1.9. Source: www.enginealliance.com
Page 22
22
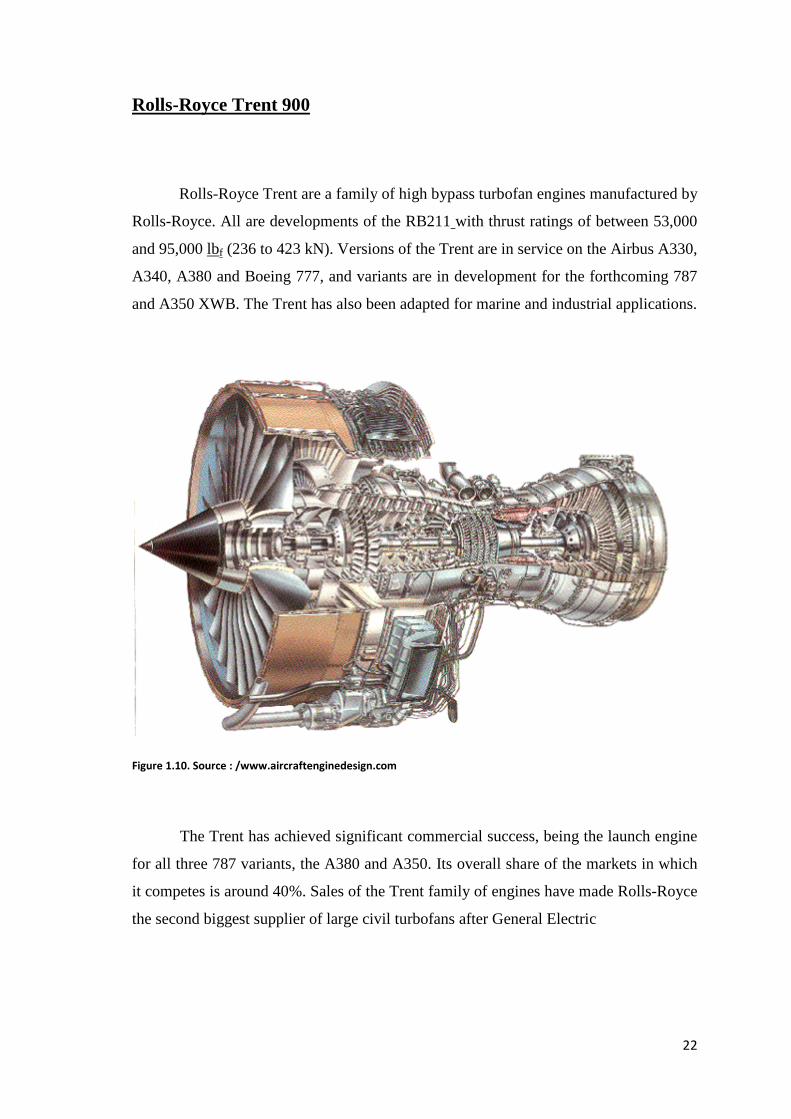
Rolls-Royce Trent 900
Rolls-Royce Trent are a family of high bypass turbofan engines manufactured by
Rolls-Royce. All are developments of the RB211 with thrust ratings of between 53,000
and 95,000 lbf (236 to 423 kN). Versions of the Trent are in service on the Airbus A330,
A340, A380 and Boeing 777, and variants are in development for the forthcoming 787
and A350 XWB. The Trent has also been adapted for marine and industrial applications.
Figure 1.10. Source : /www.aircraftenginedesign.com
The Trent has achieved significant commercial success, being the launch engine
for all three 787 variants, the A380 and A350. Its overall share of the markets in which
it competes is around 40%. Sales of the Trent family of engines have made Rolls-Royce
the second biggest supplier of large civil turbofans after General Electric
Page 23
23
Rolls-Royce Trent 900 engines powered the first scheduled service of a
Singapore Airlines’ Airbus A380 from Changi Airport, Singapore to London Heathrow
on 18 March 2008.
Although the Trent 900 is the largest and one of the most powerful engines
produced by Rolls-Royce, it is the quietest and cleanest engine for the A380. Leading
engine development programme on the A380 and launch engine for the aircraft (entry into
service with Singapore Airlines, Spring 2006)
First run, on schedule, March 2003
Engine certification, on schedule, October 2004
Successfully completed 60-hour flight test programme on A340-300 flying test bed,
August 2004, on schedule
Will power maiden flight of A380, Spring 2005
Cleared for 80,000lb thrust at certification, allowing margin for growth. Thrust required
at entry into service is 70,000lb
Lightest, cleanest and quietest engine on A380. Lowest emissions of any large turbofan
engine, measured per pound of thrust
New technology features include "swept" titanium fan blades (lower noise, improved
aerodynamics) and counter-rotating HP system ("straightens" air flow, improves
efficiency)
Its 116 inch diameter fan makes the Trent 900 physically the largest engine ever built by
Rolls-Royce
Trent 900 risk and revenue sharing partners:
Industria de Turbo Propulsores (ITP), Hamilton Sundstrand, Avio, Marubeni, Volvo
Aero, Goodrich and Honeywell.
Samsung Techwin, Kawasaki Heavy Industries (KHI) and Ishikawajima-Harima Heavy
Industries (IHI) are programme associates.
Family background:
Page 24
24
Trent 900 incorporates the successful and unique three-shaft design established by the
RB211 series and continued by earlier Trent variants
Fourth version of the Trent series to enter service - all market leaders
Trent 700 (39%) Trent 800 (43%) Trent 500 (100%)
Firm and option orders placed for over 1,900 Trents by nearly 50 customers
Trent 900 will draw on the experience of 20 million total Trent flying hours by service
entry
And, not a lot of people know that....
At take-off, the A380's four Trent 900s will deliver thrust equivalent to the power of
more than 3,500 family cars
The engine's hollow, titanium fan blades are almost 10 feet across and suck in over 1.25
tons of air every second. By the time the air leaves the nozzle at the back of the engine
it has been accelerated to a speed of nearly 1,000 miles per hour (1,600 kph)
Temperatures in the engine core are half those on the surface of the sun
The blades in the engine's high pressure system rotate at 12,500 rpm, with tip speeds
reaching 1,200 miles per hour (2,000 kph)
At take-off, each of the 70 high pressure turbine blades in a Trent 900 produces over
800hp....more power than a Formula One racing car
The 116 inch fan operates at nearly 3,000rpm with tip speeds 1.5 times the speed of
sound
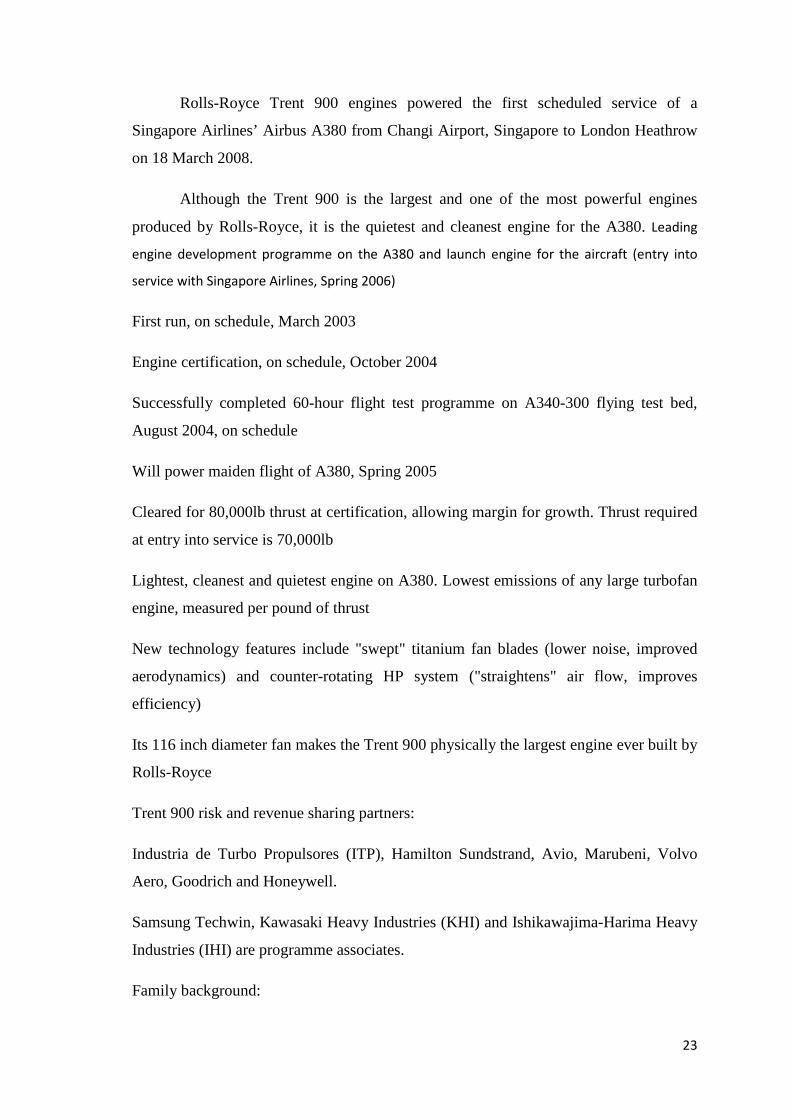
A Trent 900 has around 20,000 individual
components
The Trent 900 is the fourth member
of the Trent family and includes the latest
proven technology. For example:
Figure 1.11. Source: www.rolls-royce.com
Page 25
25
• The engine’s 24 fan blades are to a new swept design that reduces the effect of
shock waves, as the tip of the fan rotates supersonically, making it lighter,
quieter and more efficient.
• The fan containment system is also the first to be manufactured from Titanium
and does not need the additional Kevlar wrap, making it a lighter and smaller
system
• At the core of the engine, the high-pressure shaft rotates in the opposite direction
to the other two shafts, meaning the engine can be made lighter and more fuel-
efficient.
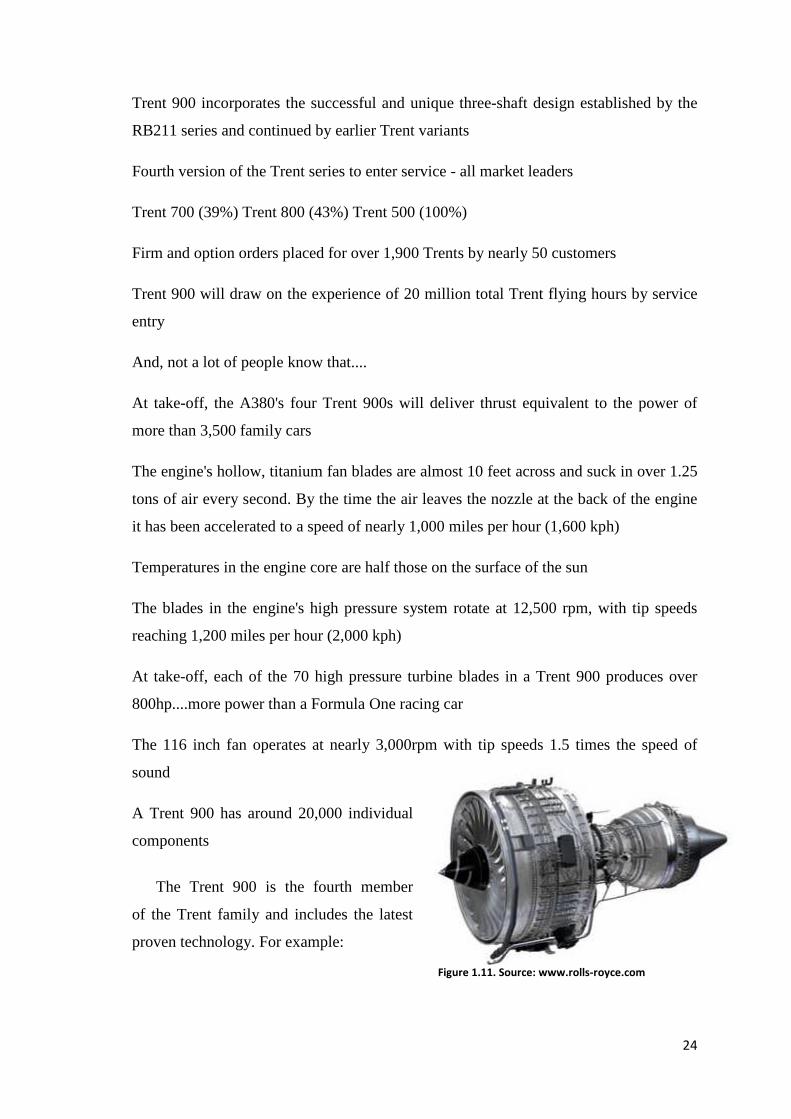
Designed for Service: Low cost of ownership
Engine Health Monitoring for no
operational disruptions
Only engine on the A380 that can be
transported whole in a Boeing 747F
Designed for ease of maintainability with
Fancase mounted units
Excellent reliability from day one with
enhanced service readiness
• Core scaled from the Trent 500
• Benefits of Trent family experience
Excellent Fuel efficiency
• High bypass ratio
Best for the environment
• Quietest engine on the A380
• Lowest emissions on the A380 - world's lowest turbofan emission
Figure 1.12. Source: www.rolls-royce.com
Page 26
26
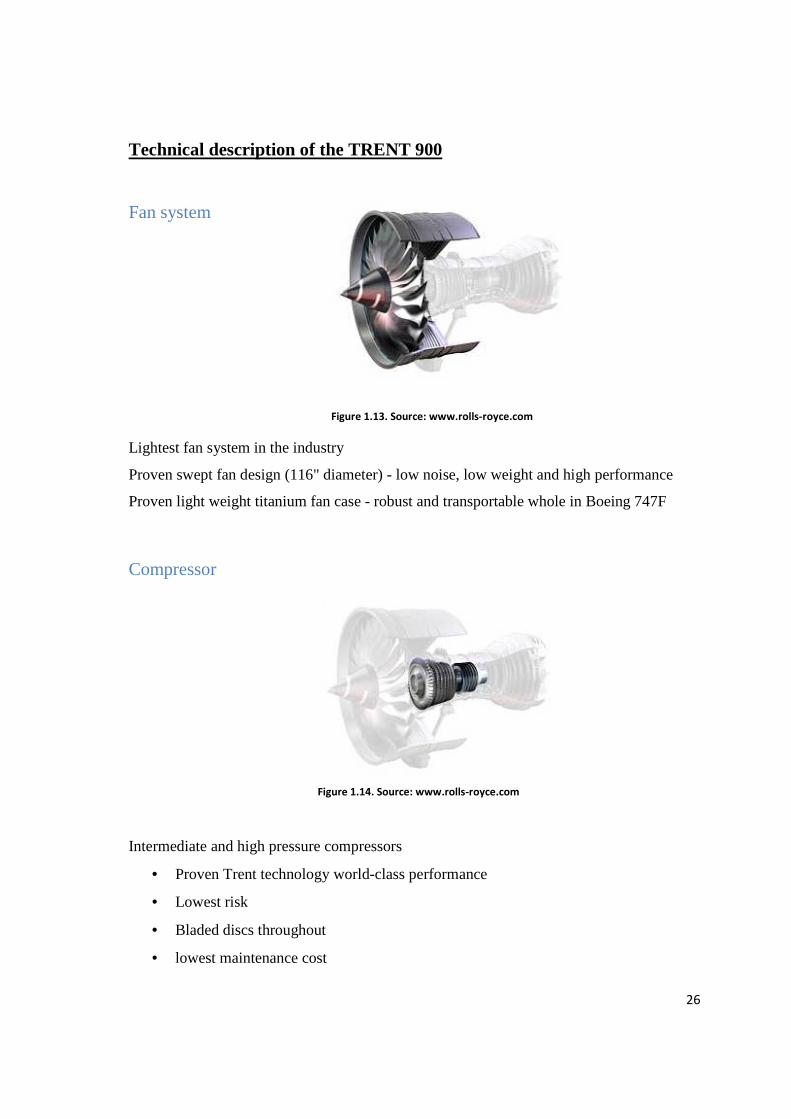
Technical description of the TRENT 900
Fan system
Lightest fan system in the industry
Proven swept fan design (116" diameter) - low noise, low weight and high performance
Proven light weight titanium fan case - robust and transportable whole in Boeing 747F
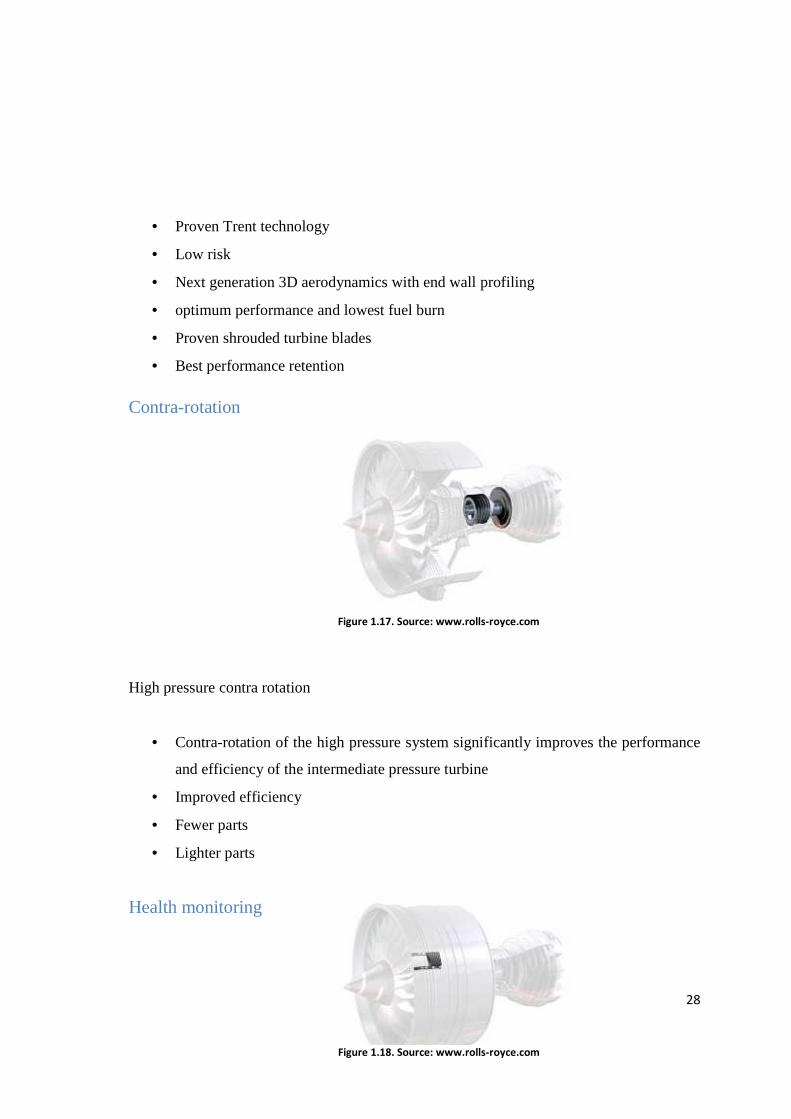
Compressor
Intermediate and high pressure compressors
• Proven Trent technology world-class performance
• Lowest risk
• Bladed discs throughout
• lowest maintenance cost
Figure 1.13. Source: www.rolls-royce.com
Figure 1.14. Source: www.rolls-royce.com
Page 27
27
• Next generation 3D aerodynamics
• More efficient airflow throughout engine
• Better fuel consumption
• Less parts and lower weight
• Rolls-Royce unique 3-shaft design enables compressors to operate at optimum
speeds
Combustor
Combustor
• Proven Trent technology
• Tiled combustor for lowest maintenance costs
• Engine tests have confirmed the Trent 900 as having the world's lowest emissions
• Meets all proposed legislations with margin Assured asset value
Turbines
Figure 1.15. Source: www.rolls-royce.com
Figure 1.16. Source: www.rolls-royce.com
Page 28
28
• Proven Trent technology
• Low risk
• Next generation 3D aerodynamics with end wall profiling
• optimum performance and lowest fuel burn
• Proven shrouded turbine blades
• Best performance retention
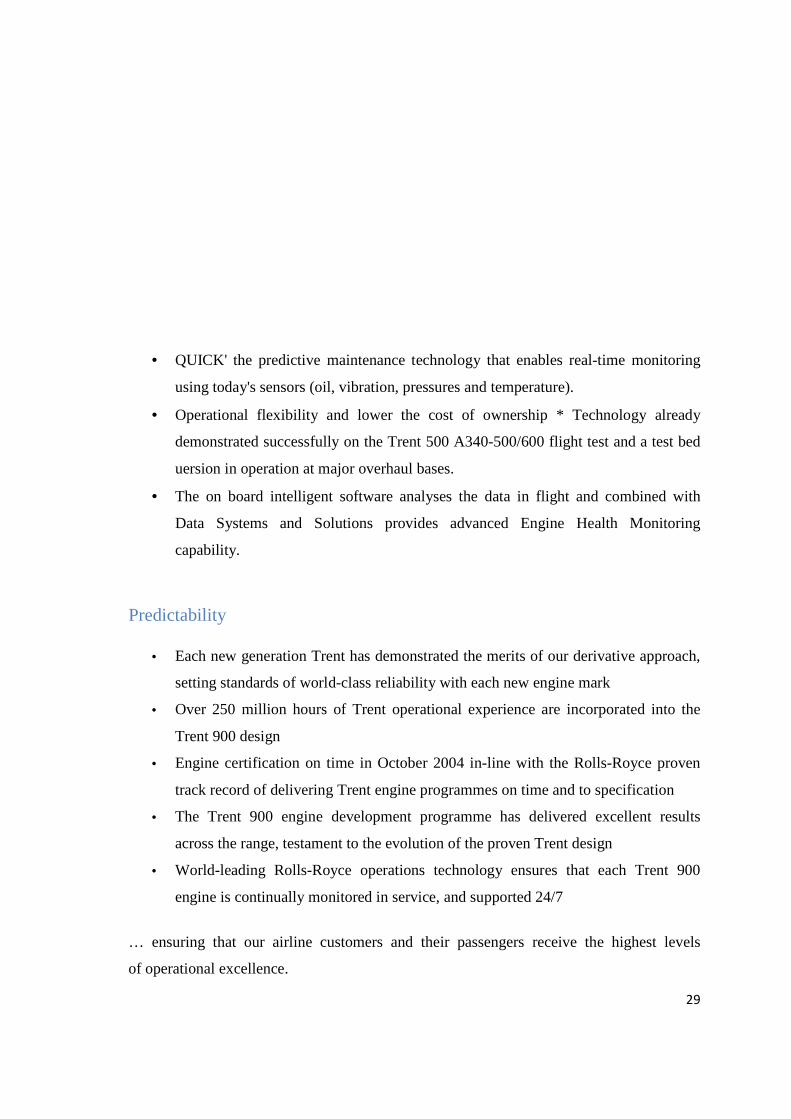
Contra-rotation
High pressure contra rotation
• Contra-rotation of the high pressure system significantly improves the performance
and efficiency of the intermediate pressure turbine
• Improved efficiency
• Fewer parts
• Lighter parts
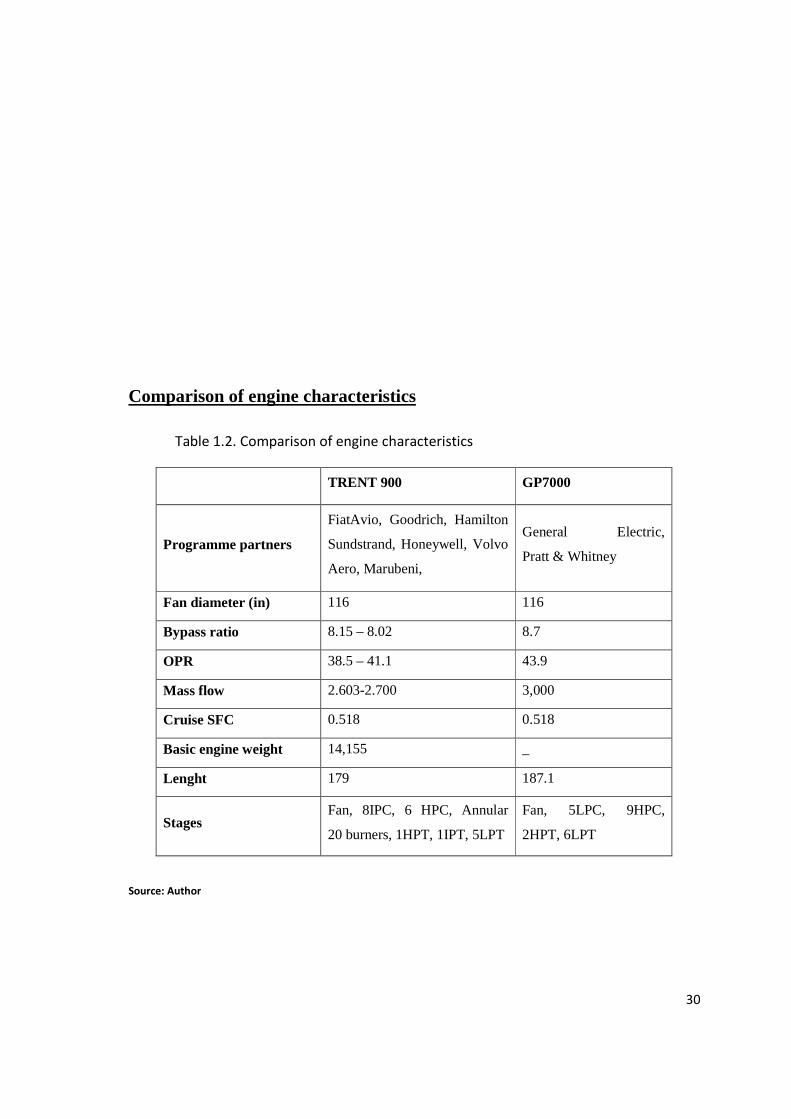
Health monitoring
Figure 1.17. Source: www.rolls-royce.com
Figure 1.18. Source: www.rolls-royce.com
Page 29
29
• QUICK' the predictive maintenance technology that enables real-time monitoring
using today's sensors (oil, vibration, pressures and temperature).
• Operational flexibility and lower the cost of ownership * Technology already
demonstrated successfully on the Trent 500 A340-500/600 flight test and a test bed
uersion in operation at major overhaul bases.
• The on board intelligent software analyses the data in flight and combined with
Data Systems and Solutions provides advanced Engine Health Monitoring
capability.
Predictability
• Each new generation Trent has demonstrated the merits of our derivative approach,
setting standards of world-class reliability with each new engine mark
• Over 250 million hours of Trent operational experience are incorporated into the
Trent 900 design
• Engine certification on time in October 2004 in-line with the Rolls-Royce proven
track record of delivering Trent engine programmes on time and to specification
• The Trent 900 engine development programme has delivered excellent results
across the range, testament to the evolution of the proven Trent design
• World-leading Rolls-Royce operations technology ensures that each Trent 900
engine is continually monitored in service, and supported 24/7
… ensuring that our airline customers and their passengers receive the highest levels
of operational excellence.
Page 30
30
Comparison of engine characteristics
Table 1.2. Comparison of engine characteristics
TRENT 900 GP7000
Programme partners
FiatAvio, Goodrich, Hamilton
Sundstrand, Honeywell, Volvo
Aero, Marubeni,
General Electric,
Pratt & Whitney
Fan diameter (in) 116 116
Bypass ratio 8.15 – 8.02 8.7
OPR 38.5 – 41.1 43.9
Mass flow 2.603-2.700 3,000
Cruise SFC 0.518 0.518
Basic engine weight 14,155 _
Lenght 179 187.1
Stages Fan, 8IPC, 6 HPC, Annular
20 burners, 1HPT, 1IPT, 5LPT
Fan, 5LPC, 9HPC,
2HPT, 6LPT
Source: Author
Page 31
31
Aircaft performance
Before we can start with the analysis of the turbofan engine requirements, we must
have an idea of the design parameters for the engine.
In order to establish these parameters ,attention must be paid to aircraft
performance , because the aircraft dimensions, aerodynamic shape , configuration and
maximum weight will determine the basic requirements in designing or choosing the
turbofan engine for this aircraft.
Once these aircraft properties and required performance for this aircraft are chosen
and set, proper turbofan engine design can begin
Characteristics of the commercial aircraft equipped with turbofan
engines.
Maximum gross take off weight WT0=1,645,760 N
Empty weight 822,880 N
Maximum landing weight 1,356,640 N
Maximum payload (253 passengers plus 190,000N cargo) 420,780 N
Page 32
32
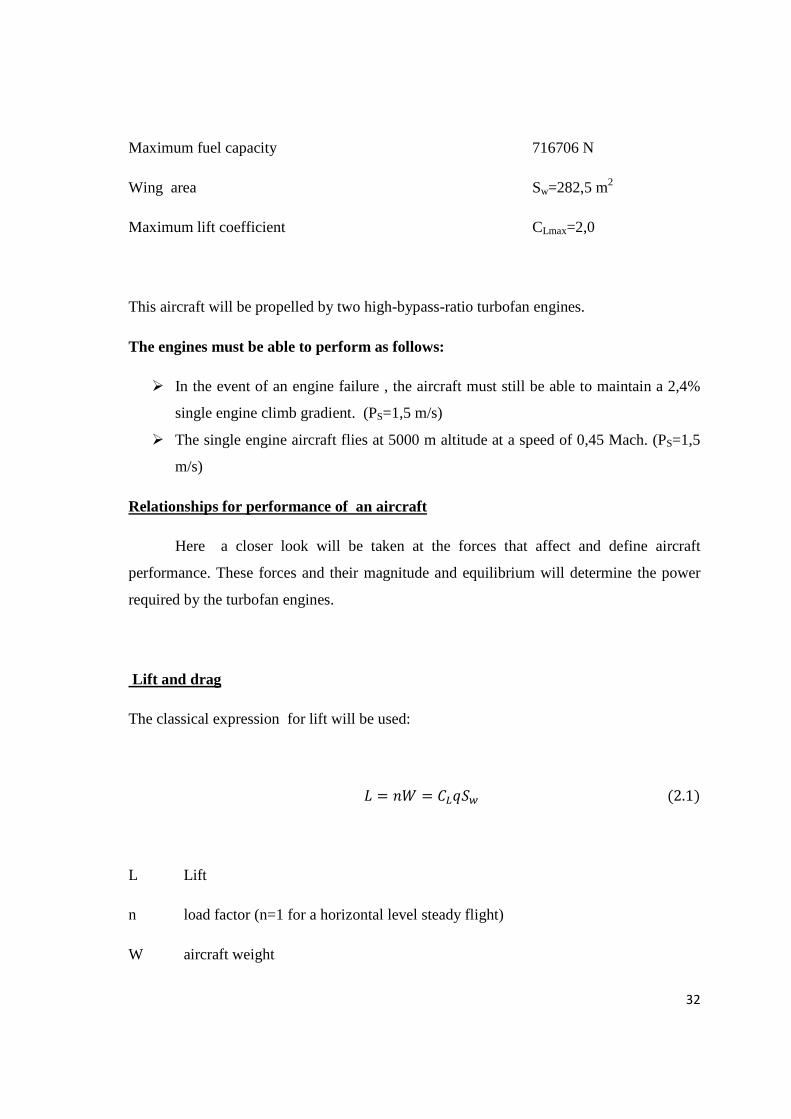
Maximum fuel capacity 716706 N
Wing area Sw=282,5 m2
Maximum lift coefficient CLmax=2,0
This aircraft will be propelled by two high-bypass-ratio turbofan engines.
The engines must be able to perform as follows:
� In the event of an engine failure , the aircraft must still be able to maintain a 2,4%
single engine climb gradient. (PS=1,5 m/s)
� The single engine aircraft flies at 5000 m altitude at a speed of 0,45 Mach. (PS=1,5
m/s)
Relationships for performance of an aircraft
Here a closer look will be taken at the forces that affect and define aircraft
performance. These forces and their magnitude and equilibrium will determine the power
required by the turbofan engines.
Lift and drag
The classical expression for lift will be used:
�� ���� (2.1)
L Lift
n load factor (n=1 for a horizontal level steady flight)
W aircraft weight
Page 33
33
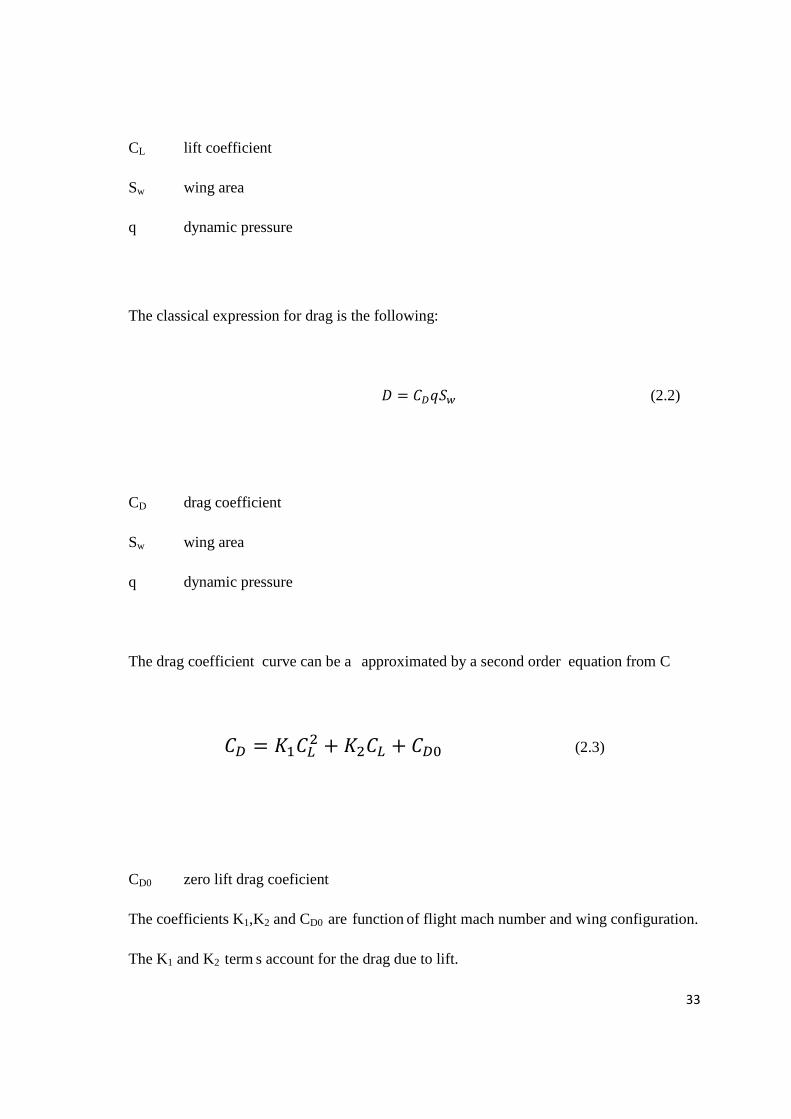
CL lift coefficient
Sw wing area
q dynamic pressure
The classical expression for drag is the following:
� ���� (2.2)
CD drag coefficient
Sw wing area
q dynamic pressure
The drag coefficient curve can be a approximated by a second order equation from C
� �� �� � �� � � �� (2.3)
CD0 zero lift drag coeficient
The coefficients K1,K2 and CD0 are function of flight mach number and wing configuration.
The K1 and K2 term s account for the drag due to lift.
Page 34
34
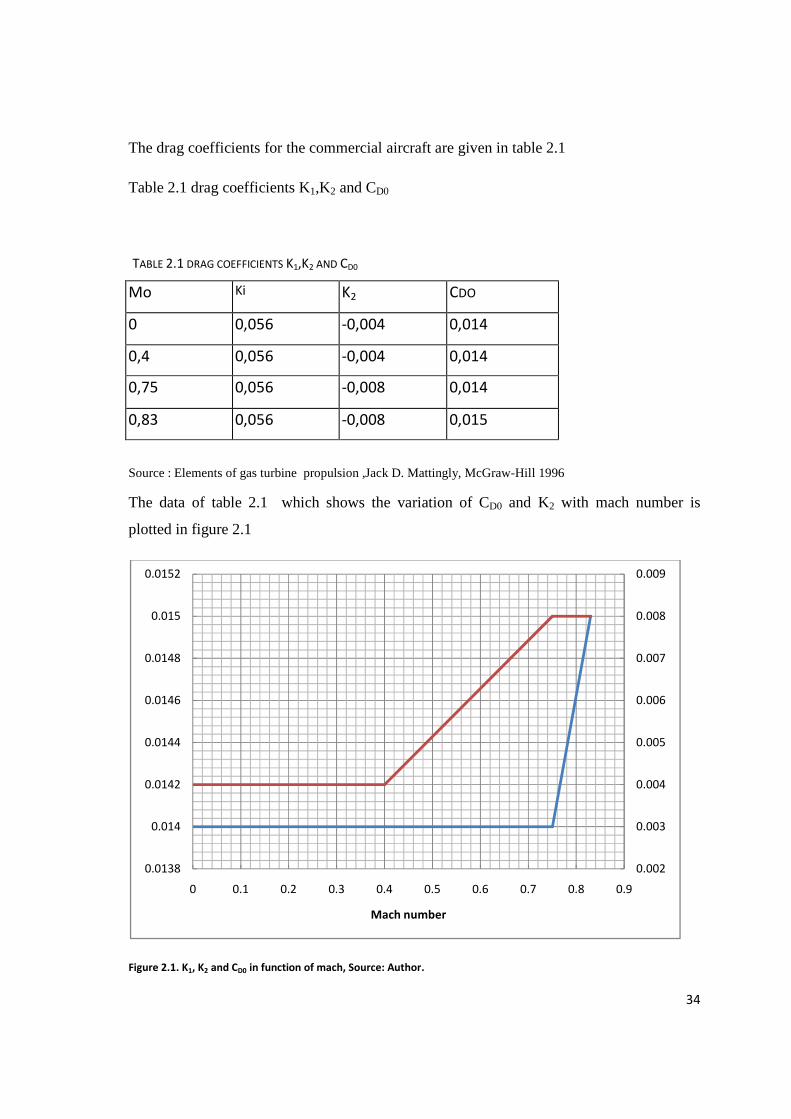
The drag coefficients for the commercial aircraft are given in table 2.1
Table 2.1 drag coefficients K1,K2 and CD0
Source : Elements of gas turbine propulsion ,Jack D. Mattingly, McGraw-Hill 1996
The data of table 2.1 which shows the variation of CD0 and K2 with mach number is
plotted in figure 2.1
Figure 2.1. K1, K2 and CD0 in function of mach, Source: Author.
0.002
0.003
0.004
0.005
0.006
0.007
0.008
0.009
0.0138
0.014
0.0142
0.0144
0.0146
0.0148
0.015
0.0152
0 0.1 0.2 0.3 0.4 0.5 0.6 0.7 0.8 0.9
Mach number
TABLE 2.1 DRAG COEFFICIENTS K1,K2 AND CD0
Mo Ki K2 CDO
0 0,056 -0,004 0,014
0,4 0,056 -0,004 0,014
0,75 0,056 -0,008 0,014
0,83 0,056 -0,008 0,015
Page 35
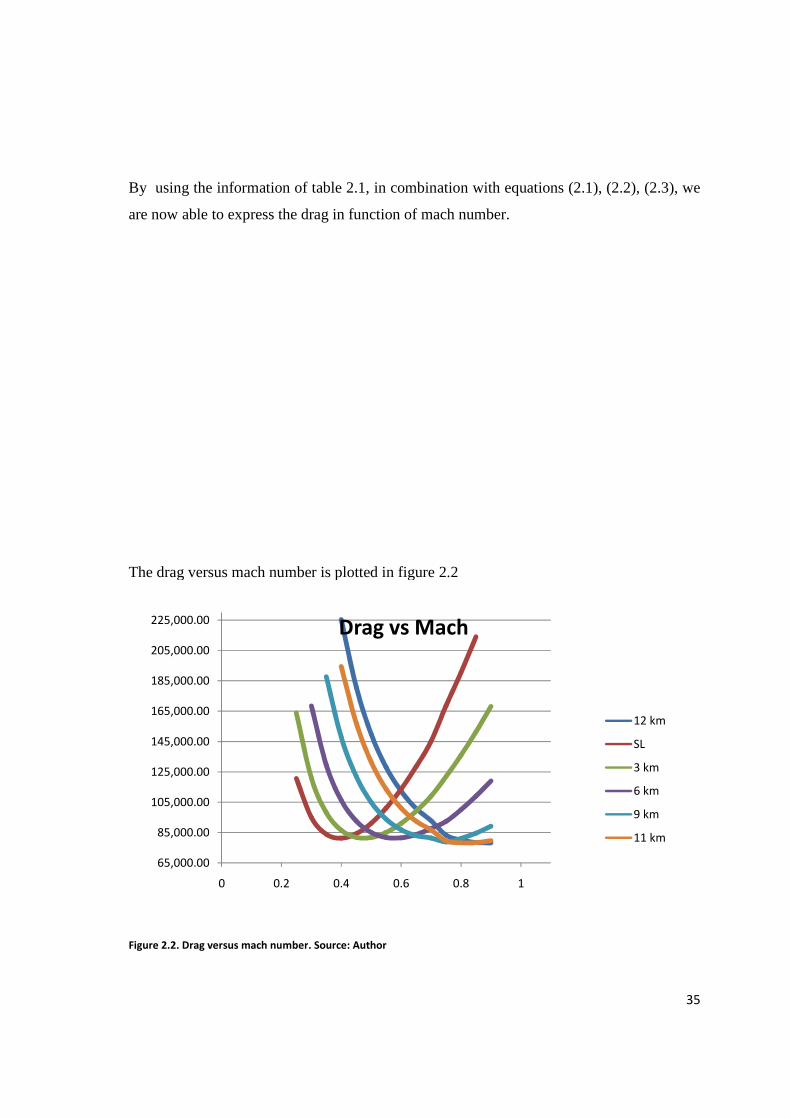
By using the information of table 2.1
are now able to express the drag in function of mach number.
The drag versus mach number is plotted in figure
Figure 2.2. Drag versus mach number
65,000.00
85,000.00
105,000.00
125,000.00
145,000.00
165,000.00
185,000.00
205,000.00
225,000.00
0 0.2
By using the information of table 2.1, in combination with equations (2.1),
are now able to express the drag in function of mach number.
ag versus mach number is plotted in figure 2.2
rag versus mach number. Source: Author
0.2 0.4 0.6 0.8 1
Drag vs Mach
35
in combination with equations (2.1), (2.2), (2.3), we
12 km
SL
3 km
6 km
9 km
11 km
Page 36
36
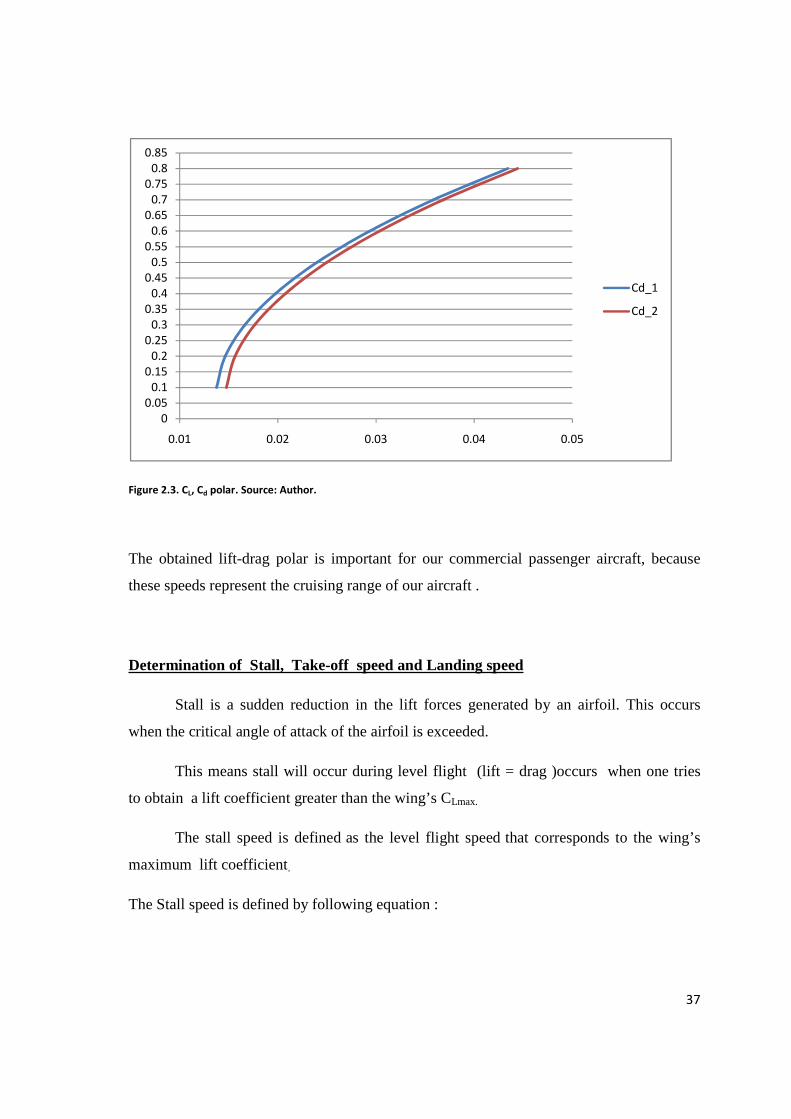
Lift-drag polar
This polar consists of a plot of the lift coefficient CL versus the drag coefficient
CD.
The polar will be plotted for the commercial passenger plane at 95% of the
maximum gross takeoff weight .
Using these drag data and previous equations will determine the variation in drag
with subsonic mach number and altitude for level flight (n=1).
W= 1563472 N
n = 1
dynamic pressure
� γ
� � !"�� (2.4)
γ =1,4 gas constant for air (ratio of specific heats Cp /Cv)
δ dimensionless pressure (=Palttude/Preferece)
Pref pressure at sea level in standard atmosphere (Pref =101325 Pa)
In figure 2.3 the lift-drag polar is plotted for M= 0.75 and M=0.83
Page 37
37
Figure 2.3. CL, Cd polar. Source: Author.
The obtained lift-drag polar is important for our commercial passenger aircraft, because
these speeds represent the cruising range of our aircraft .
Determination of Stall, Take-off speed and Landing speed
Stall is a sudden reduction in the lift forces generated by an airfoil. This occurs
when the critical angle of attack of the airfoil is exceeded.
This means stall will occur during level flight (lift = drag )occurs when one tries
to obtain a lift coefficient greater than the wing’s CLmax.
The stall speed is defined as the level flight speed that corresponds to the wing’s
maximum lift coefficient.
The Stall speed is defined by following equation :
0
0.05
0.1
0.15
0.2
0.25
0.3
0.35
0.4
0.45
0.5
0.55
0.6
0.65
0.7
0.75
0.8
0.85
0.01 0.02 0.03 0.04 0.05
Cd_1
Cd_2
Page 38
38
#$%&'' ( �)*+,-./0123 (2.5)
The stall condition means that control of the vehicle is lost for a certain amount if time.
As this condition is dangerous for certain flight conditions, but especially during
takeoff and landing where there is no time for the aircraft to recover from this condition,
safety margins will be set to take-off and landing speeds to avoid this situation. this
margins only apply for a calm atmosphere, for a turbulent atmosphere it is advised increase
these speeds for example by 10%.
For safety reasons the take off speed VT0 will be typically 20% higher than the stall speed,
and the landing speed at touchdown VTD will 15% greater.
#45 1,2#$%&'' (2.6)
#4� 1,15#$%&'' (2.7)
Calculation of the stall speed and touchdown speed for the commercial passenger
aircraft.
Stall speed at maximum gross take-off weight
#$%&'' ( �8��,��98�,� �,:;9,<:��=�,9 69,0 A$
Take-off speed:
#45 1,20#$%&'' 82,8 CD 298,1EC/G
Page 39
39
Touchdown speed:
Stall speed at maximum landing weight:
#$%&'' H 2 8 11,225 8 2,0 1,356,640282,5 62,2 CD 223,9EC/G
#4� 1,15#$%&'' 72C/D
Fuel Consumption:
The rate of change of the aircraft weight dW/dt is due do the fuel consumed by the
engines during flight.
The mass rate of fuel consumed is equal to the product of the installed thrust T and
the installed thrust specific fuel consumption.
We can write:
L11 M N!� M C!� )O)* MP�P�Q �� )O)*� (2.8)
where:
R� constant acceleration of gravity
RS Newtonian constant ( in SI units RS equals 1)
T installed thrust
Page 40
40
TSFC installed thrust specific fuel consumption
N!� weight flow rate of fuel
C!� mass flow rate of fuel
The equation can be rewritten in dimensionless form as:
L11 M 41 �P�Q � T )O)*U VW (2.9)
Estimation of the TSFC
In order to calculate the change in aircraft weight using equation (2.9), we need to
estimate the installed engine thrust T and installed TSFC.
In many flight conditions ,the installed engine thrust T will be equal to the aircraft
drag D.
The TSFC is a complex function of engine regime, temperature, pressure altitude,
and speed.
The TSFC is also important to determine the endurance and range of the aircraft.
For preliminary analysis following equation can be used:
P�Q �0,4 � 0,45"��√Y Z'[/\�'[! ] (2.10)
Where:
θ dimensionless temperature ratio (=T/Tref)
Page 41
41
For un accelerated level flight thrust equals drag (T=D) and lift equals weight, applying
these assumptions on equation (2.10) gives:
L11 M ,^
,- (P�Q ) T )O)*U VW (2.11)
Endurance
The endurance factor of an aircraft is defined by the following relation:
_Q ` ,-,^�42a,� T )O)*U (2.12)
By applying this relation equation (2.11) becomes:
L11 M L%ba (2.13)
The minimum fuel consumption for a time t will occur at the flight condition where
the endurance factor is maximum.
When the endurance factor is constant or nearly constant ,we can integrate equation
(2.13) from initial to final conditions we obtain following expression for the aircraft weight
fraction:
1c1d efg �M %ba� (2.14)
Or
1c1d efg ZM ,,- �P�Q �W )O)*] (2.15)
Page 42
42
Range
In flight phases where distance is important, the differential time dt is related to the
differential distance ds by following law:
VD #VW (2.16)
Where:
V aircraft velocity
Substitution of (2.16) in (2.15) gives:
L11 M ,^
,-42a,
h)O)* VD (2.17)
The range factor of an aircraft is defined by the following relation:
iQ ` ,-,^
h42a,
)*)O (2.18)
Therefore equation (2.17) becomes:
L11 M L$
ja (2.19)
The minimum fuel consumption for a distance s will occur at the flight condition
where the range factor is maximum.
When the range factor is constant or nearly constant ,we can integrate equation
(2.19) from initial to final conditions we obtain following expression for the aircraft weight
fraction:
Page 43
43
1c1d efg �M $ja� (2.20)
Or
1c1d exp T M ,^,-�42a,�8$h )O)*U (2.21)
This is called the Breguet range equation. For the range factor to remain constant,
CL/CD and V/TSFC must be constant.
Above 11,000 m of altitude ambient temperature is constant and a constant velocity
V wil correspond to constant Mach and constant TSFC for a fixed throttle setting .
If CL is constant , CL/CD will be constant
Aircraft weight decreases during flight, thus the altitude must increase to reduce the
density of the ambient air and produce the required lift ( L=W) while CL and velocity
remain constant
We call this flight profile a cruise climb.
In the next figures (2.4), (2.5), (2.6) the TSFC, EF, and RF are plotted
as a function of Mach number for the commercial passenger aircraft at 95% of the
maximum gross take-off weight.
The best endurance Mach number (= minimum fuel consumption ) occurs
increases with altitude and best fuel consumption is at sea level.
Page 44
Figure 2.4. Endurance factor in hours in relation to mach number, Source: Author
Figure 2.5 Range factor
28
29
30
31
32
33
34
0 0.2
12000
14000
16000
18000
20000
22000
24000
26000
28000
0.25 0.35
Endurance factor in hours in relation to mach number, Source: Author
0.4 0.6 0.8
EF vs M
0.45 0.55 0.65 0.75
RF vs M
44
1
SL
3km
6km
9km
11km
12km
0.85
SL
3km
6km
9km
11km
12km
Page 45
45
The best cruise Mach number (minimum fuel consumption ) increases with altitude
and the best fuel consumption occurs at 11 km altitude and at a Mach number of about
M=0.83
CL/CD - relationship
In case flight conditions require minimum fuel consumption , the optimum flight
condition can be approximated by the one corresponding the maximum CL/CD
By taking the derivative of expression (2.3) ,setting it to equal 0 and solving
it for CL that gives minimum CD/CL we obtain maximum CL/CD :
,^,- �� � � �� � ,^O
,- (2.22)
The lift coefficient that that gives maximum CL/CD (minimum CD/CL ) is
�n (,^Oop (2.23)
�n H0.0140.056 0.5
And maximum CL/CD is given by
�,,- �n ��q,^Oopros (2.24)
On figure (2.7) we can see that the maximum CL/CD occurs at M=0,75.This is
also the Mach number that corresponds to the point of minimum drag. Thus for M=0.75,
CL/CD is maximum and EF is maximum.
The Mach number that corresponds to maximum range for a given altitude ,is
usually higher than that corresponding to (CL/CD )*.It can be explained because the
velocity factor dominates the increase in TSFC.
Page 46
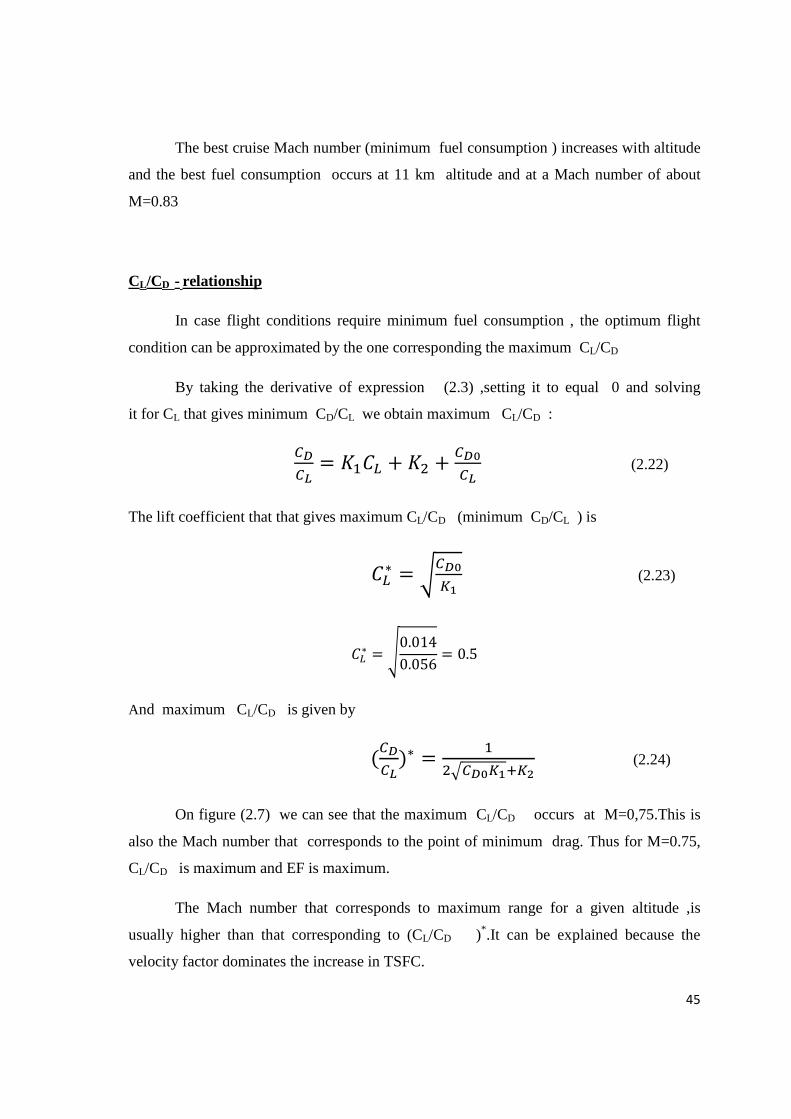
Table 2.6. Drag, Range factor, Endurance factor, Cl/Cd in function of Mach number, Source: Author
10000
20000
30000
40000
50000
60000
70000
80000
90000
0.6 0.65
Table 2.6. Drag, Range factor, Endurance factor, Cl/Cd in function of Mach number, Source: Author
0.7 0.75 0.8 0.85
46
Table 2.6. Drag, Range factor, Endurance factor, Cl/Cd in function of Mach number, Source: Author
16
18
20
22
24
26
28
30
32
0.85
Drag
RF
EF
Cl/Cd
Page 47
47
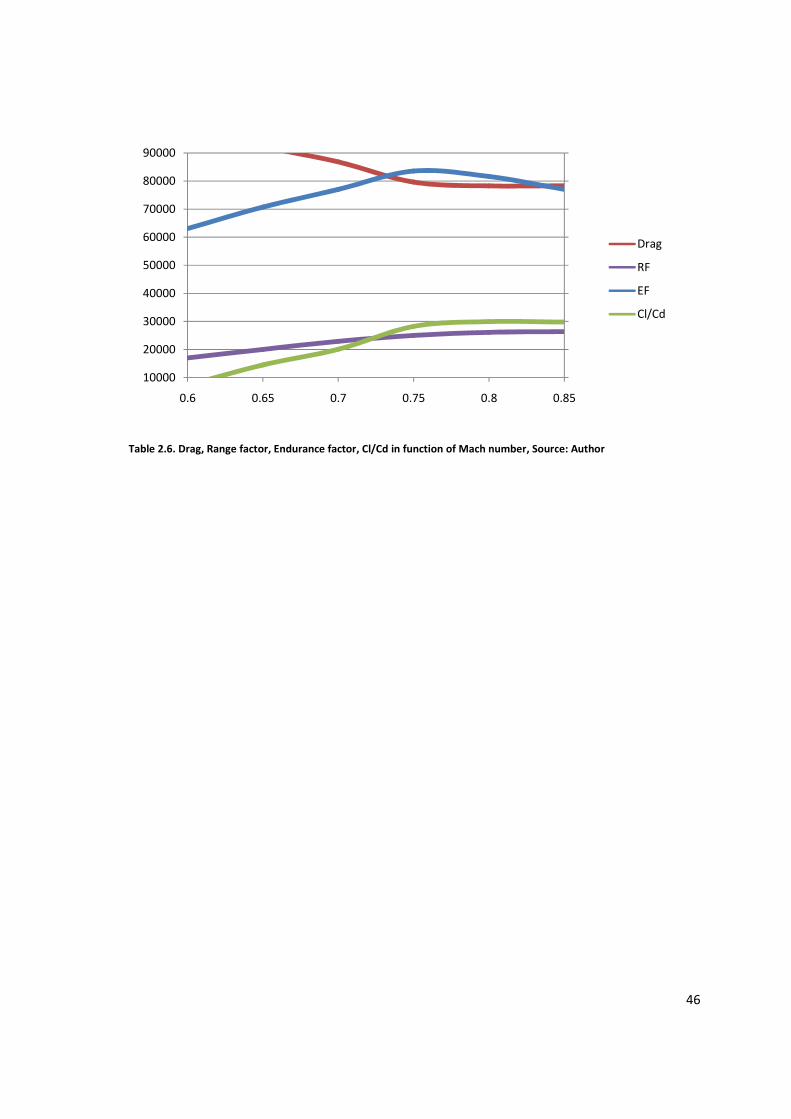
Schematic diagram of a high Bypass ratio turbofan engine.
0 undisturbed airflow
2 airflow through fan
2,5 compressed air leaving low pressure compressor (LPC) compressed air entering
the high pressure compressor ( HPC) \
3 compressed air leaving the high pressure compressor ( HPC)/compressed air
entering the combustion chamber
4 burnt gasses leaving the combustion chamber burnt gasses entering the high
pressure turbine (HPT)
4,5 partially expanded gasses leaving HPT and entering low pressure turbine (LPT)
5 further expanded gasses leaving LPT and entering nozzle
7 continued expansion in nozzle
Page 48
48
8 expansion to ambient pressure
13 compressed air leaving the fan and entering the bypass nozzle
17 continued expansion in by pass nozzle
18 expansion to ambient pressure
Parametric cycle analysis of ideal engines
Parametric cycle analysis determines the performance of engines at different flight
conditions and chosen design values. The thermodynamic changes of the working fluid are
studied in cycle analysis as it flows through the engine.
Parametric cycle analysis studies the engine in on-design point conditions.
Performance analysis determines the performance of a specific engine
at all flight conditions and throttle settings. This means off design conditions.
The components of an engine are characterized by the change in properties they produce,
and a certain engine behavior is determined by its geometry.
The main objective of parametric cycle analysis is to relate the engine performance
parameters (primarily thrust F and thrust specific fuel consumption S)
to design choices (compressor pressure ratio, fan pressure ratio, bypass ratio, etc.),
to design limitations (burner exit temperature, compressor exit pressure, etc.),
and to flight environment (Mach number, ambient temperature, etc.). From parametric
cycle analysis, we can determine which engine type and components are most suited for a
particular need.
The value of parametric cycle analysis depends directly on the realism
with which the engine components are characterized.
He engine represents a so called “ rubber engine” , as a change in geometry
is considered as a change of the thermodynamic parameters.
Equations used in Parametric cycle analysis of ideal engines
Total temperature
Page 49
49
The total or stagnation temperature is the temperature when a steadily flowing fluid
is put to stop adiabatically
P% P T1 � tu�� "�U (4.1)
where :
T static (thermodynamic) temperature
γ gas constant
M Mach number
Total pressure The total or stagnation pressure is the temperature when a steadily flowing fluid is
put to stop adiabatically and reversibly, thus isentropically.
�% � T1 � tu�� "�U vvwp (4.2)
where:
P static (thermodynamic) pressure
Ratios As ratios of total temperature and pressure will be used frequently in this part,
a special notation will be used for them. A subscript will indicate the component: d for
diffuser (inlet), c for compressor, b for burner, t for turbine, n for nozzle, and f for fan.
x& %y%&' z� $${� ' &|}~) SyAzy~ ~% &%y%&' z� $${� ~% �}~) SyAzy~ ~% & (4.3)
Page 50
50
�& %y%&' % Az �&%{� ' &|}~) SyAzy~ ~% &%y%&' % Az �&%{� ~% �}~) SyAzy~ ~% & (4.4)
Total / static temperature ratio – free stream
�� 4��4O 1 � tu�� "�� (4.5)
Total / static pressure ratio – free stream
x� ����O T1 � tu�� "��U vvwp (4.6)
Burner exit / ambient enthalpy ratio
�� \� ������ �0d�\O �S�4�������� �0d��S�4�� (4.7) where:
ht burner exit burner exit enthalpy
h0 ambient enthalpy
table 4.1 contains most short form ratio’s that will be used in our analysis
Core stream Bypass stream
�L P%�P%� xL �%��%� �! P%��P%� x! �%���%�
�S P%�P%� xS �%��%� �!~ P%��P%�< x!~ �%���%�<
Page 51
51
�[ P%;P%� x[ �%;�%�
�% P%9P%; x% �%9�%;
�~ P%�P%< x~ �%��%<
Table 4.1 Source: Jack D Mattingly Elements of Gas Turbine Propulsion
Assumptions of ideal cycle analysis Following assumptions are made for ideal cycle analysis:
1. There are isentropic ( reversible and adiabatic ) compression and expansion
processes in the inlet (diffuser), compressor, fan, turbine, and nozzle
resulting in these relationships:
�L �~ 1 xL x~ 1 �S xS�vwp�v �% x%
vwpv 2. Constant pressure combustion (πb =1)is idealized as a heat interaction into
the combustor
The fuel flow rate is a lot smaller than the airflow through the combustor
so:
Ac� A*� � 1 and CS� � C!� � CS�
3. The fluidum will be air, which will be considered as a perfect gas with
constant specific heats
4. The engine exhaust nozzles expand the gas to the ambient pressure.(P0=Pe )
Page 52
52
Design inputs All the possible inputs can be classified in one of four categories:
1. Flight conditions P0,T0,M0,cp,πr,τr
2. Design limits (cpTt)burner exit
3. Component performance πd,πb,πn,etc
4. Design choices πc,πf,etc
Parametric cycle analysis for the ideal turbofan engine
The propulsive efficiency of a turbojet engine can easily be increased by equipping
it with a fan. This ducted ”propeller” - will be driven by the engine ‘s gas generator by
extracting a potion of its energy.
The fan increases the mass flow rate and decreases the required propellant exit
velocity for a given thrust. The net effect of this installation will be a decrease in wasted
kinetic energy and an improvement in propulsive efficiency.
The ratio of the fan flow to the core flow is defined as the bypass ratio α
� A�� A�� (4.8)
The total gas flow can expressed as follows: C�� Ca� � C,� �1 � �� C,� (4.9)
Assumption for ideal cycle analysis
Page 53
53
The thrust of the ideal turbofan engine is
Q A��)* �#� M #�� � A��)* �#�� M #�� (4.10)
Substitution of equation (4.9) in (4.10) leads to:
a AO� &O)*��r� Zh�&O M "� � � Thp�&O M "�U] (4.11)
The core stream of the turbofan engine The core stream will encounter the same elements as the ideal turbojet
Th�&OU� 4�4O "�� (4.12) 4� 4O �["�� �����* (4.13) "�� �tu� ����S�% M 1) (4.14)
Page 54
54
Thus:
Th�&OU� 4�
4O "�� �tu�
�����* (���S�% M 1� (4.15)
The fan has neither combustor nor turbine, adaption of the core stream formula gives:
Thp�&O
U� 4p�4O
"��� (4.16)
P�� P� (4.17) "��� �
tu� ����! M 1� (4.18)
Thus:
Thp�&O
U� "��� �tu� ����! M 1� (4.19)
The law of energy for the steady state flow applied on the burner
CS� �zP%� � C!� G�j ( CS� � C!� )�zP%; (4.20)
Page 55
55
Defining fuel to air ratio
� Ac� A*� S�4O\�� ��� M ���S� (4.21)
Output power of the turbine �% � � CS� � C!� ��z�P%; M P%9� � CS� �zP%;�1 M �%� (4.22)
Power required to drive the compressor
�S � CS� �z�P%� M P%�� CS� �zP%���S M 1� (4.23)
Power required to drive the fan
�! � Ca� �z�P%�� M P%�� Ca� �zP%���! M 1� (4.24)
Since �% � �S �� �!� for the ideal turbofan , then
P%;�1 M �%� P%���S M 1� � �P%���! M 1� (4.25) �% 1 M 4�s4�� �S M 1 � ���! M 1�¡ (4.26) �% 1 M ���� �S M 1 � ���! M 1�¡ (4.27)
Page 56
56
Combination of equation (4.15) and (4.27) gives
Th�
&OU� �tu�
�����* T���S ¢1 M ���� �S M 1 � ���! M 1�¡£ M 1U (4.28)
After simplifying this becomes
Th�&OU� �
tu� ¢�� M �� �S M 1 � ���! M 1�¡ M �����*£ (4.29) Specific thrust of the ideal turbofan As result of equations, (4.11), (4.19), (4.27):
� Ac�a !
a/ AO� !( AO� / A*� )(a/ AO� ) (4.30)
� !
(�r�)(a/ AO� ) (4.31) Thermal efficiency of the ideal turbofan
¤4 1 M �
���* (4.32)
The thermal efficiency of the turbofan engine is the same as that of the turbojet
engine , and this because the power that is extracted from the core stream of the turbofan
engine is added to the bypass stream without loss in the ideal case, resulting in the net
output power.
Thermal efficiency of the ideal turbofan
Page 57
57
¤� 2 ¥�¥Ou�r�T¥p�¥O u�U¥�s¥Osu�r�¦¥p�s
¥Os u�§ (4.33) Thrust ratio
This is the ratio of specific thrust per unit of mass flow and is a useful performance
parameter
Qi ` a�/ A��a�/ A�� (4.34)
Optimum Bypass Ratio There can be stated if all other parameters are fixed, there exists an optimum bypass
ratio. This optimum bypass ratio gives the minimum TSFC
n �����cu�� Z�� M ��(�S M 1� M �����* M �; �q���! M 1 � q�� M 1��] (4.35)
When the bypass ratio is chosen to give the minimum fuel consumption, the thrust
per unit mass flow one half that of the fan, this means that for an optimum bypass ratio
ideal turbofan engine, the thrust ratio is 0.5
Qi h�uhOhp�uhO �
� (4.36) Using this formula , the specific thrust becomes the following:
T a AO� U�n &O
)*�r��n
�(�r�n) ©( �tu�(���cu�) M "�ª (4.37)
The propulsive efficiency at optimum bypass ratio given by:
(¤�)«¬ 2 ;(�r��n)hO(�r;�n)hOr(�r;�n)hp� (4.38)
Page 58
58
Optimum Fan pressure Ratio For all other parameters fixed there exists an optimum fan pressure ratio which
gives minimum fuel specific fuel consumption and maximum specific thrust.
There can be concluded that optimum fan pressure ratio will be obtained when #� #�� (4.39) and
Qi 1 (4.40)
giving:
�!n ����(�*u�)u ±�±�±*r���r���(�r�) (4.41)
The specific thrust for an optimum fan pressure ratio turbofan becomes:
T a AO� U
�cn &O
)*©( �
tu� ����!n M 1� M "�ª (4.42)
The propulsive efficiency at optimum fan pressure ratio turbofan is: (¤�)�cn �
¥p�¥O r� (4.43)
Description of the Computer calculated performance for an ideal turbofan engine
using the PARA v3.10 program
Page 59
59
For the parametric analysis of the turbofan engine , we will use the PARA software
to obtain the necessary calculations .For the result plots,the PARA program and excel
program will be used.
Figure 4.1 shows the basic interface of the PARA program
Figure 4.1. Basic interface of program Source: PARA Software
Figure 4.2 Basic interface of program Source: PARA Software
Page 60
60
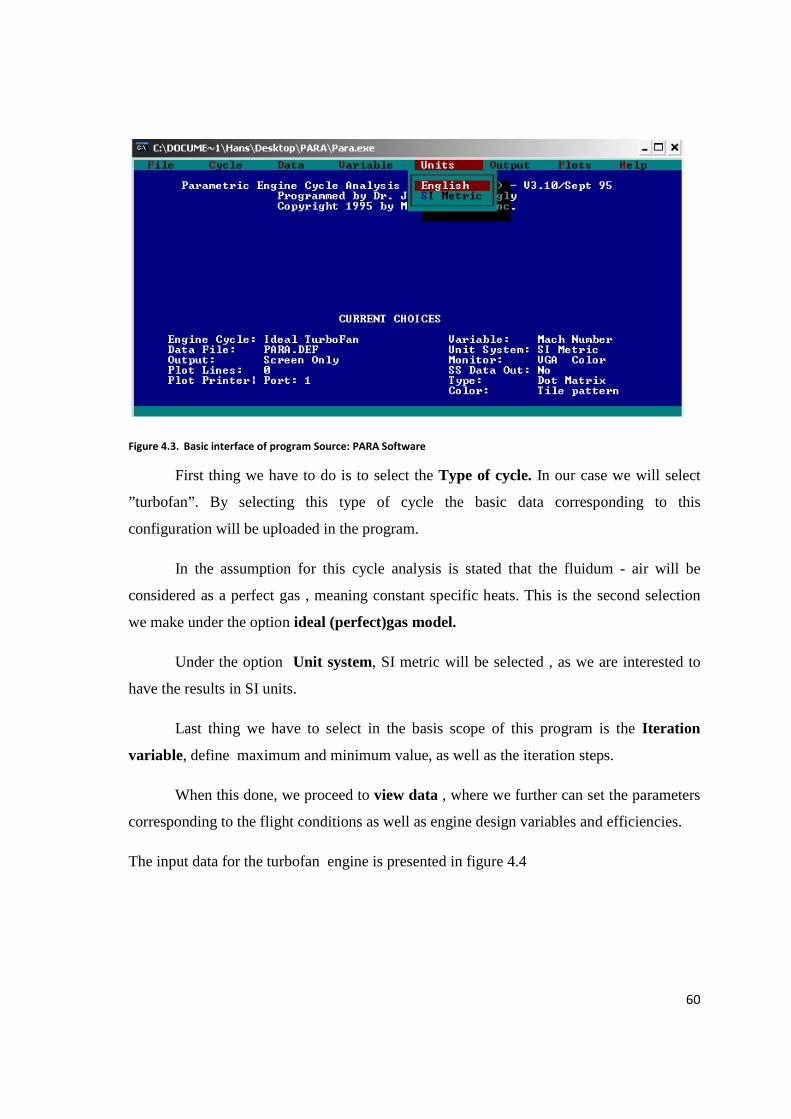
Figure 4.3. Basic interface of program Source: PARA Software
First thing we have to do is to select the Type of cycle. In our case we will select
”turbofan”. By selecting this type of cycle the basic data corresponding to this
configuration will be uploaded in the program.
In the assumption for this cycle analysis is stated that the fluidum - air will be
considered as a perfect gas , meaning constant specific heats. This is the second selection
we make under the option ideal (perfect)gas model.
Under the option Unit system, SI metric will be selected , as we are interested to
have the results in SI units.
Last thing we have to select in the basis scope of this program is the Iteration
variable, define maximum and minimum value, as well as the iteration steps.
When this done, we proceed to view data , where we further can set the parameters
corresponding to the flight conditions as well as engine design variables and efficiencies.
The input data for the turbofan engine is presented in figure 4.4
Page 61
61
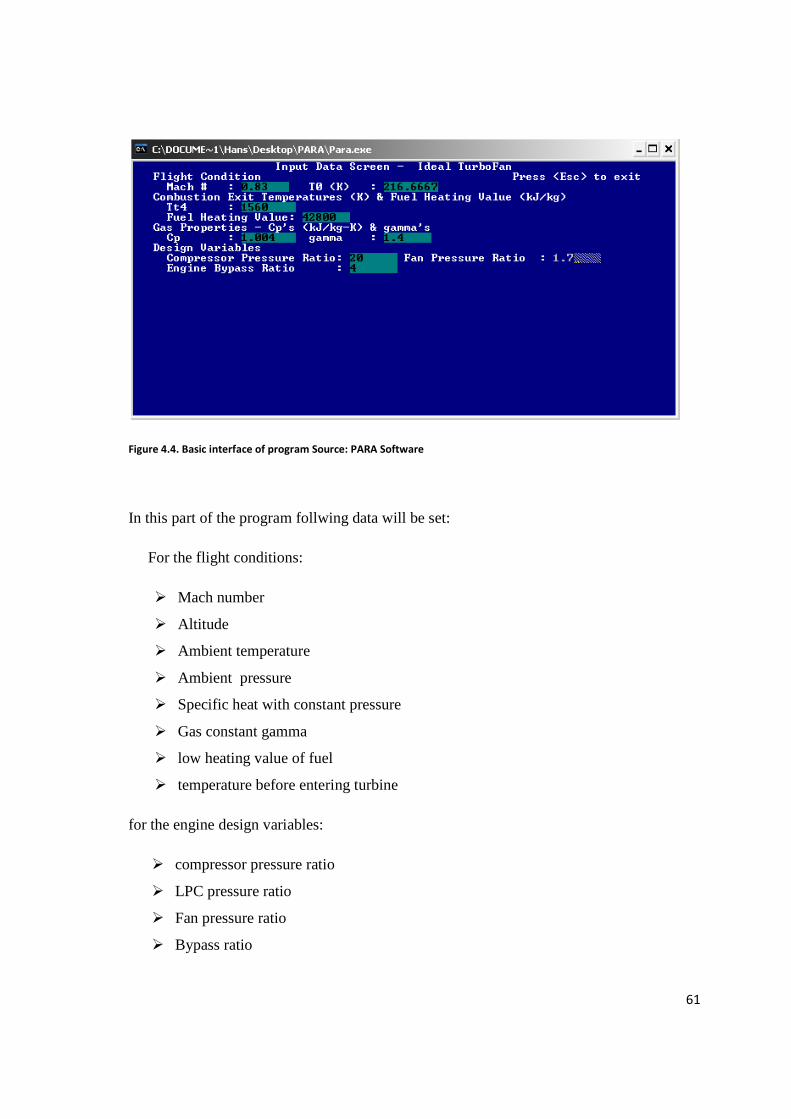
Figure 4.4. Basic interface of program Source: PARA Software
In this part of the program follwing data will be set:
For the flight conditions:
� Mach number
� Altitude
� Ambient temperature
� Ambient pressure
� Specific heat with constant pressure
� Gas constant gamma
� low heating value of fuel
� temperature before entering turbine
for the engine design variables:
� compressor pressure ratio
� LPC pressure ratio
� Fan pressure ratio
� Bypass ratio
Page 62
62
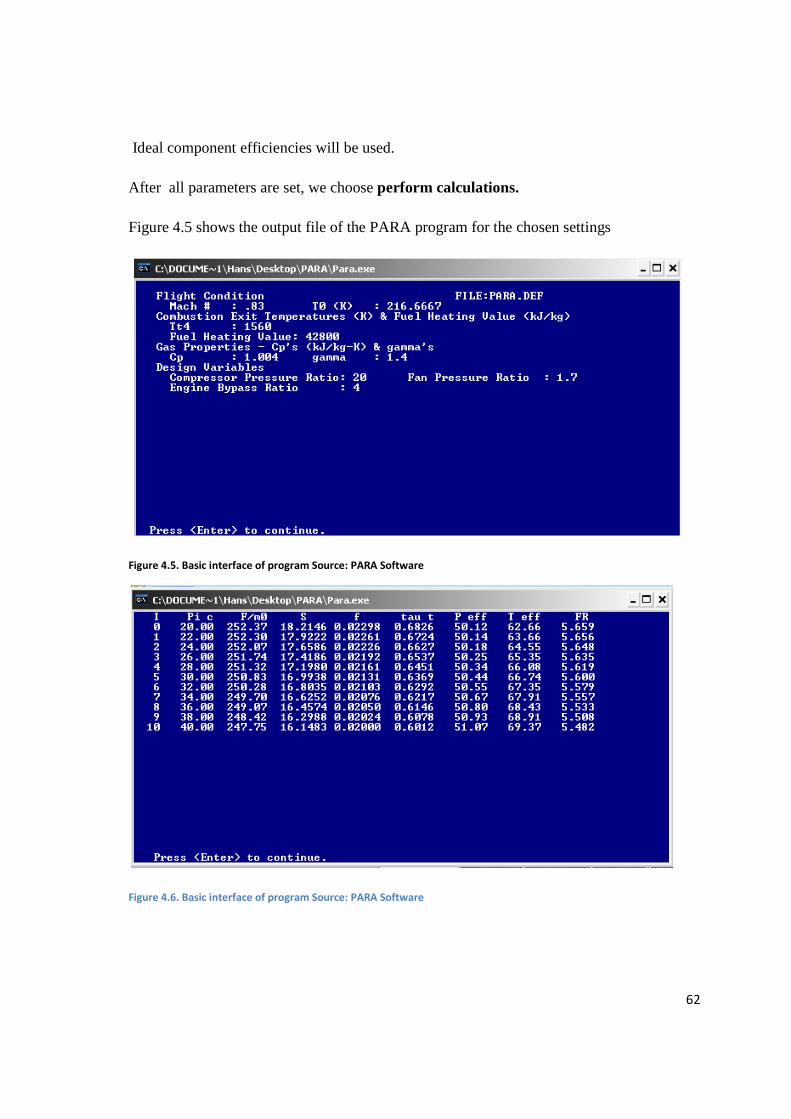
Ideal component efficiencies will be used.
After all parameters are set, we choose perform calculations.
Figure 4.5 shows the output file of the PARA program for the chosen settings
Figure 4.5. Basic interface of program Source: PARA Software
Figure 4.6. Basic interface of program Source: PARA Software
Page 63
63
Calculation of the ideal engine parameters
In this section an overview of the input data used for the PARA program, results
and graphs of the results will be presented.
Input data for the PARA program
Constants:
� Mach number M=0.83
� Altitude H=11000m
� Ambient temperature T= 216.65 K
� Ambient pressure P = 22.632 kPa
� Specific heat with constant pressure Cp=1.004 ²³
²)8o
� Gas constant gamma γ = 1.4
� low heating value of fuel 42 800 ²³²)
� temperature before entering turbine Tt4 = 1560 k
Variable:
� Evaluation of bypass ratio’s 4 ; 6 ; 8 ; 10 ;12 and optimum bypass ratio 11,7
� Variation of the compressor pressure ratio with a minimum of 20 to a maximum of
40 with increments of 2.
Results obtained from the PARA program
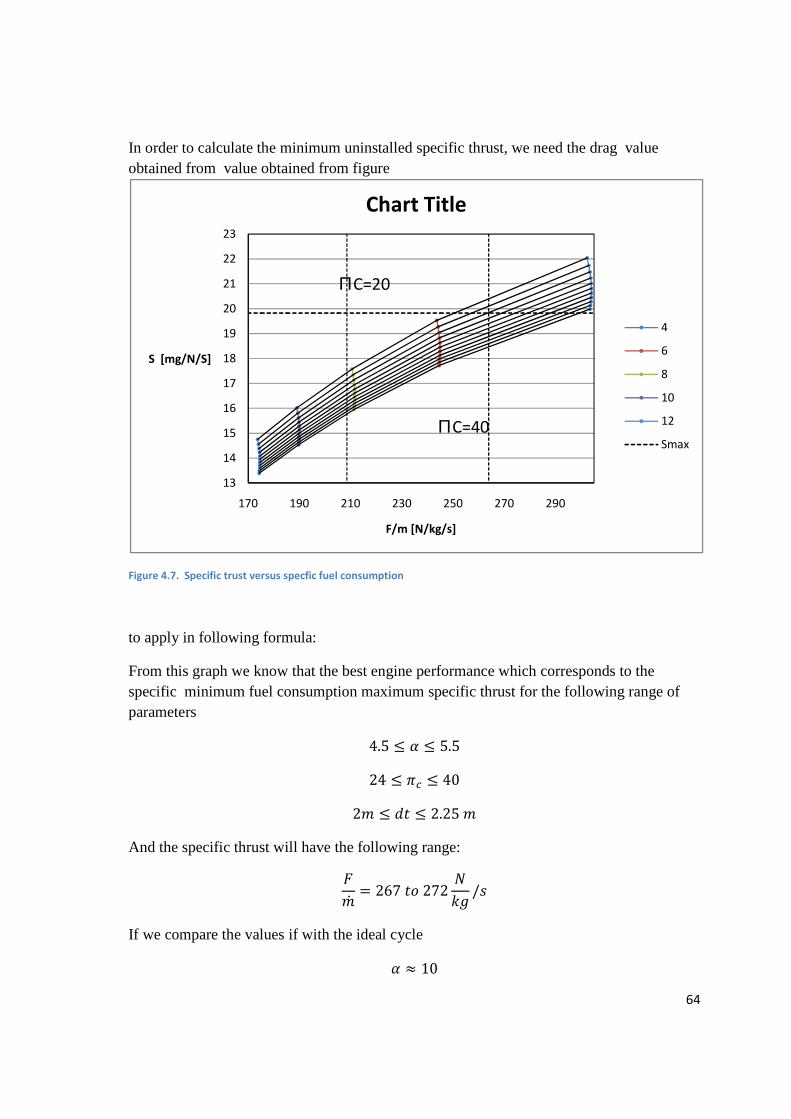
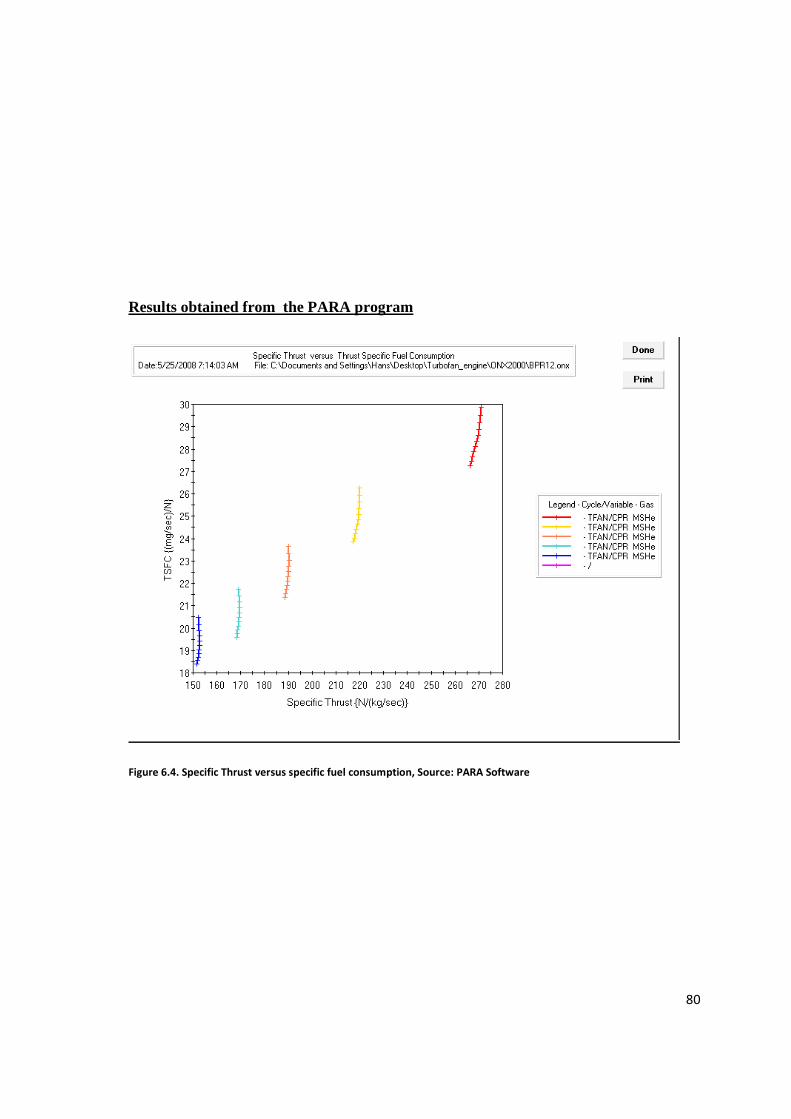
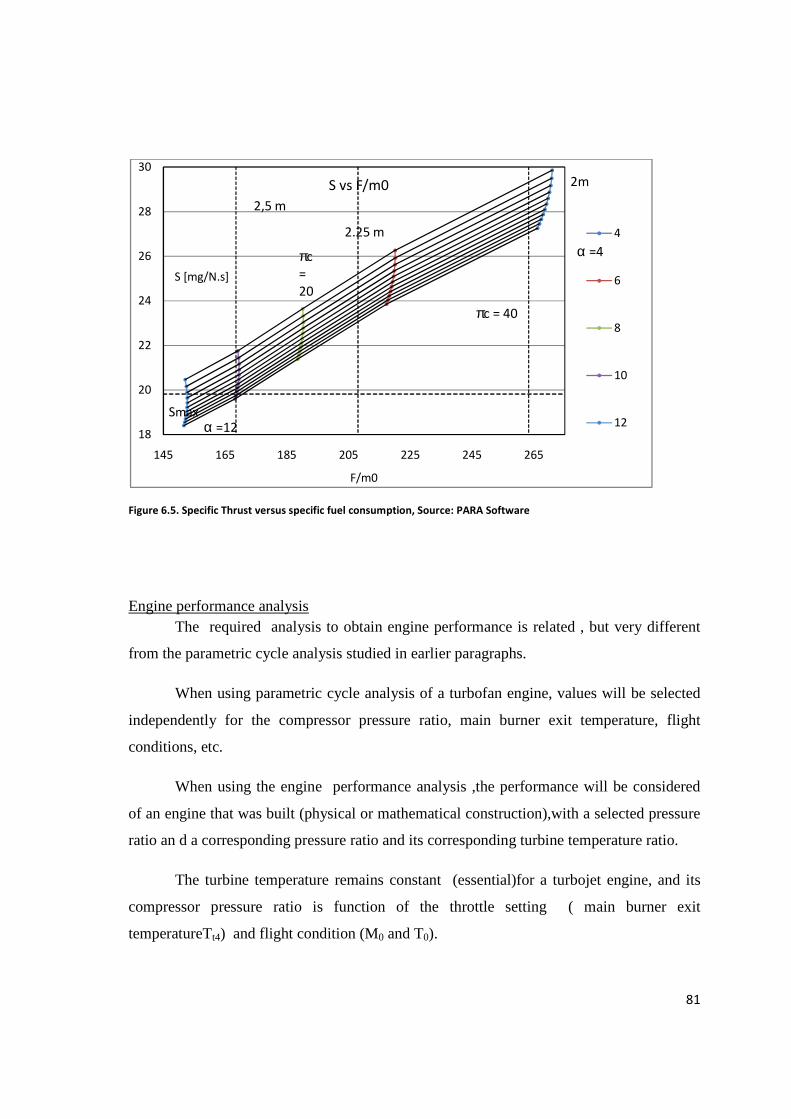
In figure 4.7, the trust specific fuel consumption is plotted versus versus the specific thrust.
Page 64
64
In order to calculate the minimum uninstalled specific thrust, we need the drag value obtained from value obtained from figure
Figure 4.7. Specific trust versus specfic fuel consumption
to apply in following formula:
From this graph we know that the best engine performance which corresponds to the specific minimum fuel consumption maximum specific thrust for the following range of parameters
4.5 ´ � ´ 5.5
24 ´ xS ´ 40
2C ´ VW ´ 2.25 C
And the specific thrust will have the following range:
QC� 267 Wµ 272 ¶ER /D
If we compare the values if with the ideal cycle
� · 10
13
14
15
16
17
18
19
20
21
22
23
170 190 210 230 250 270 290
S [mg/N/S]
F/m [N/kg/s]
Chart Title
4
6
8
10
12
Smax
ΠC=40
ΠC=20
Page 65
65
32 ´ xS ·´ 40
VW 2.5 C
We can observe that the compressor ratio , the bypass ratio and the fan diameter have greater values than in case of the ideal cycle .These differences can be explained by the energy losses that occur during the real cycle here.
Calculation of the minimum specific thrust at cruising speed M = 0,83
4u��rj�1 �h (4.44)
where:
R additional drag (landing gear, antennas) and is considered zero
W= 1563472 N ( 95% of the maximum gross take off weight .)
D = 78000 N
Ps=1,5 m/s
Now the minimum required installed thrust can be determined
T = 87598 N
Assuming that φnozzle + φinlet = 0,02 and knowing following relationship:
P Q�1 M ¹}~' % M ¹~yºº' � (4.45)
Page 66
66
We can calculate the required uninstalled thrust
F= 89386 N
Determination of the maximum airflow in the engine The subsonic inlet is constructed in such a way that in the throat M=0.8 is not
exceeded.
This is a limiting Mach number which will correspond with the maximum
corrected engine mass flow that must pass the throat.
Using this information the throat diameter can be calculated with:
V% 0,1636qCS�A&»� (4.46)
where:
dt throat diameter
CS�./0 � maximum corrected engine mass flow
For a given diameter, the maximum airflow that passes the engine can now be
calculated
CS�A&»� T L��,�:�:U�
(4.47)
The result of this formula will be in English units, meaning dt in feet and the mass
flow in pound mass per second.
A conversion will be required to SI units.
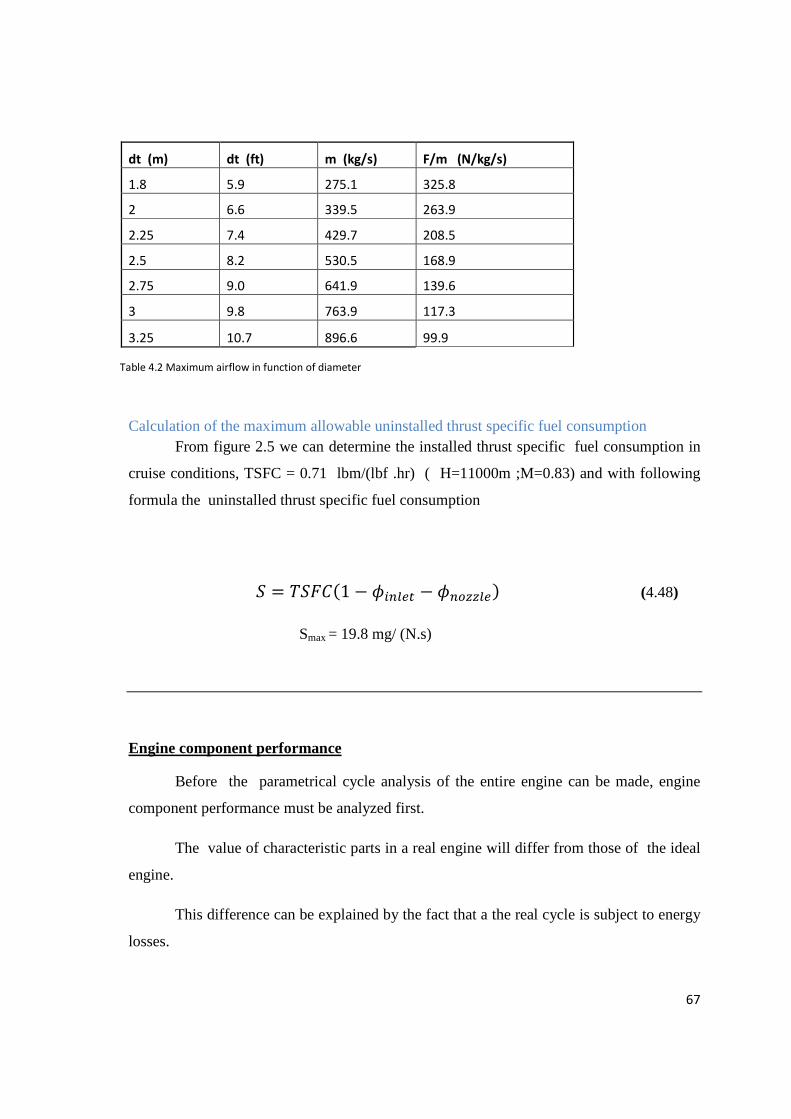
CS�A&»� (�¼) CS�A&»� (_¶½) 80,454 The maximum airflow through the engine in function of the diameter is shown in table 4.2
Page 67
67
Calculation of the maximum allowable uninstalled thrust specific fuel consumption From figure 2.5 we can determine the installed thrust specific fuel consumption in
cruise conditions, TSFC = 0.71 lbm/(lbf .hr) ( H=11000m ;M=0.83) and with following
formula the uninstalled thrust specific fuel consumption
� P�Q �1 M ¹}~' % M ¹~yºº' � (4.48)
Smax = 19.8 mg/ (N.s)
Engine component performance
Before the parametrical cycle analysis of the entire engine can be made, engine
component performance must be analyzed first.
The value of characteristic parts in a real engine will differ from those of the ideal
engine.
This difference can be explained by the fact that a the real cycle is subject to energy
losses.
dt (m) dt (ft) m (kg/s) F/m (N/kg/s)
1.8 5.9 275.1 325.8
2 6.6 339.5 263.9
2.25 7.4 429.7 208.5
2.5 8.2 530.5 168.9
2.75 9.0 641.9 139.6
3 9.8 763.9 117.3
3.25 10.7 896.6 99.9
Table 4.2 Maximum airflow in function of diameter
Page 68
68
Apart from assigning values to pressure ratio’s π and temperature ratio’s τ,
we now also must assign values to the isentropic efficiencies η and the polytrophic
efficiencies e
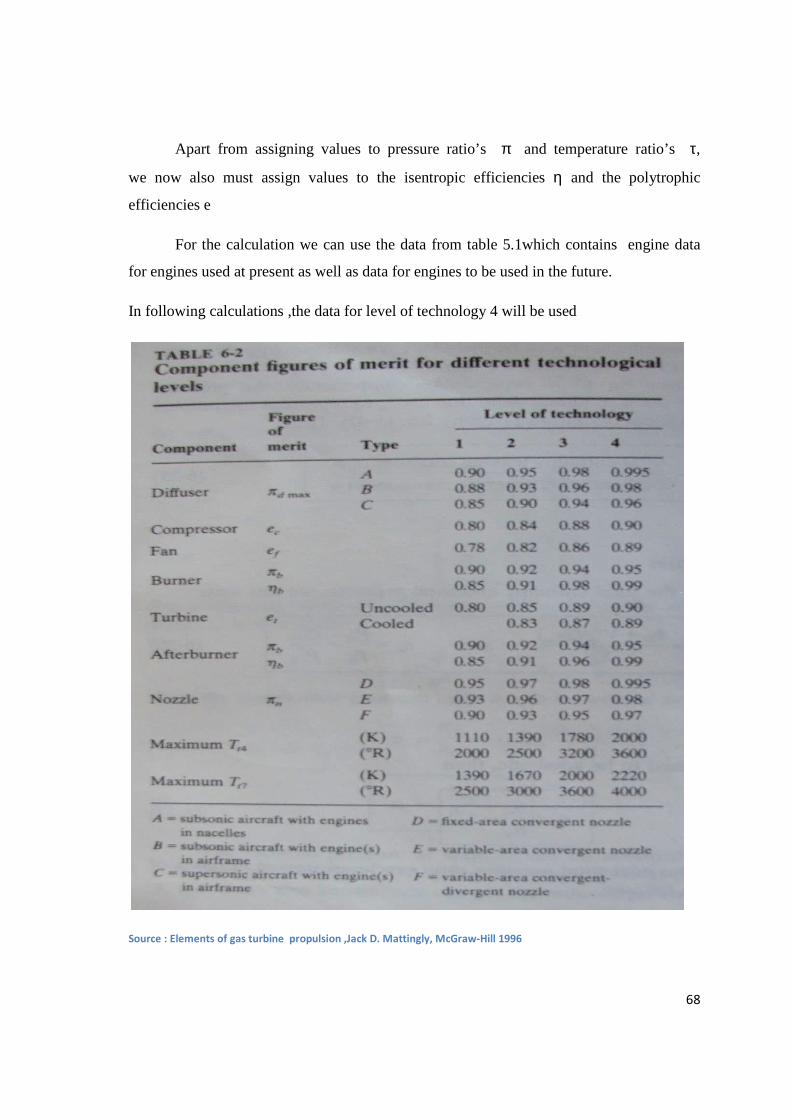
For the calculation we can use the data from table 5.1which contains engine data
for engines used at present as well as data for engines to be used in the future.
In following calculations ,the data for level of technology 4 will be used
Source : Elements of gas turbine propulsion ,Jack D. Mattingly, McGraw-Hill 1996
Page 69
69
Parameteric cycle analysis of the real engine
In this chapter the formulas will be presented to calculate the parameters of the real
turbofan engine, and permit real cycle analysis.
The results of the real cycle will be compared to the results of the ideal cycle.
Assumptions for the turbofan engine cycle analysis with losses
The steps of the cycle analysis will be applied on both the fan stream and the engine
core stream
1.Perfect gas upstream of main burner with constant properties γc ,Rc ,cpc, etc
2. Perfect gas downstream of main burner with constant properties γc ,Rc ,cpc, etc
3.All components are adiabatic (no turbine cooling )
4.The efficiencies of the compressor , fan and turbine are described through the use
of (constant) polytrophic efficiencies ec, ef and et respectively.
Formulas used in the analysis of the real engine Engine fan stream
For the fan stream following equation is valid ac A�� ���r�� &O)* ¾hp�&O M "� � ¿�¿O¥p�/O
�u�O��t* À (6.1)
We know that
Thp�&O U� 4p�4O "��� (6.2)
Page 70
70
The Mach number in the bypass nozzle is
"��� �t*u� ¾T��p��p� Uv*wpv* À (6.3)
where
��p��O x�xLx!x!~ �6.4� and
4p�4O �c��
T��p��p� Uv*wpv*
(6.5)
where
4p�4O �!�� (6.6)
Engine core stream For the core stream following equation is valid
QS �)* � CS� #� M CS� #�� � Á���� M ��� �6.7�
a* A*� &O)* ¾�1 � �� h�hO M "� � �1 � �� j�j*¿�¿O¥�/O
�u�O��t* À �6.8� and the fuel /air ratio for the main burner is defined as
Page 71
71
� ` Ac� A*� �6.9�
We know that
Th�&OU� t�j�4�t*j*4O "�� (6.10)
The Mach number in the core nozzle is
"�� �tu� ¾T���
�� Uv*wp
v* M 1À (6.11)
where
����� �O
�� x�xLxSx[x%x~ (6.12)
And
4�4O 4��/4O
(���/��)(v*wp/v*) (6.13)
where
4�4O ���L�S�[�%�~ ,�*
,�� ���% (6.14)
Application of the first law of thermodynamics to the burner
Page 72
72
C� , zSP%� � ¤[C� !G�j C� ; z%P%; (6.15)
By using the definitions of temperature ratio’s and fuel /air ratio , this equation
becomes:
���S � � �\��,�*4O �1 � ���� (6.16)
Solving for f gives
� �����*Ã�Ä����*¿�Åu�� (6.17)
The power balance between fan , compressor and turbine with a mechanical
efficiency ηm of the coupling between turbine ,compressor and fan gives
C� S�zS�P%� M P%�� � C� a�zS�P%�� M P%�� ¤AC� ;�z%�P%; M P%9� (6.18)
power into compressor power into fan net power from turbine
Dividing equation (6.18) by C� , zSP%� and using the definitions of temperature
ratios, fuel /air, and the bypass ratio , we obtain
�S M 1 � ���! M 1� ¤A�1 � �� ���� �1 M �%� (6.19)
Solving for the turbine temperature ratio gives
�% 1 M �Â.��r!� ���� �S M 1 � ���! M 1�¡ (6.20)
Turbine pressure ratio
Page 73
73
x% �%t*/Æ�t*u�� �Ç (6.21)
Isentropic turbine efficiency
¤% �u���u��p/�� (6.22)
Compressor Temperature ratio in faction of compressor pressure ratio
�S xS�t*u��/�t* *� (6.23)
Isentropic compressor efficiency
¤S È*�v*wp�/v*u��*u� (6.24)
Temperature ratio of the combustion chamber
�� ,��4��,�*4O (6.25)
Fan temperature ratio
�! x!�t*u��/�t* c� (6.26)
Fan polytropic efficiency
ÉÊ �Ê�Ë�wÌ�/Ë�uÌ�ÊuÌ (6.27)
If we combine the thrust equation for the fan stream and the engine core stream,
we get:
Page 74
74
a�A�� ��r� &O)� �1 � �� h�&O M "� � �1 � �� j�j*
¿�¿O¥�/ O�u�O��t* Î � ��r� &O)* Ïhp�&O M "� � ¿p�¿O¥p�/O
�u �O�p�t* Ð
(6.28)
The thrust specifis fuel consumption S is
� Ac�a Ac� /A���Ac� /A�� ��a/AO�� (6.29)
or
� !��r���a/AO�� (6.30)
Engine thermal efficiency
¤4 &OsÆ��r!��h�/&O�sr��hp�/&O�su��r��ÑOsÇ�)*!\�� (6.31)
Engine propulsive efficiency ¤� �ÑOÆ��r!��h�/&O�r��hp�/&O�u��r��ÑO��r!��h�/&O�sr��hp�/&O�su��r��ÑOs (6.32)
Page 75
75
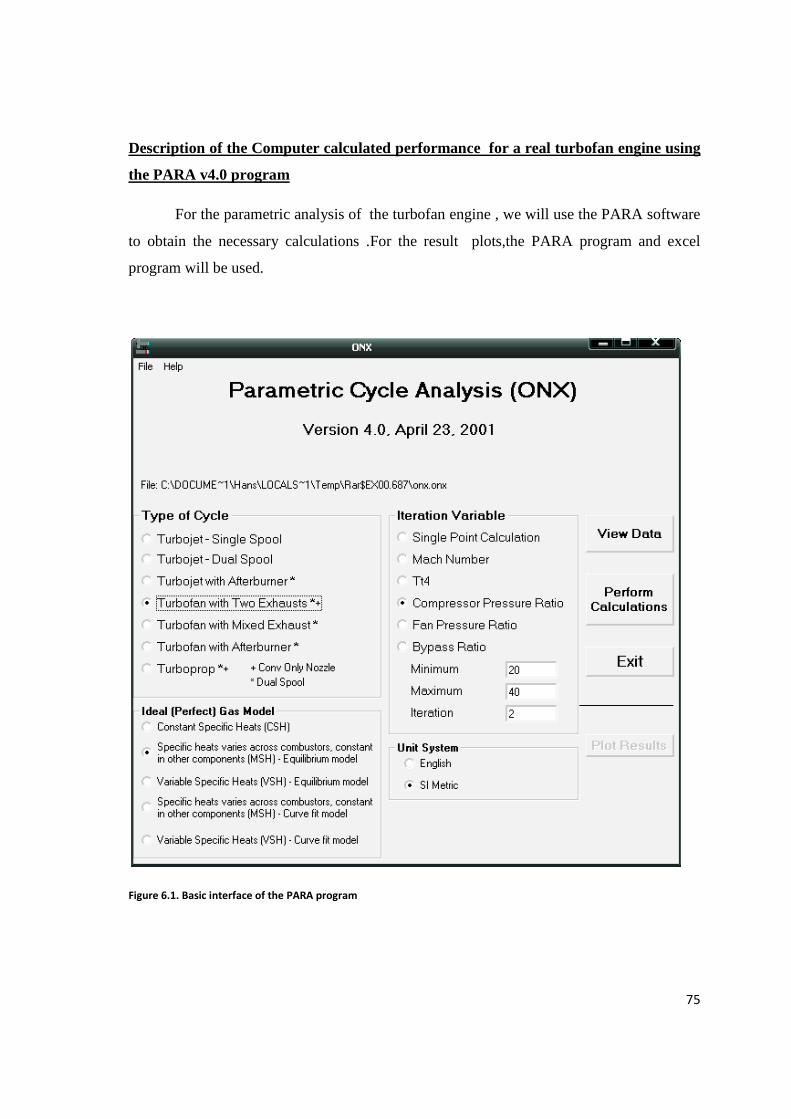
Description of the Computer calculated performance for a real turbofan engine using
the PARA v4.0 program
For the parametric analysis of the turbofan engine , we will use the PARA software
to obtain the necessary calculations .For the result plots,the PARA program and excel
program will be used.
Figure 6.1. Basic interface of the PARA program
Page 76
76
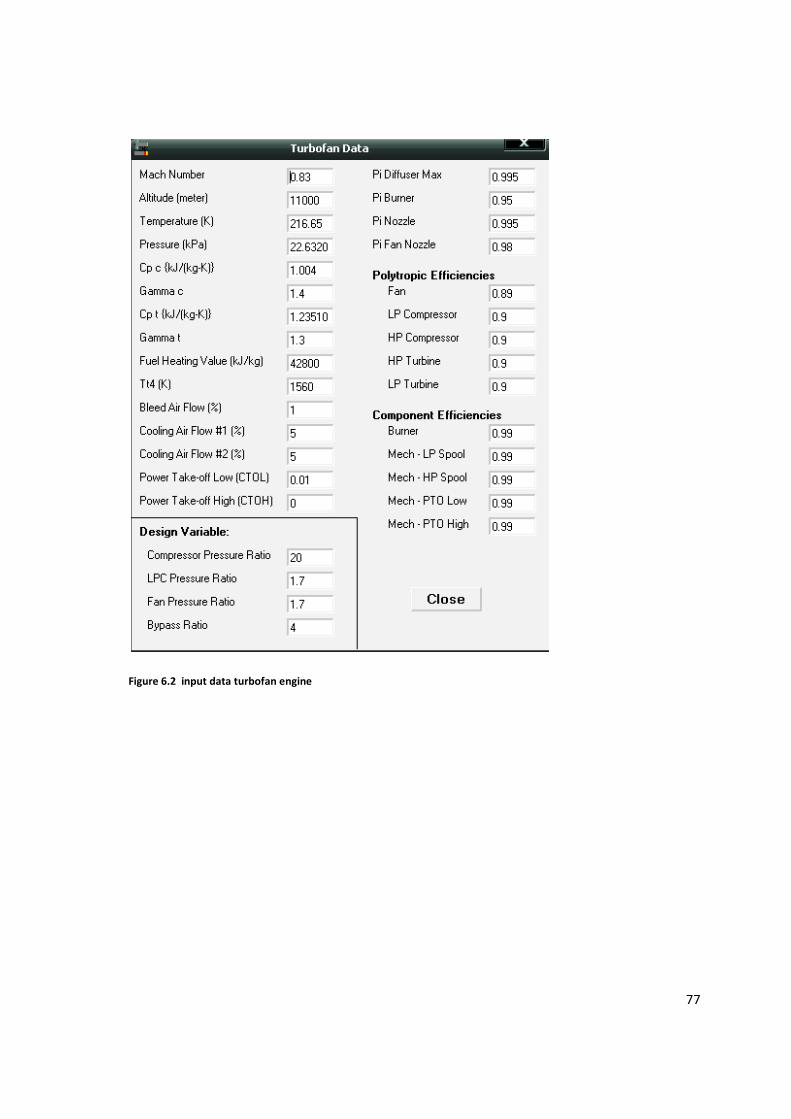
First thing we have to do is to select the Type of cycle. In our case we will select
”turbofan with two exhausts”. By selecting this type of cycle the basic data corresponding
to this configuration will be uploaded in the program.
In the assumption for this cycle analysis is stated that the fuidum – air will be
considered as a perfect gas , with constant specific heat cpc upstream of the combustor , and
a perfect gas with constant specific heat cpt downstream of the combustor. This is the
second selection we make under the option ideal (perfect)gas model.
Under the option Unit system, SI metric will be selected , as we are interested to
have the results in SI units.
Last thing we have to select in the basis scope of this program is the Iteration
variable, define maximum and minimum value ,as well as the iteration steps.
When this done, we proceed to view data, where we further can set the parameters
corresponding to the flight conditions as well as engine design variables and efficiencies.
The input data for the turbofan engine is presented in figure 6.2
Page 77
77
Figure 6.2 input data turbofan engine
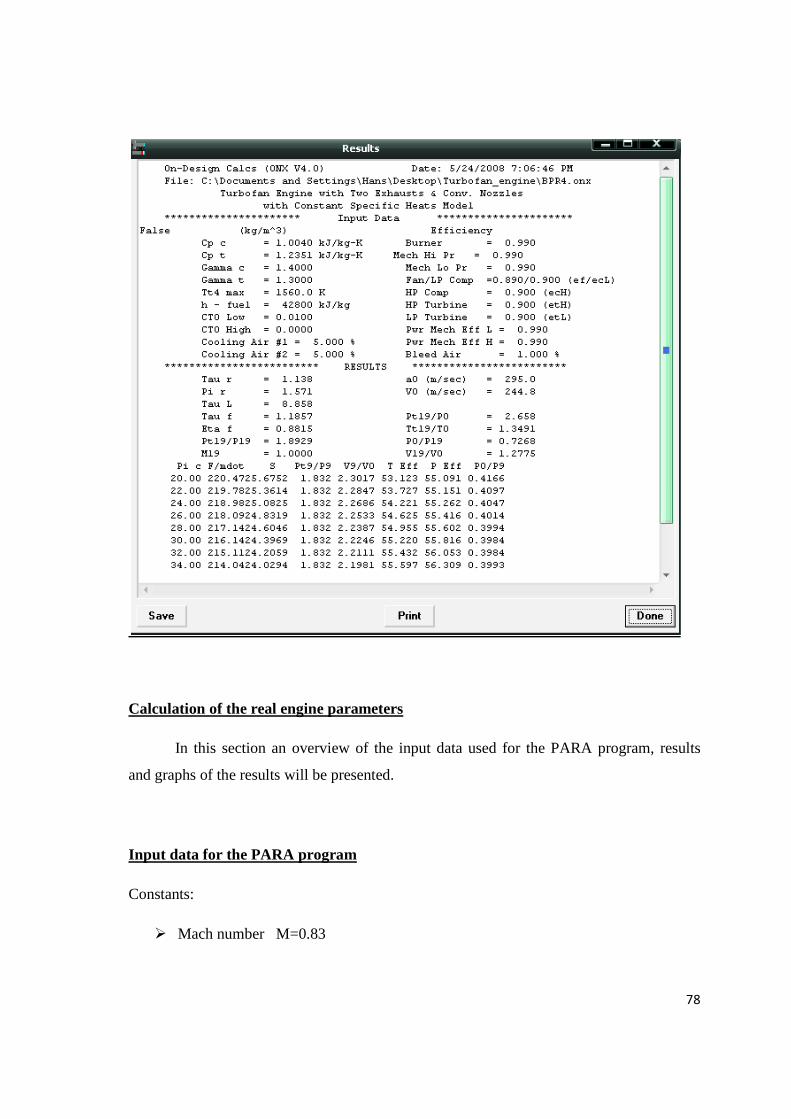
Page 78
78
Calculation of the real engine parameters
In this section an overview of the input data used for the PARA program, results
and graphs of the results will be presented.
Input data for the PARA program
Constants:
� Mach number M=0.83
Page 79
79
� Altitude H=11000m
� Ambient temperature T= 216.65 K
� Ambient pressure P = 22.632 kPa
� Specific heat with constant pressure in compressor Cpc=1.004 ²³²)8o
� Specific heat with constant pressure in turbine Cpt=1,235 ²³²)8o
� Fan pressure ratio πf =1.7
� Gas constant gamma compressor γc = 1.4
� low heating value of fuel hpr 42 800 ²³²)
� Gas constant gamma compressor γt = 1.3
� temperature before entering turbine Tt4 = 2000 k
values obtained from table 5.1,component figures of merit for different levels of
technology, level 4 components will be used
� diffuser pressure ratio πdmax , burner pressure ratio πb ,core nozzle pressure ratio
πn ,bypass nozzle pressure ratio πfn
� polytropic efficiencies ; compressor ec , turbine et ,fan ef
� isentropic efficiency of the burner ηb
� Mechanical efficiency ηm
Variable:
� Evaluation of bypass ratio’s 4 ; 6 ; 8 ; 10 ;12 and optimum bypass ratio 11,7
� Variation of the compressor pressure ratio with a minimum of 20 to a maximum of
40 with increments of 2.
Page 80
80
Results obtained from the PARA program
Figure 6.4. Specific Thrust versus specific fuel consumption, Source: PARA Software
Page 81
81
Figure 6.5. Specific Thrust versus specific fuel consumption, Source: PARA Software
Engine performance analysis The required analysis to obtain engine performance is related , but very different
from the parametric cycle analysis studied in earlier paragraphs.
When using parametric cycle analysis of a turbofan engine, values will be selected
independently for the compressor pressure ratio, main burner exit temperature, flight
conditions, etc.
When using the engine performance analysis ,the performance will be considered
of an engine that was built (physical or mathematical construction),with a selected pressure
ratio an d a corresponding pressure ratio and its corresponding turbine temperature ratio.
The turbine temperature remains constant (essential)for a turbojet engine, and its
compressor pressure ratio is function of the throttle setting ( main burner exit
temperatureTt4) and flight condition (M0 and T0).
18
20
22
24
26
28
30
145 165 185 205 225 245 265
S [mg/N.s]
F/m0
S vs F/m0
4
6
8
10
12
πc
=
20
α =12
α =4
Smax
πc = 40
2,5 m
2.25 m
2m
Page 82
82
Table 7.1 lists a comparison of analysis variables
Table 7.1 comparison, of analysis variables
Variable Parametric cycle Engine performance
Flight condition
(M0,T0 and P0) independent independent
Compressor pressure ratio πc Independent dependent
Main burner exit temperature
Tt4 independent Independent
Turbine temperature ratio τt dependent Constant
Table 7.1. Source: Elements of gas turbine propulsion ,Jack D. Mattingly, McGraw-Hill 1996
In the parametric cycle analysis the main burner exit temperature and aircraft flight
conditions were specified via the design inputs M0,T0 ,P0 and Tt4.
The engine cycle was selected as well as the compressor pressure ratio, and the
polytrophic efficiencies of the engine components etc.
The result of these design input variables will determine the design or reference
point of the engine. The obtained specific engine thrust and fuel consumption are only valid
for the chosen engine cycle and values of M0,T0 ,P0 ,Tt4, πc, τt ,ηc ,etc.
The engine we studied in the parametrical cycle analysis was a so called “ rubber”
engine, meaning when we change any of the above mentioned values ,the engine will
change its shape and component design to meet the thermodynamical and other
requirements.
When constructing and designing a turbofan engine , the degree of variability
depends on the available technology, the main use of the engine, and the demands set by
the designers. Most gasturbines have constant area flow passages and limited variability.
Page 83
83
When a gasturbine is installed on an aircraft, its performance varies with flight
conditions and throttle setting and is limited by the engine control system.
A good approximation of an engine’s performance can be made by assuming that
the component efficiencies remain constant.
The analysis of engine performance requires a model for the behavior of each
engine component over its actual range of operation. Thus the more accurate and complete
the model, the more accurate the results will be.
We will also take a closer look at the engine’s performance in off design conditions
as the engine is designed to perform in these conditions. However, the engine is likely to
also operate in conditions other than design conditions and this will of course affect engine
performance and the reliability of the engine
Reference values for engine performance analysis By the application of the laws of conservation of mass, energy ,momentum and
entropy for a steady one dimensional flow of a perfect gas to an engine steady-state
operating point, functional relationships can be deduced which can be used to predict
engine performance at different throttle settings and flight conditions.
Therefore
��x, �� �µ�DWÒ�W
represents a relationship between the engine variables π and τ at a steady state operating
point.
This constant can be compared to a reference condition (subscript R) :
��x, �� ��xj, �j� �µ�DWÒ�W
Page 84
84
Sea level static is the is the normal reference condition (design point ) for the value of the
gas turbine engine variables.
Assumptions for engine performance analysis 1. The flow is choked at the high pressure turbine entrance nozzle,LPT entrance
nozzle , primary exit nozzle and bypass duct nozzle.
2. The total pressure ratio’s of the main burner , primary exit nozzle , and bypass
stream exit nozzle ( x[, x~ Ò�V x!~) do not change from their reference values.
3. The component efficiencies ( ηc, ηf , ηb , ηtH , ηtL, ηmH and ηmL) do not change from
their reference values.
4. Turbine cooling and leakage effects can be neglected.
5. No power is taken from the turbine to drive accessories (or alternately , ηmH or
ηmL includes the power removed but is still constant .
6. It will be assumed that the gases are calorically perfect up- and downstream of the
main burner ,and that γt and cpt do not vary with the power setting (Tt4).
7. The term unity plus the fuel air ratio (1+f) will be considered as a constant.
Performance of the turbofan engine The turbofan engines used on commercial subsonic aircraft typically have two
spools and separate exhaust nozzles of the convergent type.
The flow in the nozzle will be choked when ����O Ó Z�tr��� ]t/�tu��
In case the exhaust nozzle is not choked , the nozzle exit pressure equals the
ambient pressure and the exit Mach number is subsonic.
To obtain a choked flow at stations 4 and 4.5 of the high pressure spool during
engine operation requires constant values of πtH, τtH , CS;� and CS;.9� .
Because the exhaust nozzles have fixed areas, this engine has 4 independent variables
M0,T0 ,P0 and Tt4
In case both nozzles are unhooked, this will result in 11 dependent variables.
The performance variables and constants are listed in table 7.1
Page 85
85
Component Variables
Independent Constant or known Dependent
Engine M0, T0, P0 C� �, � Diffuser xL ��"��, �L
Fan x!�! High-pressure compressor
xSÔ , �SÔ
Burner Tt4 x[ High-pressure
turbine x%Ô , �%Ô
Low-pressure turbine
x%� , �%�
Mixer xÑ A&» xÑ, �Ñ , ":, "�:, �Õ, ":Ö
Afterburner Tt7 xÖ×
Nozzle
����
or Á�Á=
x~, �~
Total number 6 14
Table 7.2. Source: Elements of gas turbine propulsion ,Jack D. Mattingly, McGraw-Hill 1996
Formulas used for engine performance analysis
Mass flow parameter (MFP)
The mass flow parameter is defined as follows
"Q� ` A� q4���Ö (7.1)
where
Page 86
86
A�Ö Ø# �hj4 hqt)*j4 �qt)*√j4 "(t)*j �√4 (7.2)
multiplying equation (7.2) by qP%/�% gives
A� q4���Ö "(t)*j �/��q4/4� (7.3)
replacing the static/ total property ratios with equations (4.1) and (4.2) results in
"Q��"� A� q4���Ö Ñqt)*/jÙ�rÆ�tu��/�ÇÑsÚ�vÛp�/Æs�vwp�Ç (7.4)
Low pressure compressor (��� , ���)
�S� 1 � ��! M 1� �*-�u��c�u� (7.5)
xS� Æ1 � ¤S���S� M 1�Çt*/�t*u�� (7.6)
Low pressure turbine (��� , ���)
�%� 1 M ¤%��1 M x%��t�u��/t�� (7.7)
Page 87
87
x%� x%�j( ��-��-�Ña��Ñ���Ña��Ñ�� (7.8)
Bypass ratio α An expression for the engine bypass ratio can be obtained at any operating
condition by relating the mass flow rates of the core and fan streams to their reference
values
Engine core stream
C,� A���r! ���Ö�q4��Ña��Ñ���r! (7.9)
so
A� �A� �� ������� (4���4�� (7.10)
Engine Fan stream
C� a ��p�Öp�q4�p� "Q��"��� (7.11)
so
A� �A� �� ��p���p�� (4�p��4�p�Ña��Ñp��Ña��Ñp��� (7.12)
thus combination of equation (7.9) and (7.11) leads to
� �j È*-�È*Ü�/Èc�È*-È*Ü/Èc ( ��/����c�Æ��/����c�Ç�Ña��Ñp��Ña��Ñp��� (7.13)
Engine mass flow The engine mass flow can be written as follows
Page 88
88
C�� C�j� �r��r���OÈ�ÈÝÈ*-È*Ü��OÈ�ÈÝÈ*-È*Ü�� (4���4�� (7.14)
High pressure compressor (��� , ���)
�SÔ 1 � 4��/4O�4��/4O������*-�����*- ��SÔ M 1�j (7.15)
xSÔ Æ1 � ¤SÔ��SÔ M 1�Çt*/�t*u�� (7.16)
Fan (��� , ���) The relationship of the power balance between the fan and the LPT is
¤A�C� ;.9 gW�P%;.9 M P%9� C� ! g��P%�� M P%�� � C� S g��P%�.9 M P%��
(7.17)
Rewriting this equation in terms of temperature ratios ,rearranging the variable and
constant terms , and equating the constant values to the reference values gives
��Æ��*-u��r���cu��Ç�4��/4O���u��-� ¤A��1 � ���%Ô ¢��Æ��*-u��r���cu��Ç�4��/4O���u��-� £j (7.18)
Combination with equation (7.5) results in
�! 1 � ��!j M 1� © �u��-��u��-����/�����/����
�*-�u�r����c�u���*-�u�r���c�u�� ª (7.19)
Page 89
89
where
x! 1 � ��! � 1�¤!¡ v*v*wp (7.20)
Description of the Computer calculated performance for a real turbofan engine using the PERF v 3.11 program In this part the computer program PERF (Perfomanc cycle analysis ) will be used to to determine engine performance in off-design conditions and different flight conditions.
As this is DOS software , the results will be processed with excel to obtain performance charts.
Figure 7.1 shows the PERF interface.
Figure 7.1. PERF interface
Short summary of the PERF menu. File – permits you to open files and save files,as SSD extension , and the program must have short directory name to work.
Page 90
90
Cycle – Permits selection of the engine type and configuration
DATA- allows u to change and view the input data of the engine .Here we select our input data
Variable – allows us to select an iteration variazle
Units – SI or ENG
Calculation of the ideal engine parameters In this section an overview of the input data used for the PARA program, results and graphs
of the results will be presented .The results will be analyzed and compared to the
assumptions made for the initial engine.
Input data for the PERF program Constants:
� Mach number M=0.83
� Altitude H=11000m
� Ambient temperature T= 216.65 K
� Ambient pressure P = 22.632 kPa
� Specific heat with constant pressure in compressor Cpc=1.004 ²³²)8o
� Specific heat with constant pressure in turbine Cpt=1,235 ²³²)8o
� Fan pressure ratio πf =1.7
� Gas constant gamma compressor γc = 1.4
� low heating value of fuel hpr 42 800 ²³²)
� Gas constant gamma compressor γt = 1.3
� temperature before entering turbine Tt4 = 2000 k
Page 91
91
� by pass ratio α =10
� mass airflow of 340 kg/s
values obtained from table 5.1,component figures of merit for different levels of
technology
� diffuser pressure ratio πdmax , burner pressure ratio πb ,core nozzle pressure ratio
πn ,bypass nozzle pressure ratio πfn
� polytropic efficiencies ; compressor ec , turbine et ,fan ef
� isentropic efficiency of the burner ηb
� Mechanical efficiency ηm
Variable:
� Evaluation of altitudes 0 to 11000 m
� Mach numbers 0 to 0.9
Page 94
94
Results obtained by the PERF program As mentioned before, we will use the Excel program to process the results of our
calculations . a study is made of the real engine off-design performance in relation
to the variation to Mach number and altitude
In previous chapter we calculated that the required thrust should 89386 N calculated for
following flight conditions : M=0.83 ,altitude = 11000 m.
From figure 7.4, we can see that the thrust in these conditions will be 10700 N.
As we have 2 engines , The total thrust will be 214000N
. we must also be able to have a 2.4% climb gradient for single engine performance
on takeoff.
At M=0.25 , and at sea level this means the take of speed, we have an engine thrust of
about 68000N, enough to satisfy the 2.4% climb gradient.
In next graph , the specific thrust is plotted in function if altitude and Mach number.
Page 95
95
Figure 7. Function if altitude and Mach number
4000
54000
104000
154000
204000
254000
0 0.2 0.4 0.6 0.8 1 1.2
Thrust [N]
Mach number
T vs M
m
3
6
9
11
12
Page 96
96
Conclusions.
Designing an engine is not an easy feature !
One most well be aware of all the pitfalls that can occur during calculations, such as
mistakes in conversion of units , or calculation and static pressure ratio instead of total
pressure ratio.
Throughout this work ,from the start , we made certain assumptions , it is evident
that these assumptions must be chosen must be chosen with great care , to obtain plausible
results.
In the first part we first took a look at the properties of the aircraft , as the
aerodynamic qualities and the weight of the aircraft will determine the primary
requirements for designing the engine .
Once we have determined the basic design requirements we can begin with the
parametrical cycle analysis.
In order to design our high bypass turbofan engine , We start out with the basic
ideal model , with perfect efficiencies , no pressure losses by the components , etc.
Once this basic perfect model is created, we can “mould “ the model ,from perfect
to real by adjusting polytrophic efficiencies of the components , which will of course affect
overall performance .The quality of the used components is therefore of great importance
A “reference “ situation is created in order to evaluate performance of different
engines in the same conditions.
Our parametrical cycle analysis only permits us to analyze performance in on
design conditions, but allows us to optimize engine parameters, which will eventually lead
to a stable engine that should be able to operate over a wide range of power settings in off-
design conditions.
Page 97
97
The use of corrected variables is also introduced to make comparisons between
different engines easier. This property is used to reduce 5 dependent physical parameters to
2 independent dimensionless or corrected parameters.
Technology plays also a major part in these developments, as new material or cooling
techniques allows to further increase the thrust.
The results obtained in engine design should not be the same for a real engine than for an
ideal engine, however , it should be in there same trend.
We have also learned that for a set of given parameters, there exists one optimum bypass
ratio or one optimum compressor ratio, which corresponds to minimum fuel consumption.
This aspect ( and safety) is probably the second most important in aviation industry. If we
can optimize the specific fuel consumption, this will lead to a larger range and endurance
for the same amount of fuel , which means cost saving and less pollution of the
environment.
A thorough background in aerodynamics and thermodynamics is necessary to fully grasp
the details of engine design, especially for a correct interpretation for the vast amount of
data that influences engine performance.
Page 98
98
References http://www.airbus.com/en/aircraftfamilies/a380/
Rolls-Royce: Civil Aerospace
Rolls-Royce Trent 900 Engines Provide Power for First A380
http://en.wikipedia.org/wiki/Boeing_787
http://en.wikipedia.org/wiki/Rolls-Royce_Trent
http://en.wikipedia.org/wiki/Airbus_A380#Engines
Elements of gasturbine propulsion ,Jack D. Mattingly,McGraw-Hill 1996
Aerodynamics SFA,1997- personal