Missouri University of Science and Technology Missouri University of Science and Technology Scholars' Mine Scholars' Mine Symposia on Turbulence in Liquids Chemical and Biochemical Engineering 01 Jan 1973 Turbulent Characteristics of Two-Phase, Gas-Liquid Stratified Turbulent Characteristics of Two-Phase, Gas-Liquid Stratified Channel Flow Channel Flow D. M. Johns T. G. Theofanous R. N. Houze Follow this and additional works at: https://scholarsmine.mst.edu/sotil Part of the Chemical Engineering Commons Recommended Citation Recommended Citation Johns, D. M.; Theofanous, T. G.; and Houze, R. N., "Turbulent Characteristics of Two-Phase, Gas-Liquid Stratified Channel Flow" (1973). Symposia on Turbulence in Liquids. 116. https://scholarsmine.mst.edu/sotil/116 This Article - Conference proceedings is brought to you for free and open access by Scholars' Mine. It has been accepted for inclusion in Symposia on Turbulence in Liquids by an authorized administrator of Scholars' Mine. This work is protected by U. S. Copyright Law. Unauthorized use including reproduction for redistribution requires the permission of the copyright holder. For more information, please contact [email protected].
Transcript
Missouri University of Science and Technology Missouri University of Science and Technology
Scholars' Mine Scholars' Mine
Symposia on Turbulence in Liquids Chemical and Biochemical Engineering
01 Jan 1973
Turbulent Characteristics of Two-Phase, Gas-Liquid Stratified Turbulent Characteristics of Two-Phase, Gas-Liquid Stratified
Channel Flow Channel Flow
D. M. Johns
T. G. Theofanous
R. N. Houze
Follow this and additional works at: https://scholarsmine.mst.edu/sotil
Part of the Chemical Engineering Commons
Recommended Citation Recommended Citation Johns, D. M.; Theofanous, T. G.; and Houze, R. N., "Turbulent Characteristics of Two-Phase, Gas-Liquid Stratified Channel Flow" (1973). Symposia on Turbulence in Liquids. 116. https://scholarsmine.mst.edu/sotil/116
This Article - Conference proceedings is brought to you for free and open access by Scholars' Mine. It has been accepted for inclusion in Symposia on Turbulence in Liquids by an authorized administrator of Scholars' Mine. This work is protected by U. S. Copyright Law. Unauthorized use including reproduction for redistribution requires the permission of the copyright holder. For more information, please contact [email protected].
Normalized Energy Spectral Distribution in the Liquid Phase
253
fluid from the wall, into the region near the interface. This observation is being investigated further
to determine if such a profile is reasonable for a
fully-developed two-dimensional flow.
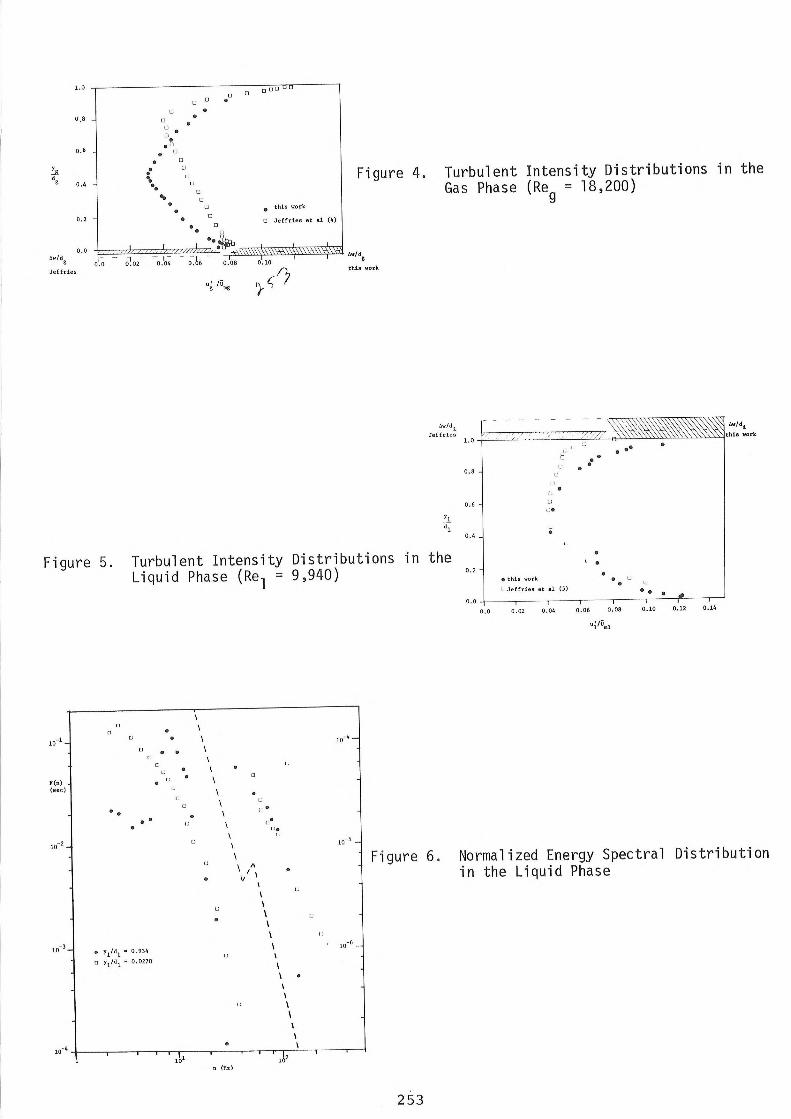
Turbulent Intensity Profiles
The turbulent intensity profiles, shown in
Figures 4 and 5, are consistent in form with the
observed mean velocity profiles. The gas-phase
profile exhibits a minimum at exactly the same
position as the maximum in the mean velocity profile.
This is not true of Jeffries' results where the maxi
mum in the mean velocity (yg/dg - 0.74) is not the
same as the minimum in the turbulent intensity pro
file (yg/dg “ 0.8). This difference is observed
when the flow field is not two-dimensional, casting
further doubt on the validity of Jeffries' results.
Near the interface, 1he gas-phase intensity attains
a local maximum and then decreases somewhat due to
the damping effect of the liquid interface.
The liquid-phase intensity profile is consistent
with the mean velocity profile except near the inter
face. Since the mean velocity is relatively constant
within this region, there is no production of turbu
lent energy due to interaction of the turbulent
shear stress and the mean velocity gradient, and the
intensity should remain constant or decrease unless
there is some other source of fluctuation energy.
However, wave passage on the interface is known to
induce unsteady motions within the liquid phase
which decay with depth. If these motions are inter
preted as turbulence, they will cause an apparent
increase in the intensity as the interface is
approached. Since these unsteady motions are sensed
by the hot-film probe, the larger waves in the
present study, as compared to Jeffries, would induce
larger disturbances, thus contributing to the
apparent increase in intensity as observed in Figure
5. Studies of the motions near the interface must
take into account these wave-associated motions as
well as the energy fed to the turbulent motions
which is extracted from the gas phase by the waves.
Turbulent Energy Spectral Distributions
The spectral energy distributions in the liquid
phase, presented in Figure 6, clearly exhibit the
effect of wave passage. The distribution near the
interface (ye/de = 0.934) exhibits a large peak
centered around 9 Hertz. The distribution near the
channel bottom (yg/dg = 0.0278) does not exhibit any
peak in this frequency range. The energy associated
with this peak contributes approximately thirty per
cent of the total turbulent energy at this location.
The wave-induced motions are responsible for this
concentration of energy and this is consistent with
the increased intensity observed near the interface.
Most of the turbulent energy is attributable to low
frequencies with no significant energy found above
100 Hertz. No comparison of these spectral distri
butions can be made as Jeffries (4,5) presented no spectral data.
The shape of the spectral distributions is char
acteristic of low Reynolds number flows. Future
studies must examine larger liquid Reynolds numbers
to consider the case of a more well-developed turbulent energy cascade.
CONCLUSIONS
The comparisons presented in this paper with
Jeffries' data should be viewed in the light that
the flow characteristics of a stratified, two-
dimensional gas-liquid flow field are extremely
complex, and the basis for similarity between two
different flow systems (or geometries) is not known.
Comparisons between two different physical realiza
tions of stratified gas-liquid flows probably cannot
be effected solely on the basis of bulk-phase
Reynolds numbers. The interfacial characteristics,
which result from the gas-liquid interaction, must
somehow be included in any meaningful comparison.
The data presented are the result of the initial
phase of an extensive study of this two-phase flow
configuration. Future work will include extensive
measurements of intensities, shear stress, turbulent
scales and spectral characteristics within the bulk
phases. These measurements will provide a sound
basis for the investigation of the motions very near the interface.
ACKNOWLEDGMENTS
This work is being supported by the National
Science Foundation, Grant No. GK-36488. This support
is gratefully acknowledged. Mr. L. K. Brumfield
assisted in the design and construction of the
equipment as well as the experimental phases, and his help is greatly appreciated.
254
SYMBOLS
d distance from top of highest wave crest to top 9 of channel, inches
d, distance from bottom of channel to bottom of1 lowest wave trough, inches
F(n) normalized energy spectral distribution, sec
n frequency, Hertz
Re gas-phase Reynolds number based on hydraulic9 diameter and bulk velocity
Re, liquid-phase Reynolds number based on hydraulic diameter and bulk velocity
TJ gas-phase mean velocity, ft/sec
ILj liquid-phase mean velocity, ft/sec
IT maximum value of gas-phase mean velocity, ft/m9 sec
F , maximum value of liquid-phase mean velocity, ml ft/sec
Ug gas-phase turbulent intensity, ft/sec
u liquid-phase turbulent intensity, ft/sec
y distance measured from top of highest wave 9 crest
y distance measured from bottom of channel,inches
Aw distance from bottom of lowest wave trough to top of highest wave crest, inches
REFERENCES
1. Churchill, M. A., Elmore, H. L., and Buckingham, R. A., "The Prediction of Stream Reaeration Rates", J. San. Eng. Div., ASCE, 88, No. SA 4, 1-46 (1962).
2. Dziubakowski, T. J., "An Apparatus for the Study of Mass Transfer and Fluid Mechanics in Two-Phase Co-current Stratified Turbulent Flow", M.S. Thesis, Purdue University, 1972.
3. Fortescue, G. E., and Pearson, J. R. A., "On Gas Absorption into a Turbulent Liquid", Chem. Eng. Sci. , 22, 1163 (1967).
4. Jeffries, R. B. , Scott, D. S., and Rhodes, E., "The Structure of Turbulence Close to the Interface in the Gas Phase of a Co-current Stratified Two-phase Flow", Symp. on Mechanisms of Two- phase Flow, 66th National Meeting, AIChE, Portland, Oregon, 1969.
5. Jeffries, R. B., Scott, D. S., and Rhodes, E., "Structure of Turbulence Close to the Interface in the Liquid Phase of a Co-current Stratified Two-phase Flow", Symp. on Fluid Mechanics and Measurements in Two-phase Flow Systems, Univ. of Leeds, England, 1969.
6. Lamont, J. C., and Scott, D. S., "An Eddy Cell Model of Mass Transfer into the Surface of a Turbulent Liquid", AIChE J., lj>., 513 (1970).
7. Lewis, W. K., and Whitman, W. G., "Principles of Gas Absorption", Ind. Eng. Chem., Ij5_, 1215 (1924).
8. Theofanous, T. G., IHouze, R. N., and Brumfield, L. K., "Turbulent Mass Transfer of Free, Gas- Liquid Interfaces", submitted for publication.
DISCUSSION
R. J. Hansen, Naval Research Lab: I have two com
ments. First, the liquid velocity measurements of
Jeffreys show a very high shear stress near the
liquid-gas interface. Do you have an explanation
for this phenomenon? Second, the utility of your
work could be enhanced by incorporating some of the
recently developed techniques for characterizing the
dynamic properties of a liquid-gas interface. Sur
factants are typically present in systems of engi
neering interest and significantly affect dynamic
interfacial behavior.
Houze: Your second point was well taken. Yes, we
intend to look very closely at what's happening at
the interface. That is a difficult problem and we
realize this. This is the first step. Now I would
have been tickled to death if our data would have
agreed with Jeffrey's. I would have said great, we
can forget about that and go on to more interesting
problems, but we can't do that; we have to answer
those questions.Regarding your first point of high shear stress.
Yes, I did a quick calculation, because this bothered
us. We see this inflection and it seems reasonable
that there should be an inflection, if you have a
255
gas shear rate imposed on the interface. Of course,
the wave structure seems to modify that because you
get separation around the waves and it is a difficult
problem. I did a quick calculation just to get some
idea of the difference in velocity across the inter
face. You have to realize I am not talking about
0.001 inch in the liquid to theO.OOl of an inch in
gas because I have this wavy region. Remember again
we scale on the basis of a Reynolds number. So things
are different. Ours is much bigger so our velocity
is going to be much lower. The maximum velocity we
measured in the liquid phase was about 0.68 feet per
second. In the gas phase the minimum right next to
the interface was 6.4 feet per second, so there is a
factor of 10 there. With Jeffrey's data we made
some estimations. In the liquid phase he had a maxi
mum velocity of about 2 feet per second. Now the
ratios are about the same, but the absolute magnitude
is quite different. In addition his waves are so
much smaller and if you consider just a viscous shear
velocity gradient at the surface, with our waves we
probably don't have that because of the separation.
I really can't answer the question, because we
haven't studied it enough to know. This is the point
we are really looking into: If we made a mistake,
should we have this large inflection there?
Shau-Zou Lu, Clarkson College: Have you observed the
drifting problem with the water measurements?
Houze: We didn't encounter any significant drifting
problems because this was only one run that we had
done. I am sure there will be drifting problems,
but we were able to reproduce our data over a period
of six or seven hours very well, we didn't have any problems that way.
V. W. Goldschmidt, Purdue University: You calibrated before and after?
Houze: Yes, we checked the characteristics of the
probe such as the bridge voltage out at zero flow and
it had not changed appreciably. In fact, we used
the probe several times taking it in and out of the
water and it didn't change appreciably. Now admittedly,
it is going to change and I know that and it has to
be taken into account. We have tried to keep our
water as cold as we could. We degassed the water
with a slight vacuum on the storage tank and conse
quently we have not had any degassing problem or
bubble formation on the probe and hot spots which
can affect the calibration. We haven't gotten so
much data that have had our probe drift enough to worry about.
Lu: I was just surprised because in our measurements,
drifting is a problem and we use distilled water in
the whole system. Did you filter your wave? It seems
to me your energy spectra show about 30 percent of
the total energy. I would assume that total intensity
should be distinguished between the large waves and
the turbulent intensity.
Houze: I agree, one point I guess I didn't make clear.
What do you call these motions induced by wave passage,
I don't call them turbulence because they are not
caused by the standard mechanisms which generate
turbulence. If you are going to talk about the con
troversy, are these motions important for the transfer
process, I recognize the problem. Maybe you ought to
take these out, extract them, remove them from con
sideration. But maybe they are important, we have to find this out. They are not turbulence.
B. M. Leadon, University of Florida: This is highly
reminiscent of the air-sea interactions with which I
am sure you must be familiar. But first there is a
point I don't understand. Did you follow the wave surface with your probe?
Houze: No, we did not, it was stationary.
Leadon: Well, then the point that I would like to
make is there are similar measurements on much larger
waves, and it may be that you could scale their re
sults down to compare with yours. This would have the
effect of showing data much closer to the interface
that you are interested in. I have no question but
that there is a tremendous interaction and certainly
momentum transport is much affected by the conditions
in both the liquid and the gas. The data that has
been taken at large scale using a wave follower does
include turbulence measurements in both phases very close to the interface.
Houze: Yes, I am very familiar with that work, we
have looked at that very closely, but my initial
point was simply, let's find out what happens in the bulk.
G. K. Patterson, University of Missouri-Rolla: Just
a short comment. You kept saying that there was a
discrepancy between your data and the data of Jeffrey,
indicating that possibly that one or the other had
right data and the other had wrong data or data that
wasn't quite as good. I was about to suggest that
256
possibly both of them are right and there is some explanation having to do with this wave interaction
and the lack of a strong connection between the two
phases when you have the bigger waves.
Houze: The size of a two-phase flow has some very
definite effects and you just can't scale things very
well. We assumed that dynamic similarity would be
preserved if we had the same Reynolds numbers and
quite obviously it is not. Of course, the question
is how much of the effect is three-dimensional probe
problems? And how much of it is a scaling problem.
We don't know.
T. J. Hanratty, University of Illinois: Why do you
have larger amplitude waves than Jeffrey's?
Houze: That is very interesting, because if you will
look at the relative heights of the waves as a func
tion of the percentage of the total height of the
channel, ours is smaller. Ours is only 2% of the he height of the gas phase. I am just saying, you try
various ways of looking at it. Maybe one of the
effects on the mean velocity profile of the gas was a
relative roughness of the waves, giving a roughness
type of effect. I think it is a geometric problem.
Ours is a bigger system, and our waves are therefore
larger. I don't have a good explanation beyond that.
A. Brandt, Johns Hopkins University: This morning we
saw how inlet effects in a channel can be propagated
to great distances downstream. I don't recall hearing
you discuss the effects of the inlet profiles and the
differences between the inlet conditions in your
case and those of the study to which you are comparing
your data. Would you also explain how the probe is
positioned relative to the interface? Since you are
interested in the transport processes you should be
interested primarily in the region right near the
interface.
Houze: Your first question was on the development
of the flow - we did check this. We looked at the
flow characteristics as a function of distance down
the channel. The length of our channel in terms of
hydraulic diameter is about 53. We were like 43
diameters downstream of the entrance. We went up
stream about 10 feet or so and looked at our char
acteristics, particularly in single-phase flow and in
some two-phase flow. We could see no significant
differences over that length. Now there may be some
effects which we haven't detected. We are making
sure that the entrance characteristics are such that
you don't have any disturbances. One comment that
I could make is that in single-phase flow we did
this to simply check ourselves and to see how good
we were. We took some single-phase data and we were
going to be very happy if it came even close to
Laufer's, it fell on top of it. So we had some
confidence that the channel itself, in terms of
single phase flow, was giving us good results for
air. Water is more difficult and we have that check
to do yet. But I have a fair amount of confidence
that it will agree. We arbitrarily picked one spike
every twenty seconds and took that as the distance
between the highest crest and lowest trough. Then
we decided to try and find where the mean is so we
said well, where should it be, if you put the probe
in there somewhere and you look at the oscilloscope
and it looks like about 50% of the time it is in and out, maybe that is the average. Then we took that
reading on our micrometer then we said well let's see
how that checks out with the average between and it
was within 0.001 of an inch. So, of course I am
not saying that should be the mean value, but we can
detect where the interphase is, with a hot-film
probe, fairly easily.
H. M. Nagib, Illinois Institute of Technology: What
is the characteristic number here? You talk about
the Reynolds number and the hydraulic diameter. I
think we are talking about a flow that is developing
from the entrance. I think that as long as it is
still developing there are several characteristic
numbers, just like a developing boundary layer. And
I think that is how you want to compare your data.
You said that yours was independent in the gas phase,
was it independent in the liquid phase?
Houze: Yes, as far as we could tell, and as far as
we could tell by looking at the wave, visually
observing the waves. Visually observing the thickness
of the liquid phase we allowed the liquid to just
reach its own level.
Nagib: Was their data fully developed? In comparing
the data I think you want to be a little bit more
specific about the other characteristic numbers.
Houze: Certainly.
W. R. Penney, Monsanto Company: You propose to
measure the fundamental characteristics of the turbu
lence and then use that to give us a design method
for mass transfer?
Houze: We hope so.
257
Penney: And I presume that the characteristics of the
turbulence will correlate with certain dimensionless
parameters of the flow. Knowing the fundamental
characteristics of the turbulence, have you thought
about how you are going to develop this design method?
If the turbulence characteristics correlate with the
dimensionless parameters of the system, wouldn't it
be just as easy to measure the mass transfer rates
and go ahead and correlate those directly with the
dimensionless parameters of the system?
Houze: Those are two very good questions. I didn't
point this out but the group with which I work at
Purdue has been working for at least three years on
mass transfer models, and how they can be related
to flow characteristics. And we have what we think
or we hope are good models. And I think we have
some data to show that they are. We have formulated
these in terms of the turbulent characteristics but
those aren't primary data. What you would like to do
is give somebody a Reynolds number or a flow situation
and say, what is my mass transfer coefficient? If I
can get a measurement of the turbulent characteristics,
then I can tell you what the mass transfer coefficient
would be. I am going to stick my neck out and say
within 10% over about two decades of mass transfer
coefficient. What we have to do is validate this
hypothesis of ours by looking at the mass transfer
rates and simultaneously those characteristics of
turbulence we think are important. Maybe we will
find out that what we think is important is not and
it is something else. The eventual step is to try
to relate those characteristics to more gross flow
parameters that are more easily obtained, so that we
can then go directly to the mass transfer coefficient.
The only comment that I had about your second question
is that people have tried to do this, to correlate a
mass transfer coefficient with the more gross char
acteristics of flow situation and haven't been successful.
C. A. Sleicher, University of Washington: If you are
going to be interested in mass transfer rates then
the appropriate dimensionless number of course is
the Schmidt number, which typically for the mass
transfer is over a thousand or more. And of course
that means that you are going to have to get much
closer to the interface than you have so far. That would be a problem.
Houze: That is exactly correct, and we recognize
that problem. We haven't solved it, but we have
recognized it. We don't know how close is close enough.
Leadon: The gas phase effect upon the water, I think,
is a very important effect here, it causes the waves.
When the waves are in action they tend to expose new
surface, new molecules come to the surface of the
water, so I think it is very bad to consider comparing
this with a fixed surface. One of the primary variables
must involve the wave height.
Houze: I showed my bias when I made the statement
because my Ph.D. work was concerned with the flow of
the gas over a simulated liquid interface which was
impermeable and couldn't respond to the gas phase
flow. So I got to thinking that way. You are right.