87
Turfgrass Best Management Practices Water Conservation: half-empty or half-full? Regional Webinar Series May 3, 2011

Turfgrass Best Management Practices
Water Conservation: half-empty or half-full?
Regional Webinar Series
May 3, 2011
Elluminate Live!
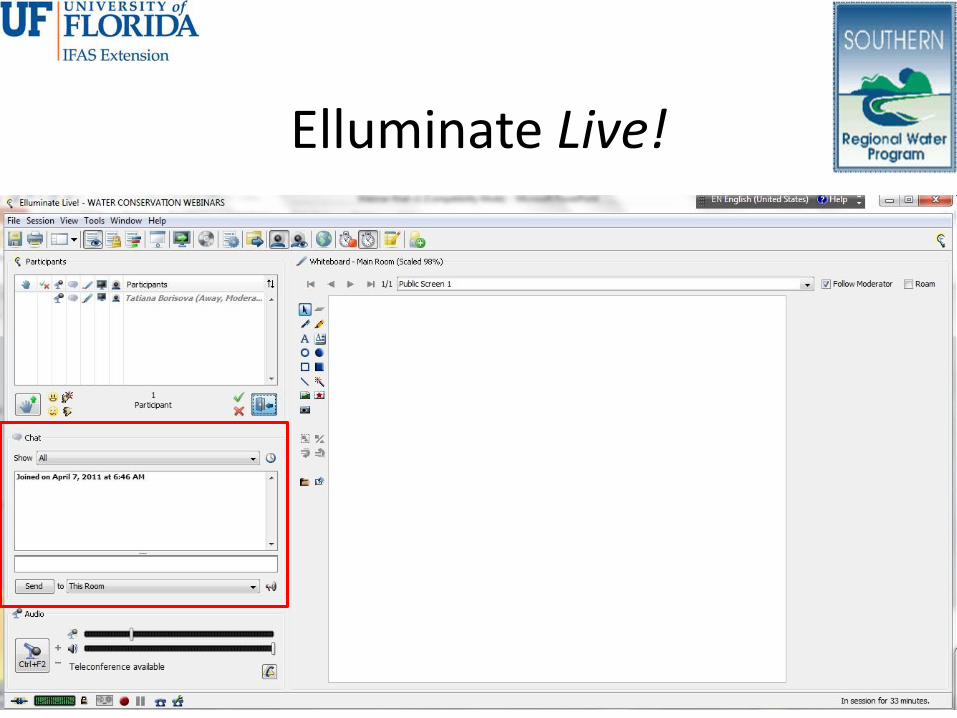
Elluminate Live!

Elluminate Live!

Webinar Overview
Use of Drought Resistant Bermudagrass Cultivars for Landscape Water Conservation
Justin Quetone Moss, PhD,
Assistant Professor, Turfgrass,
Department of Horticulture & Landscape Architecture
Oklahoma State University
Testing Irrigation Water Quality
Dara Park, PhD,
Assistant Professor, Turfgrass, Soil & Water Quality,
Horticulture Department,
Clemson University
Florence, SC
Best Management Practices for Florida’s Green Industries-
Extension and Research Programs
Laurie E. Trenholm, PhD,
Associate Professor and Turfgrass BMP Specialist,
Environmental Horticulture Department, University of Florida

Use of Drought Resistant Bermudagrass Cultivars for
Landscape Water Conservation
Water Conservation Regional Webinar Series
Southern Region Water Program
May 3, 2011
Justin Quetone Moss,
Asst. Professor,
Department of Horticulture & Landscape Architecture

Introduction
• BMP’s for turf management concerning water use and conservation
– Raise mowing height
– Proper fertility – based on soil testing
• OSU SWFAL - http://www.soiltesting.okstate.edu/
– Proper irrigation frequency, timing, quantity
• OSU Simple Irrigation Plan - http://sip.mesonet.org/
– Use of improved cultivars
• Today’s topic

Introduction
• Use of drought resistant cultivars • Bermudagrass is the most widely used turf in
Oklahoma – Is a warm-season grass and a drought resistant
species
• Tall fescue is the most widely used cool-season turf in Oklahoma, especially in eastern OK, and on shady sites – Requires intensive management – Requires about 2x’s as much irrigation water during
the growing season
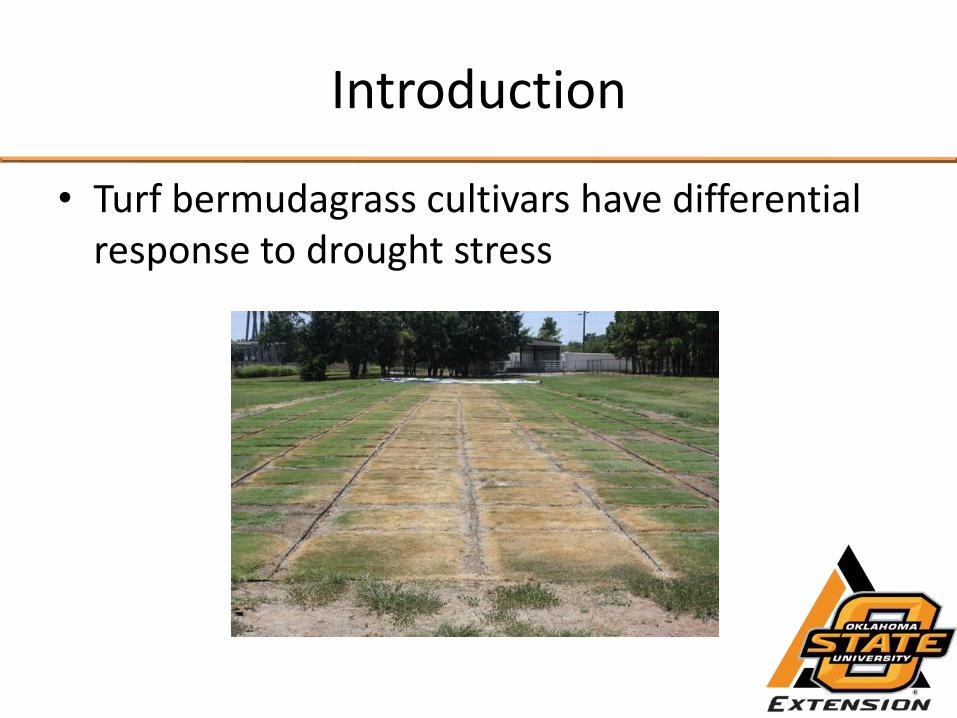
Introduction
• Turf bermudagrass cultivars have differential response to drought stress
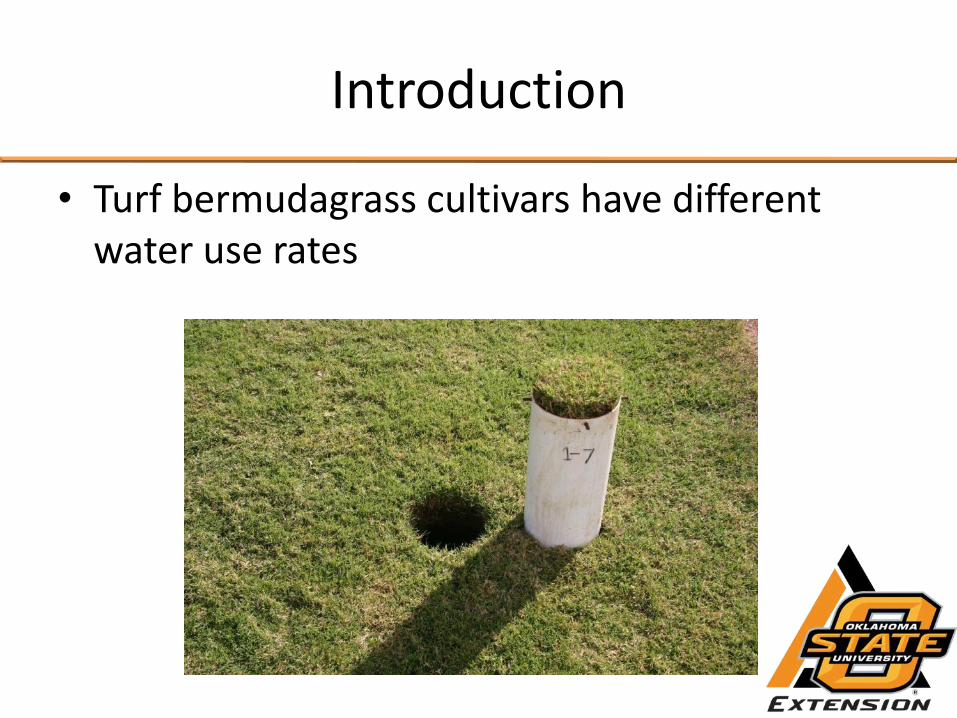
Introduction
• Turf bermudagrass cultivars have different water use rates
Goals and Objectives
• Goal is to increase the use of more drought resistant turfgrass cultivars in the landscape
• Objectives are to: – Measure and explain differences in drought
response of several turf bermudagrass cultivars
– Measure and explain differences in water use rates of several turf bermudagrass cultivars
– Promote the use of the most drought resistant turf bermudagrass cultivars in OK and the southern region of the United States.

Target Audience
• Sod Producers
• Home Builders
• Golf Courses
• Parks and Recreation
• Sports Fields
• Homeowners
• University Extension
Water Conservation Principles
• Reduce the quantity of treated municipal water applied in the landscape
– Reduce irrigation requirements of turf areas
• Promote the best cultural practices to produce high quality turfgrass under reduced irrigation
• Selection and use of drought resistant turfgrass cultivars

Research to Extension
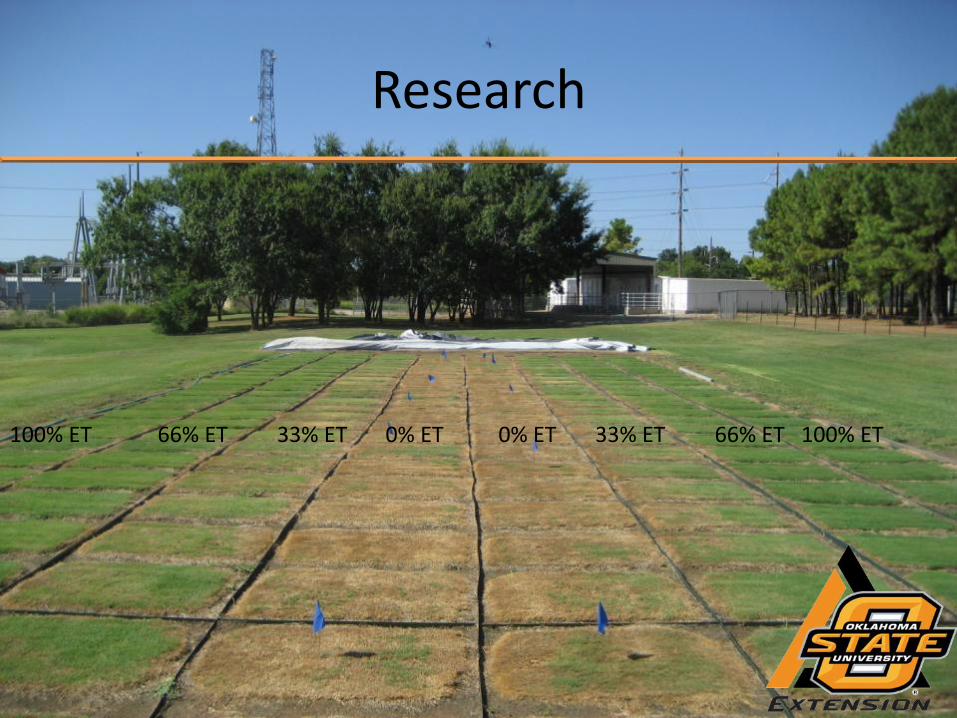
Research
100% ET 66% ET 33% ET 0% ET 0% ET 33% ET 66% ET 100% ET

Research
Bermudagrass lysimeter in field plot
Evaluation of bermudagrass water use rates

Research
Evaluation of leaf firing resistance among bermudagrass turf cultivars

Extension

Extension
• Traditional – Workshops
– Fact Sheets
• Survey Work – Perceptions
– Consumer preference
– Willingness to pay for certain attributes • Dr. Tracy Boyer, Dr. Chanjin Chung

Collaboration
• Oklahoma Water Resources Research Institute
• Oklahoma Center for the Advancement of Science and Technology
• Oklahoma Turfgrass Research Foundation
• USDA NIFA SCRI – Texas A&M University, Oklahoma State University,
University of Florida, University of Georgia, North Carolina State University,

Program Success
• We have begun to develop an understanding of which bermudagrass cultivars perform the best under drought or limited irrigation
– Sod strength
– Cold tolerance
– Disease
– Insects
– Aesthetics
Program Challenges
• Sod Producers
• Home Builders
• Specifications
• Quick-fix perception – find the grass that you don’t have to water, mow, or fertilize, but will still outcompete weeds, act as vegetative buffers/reduce surface runoff, etc.
Questions
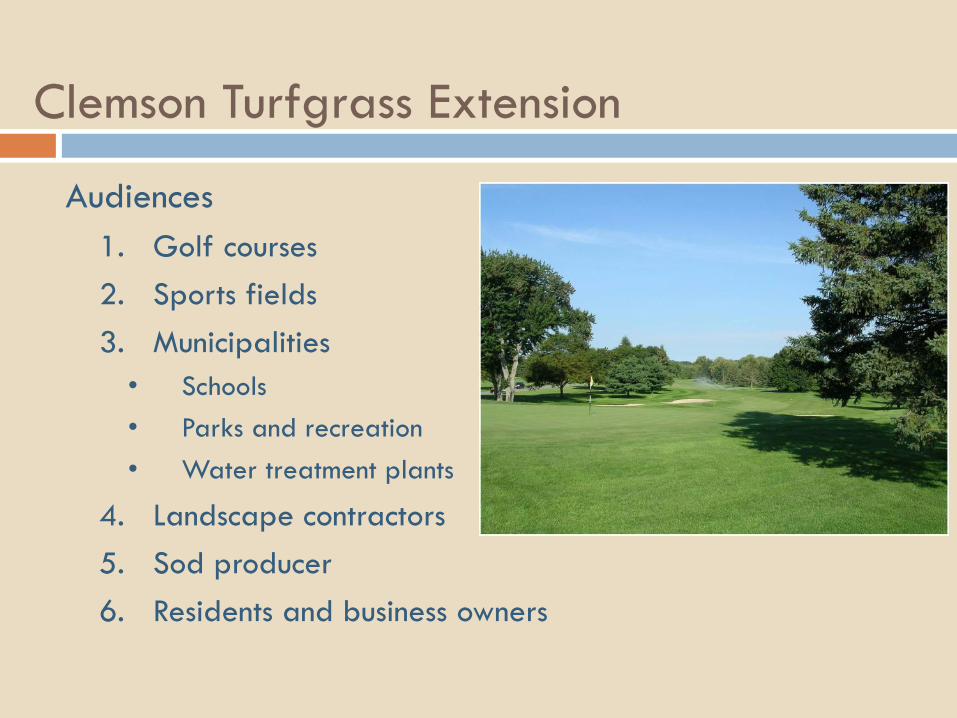
Clemson Turfgrass Extension
Audiences
1. Golf courses
2. Sports fields
3. Municipalities
• Schools
• Parks and recreation
• Water treatment plants
4. Landscape contractors
5. Sod producer
6. Residents and business owners

Clemson Turfgrass Training & Consultation
1. Association sponsored seminars and workshops
2. Field Days
3. Turf School
4. Turf Forum
5. Extension Bulletins:
www.clemson.edu/extension/hgic/plants/landscape/lawns/
6. Pest Control Guidelines:
www.clemson.edu/extension/horticulture/turf/pest_guidelin
es/
7. Turfgrass Disease Diagnostics

Clemson Turfgrass Training & Consultation
8. Carolina Clear:
www.clemson.edu/public/carolinaclear/
8. Carolina Yards & Neighborhoods:
www.clemson.edu/cyn
8. Pee Dee Backyard Landscape
Series

Clemson Turfgrass Training & Consultation
11. The Water BMP Scorecard: www.terc.ncsu.edu/

Collaborators
Carolinas Golf Course Superintendents Association:
Tim Kreger Executive Director
Superintendent Review Committee
North Carolina State University:
Charles Peacock, PhD Professor
Jennifer Reynolds Web Applications Engineer & Marketing Specialist
Clemson University:
Dara Park, PhD Assistant Professor
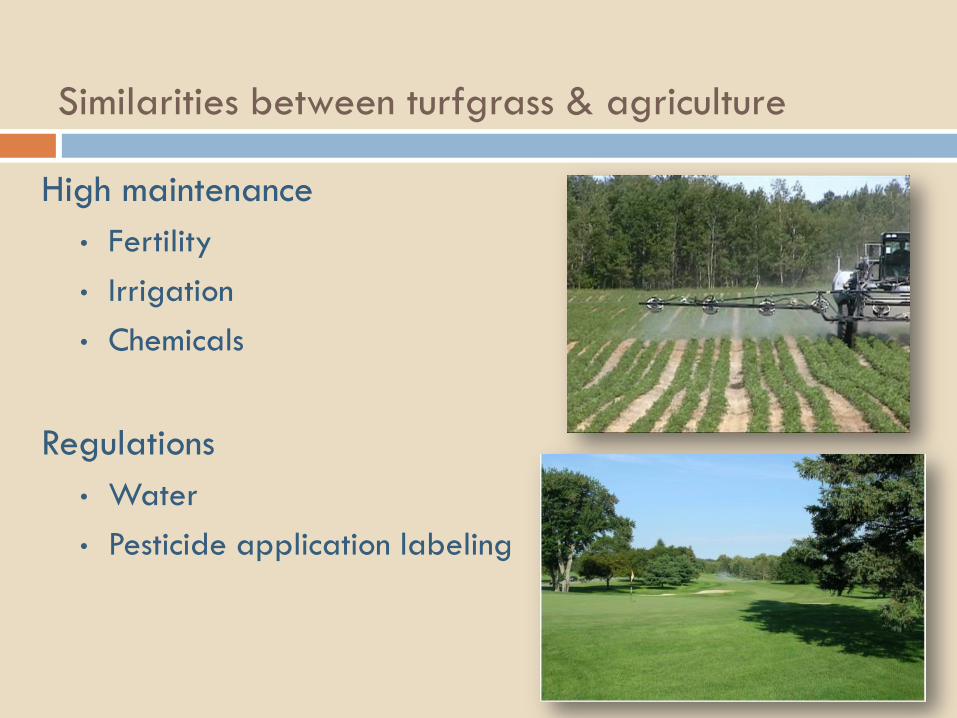
Similarities between turfgrass & agriculture
High maintenance
• Fertility
• Irrigation
• Chemicals
Regulations
• Water
• Pesticide application labeling
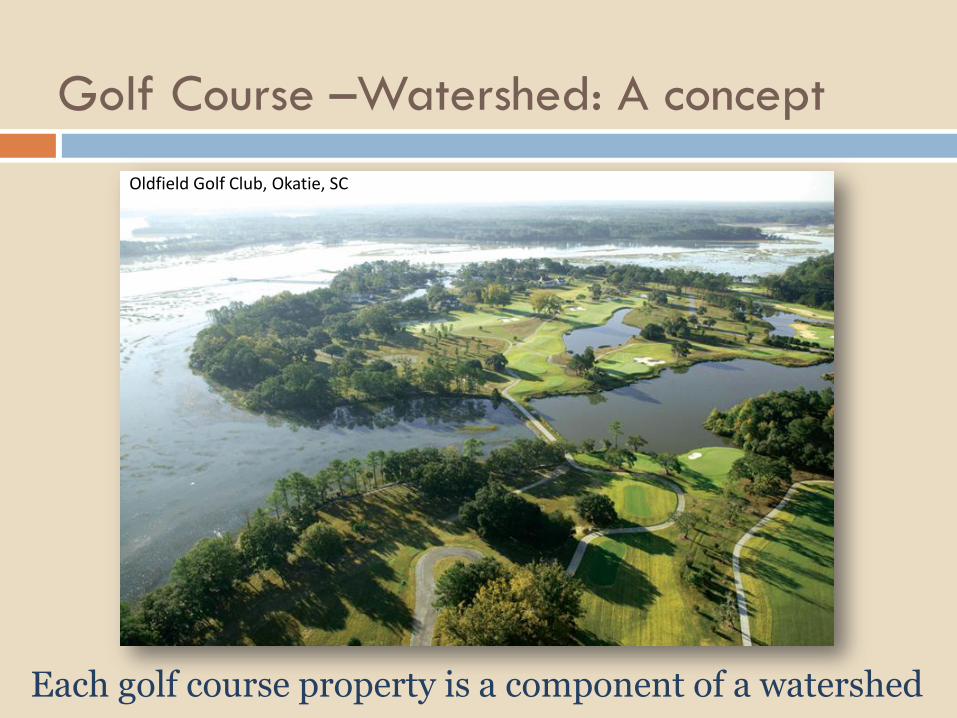
Golf Course –Watershed: A concept
Each golf course property is a component of a watershed
Nashawtuc GC, Concord,MA, USA
Oldfield Golf Club, Okatie, SC
Justification
Why should golf courses develop best water management
plans (BWMPs)?
• Superintendents understand the need to reduce water use
• Become stewards of the environment
• SCDHEC: need BWMP for any new permits
• DNR: each user needs contingency plan in case of drought.

Mission Statement
To assist golf course superintendents in implementing water conservation
and water quality management plans on all golf courses in North
Carolina and South Carolina for protection and preservation of water
resources and enhancement of golf course playability.

Scorecard
Three assessment categories
• Course characteristics
• Current BMPs
• Water use

OUTPUTS OUTCOMES 1. Workshops
2. Scorecard
• Short (2 pages)
• Score
• Description of course
• List of current BMPS
3. List of most used BMP’s
4. Increase water use reporting
1. Communication
• Course members
• Public
• Water purveyors
• Local governments
2. Quantify GC water use
3. Engage GCs to develop a
water BMP
Scorecard

Research to Outreach Example
Myrtle Beach Wastewater Treatment Plant
• Suitability study (one year)
• Increase MBWTP capacity
• Water quality for surrounding golf courses
• Outcome: quality water for turfgrass irrigation may
potentially alleviate pressure on potable water
sources.

Learning Objectives
1. Common components in irrigation water:
• Where they come from,
• What they are
2. Understand why monitoring irrigation water
quality is important,
3. How to determine your irrigation water quality:
• Sample collection,
• Interpretation of test results,

Potassium (K) Sulfate (SO4-S)
Calcium (Ca) Phosphorus (PO4-P)
Magnesium (Mg) Nitrogen (NO3-N)
Zinc (Zn) Bicarbonate (HCO3-)
Copper (Cu) Carbonate (CO3-2)
Manganese (Mn)
Iron (Fe)
Boron (B)
Sodium (Na) Electrical Conductivity (EC)
Total Dissolved Salts (TDS)
pH
Sodium Absorption Ratio (SAR)
LO1: Components of irrigation water

Sources of components

Sources of components

LO2: Why monitor irrigation water quality?
• Reliance on lower quality water sources due
to increased pressure on potable water
sources.
• Poorer quality sources may have:
• Elevated nutrient concentrations
• Pathogens
• Heavy metals
• Suspended solids
• Dissolved organic matter

LO2: Why monitor irrigation water quality?
• Manage for chemical problems:
• Elevated bicarbonates (HCO3) and carbonates (CO3)
• Pure water problems
• High salinity
• Iron

LO2: Why monitor irrigation water quality?
• Typically same water used for tank mixing chemicals
• Used for irrigating in chemicals
• Many pesticides stable at pH 4 to 6
• Some pesticides ineffective due to:
• pH
• hardness
• Salinity?

LO3: Where to Sample:
Lakes/Reservoirs/Rivers
• Middle of the water column
• Avoid placement of pipe and sample collection
on water surface and bottom.

Where to Sample:
Lakes/Reservoirs/Rivers
Nalgene Grab Sampler Horizontal
Subsurface Sampler
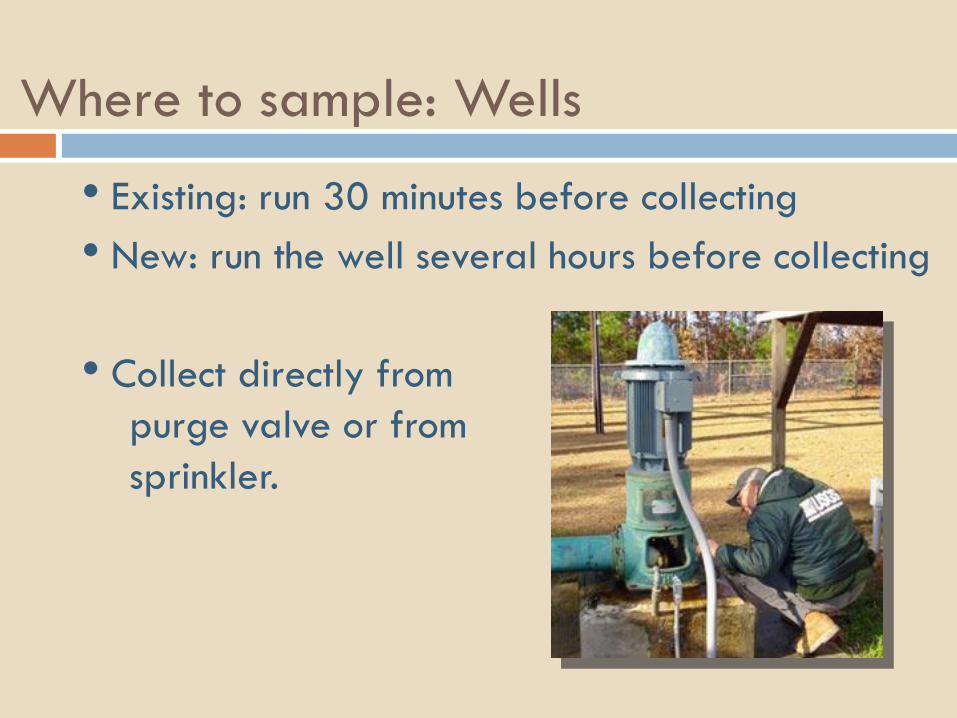
Where to sample: Wells
• Existing: run 30 minutes before collecting
• New: run the well several hours before collecting
• Collect directly from
purge valve or from
sprinkler.

Where to sample: Distribution Systems
• Flush lines first
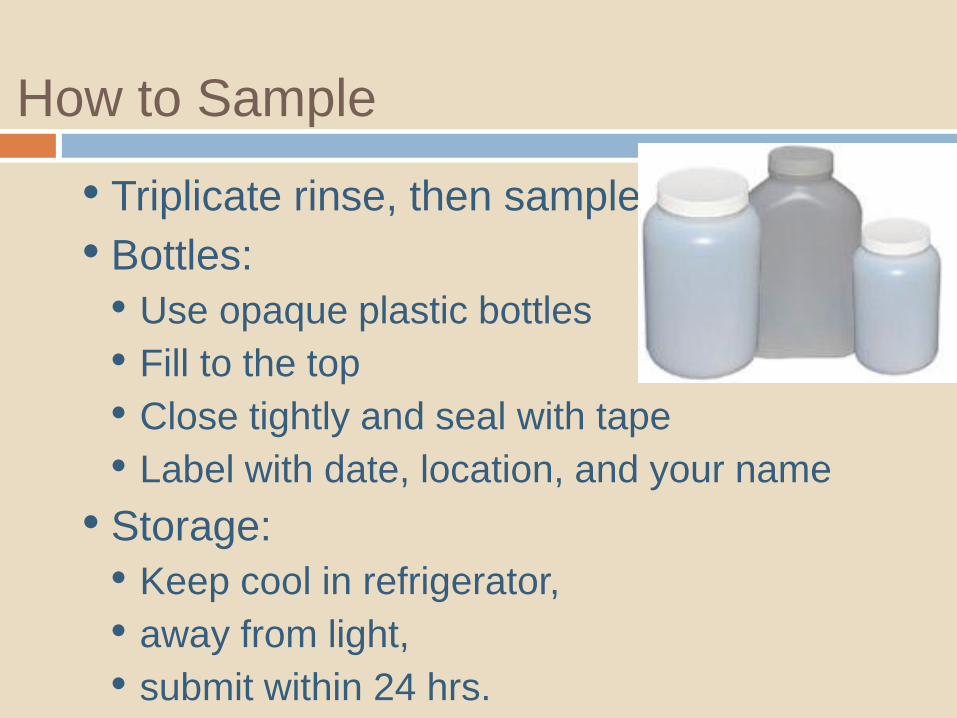
How to Sample
• Triplicate rinse, then sample
• Bottles:
• Use opaque plastic bottles
• Fill to the top
• Close tightly and seal with tape
• Label with date, location, and your name
• Storage:
• Keep cool in refrigerator,
• away from light,
• submit within 24 hrs.
Irrigation Testing
• Your land grant university
• Clemson University Agricultural Service Laboratory:
www.clemson.edu/agsrvlb/
• State agencies • NC Dept of Ag and Consumer Services
www.ncagr.gov/htm/services.htm
• Private laboratories
• ALWAYS keep with the same lab!

Irrigation water testing references
Guidelines for interpretation of water quality for irrigation:
http://www.clemson.edu/agsrvlb/IRRWAT.htm
Turfgrass and Landscape Irrigation Water Quality: Assessment and Management.
2009, by Duncan, Carrow and Huck
Salt Affected Turfgrass Sites: assessment and Management. 2000, by Duncan and
Carrow

Questions
Best Management Practices for Florida’s Green Industries- Extension and Research Programs
Laurie E. Trenholm,
Associate Professor and Turfgrass BMP Specialist
University of Florida

Green Industries BMP – an Extension Education Program
• Training began in 2003 as a voluntary program
• Local fertilizer ordinances started to require training in 2007
• Legislation passed in 2009 makes training mandatory for all commercial fertilizer applicators by 2014

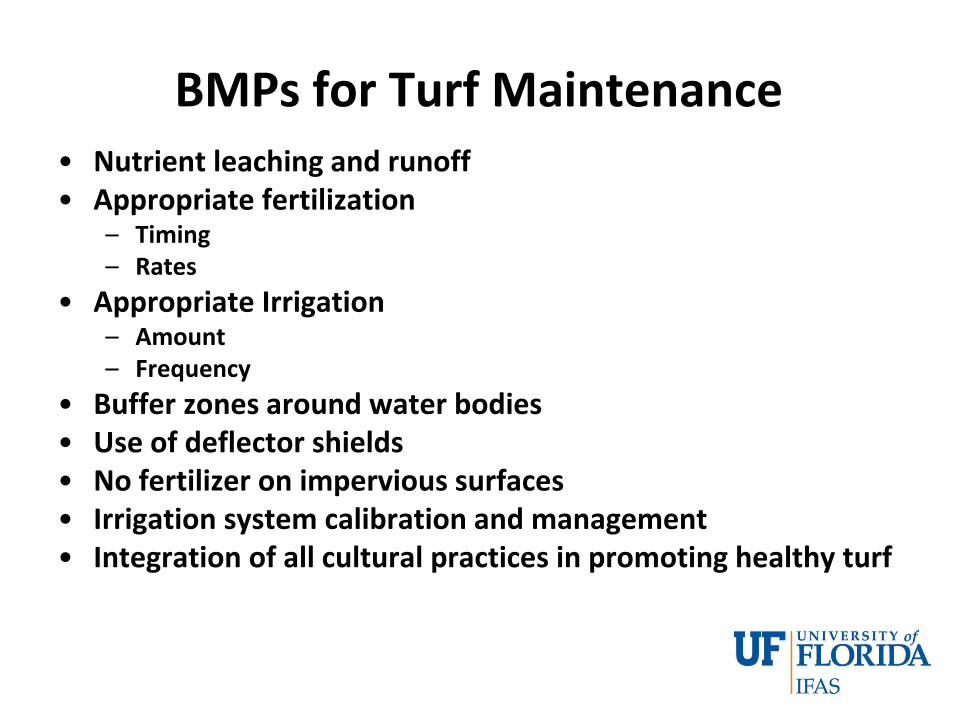
BMPs for Turf Maintenance • Nutrient leaching and runoff

BMPs for Turf Maintenance • Nutrient leaching and runoff • Appropriate fertilization
– Timing – Rates
BMPs for Turf Maintenance • Nutrient leaching and runoff • Appropriate fertilization
– Timing – Rates
• Appropriate Irrigation – Amount – Frequency
BMPs for Turf Maintenance • Nutrient leaching and runoff • Appropriate fertilization
– Timing – Rates
• Appropriate Irrigation – Amount – Frequency
• Buffer zones around water bodies
BMPs for Turf Maintenance • Nutrient leaching and runoff • Appropriate fertilization
– Timing – Rates
• Appropriate Irrigation – Amount – Frequency
• Buffer zones around water bodies • Use of deflector shields

BMPs for Turf Maintenance • Nutrient leaching and runoff • Appropriate fertilization
– Timing – Rates
• Appropriate Irrigation – Amount – Frequency
• Buffer zones around water bodies • Use of deflector shields • No fertilizer on impervious surfaces

BMPs for Turf Maintenance • Nutrient leaching and runoff • Appropriate fertilization
– Timing – Rates
• Appropriate Irrigation – Amount – Frequency
• Buffer zones around water bodies • Use of deflector shields • No fertilizer on impervious surfaces • Irrigation system calibration and management
BMPs for Turf Maintenance • Nutrient leaching and runoff • Appropriate fertilization
– Timing – Rates
• Appropriate Irrigation – Amount – Frequency
• Buffer zones around water bodies • Use of deflector shields • No fertilizer on impervious surfaces • Irrigation system calibration and management • Integration of all cultural practices in promoting healthy turf

BMP Attendance and Certification
0
500
1000
1500
2000
2500
3000
3500
4000
4500
2003 2004 2005 2006 2007 2008 2009

Pre and Post Test Scores
0
10
20
30
40
50
60
70
80
90
2004 2005 2006 2007 2008 2009

Attendee Evaluations
0
10
20
30
40
50
60
70
80
90
100
2003 2004 2005 2006 2007 2008 2009
Recommend BMPs
Increased knowledge
Will use BMPs

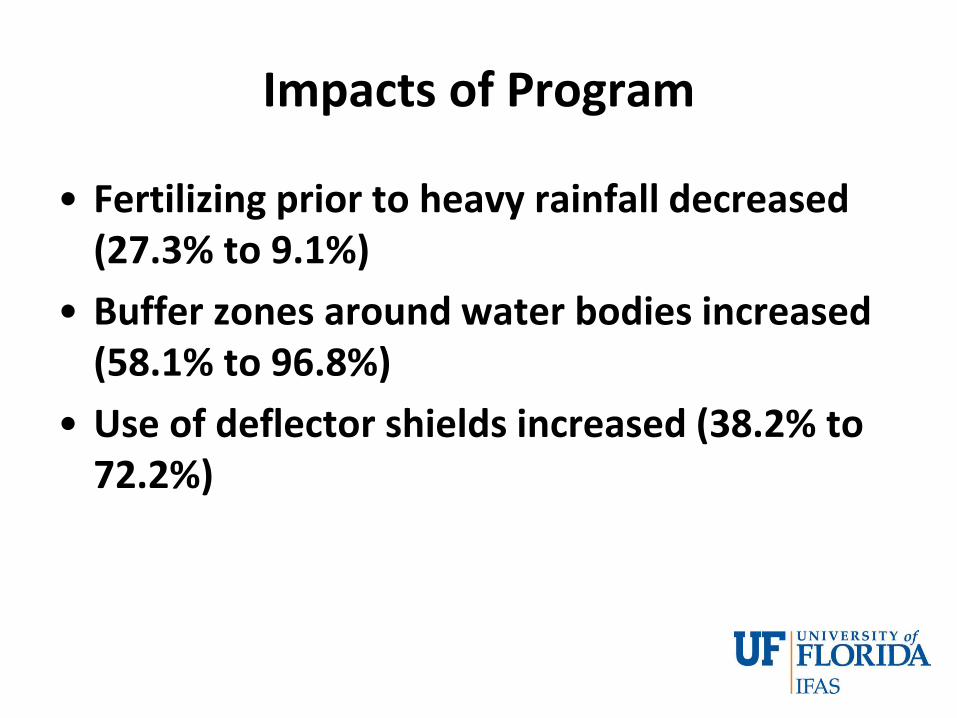
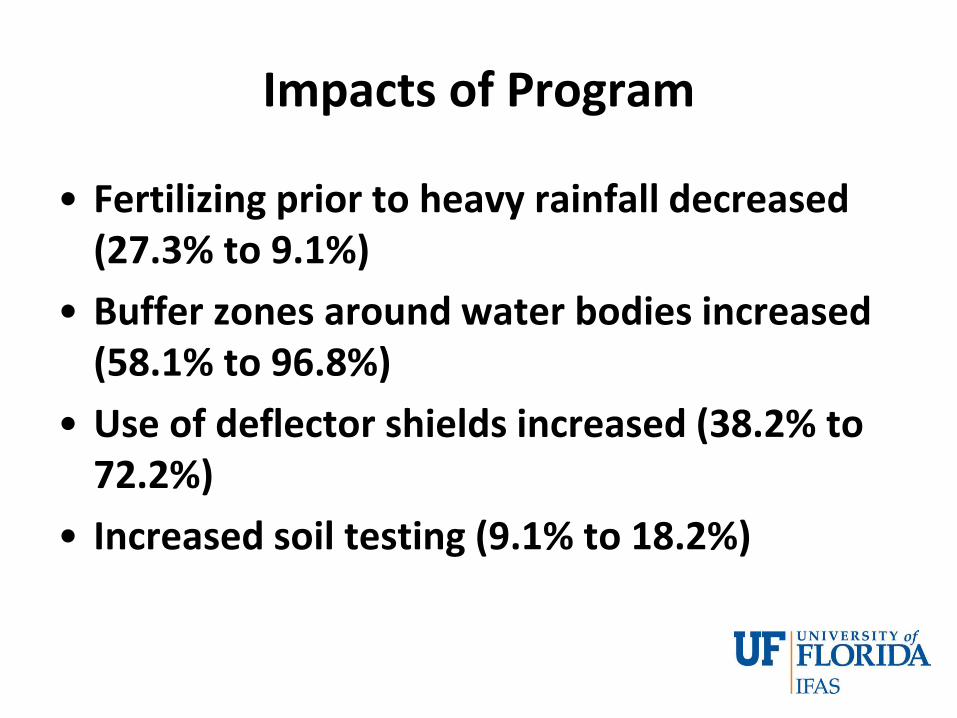
Impacts of Program
• Fertilizing prior to heavy rainfall decreased (27.3% to 9.1%)

Impacts of Program
• Fertilizing prior to heavy rainfall decreased (27.3% to 9.1%)
• Buffer zones around water bodies increased (58.1% to 96.8%)
Impacts of Program
• Fertilizing prior to heavy rainfall decreased (27.3% to 9.1%)
• Buffer zones around water bodies increased (58.1% to 96.8%)
• Use of deflector shields increased (38.2% to 72.2%)
Impacts of Program
• Fertilizing prior to heavy rainfall decreased (27.3% to 9.1%)
• Buffer zones around water bodies increased (58.1% to 96.8%)
• Use of deflector shields increased (38.2% to 72.2%)
• Increased soil testing (9.1% to 18.2%)

Nutrient Leaching Research Program
• Multi-site project
• Conducted from 2004-2012
• Completely funded by FDEP
• Looking at nitrate-N and phosphate leaching from lawn grasses under different scenarios

UF West Florida
Research and
Education Center, Jay UF Plant Science
Research and
Education Unit, Citra
Ft. Lauderdale
Research and
Education Center
DEP Nutrient
Leaching Study
2004-2012

Lysimeters buried in center of each plot

Lysimeters buried in center of each plot

As nitrate percolates downward through the column, it
collects in reservoir filled with gravel. At bottom of lysimeter
is a portal for tubing that runs to collection device
aboveground. To collect leachate, a vacuum pump is attached
the the tubing and water evacuated from base. A sub-sample
is collected for analysis.

Research Projects
1. Nitrate Leaching from Newly Sodded Turf
2. Nitrate Leaching Due to N Rate
3. Nitrate Leaching Due to N Source
4. Nitrate Leaching in Winter Months
5. Phosphorus Leaching
6. Nitrate Leaching Due to Mowing Height
7. Nitrate Leaching Due to Clipping Management

Nitrate Leaching Due to N Rate
• 3-yr study 2005-2007
• Established Floratam and Empire
• N applied in 4 applications throughout the year at rates of 1, 4, 7, or 10 lbs N 1,000 ft-2
• N applied as quick-release urea dissolved in water and applied through sprayer
• 2 irrigation regimes (1” @ 1x wkly, 0.5” @ 2x wkly)

Nitrogen Rate Study - Nitrate-N Leaching from Floratam
0
1
2
3
4
5Y
r 1 F
C1
Yr1
FC
2
Yr2
FC
1
Yr2
FC
2
Yr2
FC
3
Yr2
FC
4
Yr3
FC
1
Yr3
FC
2
Yr3
FC
3
Yr3
FC
4
1 lb N
4 lb N
7 lb N
10 lb N
Nitrogen applied as 100% soluble urea
NO
3-
N L
each
ed
(kg
ha
-1)
Trenholm et al. 2010
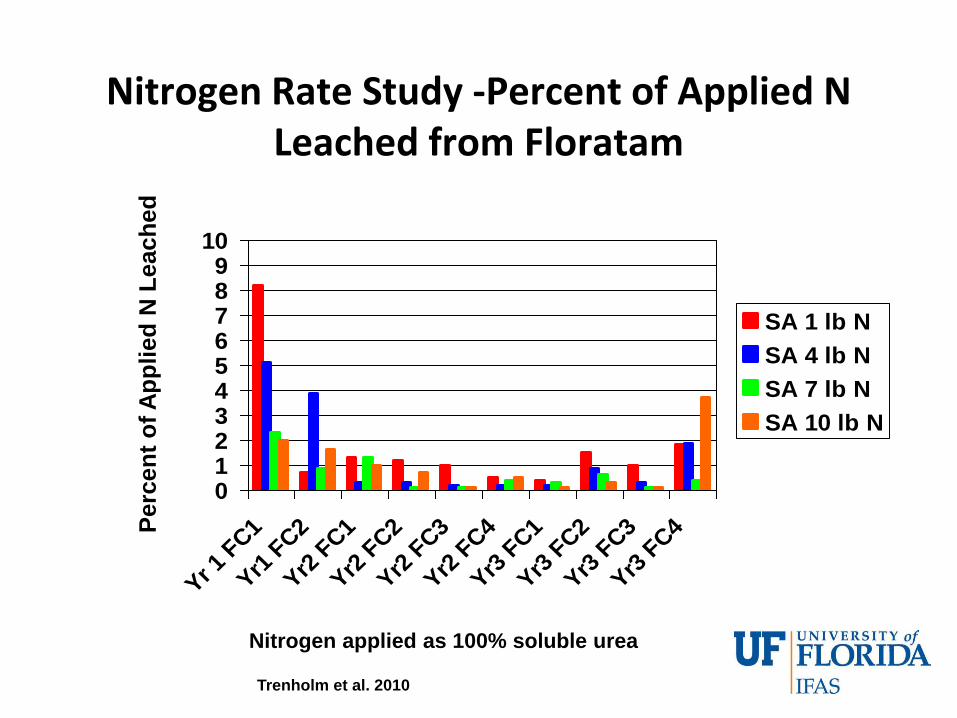
Nitrogen Rate Study -Percent of Applied N Leached from Floratam
0123456789
10
Yr 1 F
C1
Yr1 F
C2
Yr2 F
C1
Yr2 F
C2
Yr2 F
C3
Yr2 F
C4
Yr3 F
C1
Yr3 F
C2
Yr3 F
C3
Yr3 F
C4
SA 1 lb N
SA 4 lb N
SA 7 lb N
SA 10 lb N
Nitrogen applied as 100% soluble urea
Perc
en
t o
f A
pp
lied
N L
each
ed
Trenholm et al. 2010
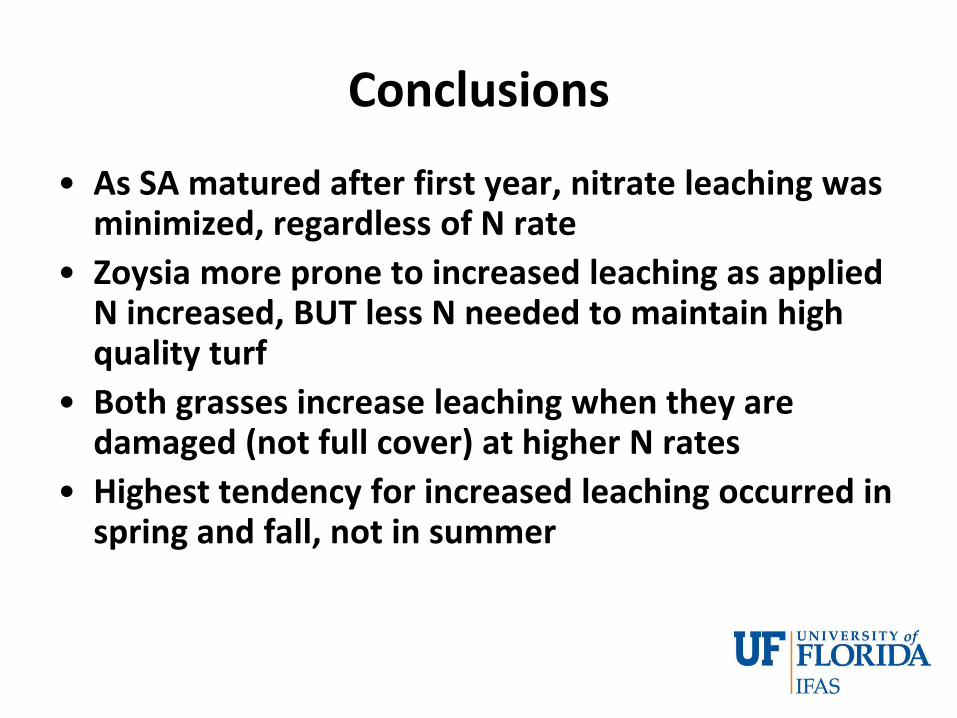
Conclusions
• As SA matured after first year, nitrate leaching was minimized, regardless of N rate
• Zoysia more prone to increased leaching as applied N increased, BUT less N needed to maintain high quality turf
• Both grasses increase leaching when they are damaged (not full cover) at higher N rates
• Highest tendency for increased leaching occurred in spring and fall, not in summer

Nitrate Leaching Due to Nitrogen Source
• 8 nitrogen sources applied @ 1 lb N 1,000 ft-2 4x yr
• Established Floratam and Empire
• 1 yr left on this study
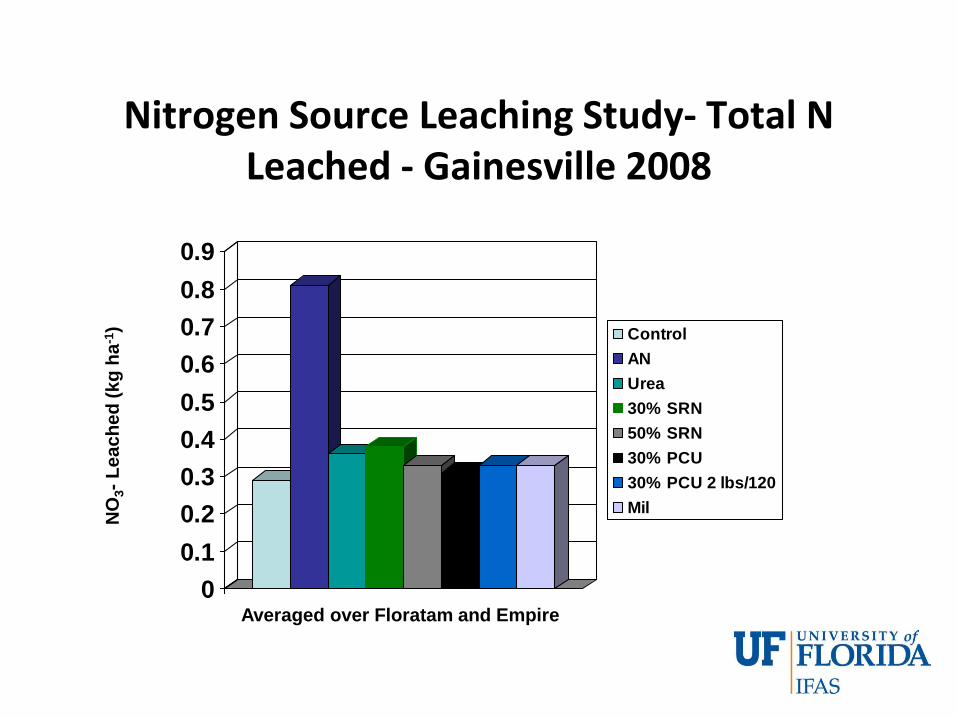
Nitrogen Source Leaching Study- Total N Leached - Gainesville 2008
0
0.1
0.2
0.3
0.4
0.5
0.6
0.7
0.8
0.9
Control
AN
Urea
30% SRN
50% SRN
30% PCU
30% PCU 2 lbs/120
Mil
NO
3-
Le
ac
he
d (
kg
ha
-1)
Averaged over Floratam and Empire

Nitrogen Source Leaching Study- Percent of Applied N Leached -Gainesville 2008
0
0.1
0.2
0.3
0.4
0.5
0.6
0.7
0.8
Control
AN
Urea
30% SRN
50% SRN
30% PCU
30% PCU 2 lbs/120
Mil
Perc
en
t o
f A
pp
lied
N L
each
ed
Averaged over Floratam and Empire

Conclusions
• From 2 yr of data, there are no differences between products (except AN) when nitrogen applied at the recommended UF-IFAS rates
• More important in nitrate leaching reduction is application (getting fertilizer to the grass, not on sidewalk), time of year, application rate, health of grass, etc.
Summary of Research and Extension Programs
• Research providing quantification of BMPs
• Extension program based on scientific data generated in multiple locations around the state
• Water quality and quantity programs are very important in Florida
• Industries have learned that their best interest is to support and adopt the BMPs

Questions


