35
1 TURKISH AIRLINES January 2016 1

1
TURKISH AIRLINES January 2016
1
2
21 25 29 32 38 43 49 54 58 62 7144
5259 66
7380
84 88 93109
142
6578
8898
111123
133141
151
170
213
2009 2010 2011 2012 2013 2014 2015 2016E 2017E 2018E 2023E
Domestic (*) International
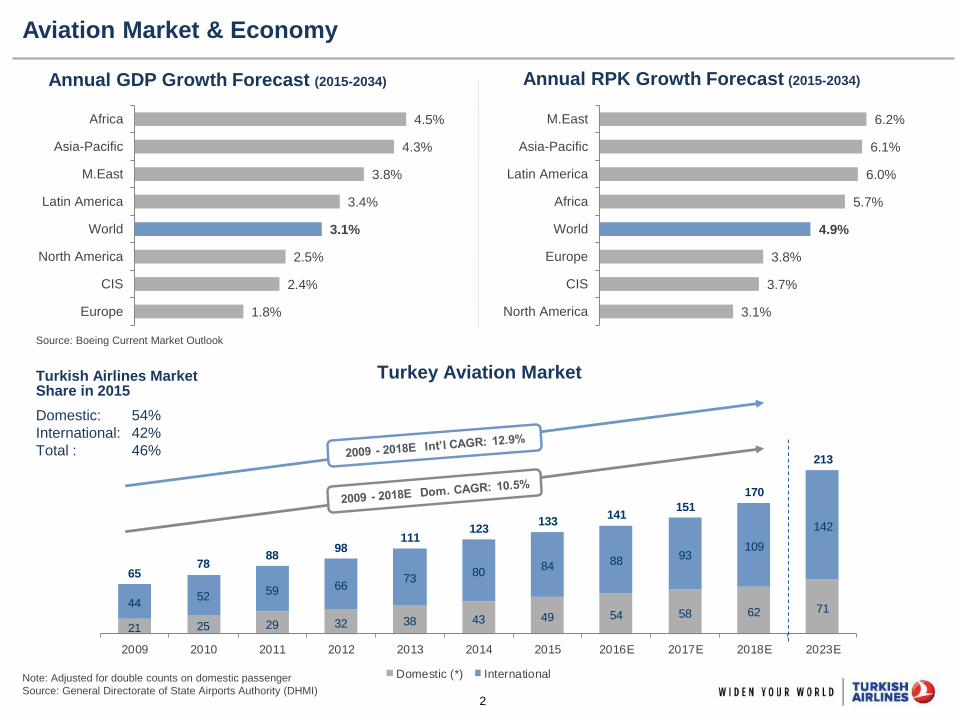
Source: Boeing Current Market Outlook
Aviation Market & Economy
Annual GDP Growth Forecast (2015-2034) Annual RPK Growth Forecast (2015-2034)
Turkey Aviation Market
Note: Adjusted for double counts on domestic passenger
Source: General Directorate of State Airports Authority (DHMI)
Turkish Airlines Market Share in 2015
Domestic: 54%
International: 42%
Total : 46%
1.8%
2.4%
2.5%
3.1%
3.4%
3.8%
4.3%
4.5%
Europe
CIS
North America
World
Latin America
M.East
Asia-Pacific
Africa
3.1%
3.7%
3.8%
4.9%
5.7%
6.0%
6.1%
6.2%
North America
CIS
Europe
World
Africa
Latin America
Asia-Pacific
M.East

3
0%
1%
2%
3%
4%
5%
6%
7%
8%
9%
American United Delta Emirates ChinaSouthern
Southwest Air China Lufthansa BritishAirways
Air France TurkishAirlines
ChinaEastern
Qantas CathayPacific
LATAM Ryanair Singapore
2002 2003 2004 2005 2006 2007 2008 2009 2010 2011 2012 2013 2014 2015F
24 24 26 30 37 42 46 57 65 78
94 114
135 156
0.6% 0.5% 0.5% 0.6% 0.7% 0.7% 0.8%
0.9% 1.0%
1.2% 1.3%
1.6% 1.8%
1.9%
2002 2003 2004 2005 2006 2007 2008 2009 2010 2011 2012 2013 2014 2015F
Capacity (bn ASK) Global Market Share
Global Market Share Trends
Notes: For US carriers regional flights are excluded. Wholly owned subsidiaries are included in the calculation. 2015 capacities
are obtained from OAG on 5 August 2015.
Source: 2002 ICAO, 2003-2014 IATA, 2015F OAG, company reports, sorted by 2015F ASK values.
Global Market Share Trends (in ASK)
Turkish Airlines Market Share Development
4.9% 4.4% 4.3% 3.9% 3.0% 2.8% 2.4% 2.1% 2.0% 1.9% 1.8% 1.8% 1.6% 1.9% 2.2% 1.7% 1.6%

4
Turkish Airlines Growth Story
1,000
2,000
3,000
4,000
5,000
6,000
7,000
8,000
9,000
10,000
11,000
12,000
100 110 120 130 140 150 160 170 180 190 200 210 220 230 240 250 260 270 280 290 300 310
Weekly
Flig
hts
Destinations
2006-103 2005-
83
2007-101
2008-127
2009-132
2010 -153
2013 - 214
2012–202
54.7 mn pax
14.1 mn
pax
16.9 mn pax
19.7 mn pax
22.6 mn pax
25.1 mn pax
29.1 mn pax
32.6 mn pax
2011–180
39 mn
pax
48.3 mn pax 2015 - 299
61.2 mn pax
2014-261
2016E - 339
72.4 mn pax

5
Destinations: 235* International, 49 Domestic Lines in 113 Countries
Germany 368 Spain 76 Hungary 28 Moldova 7 Egypt 42 Sudan 7 Saudi Arabia 97 Lebanon 21 China 34 Bangladesh 7
Frankfurt 52 Barcelona 28 Budapest 28 Chisinau 7 Cairo 21 Khartoum 7 Jeddah 28 Beirut 21 Beijing 7 Dhaka 7
Berlin 46 Madrid 21 Bulgaria 25 Poland 5 Alexandria 7 Uganda 7 Madinah 21 UAE 18 Guangzhou 7 Indonesia 7
Munich 46 Malaga 10 Sofia 14 Warsaw 5 Hurghada 7 Entebbe 7 Dammam 17 Dubai 14 Shanghai 7 Jakarta 7
Stuttgart 45 Bilbao 7 Varna 11 Belarus 4 Sharmel-Sheikh 7 Burkina Faso 6 Riyadh 14 Abu Dhabi 4 Taipei 7 Maldives 7
Düsseldorf 38 Valencia 7 Romania 25 Minsk 4 Algeria 35 Ougadougou 6 Yanbu 10 Jordan 17 Hong Kong 6 Male 7
Hamburg 35 Santiago de C. 3 Bucharest 21 Algiers 21 Mauritania 6 El Qassim 4 Amman 14 Japan 21 Malaysia 7
Cologne 28 Northern Cyprus 66 Constanta 4 Oran 7 Nouakchott 6 Taif 3 Akabe 3 Tokyo 14 Kuala Lumpur 7
Hanover 24 Lefkosa 66 Czech Rep. 21 Constantine 3 Senegal 6 Iran 67 Qatar 14 Osaka 7 Nepal 7
Nuremberg 21 Switzerland 63 Prague 21 Tlemcen 2 Dakar 6 Tehran 33 Doha 14 Kyrgyzstan 19 Kathmandu 7
Bremen 10 Zurich 28 Bosnia 18 Batna 2 Congo 5 Mashad 7 Yemen 14 Bishkek 15 Singapore 7
Friedrichshafen 7 Geneva 21 Sarajevo 18 South Africa 18 Kinshasa 5 Shiraz 7 Aden 7 Osh 4 Singapore 7
Leipzig 7 Basel 14 Finland 18 Cape Town 7 Gabon 5 Tabriz 7 Sanaa 7 Kazakhstan 15 Sri Lanka 7
Münster 5 Austria 54 Helsinki 18 Johannesburg 7 Libreville 5 Isfahan 5 Bahrain 10 Almaty 10 Colombo 7
Baden-Baden 4 Vienna 40 Norway 18 Durban 4 Niger 5 Kermanshah 4 Bahrain 10 Astana 5 Uzbekistan 7
Italy 157 Salzburg 10 Oslo 18 Nigeria 16 Niamey 5 Ahvaz 4 Oman 7 India 14 Tashkent 7
Milan 35 Graz 4 Albania 14 Lagos 7 Cote D'Ivore 4 Israel 56 Muscat 7 Mumbai 7 Vietnam 7
Rome 35 Ukraine 50 Tirana 14 Abuja 5 Abidjan 4 Tel Aviv 56 Syria - New Delhi 7 Ho Chi Minh 7
Venice 25 Kiev 16 Croatia 14 Kano 4 Chad 4 Iraq 51 Aleppo - Pakistan 14 Tajikistan 5
Bologna 17 Odessa 11 Zagreb 14 Cameroon 14 N'Djamena 4 Baghdad 14 Damascus - Karachi 7 Dushanbe 3
Naples 14 Simferepol 7 Ireland 14 Douala 7 Benin 4 Erbil 14 Islamabad 4 Khujand 2
Catania 9 Dnepropetrovsk 5 Dublin 14 Yaounde 7 Cotonou 4 Basra 10 Lahore 3 Philippines 3
Turin 7 Kherson 4 Kosovo 14 Kenya 14 Eritrea 3 Sulaymaniyah 8 Thailand 14 Manila 3
Genoa 5 Zaporijya 4 Pristina 14 Mombasa 7 Asmara 3 Najaf 5 Bangkok 14 Mongolia 3
Pisa 5 Lviv 3 Macedonia 14 Nairobi 7 Madagascar 3 Mosul 0 Turkmenistan 14 Ulaanbaatar 3
Bari 5 Donetsk 0 Skopje 14 Tanzania 14 Antananarivo 3 Kuwait 42 Ashgabad 14
France 94 Azerbaijan 45 Serbia 14 Dar Es Selaam 7 Mali 3 Kuwait 42 South Korea 11
Paris 42 Baku 35 Belgrade 14 Kilimenjaro 7 Bamako 3 Seoul 11
Lyon 14 Ganja 7 Portugal 18 Azerbaijan Tunisia 14 Mauritius 3 Afghanistan 10
Nice 14 Nakhichevan 3 Lisbon 14 Lankeran Tunis 14 Port Louis 3 Kabul 7
Marseille 10 Netherlands 45 Porto 4 Poland Djibouti 7 Mozambique 3 Mazar-ı Sharif 3
Toulouse 7 Amsterdam 38 Malta 13 Krakow Djibouti 7 Maputo 3
Bordeaux 7 Rotterdam 7 Malta 13 France Ethiopia 7
United Kingdom 92 Belgium 42 Montenegro 10 Nantes Addis Ababa 7 USA 68 Brazil 7
London 59 Brussels 42 Podgorica 10 Germany Ghana 7 New York 21 Sao Paulo 7
Manchester 21 Denmark 42 Slovenia 10 Kassel Accra 7 Boston 7
Birmingham 12 Copenhagen 28 Ljublijana 10 Ukraine Libya 7 Chicago 7
Russia 90 Aalborg 7 Scotland 9 Kharkiv Misurata 7 Houston 7
Moscow 42 Billund 7 Edinburg 9 Zaporizhia Benghazi - Los Angeles 7
Sochi 10 Georgia 38 Estonia 7 Spain Sebha - Miami 7
Kazan 7 Tbilisi 28 Tallinn 7 La Coruna Tripoli - Washington 7
St. Petersburg 7 Batumi 10 Latvia 7 Morocco 7 San Francisco 5
Ufa 6 Greece 35 Riga 7 Casablanca 7 Canada 9
Rostov 4 Athens 21 Lithuania 7 Rwanda 7 Toronto 6
Astrakhan 4 Thessaloniki 14 Vilnius 7 Kigali 7 Montreal 3
Ekaterinburg 4 Sweden 35 Luxemburg 7 Somalia 7 Argentina 7
Novosibirsk 3 Stockholm 21 Luxembourg 7 Mogadishu 7 Buenos Aires 7
Stravropol 3 Gothenburg 14
Baden-Baden
Porto
Khujand
Maputo
Juba
Tokat
Uşak
Graz
Bamako Ordu - Giresun
Durban
Miami
Venezuela
Colombia
Caracas
Mexico
Cuba
Havana
Mexico City
South Sudan
Conarky
Makhachkala
Russia
Atlanta
Luxor
Guinea Bogota
Future Routes
Vietnam
Hanoi
4 COUNTRIES, 12 CITIES
Angola
Future Routes
DOMESTIC
49 CITIES
LuandaFuture Routes
Egypt
Aswan
USA
Future Routes
Future Routes
Saudi Arabia
Abha
AMERICAS
FAR EAST
42 COUNTRIES, 107 CITIES 31 COUNTRIES, 48 CITIES 13 COUNTRIES, 34 CITIES 22 COUNTRIES, 34 CITIES
EUROPE AFRICA MIDDLE EAST
Ahvaz Manila
San Francisco Bari
Routes Opened in 2015
Abuja Taipei
Zaporijya Siirt
Kocaeli
Port Louis Antananarivo
Bursa Hakkari
Turkish Airlines reaches 76% of all destinations at least daily
* As of 31.12.2015

6
Outside Top
50 Hubs
Among Top
50 Hubs
# of Total
Int’l
Airports
Int’l Pax
Coverage
(%)
THY 193 42 235 76.9%
British
Airways 116 43 159 77.6%
Lufhansa 97 44 141 78.1%
Emirates 91 41 132 74.0%
Air France 84 39 123 67.1%
Istanbul’s Geographical Advantage - A Natural Hub
Narrow Body Range Capability
to and from Istanbul (with full passenger payload)
196 out of 235 international destinations
More than 40% of world-wide international traffic
Over 60 national capitals
All of Europe, Middle East, Central Asia and
North and East Africa
Current Wide Body destinations
Future Wide Body destinations
* Atlanta route to open in May 2016.
Source: Passenger data from IATA, route data from OAG. Retrieved on 2 November 2015.
Highest Coverage of Non-Hub Cities We fly to 42 of the Global Top 50 Hub Airports…
Wide Body
Range
ISTANBUL
BOS
HKG
NRT
PEK
BKK
JNB
LAX
GRU
EZE
SGN
CPT
CAN
IAD
IAH
JFK
ICN
KIX
KUL
SIN
ORD
CGK
YYZ
YUL
PVG
Narrow Body
Range
SFO
MEX
BOGCCS
MIA
MNLTPE
MPM
DUR
YVR
DPS
ATL
MRU
HKT
TNR
HAV

7 Strictly Private & Confidential
Highest Connectivity for Europe, Africa and Middle East
Europe to the World
Turkish Airlines 19,250
Lufthansa 8,550
British Airways 8,544
Middle East to the World
Turkish Airlines 8,330
Qatar Airways 2,912
Lufthansa 2,124
Africa to the World
Turkish Airlines 10,530
Air France 4,386
British Airways 3,006
Far East to the World
United Airlines 9,030
Turkish Airlines 8,330
Delta 5,100
17%
6%
10%
Detour* Advantage
Via
Istanbul
Airlines Connectivity
by Number of O&D Pairs
(Top Three)
From
Europe To
Far East
To
Middle East
To
Africa
* Detour: Increase in the flight distance compared to a non-stop flight. Forecasted by using 6,000 arrival-departure cities
Source: Retrieved from OAG on 2 November 2015.

8
73.7 72.6
77.7
79.0 79.3
77.9 76.7 76.9
79.2 79.7
81.9
83.5
73.1 71.9
77.4
78.9 78.9
77.1
2010 2011 2012 2013 2014 2015
Total L/F Domestic L/F International L/F
2014 vs 2015
Landing up by 9.6%
ASK up by 13.6%
RPK up by 11.7%
Passenger # up by 11.8%
L/F down by -1.4 pt 13.6 14.5 15.9 20.1 22.7 26.3
15.5 18.2 23.1
28.2 32.1
34.9
29.1 32.6
39.0
48.3
54.8
61.2
2010 2011 2012 2013 2014 2015
Domestic International
Passenger Traffic (2015)
Total Passengers (mn) THY Passenger Traffic
Load Factor (L/F %) Annual Changes (%)
2011 2012 2013 2014 2015
ASK 25% 18% 21% 16% 14%
RPK 23% 27% 23% 16% 12%
PAX 12% 20% 24% 14% 12%
L/F (Pt) -1.1 5.1 1.4 0.3 -1.4

9
5,705 6,876
9,937
12,882
15,564
18,385
2010 2011 2012 2013 2014 2015
Passenger Breakdown (2015)
Int’l Passenger Breakdown by Geography Int’l to Int’l Transfer Passengers (’000)
Passenger Breakdown by Cabin Class Passenger Breakdown by Transfer Type
Note: Includes only scheduled passengers.
Note: Includes only scheduled passengers. Business class passengers include
comfort class passengers. (0.4 %)
Note: Int‟l to int‟l transfer passengers‟ share in total international passengers is 53%.
Europe 58%
Middle East 15%
Far East 13%
Africa 8%
Americas 6%
Economy 96%
Business 4%
Int'l-Int'l Transfer
30%
Int'l-Dom Transfer
7% Int'l Direct 20%
Domestic 43%
10
Europe 31%
Far East 22%
Domestic 14%
Middle East 13%
America 12%
Africa 8%
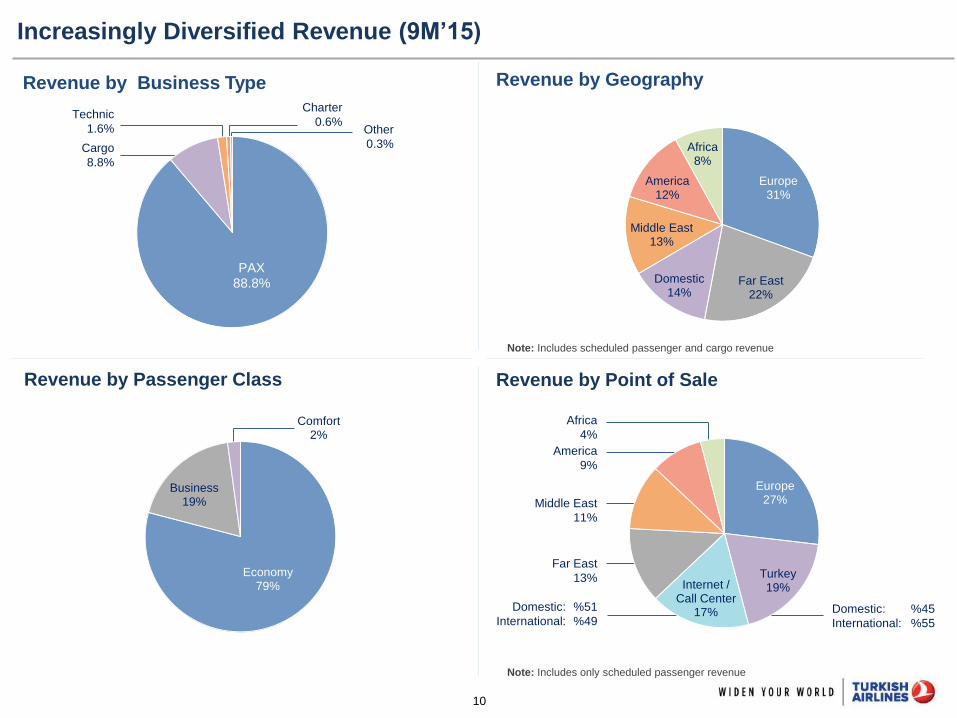
Charter
0.6%
Revenue by Geography
Increasingly Diversified Revenue (9M’15)
Revenue by Business Type
Revenue by Passenger Class Revenue by Point of Sale
America
9%
Middle East
11%
Domestic:
International:
%51
%49 Domestic:
International:
%45
%55
Africa
4%
Other
0.3%
Technic
1.6%
Cargo
8.8%
Note: Includes scheduled passenger and cargo revenue
Note: Includes only scheduled passenger revenue
Far East
13%
Europe 27%
Turkey 19% Internet /
Call Center 17%
PAX 88.8%
Economy 79%
Business 19%
Comfort 2%

11
Unit Revenue Upside Potential
THY future potential
EU Average
LCC Average
ME Average
US Average Asia Average
THY
4
5
6
7
8
9
10
11
12
13
0 1,000 2,000 3,000 4,000 5,000 6,000
RASK, Usc
Stage length, km
Notes: European carriers include Lufthansa, IAG, AF-KLM, SAS, Aeroflot, Alitalia. Middle Eastern carriers include Emirates and Qatar. Asian carriers include Singapore, Cathay, Japan, Air
China, Thai, Qantas. US carriers include Delta, United, American, Air Canada. LCC carriers include Ryanair, easyJet, SunExpress, Pegasus, Norwegian, Southwest, Air Asia, Jet Blue.
Source: Airline Annual Reports
With new wide-body aircraft deliveries, business class and cargo revenue share will increase.

12
7.91
8.46 7.92 7.95
7.73 7.87
6.48
1.75 1.65 1.43 1.36 1.25 1.26 1.08
2.16 2.95 3.00 2.96 2.84
2.93
2.03
4.00 3.85 3.49 3.63 3.64 3.68
3.37
0.0
2.0
4.0
6.0
8.0
10.0
2010 2011 2012 2013 2014 9M'14 9M'15
CASK Personnel/ASK Fuel/ASK Others/ASK
Cost Per ASK (Usc)
Steady Unit Cost Structure

13
2
4
6
8
10
12
14
16
- 2,000 4,000 6,000 8,000 10,000
NB Trend
WB Trend
Cost Efficiency and Direct Traffic Advantage
75% of all Turkish Airlines production takes place in an optimum stage
length
57% 54% 55%
32%
59% 49%
Long Haul Short Haul Total
Break-Even LF Direct Passenger Ratio(%)
Note: Break-even LF is calculated as the load factor enough to cover all direct operational expenses.
Dir
ect O
pe
ratio
na
l Costs
/ A
SK
(U
sc)
Stage Lenght (km)
WB
NB

14
13:20 13:18
14:20
15:04 14:59 15:04
11:55
11:20 11:47
12:18 12:12 12:05
12:02 11:40
12:11 12:39 12:41 12:43
2010 2011 2012 2013 2014 2015
WB Long-Haul NB Medium-Haul Total
Favorable Flight Utilization Levels (hrs)
10% increase in Utilization should decrease total CASK by 3%
Fixed Cost Ratio (%)
2009 - 2014 Utilization Increase : %9
%36 %32 %28 %27 %27 %29
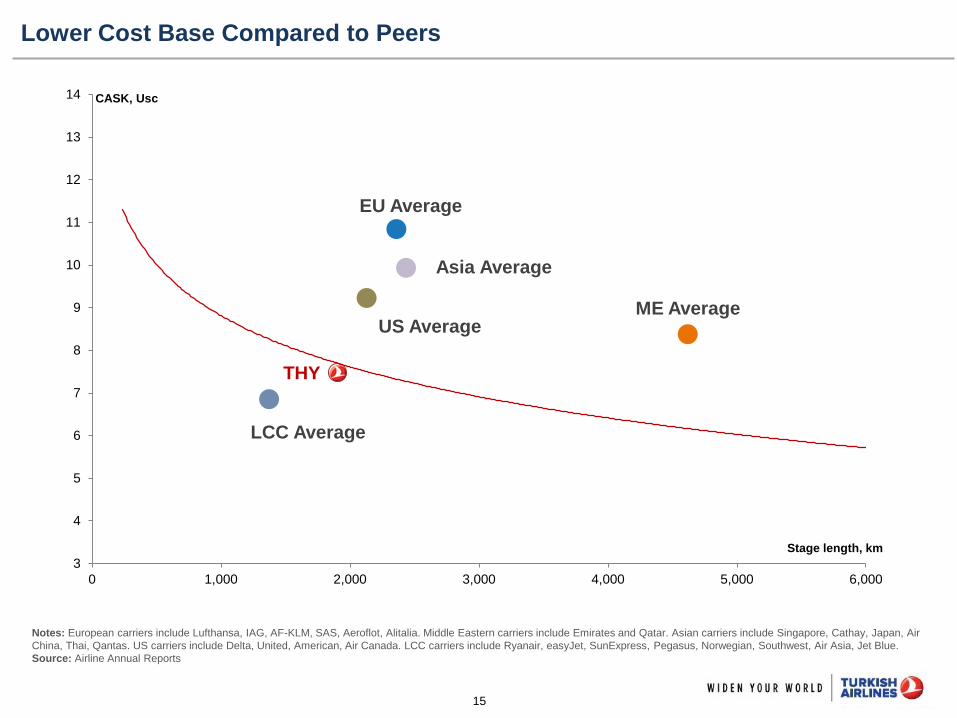
15
Lower Cost Base Compared to Peers
Notes: European carriers include Lufthansa, IAG, AF-KLM, SAS, Aeroflot, Alitalia. Middle Eastern carriers include Emirates and Qatar. Asian carriers include Singapore, Cathay, Japan, Air
China, Thai, Qantas. US carriers include Delta, United, American, Air Canada. LCC carriers include Ryanair, easyJet, SunExpress, Pegasus, Norwegian, Southwest, Air Asia, Jet Blue.
Source: Airline Annual Reports
LCC Average
ME Average
EU Average
US Average
Asia Average
THY
3
4
5
6
7
8
9
10
11
12
13
14
0 1,000 2,000 3,000 4,000 5,000 6,000
CASK, Usc
Stage length, km

16
18.8%
16.0%
19.5% 18.8% 18.5%
20.7%
26.2%
0%
5%
10%
15%
20%
25%
30%
2010 2011 2012 2013 2014 9M'14 9M'15
AVG (2010-2014): 18.3%
(mn USD) 2010 2011 2012 2013 2014 9M'14 9M'15 YoY
Change
Revenue 5,448 7,070 8,234 9,826 11,070 8,540 8,054 -5.7%
Net Income 185 11 657 357 845 723 877 21.3%
Net Income Margin 3.4% 0.2% 8.0% 3.6% 7.6% 8.5% 10.9% 2.4 pt
EBIT 262 277 691 755 770 803 1,019 26.9%
EBIT Margin 4.8% 3.9% 8.4% 7.7% 7.0% 9.4% 12.7% 3.2 pt
EBITDAR 1,024 1,130 1,603 1,843 2,044 1,766 2,108 19.4%
EBITDAR Margin 18.8% 16.0% 19.5% 18.8% 18.5% 20.7% 26.2% 5.5 pt
Management Benchmark : EBITDAR Growth

17
26.2
%
24.5
%
22.6
%
20
.1%
18.8
%
13.5
%
11.2
%
TK DL AA UA IAG AF-KL LH*
EBITDAR Margin % Comparison
2014 Annual
Peer Group vs Turkish Airlines Profitability
* Lufthansa Passenger Airlines
Source: Calculated based on public company reports.
9M’15
22.8
%
18.5
%
18.1
%
15.9
%
13.4
%
12.7
%
10.4
%
9.9
%
6.1
%
EK TK SQ AA IAG UA DL AF-KL LH*

18
Current Fleet and Growth Projections
31.12.2015 Type Total Owned Financial
Lease
Opr./Wet
Lease
Seat
Capacity
Average
Fleet
Age
Year End Fleet*
2016 2017 2018 2019 2020 2021 2022
Wide
Body
A330-200 20 5 15 4,702 8.3 20 18 18 16 13 13 8
A330-300 26 25 1 7,516 2.5 31 31 31 31 31 31 31
A340-300 4 4 1,080 17.6 4 4 4 4 4 4 4
B777-3ER 23 23 7,883 3.0 32 35 35 34 32 32 32
Total 73 4 53 16 21,181 5.1 87 88 88 85 80 80 75
Narrow
Body
B737-900ER 15 15 2,355 2.5 15 15 15 15 15 15 15
B737-9 MAX 5 10 10 10
B737-800 68 25 33 10 10,940 9.7 76 70 53 53 53 53 53
B737-700 3 3 372 9.9 1 1 1 1
B737-8 MAX 20 30 55 65 65
A321 NEO 14 39 61 86 92
A319-100 14 6 8 1,848 7.7 14 11 9 8 6 6 6
A320-200 29 12 17 4,572 8.6 29 22 19 12 12 12 12
A321-200 56 52 4 10,170 4.3 66 68 68 68 66 64 64
B737-800 WL 24 24 4,536 9.3 36 40 46 43 35 33 29
B737-700 WL 1 1 149 8.8
E190 WL/E195 WL 6 6 684 6.9 3
Total 216 25 118 73 35,626 7.4 240 227 245 274 313 344 346
Cargo
A330-200F 6 6 3.2 8 9 9 9 9 9 9
Wet Lease 4 4 19.0 4
Total 10 6 4 9.5 12 9 9 9 9 9 9
GRAND TOTAL 299 29 177 93 56,807 6.9 339 324 342 368 402 433 430
*After exit-entry Seat Capacity
Change : 16% -2% 5% 6% 7% 7% -1%

19
Aircraft Orderbook
2011-2022 Aircraft Purchases
Delivered To Be Delivered
31.12.2015 Type 2011 2012 2013 2014 2015 TOTAL 2016 2017 2018 2019 2020 2021 2022 TOTAL
Wide
Body
A330-300 3 3 2 6 7 21 5 5
B777-3ER 7 4 7 18 6 3 9
Total 10 3 2 10 14 39 11 3 14
Narrow
Body
B737-900ER 2 7 1 5 15
B737-9 MAX 5 5 10
B737-800 2 2 6 10 20 20 20
B737-8 MAX 20 10 25 10 65
A321 8 7 9 13 37 10 2 12
A321 NEO 14 25 22 25 6 92
A319 6 6
Total 18 16 16 10 18 78 30 2 34 40 52 35 6 199
Cargo A330-200F 1 1 2 1 5 2 1 3
Total 1 1 2 1 5 2 1 3
GRAND TOTAL 29 20 20 20 33 122 43 6 34 40 52 35 6 216

20
Capacity Management: Ataturk Airport Expansion and Third Airport in Istanbul
Collaborative Decision Making Project of THY-DHMI-TAV:
• New International Terminal construction to end Q1‟16
• 27.000 sqm wide with 8 additional pax bridges and 32
additional check-in islands
• 17.000 sqm of additional car park space
Addition of the Military Area:
• 26 new park positions and new taxi ways have been added
• 17 more park positions increased the total capacity to 145 by
2015YE
Air Traffic Movements: With certain tower management
measures 80 ATMs is achievable. (+20%)
Phase 1a&b Final
Estimated Total Cost € 6.0 bn €10.2 bn
Total Site Area - 76.5 mn m2
Terminal Floor Area 1.3 mn m2 1.3 mn m2
Number of Runways 2 + 1 6
Total Aircraft Capacity 184 396
Number of Pax Bridges 114 143
Aircraft Park ing Capacity 70 253
Maximum ATM 96/144 224
Maximum PAX Capacity 90 mn ppa 150 mn ppa (up to 200 mn)
Baggage Handling System capacity will be decided 50k baggage/hour
Stats for theThird Airport

21
Debt Management and Aircraft Financing
As of 30.09.2015
Total Debt : 8.4 bn USD
Weighted Average Interest Rate: 3.0%
Lease Type
Interest Rate Type
5 Year Maturity Profile (USD mn)
Currency Type
933 1027 829 771 749
2016 2017 2018 2019 2020
Operational
Lease
10%
Financial Lease 90%
Floating 19%
Fixed 81%
USD 36%
EUR 30%
JPY 31%
CHF 3%

22
FY16 Hedging Levels* Average Price
EUR/USD 20% 1.20
EUR/TRY 23% 3.30
USD 34.8%
USD Corr. 17.1%
EUR 28.2%
EUR Corr. 3.0%
TRY 14.8%
JPY 1.7%
Other 0.5%
Monthly gradually decreasing layered hedging strategy
Sell EUR, Buy USD - TRY via forward contracts for 24 months
Target hedge levels: 30% for TRY, 25-35% for USD
Risk Management (2016)
USD
USD
Around 23 mn barrels of hedged position on ICE BRENT as
of December 31, 2015.
Current fuel hedging levels: FY16: 40%; FY17: 14%
Decreasing layered hedging strategy (24 months)
Crude oil based swaps and options
Aim to reach 50% of budgeted consumption of the following
month
Currency Hedging
Revenue (1) Expenses
Fuel Hedging
Initiatives for natural hedge:
- Sales originating from Turkey have been converted
from EUR to USD
- Surcharges have been converted from EUR to USD
(1) Currencies that have 85% correlation with USD and EUR considered as USD and EUR
correlated respectively. For 3Q‟15.
USD 43.9%
TRY 36.8%
EUR 13.1%
JPY 0.3%
Other 6.2%
* Percentage of respective short positions.
Current currency hedging matrix:
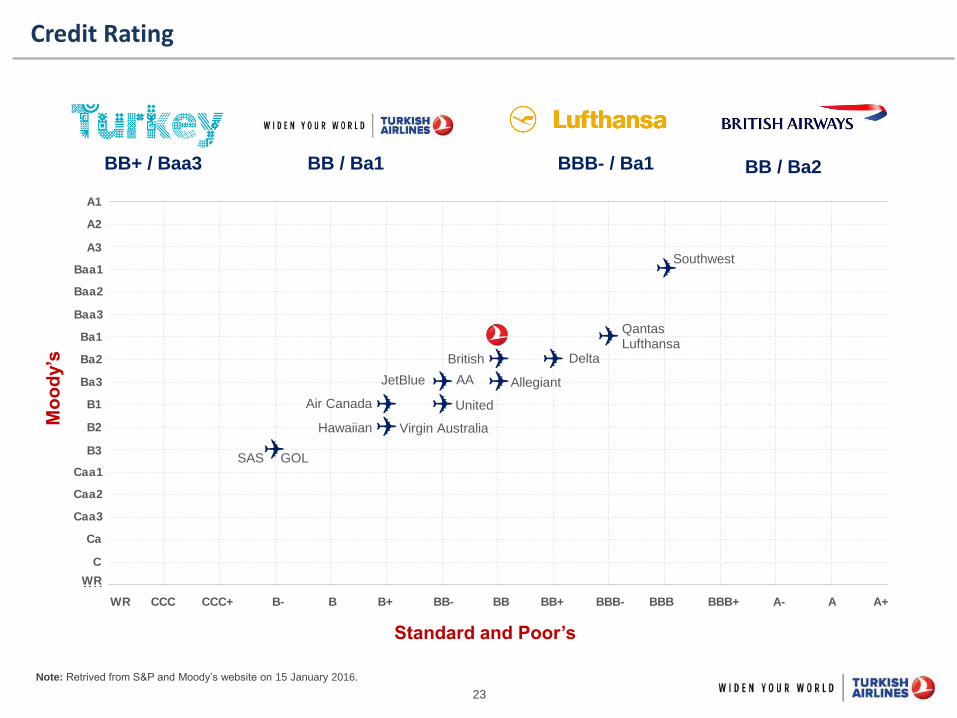
23
Credit Rating M
oo
dy’s
Standard and Poor’s
BBB- / Ba1 BB / Ba2 BB / Ba1 BB+ / Baa3
Note: Retrived from S&P and Moody‟s website on 15 January 2016.
A1
A2
A3
Baa1
Baa2
Baa3
Ba1
Ba2
Ba3
B1
B2
B3
Caa1
Caa2
Caa3
Ca
C
WR
CCC CCC+ B- B B+ BB- BB BB+ BBB- BBB BBB+ A- A A+WR
British Lufthansa
Southwest
Delta
Allegiant AA
Virgin Australia
Air Canada United
GOL
JetBlue
Hawaiian
SAS
A1
A2
A3
Baa1
Baa2
Baa3
Ba1
Ba2
Ba3
B1
B2
B3
Caa1
Caa2
Caa3
Ca
C
WR
CCC CCC+ B- B B+ BB- BB BB+ BBB- BBB BBB+ A- A A+WR
Qantas
✈ ✈ ✈ ✈
✈ ✈ ✈ ✈
✈
✈

24
Guidance for 2016
Capacity
40 net fleet additions (14 WB, 24 NB aircraft)
21% overall capacity growth will be driven mostly by
America (31%), Africa (27%) and Far East (23%) with
eager growth in Europe (17%), Middle East (17%) and
Domestic (11%)
Traffic Overall Load Factor to be 78%
Passengers carried is targeted to reach 72.4 million of
which 30.6 mn domestic and 40.8 mn int‟l scheduled
pax
Cargo to increase 13% to 815 thousand tonnes
Cost Drivers
18% increase in fuel consumption
19% increase in average number of personnel
Average USD/TRY 3,14
Average EUR/USD 1,10
Fuel Cost (USD/Ton) 647
FY16 Assumptions
Financial Expectations
Unit revenue (in USD) to decrease by 3%
Ex-fuel unit costs (in USD) to decrease by 1.5%
3 billion USD Aircraft Capex
Total Revenue to reach 12.2 billion USD
EBITDAR margin target 20-22%
1Q'16 2Q'16 3Q'16 4Q'16
Net Fleet Additions 10 20 9 1
Capacity Change 26% 20% 19% 21%

25
Thank You…
Tel: +90 (212) 463-6363 x-13630 e-mail: [email protected]
Coşkun KILIÇ, CFO
Duygu INCEÖZ, IR Manager

26
Assets (mn USD) 2010 2011 2012 2013 2014 9M'15
Cash and Equivalents 581 934 1,028 647 722 1,156
Trade Receivables 374 405 434 538 456 485
Pre-delivery Payment (PDP) Receivables 1,042 376 267 521 990 1,058
Other Current Assets 263 426 437 419 663 728
Total Current Assets 2,259 2,140 2,166 2,125 2,831 3,427
Net Fixed Assets 4,168 5,873 7,121 8,043 9,201 11,252
of which Aircraft and Engines 3,822 5,319 6,392 7,030 8,167 9,566
Pre-delivery Payment (PDP) Receivables 108 217 655 993 650 406
Other Non-Current Assets 354 455 581 741 1,064 1,314
Total Non-Current Assets 4,629 6,545 8,357 9,777 10,915 12,972
Total Assets 6,888 8,685 10,523 11,902 13,746 16,399
Liabilities (mn USD) 2010 2011 2012 2013 2014 9M'15
Lease Obligations 2,703 4,189 4,862 5,413 5,931 7,508
Passenger Flight Liabilities 436 677 936 1,201 1,398 1,325
Accounts Payable 476 461 510 680 662 713
Other Liabilities 850 976 1,183 1,346 1,805 2,042
Total Liabilities 4,464 6,303 7,491 8,640 9,796 11,588
Total Shareholders Equity 2,424 2,382 3,032 3,262 3,950 4,811
of which Issued Capital 1,374 1,498 1,498 1,597 1,597 1,597
of which Retained Earnings 827 889 903 1,350 1,714 2,559
of which Differences from Currency Translation 2 -18 -10 -26 -47 -84
of which Net Profit for the Period 185 11 657 357 845 877
Total Liabilities & Shareholders Equity 6,888 8,685 10,523 11,902 13,746 16,399
Balance Sheet

27
(mn USD) 2010 2011 2012 2013 2014 9M'14 9M'15 YoY
Change
Operating Revenue 5,448 7,070 8,234 9,826 11,070 8,540 8,054 -6%
Operating Expenses (-) 5,149 6,855 7,616 9,249 10,467 7,895 7,322 -7%
of which Fuel 1,406 2,394 2,887 3,442 3,845 2,941 2,290 -22%
of which Personnel 1,141 1,339 1,376 1,581 1,694 1,262 1,225 -3%
of which Depreciation 297 486 574 650 744 549 658 20%
of which Rent 305 252 243 448 543 431 375 -13%
Net Operating Profit / Loss 299 215 618 577 603 645 732 13%
Income From Other Operations 92 96 95 115 81 71 191 169%
Expense From Other Operations (-) 79 237 61 41 46 22 29 32%
Profit / (Loss) From Main Operations 312 73 652 651 638 694 894 29%
Income From Investment Activities (Net) - - 271 76 72 38 54 42%
Share of Investments' Profit / Loss 24 6 4 55 75 67 79 18%
Financial Income 47 158 49 27 443 233 427 83%
Financial Expense (-) 99 150 191 307 182 140 265 89%
Profit Before Tax 237 87 785 502 1,046 892 1,189 33%
Tax (-) 51 76 128 145 201 169 312 85%
Net Profit 185 11 657 357 845 723 877 21%
Income Statement

28
3Q'14 3Q'15 YoY Change EBITDAR (mn USD) 9M'14 9M'15 YoY Change
3,318 3,265 -2% Sales Revenue 8,540 8,054 -6%
2,448 2,241 -8% Cost of Sales (-) 6,856 6,276 -8%
870 1,024 18% GROSS PROFIT / (LOSS) 1,684 1,778 6%
66 64 -3% General Administrative Expenses (-) 201 199 -1%
267 278 4% Marketing and Sales Expenses (-) 838 847 1%
537 682 27% NET OPERATING PROFIT / (LOSS) 645 732 13%
18 33 83% Other Operating Income 71 191 169%
17 13 -24% Other Operating Expense (-) 22 29 32%
538 702 30% Profit / (Loss) from Main Operations 694 894 29%
62 83 34% Adjustments 109 125 15%
47 67 43% Share of Investments' Profit / Loss Accounted by Using
The Equity Method 67 79 18%
15 16 7% Income From Government Incentives 42 46 10%
600 785 31% EBIT 803 1,019 27%
176 215 22% Cost of Sales_Depreciation 513 610 19%
13 16 23% General Administrative Expenses_Depreciation 31 43 39%
2 2 0% Marketing and Sales Expenses_Depreciation 5 5 0%
791 1,018 29% EBITDA 1,352 1,677 24%
93 118 27% Adjusted Operating Lease Expenses1 244 308 26%
64 48 -26% Adjusted Short term Lease Expenses (Wet-lease)2 170 123 -28%
948 1,184 25% EBITDAR 1,766 2,108 19%
28.6% 36.3% 7.7 pt EBITDAR MARGIN 20.7% 26.2% 5.5 pt
EBITDAR Calculation
(*): Adjusted for A/C heavy maintenance
(**): Adjusted for A/C rent portion (Aprox. 55%)

29
Operational Expense Breakdown
(mn USD) 9M'14 % in Total 9M'15 % in Total YoY Change
Fuel 2,941 37.3% 2,290 31.3% -22.1%
Personnel 1,262 16.0% 1,225 16.7% -2.9%
Landing, Navigation & Air Traffic 716 9.1% 687 9.4% -4.1%
Sales & Marketing 623 7.9% 648 8.9% 4.0%
Depreciation 549 7.0% 658 9.0% 19.9%
Ground Handling 468 5.9% 465 6.4% -0.6%
Aircraft Rent 431 5.5% 375 5.1% -13.0%
Passenger Services & Catering 419 5.3% 441 6.0% 5.3%
Maintenance 305 3.9% 339 4.6% 11.1%
General Administration 64 0.8% 63 0.9% -1.6%
Other 117 1.5% 131 1.8% 12.0%
TOTAL 7,895 100% 7,322 100% -7.3%
Operating Cost per ASK (USc) 7.87 - 6.48 - -17.6%
Ex-fuel Operating Cost per ASK (Usc) 4.94 - 4.45 - -9.8%
Fixed Costs 2,092 26.5% 2,094 28.6% 0.1%

30
8.63 8.12 7.98
7.55
3Q'14 3Q'15 9M'14 9M'15
8.63
7.28
7.98
6.70
3Q'14 3Q'15 9M'14 9M'15
10.46
8.76
9.70
8.14
3Q'14 3Q'15 9M'14 9M'15
10.46 9.75 9.70
9.18
3Q'14 3Q'15 9M'14 9M'15
Unit Revenue Development
RASK ex-currency (USc)
Yield (R/Y) : Passenger Revenue / RPK (Scheduled)
RASK : Passenger and Cargo Revenue / ASK* (Scheduled)
* ASK value is adjusted for cargo operations.
Yield (USc) Yield ex-currency (USc)
RASK (USc)

31
Regional Yield Development in USD (9M’14 vs 9M’15)
Domestic
America
Middle East Africa
• Substantial capacity increase
• Weaker beyond traffic to/from ME
• Increased market capacity
Europe & CIS Asia / Far East
• 10 new routes inc. SAW
• Local currency depreciations (Russia,
Ukraine, Belarus, Azerbaijan and
weaker Eur)
• Weaker direct traffic due to currency
depreciations and security concerns
• Donetsk, Simpferopol suspended
• 3 New Routes (Taipei, Manila, Hucend)
• Depreciation of local currencies
• Weaker demand from Japan, Korea,
Nepal, weaker premium and corporate
demand from China
• Increased market capacity
• 2 New Routes (Abuja, Mali)
• Depreciation of local currencies
• Security issues and political unrest in
Nigeria, Camerun, Chad, Kenya,
Tunisia, Burkina Faso
• Increased market capacity from Gulf
• Tripoli, Misrata, Benghazi suspended
• Substantial capacity increase at SAW
• 6 new routes (Bursa,Kocaeli, Tokat,
Ordu-Giresun, Uşak, Hakkari)
• Weaker transfer traffic from international
lines, more local traffic (higher yield)
• Increased market capacity
• Substantial capacity increase in 3Q
• Capacity increases at SAW
• Significant pick-up of Tel Aviv, Egypt,
Iraq traffic in 3Q
• Increased market capacity
• Musul, Sana‟a, Aden suspended
R/Y : Passenger Revenue / RPK (Scheduled)
RASK : Passenger and Cargo Revenue / ASK* (Scheduled)
* ASK value is adjusted for cargo operations.
21.2%
-11.9% -10.7%
-5.7%
ASK RASK R/YR/Y ex-currency
10.4%
-20.7% -19.4%
-7.2%
ASK RASK R/YR/Y ex-currency
12.4%
-13.4% -15.8%
-6.7%
ASK RASK R/YR/Y ex-currency
10.3%
-18.7% -14.6%
-4.0%
ASK RASK R/YR/Y ex-currency
13.3%
-15.3% -17.4%
-0.6%
ASK RASK R/YR/Y ex-currency
12.1%
-9.6% -10.1% -2.4%
ASK RASK R/YR/Y ex-currency

32
Net Operating Profit Bridge (9M’14 vs 9M’15)
645
1,080
-280
-166 -55
-506
732 Net Operating Profit (%13)
(mn USD)
9M‟14 9M‟15
+14
L/F Utilization Fuel Currency
Ex-fuel Unit Cost (ex-currency
ex-utilization
ex-L/F)
RASK (ex-currency)
Revenue Impact: -997 mn USD
Cost Impact: +831mn USD

33
4.5x 4.7x
7.4x 8.3x 7.8x 8.4x
2010 2011 2012 2013 2014 LTM 9M'15
EBITDAR / Adj. Net Interest Cost
4.3x 4.8x 3.6x 3.9x 3.9x 3.8x
2010 2011 2012 2013 2014 LTM 9M'15
7.2x 6.2x
10.8x 10.7x 9.7x 11.9x
2010 2011 2012 2013 2014 LTM 9M'15
2.0x 3.8x
2.7x 3.0x 2.8x 2.8x
2010 2011 2012 2013 2014 LTM 9M'15
Financial Ratios (LTM 9M’15)
Net Debt / EBITDA
Adjusted Net Debt(1) / EBITDAR
EBITDA / Net Interest Cost
EBITDAR / Adjusted Net Interest Cost(2)
(1) Adjusted for the capitalization of operating leases including 55% of wet lease (7x) (2) Adjusted by the portion of financial costs within operating leases (33%)

34
Subsidiaries, Joint Ventures and Affiliates1
(1) Material entities with more than $10 mn revenues in 9M‟15
(2) Full company revenues, not just the portion attributable to THY
Total Net Profit Contribution 9M’15: USD 79 mn
THY50%
Opet50%
THY50%
LH50%
THY100%
THY50%
Do & Co
50%
THY50%
Havas50%
THY49%
Pratt & Whtiney
51%
Date of Creation 2009 1989 2006 2007 2008 2008
Ownership
(as of 1H‟15)
Business
Description Aviation Fuel Passenger Airline Maintenance Services Airline Catering Ground Services Maintenance Services
Number of
Personnel 426 3,420 5,383 5,539 9,953 269
Revenues2 (9M’15) USD 1,394 mn USD 954 mn USD 668 mn USD 287 mn USD 192 mn USD 163 mn
Net Profit (9M’15) USD 20 mn USD 90 mn USD 27 mn USD 27 mn USD 20 mn USD 8 mn
Paid in Capital USD 19 mn USD 39 mn USD 358 mn USD 11 mn USD 4 mn USD 29 mn

35
Türk Hava Yolları A.O. (the “Incorporation” or „‟Turkish Airlines‟‟) has prepared this presentation for the sole purpose of providing information about its
business, operations, operational and financial results. The information in this presentation is subject to updating, revision and amendment. This
presentation is not, and does not support to be comprehensive and to contain all information related to Turkish Airlines.
This presentation does not constitute or form part of any offer or invitation to sell or issue, or any solicitation of any offer to purchase or subscribe for, any
securities of Turkish Airlines nor any of its subsidiaries or their respective affiliates nor should it or any part of it or the fact of its distribution form the
basis of, or be relied on in connection with, any contract or investment decision in relation thereto. This presentation is not intended for distribution to, or
use by, any person or entity in any jurisdiction or country where such distribution would be contrary to law or regulation. The information contained in this
presentation has not been subject to any independent audit or review and may contain forward-looking statements, estimates and projections.
Statements herein, other than statements of historical fact, regarding future events or prospects, are forward-looking statements. Although Turkish
Airlines believes that the estimates and projections reflected in the forward-looking statements are reasonable, they may prove materially incorrect, and
actual results may materially differ. As a result, you should not rely on these forward-looking statements. Turkish Airlines undertakes no obligation to
update or revise any forward-looking statements, whether as a result of new information, future events or otherwise, except to the extent required by law.
Any forward-looking statement in this presentation speaks only as of the date on which it is made, and Turkish Airlines undertakes no obligation to
update any forward-looking statement to reflect events or circumstances after the date on which the statement is made or to reflect the occurrence of
unanticipated events, except to the extent required by law.
Industry, market and competitive data and certain industry forecasts used in this presentation were obtained from internal research, market research,
publicly available information and industry publications and other market commentaries. Industry publications generally state that the information
contained therein has been obtained from sources believed to be reliable at the relevant time, but that the accuracy and completeness of such
information is not guaranteed. Similarly, internal research, market research, industry publications and other publicly available information, while believed
to be reliable, have not been independently verified, and Turkish Airlines does not make any representation as to the completeness or accuracy of such
information.
No representation, warranty or undertaking, expressed or implied, is or will be made by Turkish Airlines or its shareholders, affiliates, advisors or
representatives or any other person as to, and no reliance should be placed on, the fairness, accuracy, completeness or correctness of the information
or the opinions contained in this presentation (or whether any information has been omitted from this presentation). Turkish Airlines, to the extent
permitted by law, and each of its respective directors, officers, employees, affiliates, advisors or representatives disclaims all liability whatsoever (in
negligence or otherwise) for any loss however arising, directly or indirectly, from any use of this presentation or its contents or otherwise arising in
connection with this presentation.
This presentation should not be construed as financial, legal, tax, accounting, investment or other advice or a recommendation with respect to any
investment. Under no circumstances is this information and material to be construed as a prospectus, supplement, offering memorandum or
advertisement, and neither any part of this presentation nor any information or statement contained herein shall form the basis of or be relied upon in
connection with any contract, commitment or investment decision.
By reading this presentation or attending or listening to any relevant meeting, conference call or webcast organized by the Company, you agree to be
bound by the above provisions.
Disclaimer


![Operating Manual ALTAIR 5 with WirelessUSB module ALTAIR ... · MSA in Europe [ & ] Northern Europe Southern Europe Eastern Europe Central Europe Netherlands MSA Nederland Kernweg](https://static.documents.pub/doc/80x56/6021ffa02077db43a028a451/operating-manual-altair-5-with-wirelessusb-module-altair-msa-in-europe-.jpg)


