32
Turkish Hedonic House Price Index by Timur Hülagü Vice Head of the Statistics Department Central Bank of the Republic of Turkey

Turkish Hedonic House Price Index
by
Timur Hülagü
Vice Head of the Statistics Department
Central Bank of the Republic of Turkey

OUTLINE
2
House Price Index for Turkey (THPI) Data source Methodology
Measuring Quality Changes and Hedonic House Price Index (THHPI) Motivation Methodology Results

THPI – Data Source
3

THPI – Data Source
4
RAPOR

THPI – Data Source
5
RAPOR

THPI – Data Source
6

METHODOLOGY
7
Stratified Median Price
Strata can be formed by taking into account location, area, age, type ofthe properties
Geographical location constituted the basis for stratification
Grouping by location is practical
Variation of prices by location is a key characteristic of housing markets

WEIGHTING
8
Weighting:
• Data on house sales in the previous year registered by the General Directorate of Land Registry and Cadastre are used as weights for aggregating the strata in constructing THPI
• Weights are updated each year
CITYSUB-CITYNUTS
LEVEL-2COUNTRY
Weight of Town in
City
Weight of City in Level-2
Weight of Level-2 in Country

EXTREME VALUES AND INDEXATION
9
We also perform Tukey’s Hinges
Q3+3*(Q3-Q1) > median unit price > Q1-3*(Q3-Q1)
Indexation:
• Chain Laspeyres Index
𝑰𝒕𝒚 = 𝛴𝑖𝜔𝑖𝑦𝑝𝑖𝑡𝑦
𝛴 𝜔𝑖𝑦𝑝𝑖12 𝑦−1
∗ 𝑰𝟏𝟐 𝒚−𝟏

THPI (2010=100)
10
0
20
40
60
80
100
120
140
160
180
200
Jan
-10
Mar
-10
May
-10
Jul-
10
Sep
-10
No
v-1
0Ja
n-1
1M
ar-1
1M
ay-1
1Ju
l-1
1Se
p-1
1N
ov-
11
Jan
-12
Mar
-12
May
-12
Jul-
12
Sep
-12
No
v-1
2Ja
n-1
3M
ar-1
3M
ay-1
3Ju
l-1
3Se
p-1
3N
ov-
13
Jan
-14
Mar
-14
May
-14
Jul-
14
Sep
-14
No
v-1
4Ja
n-1
5M
ar-1
5
THPI
35-month, 32.7%
27-month, 39.0%

Why THHPI?
11
2010

WHY THHPI?
12
2014
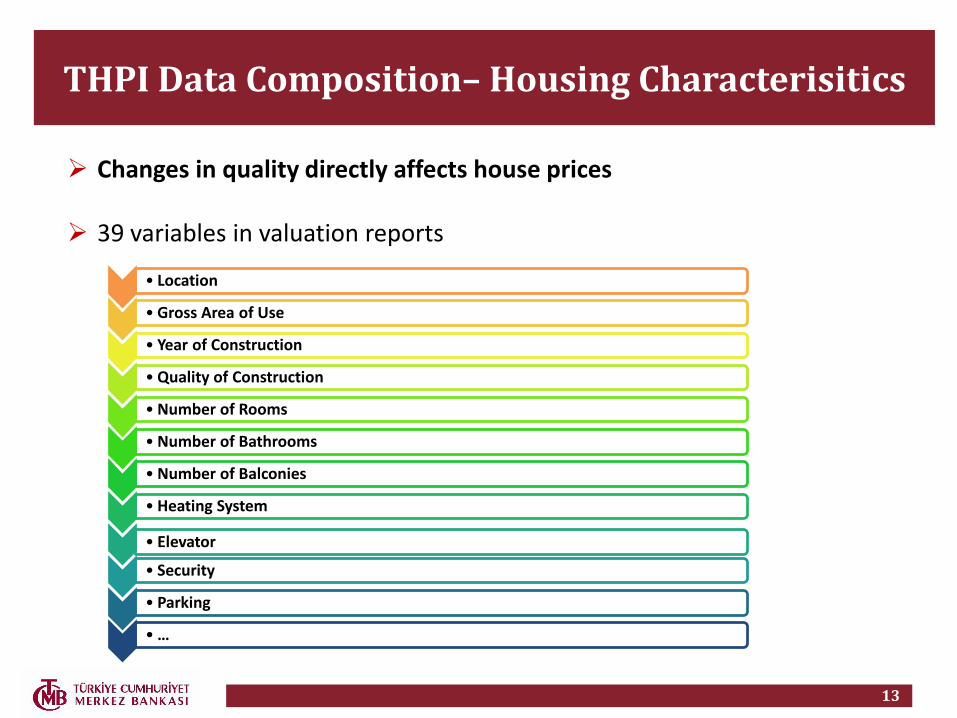
THPI Data Composition– Housing Characterisitics
13
Changes in quality directly affects house prices
39 variables in valuation reports
• Location
• Gross Area of Use
• Year of Construction
• Quality of Construction
• Number of Rooms
• Number of Bathrooms
• Number of Balconies
• Heating System
• Elevator
• Security
• Parking
• …

THHPI– Method
14
«Characteristic Prices Approach»
log-linear regression
𝑙𝑛 𝑝𝑛𝑡 = 𝛽0
𝑡 +
𝑘
𝛽𝑘𝑡 𝑧𝑛𝑘𝑡 + 𝜀𝑛
𝑡 , ………………∀𝒊, 𝒕
𝒑𝒏𝒕 : n property’s apprisal value in period t
𝒛𝒏𝒌𝒕 : kth characteristic of apprised property

THHPI– Method
15
Same basic methodology with THPI
Same stratum with THPI
Chained Laspeyres method
Tukey’s Hinges method (outlier detection)

THHPI– Method
16
𝑃𝑖𝑡 =
𝑒𝑥𝑝( 𝛽0𝑡)𝑒𝑥𝑝[ 𝑘
𝛽𝑘𝑡 𝑧𝑛𝑘0 ]
𝑒𝑥𝑝( 𝛽00)𝑒𝑥𝑝[ 𝑘
𝛽𝑘0 𝑧𝑛𝑘0 ]
𝑷𝒊𝒕 : price index for period t
𝒛𝒏𝒌𝟎 : average kth characteristics for the base period (all n properties’)
Holding characteristics constant => Quality adjusted price index

THHPI– Method
17
𝑃𝑖𝑡 =
𝑒𝑥𝑝( 𝛽0𝑡)𝑒𝑥𝑝[ 𝑘
𝛽𝑘𝑡 𝑧𝑛𝑘0 ]
𝑒𝑥𝑝( 𝛽00)𝑒𝑥𝑝[ 𝑘
𝛽𝑘0 𝑧𝑛𝑘0 ]
𝑷𝒊𝒕 : price index for period t
𝒛𝒏𝒌𝟎 : average kth characteristics for the base period (all n properties’)
Holding characteristics constant => Quality adjusted price index
January 2012, t=0

THHPI– Regression Example (K.Çekmece, January 2012)
18
Characteristics Coefficients
Gross Area of Use (m2)0.005
(0.000)**
Quality of Construction0.109
(0.022)**
Year of Construction0.003
(0.001)*
No. of Bedrooms0.033
(0.017)*
No. of Bathrooms0.084
(0.029)**
No. of Balconies0.071
(0.017)**
Security Service0.333
(0.032)**
Heating Type0.118
(0.045)**
Elevator0.133
(0.028)**
Constant5.655
(2.040)**
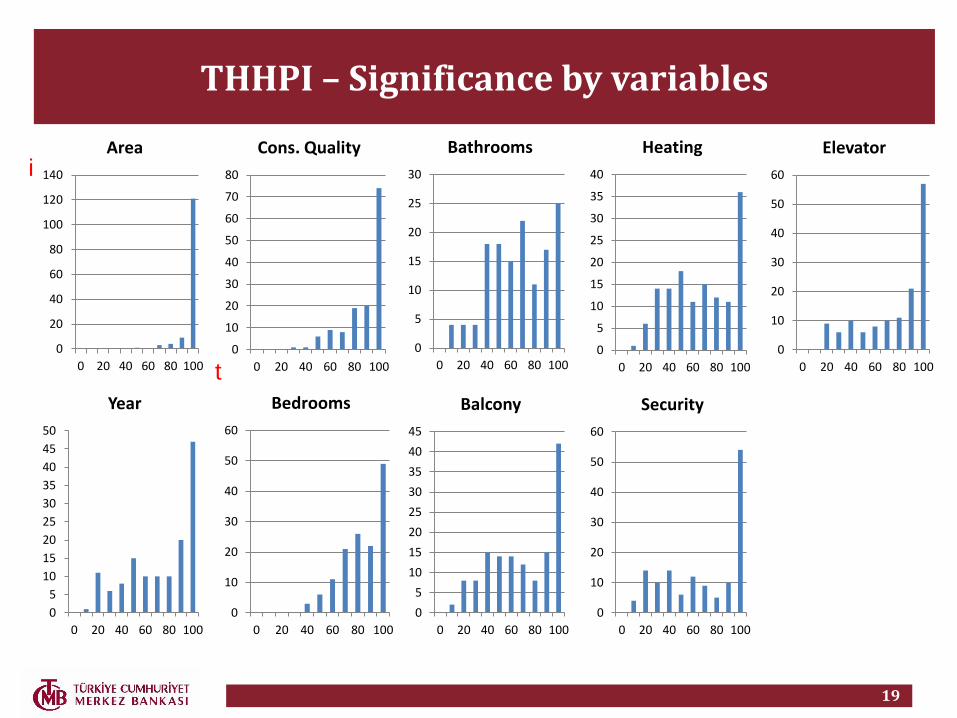
THHPI – Significance by variables
19
0
20
40
60
80
100
120
140
0 20 40 60 80 100
Area
0
5
10
15
20
25
30
35
40
45
50
0 20 40 60 80 100
Year
0
10
20
30
40
50
60
70
80
0 20 40 60 80 100
Cons. Quality
0
10
20
30
40
50
60
0 20 40 60 80 100
Bedrooms
0
5
10
15
20
25
30
35
40
45
0 20 40 60 80 100
Balcony
0
10
20
30
40
50
60
0 20 40 60 80 100
Security
0
5
10
15
20
25
30
35
40
0 20 40 60 80 100
Heating
0
10
20
30
40
50
60
0 20 40 60 80 100
Elevator
0
5
10
15
20
25
30
0 20 40 60 80 100
Bathroomsi
t
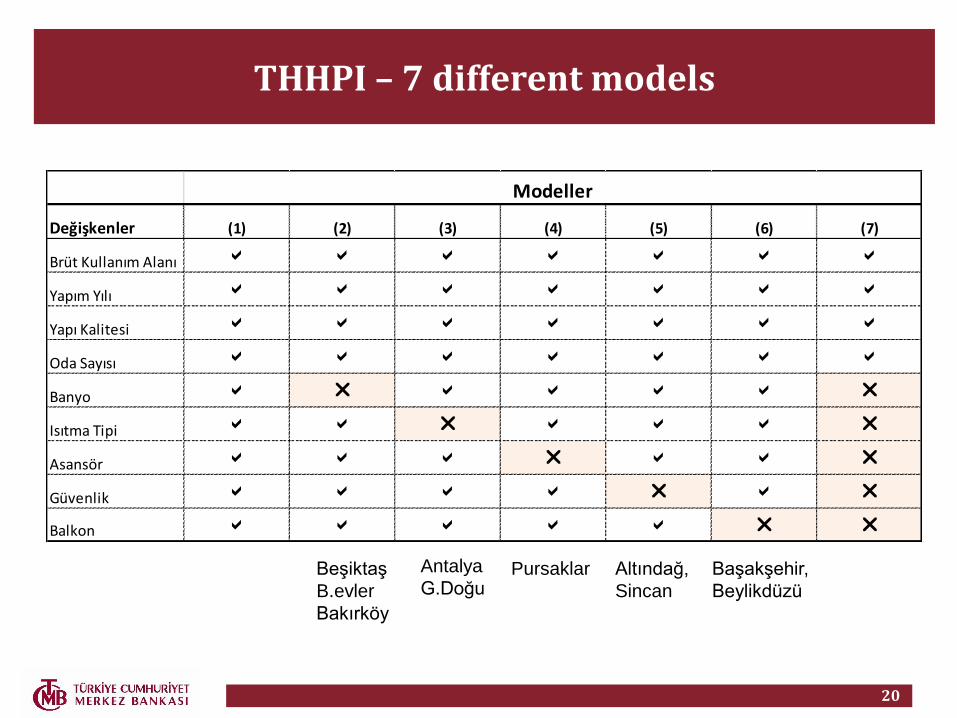
THHPI – 7 different models
Değişkenler (1) (2) (3) (4) (5) (6) (7)
Brüt Kullanım Alanı a a a a a a a
Yapım Yılı a a a a a a a
Yapı Kalitesi a a a a a a a
Oda Sayısı a a a a a a a
Banyo a r a a a a r
Isıtma Tipi a a r a a a r
Asansör a a a r a a r
Güvenlik a a a a r a r
Balkon a a a a a r r
Modeller
20
Antalya
G.DoğuAltındağ,
Sincan
PursaklarBeşiktaş
B.evler
Bakırköy
Başakşehir,
Beylikdüzü

THHPI
21
While THPI was 178.8, THHPI was 160.6 in March 2015. The 18.2 pp difference can be attributed toquality improvements in the housing market.
160.6178.8
143.1
020406080
100120140160180200
Jan
-10
Ap
r-1
0
Jul-
10
Oct
-10
Jan
-11
Ap
r-1
1
Jul-
11
Oct
-11
Jan
-12
Ap
r-1
2
Jul-
12
Oct
-12
Jan
-13
Ap
r-1
3
Jul-
13
Oct
-13
Jan
-14
Ap
r-1
4
Jul-
14
Oct
-14
Jan
-15
TURKEY
THHPI THPI CPI

THHPI
22
5.1
18.2
0
2
4
6
8
10
12
14
16
18
20 Quality Change

THHPI– 3 Main Cities
23
March 2015 THPI THHPI Quality Improvement
CPI
İstanbul 216.7 195.3 21.4 143.3
Ankara 157.0 153.1 3.9 143.8
İzmir 172.5 163.6 8.9 144.5
80
100
120
140
160
180
200
Jan
-10
Mar
-10
May
-10
Jul-
10
Sep
-10
No
v-1
0Ja
n-1
1M
ar-1
1M
ay-1
1Ju
l-1
1Se
p-1
1N
ov-
11
Jan
-12
Mar
-12
May
-12
Jul-
12
Sep
-12
No
v-1
2Ja
n-1
3M
ar-1
3M
ay-1
3Ju
l-1
3Se
p-1
3N
ov-
13
Jan
-14
Mar
-14
May
-14
Jul-
14
Sep
-14
No
v-1
4Ja
n-1
5M
ar-1
5
THHPI
Istanbul AnkaraIzmir Turkey

Quality Improvement Levels in Turkey (February 2015, ~57 months)
24
Highest Quality Improvement
TRA1 (Erzurum, Erzincan, Bayburt) 21,6
TR10 (İstanbul) 21,4
TR32 (Aydın, Denizli, Muğla) 19,5
TRC1 (Kilis, Adıyaman, Gaziantep) 19,2
Lowest Quality Improvement
TR82 (Çankırı, Kastamonu, Sinop) -0,1
TRC2 (Diyarbakır, Şanlıurfa) 2,7
TR51 (Ankara) 3,9
TR63 (Hatay, K.maraş, Osmaniye) 4,0

Quality Improvement/ Price Increase (February 2015, ~57 months)
25
Highest Ratio %
TR81 (Zonguldak, Bartın, Karabük) 33,3
TRB1 (Bingöl, Elazığ, Malatya, Tunceli) 32,3
TR32 (Aydın, Denizli, Muğla) 28,6
TR21 (Edirne, Kırıkkale, Tekirdağ) 28,2
TRA1 (Erzurum, Erzincan, Bayburt) 26,8
Lowest Ratio %
TR82 (Çankırı, Kastamonu, Sinop) -1,0
TRC2 (Diyarbakır, Şanlıurfa) 4,0
TR51 (Ankara) 5,7
TR72 (Kayseri, Sivas, Yozgat) 7,0
TR63 (Hatay, Kahramanmaraş, Osmaniye) 7,0

Results
26
Roughly, 1 out of 4 share of nominal house price increases in Turkey, inaggregate, and 1 out of 5 share on nominal house price increases in İstanbulare resulted from quality improvements.
In 57 months period, Real KFE 35,7 pp, or %25.0 Quality Imp. 18,2 pp, or %11.3 Pure Rise 17,5 pp, or %12.3

CENTRAL BANK OF THE REPUBLIC OF TURKEY
STATISTICS DEPARTMENT
THANK YOU

Discussion
28
İSTANBUL ANKARA
Jan.12 Feb.15 Jan.12 Feb.15
Price (‘000 ₺) 137.3 209.0 103.8 142.9
Gross area of use (m2) 96.39 89.96 117.19 118.15
Year of construction 2001.88 2006.42 2002.47 2005.29
Quality of construction 0.58 0.54 0.44 0.49
No. of bedrooms 2.52 2.39 3.02 3.02
No. of bathrooms 1.24 1.22 1.23 1.28
No. of balconies 1.11 1.02 1.68 1.64
Security 0.15 0.16 0.04 0.05
Heating 0.91 0.87 0.91 0.86
Elevator 0.45 0.52 0.34 0.44
Average Characteristics

Discussion
29
Share of New Apartments

Discussion
30
90
100
110
120
130
140
150
160Ja
n-1
0
Ap
r-1
0
Jul-
10
Oct
-10
Jan
-11
Ap
r-1
1
Jul-
11
Oct
-11
Jan
-12
Ap
r-1
2
Jul-
12
Oct
-12
Jan
-13
Ap
r-1
3
Jul-
13
Oct
-13
Jan
-14
Ap
r-1
4
Jul-
14
Oct
-14
TURKEY
201201=100
2012=100

Discussion
31

Discussion
32


