Take the steps... Transportation Research R e s e a r c h...Kn o w l e d g e ...Innov a t i v e Sol u t i o n s ! 2008-14 Turn Lane Lengths for Various Speed Roads and Evaluation of Determining Criteria
Transcript
Take the steps...
Transportation Research
Research...Knowledge...Innovative Solutions!
2008-14
Turn Lane Lengths for Various Speed Roads andEvaluation of Determining Criteria
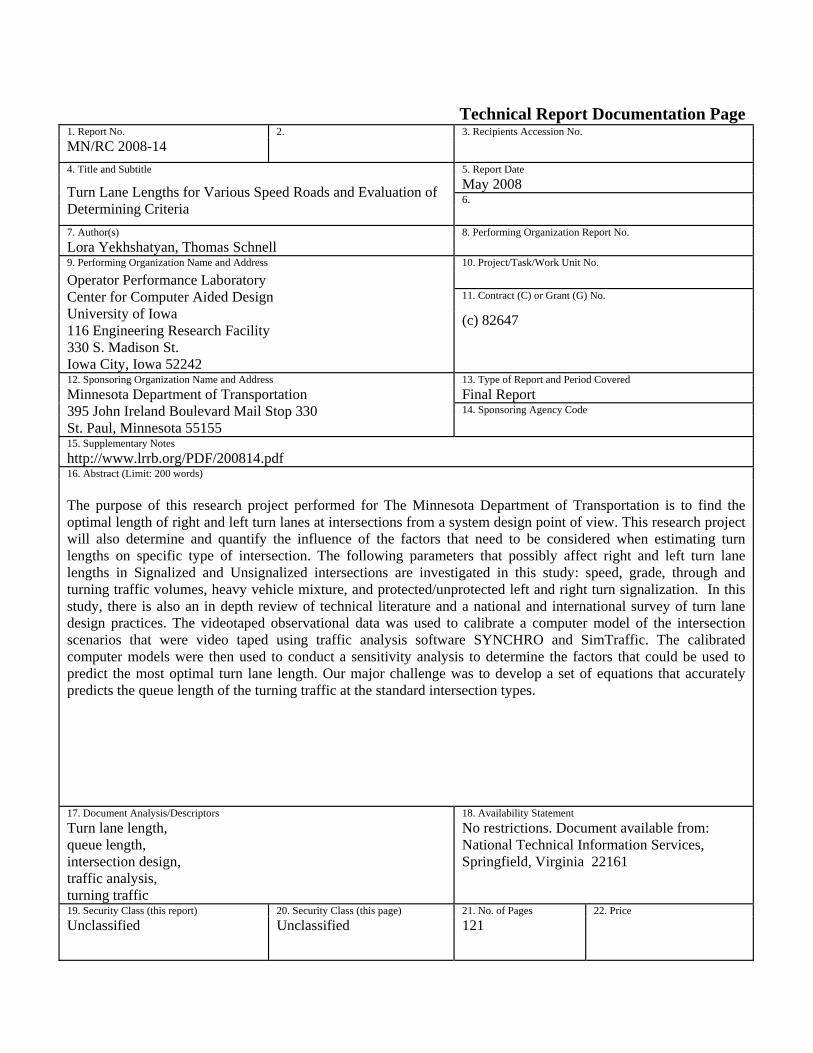
Technical Report Documentation Page 1. Report No. 2. 3. Recipients Accession No. MN/RC 2008-14 4. Title and Subtitle 5. Report Date
May 2008 6. Turn Lane Lengths for Various Speed Roads and Evaluation of
Determining Criteria 7. Author(s) 8. Performing Organization Report No. Lora Yekhshatyan, Thomas Schnell 9. Performing Organization Name and Address 10. Project/Task/Work Unit No.
11. Contract (C) or Grant (G) No.
Operator Performance Laboratory Center for Computer Aided Design University of Iowa 116 Engineering Research Facility 330 S. Madison St. Iowa City, Iowa 52242
(c) 82647
12. Sponsoring Organization Name and Address 13. Type of Report and Period Covered Final Report 14. Sponsoring Agency Code
Minnesota Department of Transportation 395 John Ireland Boulevard Mail Stop 330 St. Paul, Minnesota 55155 15. Supplementary Notes http://www.lrrb.org/PDF/200814.pdf 16. Abstract (Limit: 200 words) The purpose of this research project performed for The Minnesota Department of Transportation is to find the optimal length of right and left turn lanes at intersections from a system design point of view. This research project will also determine and quantify the influence of the factors that need to be considered when estimating turn lengths on specific type of intersection. The following parameters that possibly affect right and left turn lane lengths in Signalized and Unsignalized intersections are investigated in this study: speed, grade, through and turning traffic volumes, heavy vehicle mixture, and protected/unprotected left and right turn signalization. In this study, there is also an in depth review of technical literature and a national and international survey of turn lane design practices. The videotaped observational data was used to calibrate a computer model of the intersection scenarios that were video taped using traffic analysis software SYNCHRO and SimTraffic. The calibrated computer models were then used to conduct a sensitivity analysis to determine the factors that could be used to predict the most optimal turn lane length. Our major challenge was to develop a set of equations that accurately predicts the queue length of the turning traffic at the standard intersection types.
No restrictions. Document available from: National Technical Information Services, Springfield, Virginia 22161
19. Security Class (this report) 20. Security Class (this page) 21. No. of Pages 22. Price Unclassified Unclassified 121
Turn Lane Lengths for Various Speed Roads and Evaluation of Determining Criteria
Final Report
Prepared by:
Lora Yekhshatyan Tom Schnell
Operator Performance Laboratory (OPL)
Center for Computer Aided Design (CCAD) University of Iowa
May 2008
Published by:
Minnesota Department of Transportation Research Services Section
395 John Ireland Boulevard, MS 330 St. Paul, Minnesota 55155-1899
This report was prepared by the Operator Performance Laboratory, University of Iowa as part of a research project sponsored by the Minnesota Department of Transportation. The contents of this report reflect the views of the authors, who are responsible for the facts and accuracy of the data presented herein. The contents do not necessarily reflect the official view or policies of the Minnesota Department of Transportation. This report does not constitute a standard, specification, or regulation, nor is it intended for construction, bidding, or permit purposes. The authors and the Minnesota Department of Transportation and Center for Transportation Studies do not endorse products or manufacturers. Trade or manufacturers’ names appear herein solely because they are considered essential to this report.
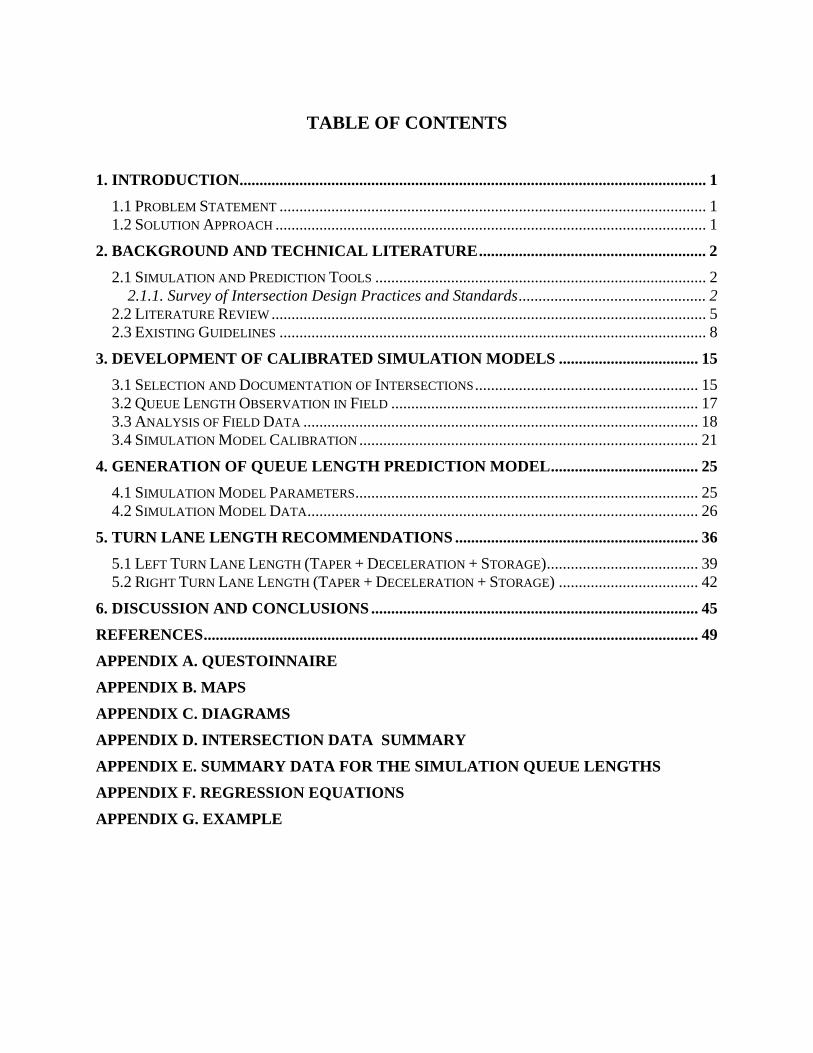
2. BACKGROUND AND TECHNICAL LITERATURE......................................................... 2 2.1 SIMULATION AND PREDICTION TOOLS ................................................................................... 2
2.1.1. Survey of Intersection Design Practices and Standards............................................... 2 2.2 LITERATURE REVIEW ............................................................................................................. 5 2.3 EXISTING GUIDELINES ........................................................................................................... 8
3. DEVELOPMENT OF CALIBRATED SIMULATION MODELS ................................... 15 3.1 SELECTION AND DOCUMENTATION OF INTERSECTIONS........................................................ 15 3.2 QUEUE LENGTH OBSERVATION IN FIELD ............................................................................. 17 3.3 ANALYSIS OF FIELD DATA ................................................................................................... 18 3.4 SIMULATION MODEL CALIBRATION ..................................................................................... 21
4. GENERATION OF QUEUE LENGTH PREDICTION MODEL..................................... 25 4.1 SIMULATION MODEL PARAMETERS...................................................................................... 25 4.2 SIMULATION MODEL DATA.................................................................................................. 26
5. TURN LANE LENGTH RECOMMENDATIONS ............................................................. 36 5.1 LEFT TURN LANE LENGTH (TAPER + DECELERATION + STORAGE)...................................... 39 5.2 RIGHT TURN LANE LENGTH (TAPER + DECELERATION + STORAGE) ................................... 42
6. DISCUSSION AND CONCLUSIONS .................................................................................. 45
Figure 11. Channelization design on the right turns in SYNCHRO............................................. 22
Figure 12. Sketch of volumes on the intersection......................................................................... 26
Figure 13. Components of turn lane ............................................................................................. 36
Figure 14. Right-Turn Deceleration Bay ...................................................................................... 38
Figure 15. The flow chart of the turn lane length evaluation procedure....................................... 48
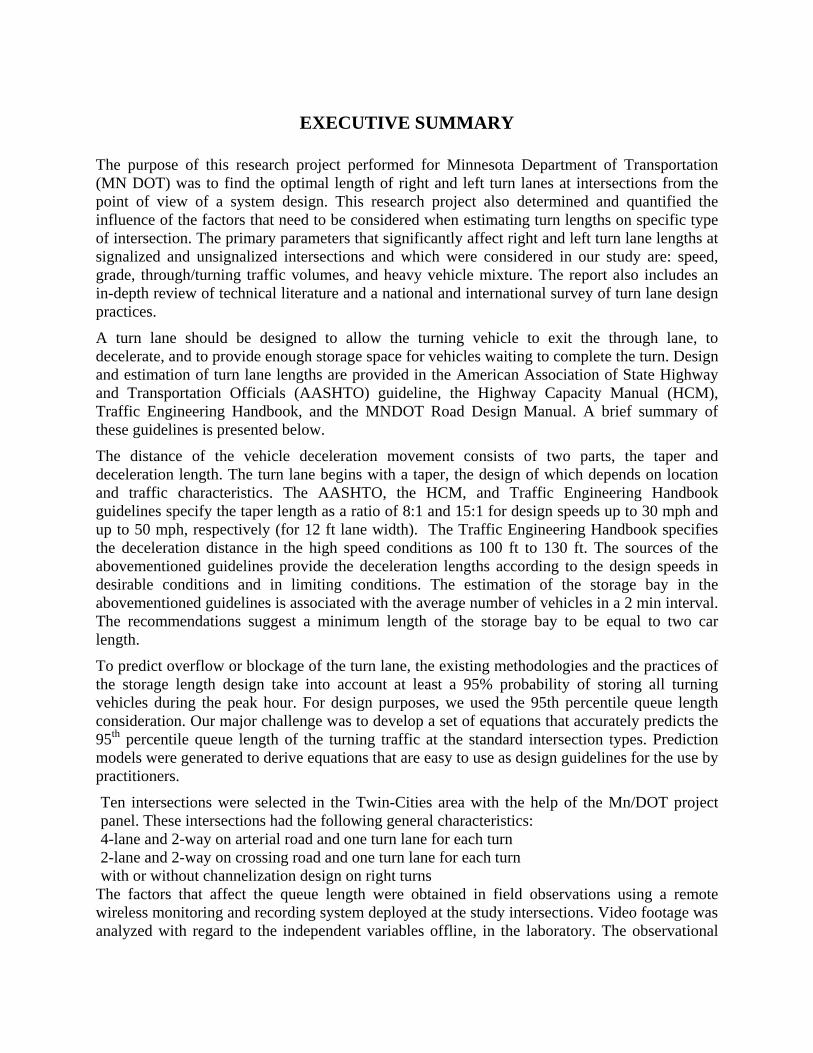
EXECUTIVE SUMMARY The purpose of this research project performed for Minnesota Department of Transportation (MN DOT) was to find the optimal length of right and left turn lanes at intersections from the point of view of a system design. This research project also determined and quantified the influence of the factors that need to be considered when estimating turn lengths on specific type of intersection. The primary parameters that significantly affect right and left turn lane lengths at signalized and unsignalized intersections and which were considered in our study are: speed, grade, through/turning traffic volumes, and heavy vehicle mixture. The report also includes an in-depth review of technical literature and a national and international survey of turn lane design practices.
A turn lane should be designed to allow the turning vehicle to exit the through lane, to decelerate, and to provide enough storage space for vehicles waiting to complete the turn. Design and estimation of turn lane lengths are provided in the American Association of State Highway and Transportation Officials (AASHTO) guideline, the Highway Capacity Manual (HCM), Traffic Engineering Handbook, and the MNDOT Road Design Manual. A brief summary of these guidelines is presented below.
The distance of the vehicle deceleration movement consists of two parts, the taper and deceleration length. The turn lane begins with a taper, the design of which depends on location and traffic characteristics. The AASHTO, the HCM, and Traffic Engineering Handbook guidelines specify the taper length as a ratio of 8:1 and 15:1 for design speeds up to 30 mph and up to 50 mph, respectively (for 12 ft lane width). The Traffic Engineering Handbook specifies the deceleration distance in the high speed conditions as 100 ft to 130 ft. The sources of the abovementioned guidelines provide the deceleration lengths according to the design speeds in desirable conditions and in limiting conditions. The estimation of the storage bay in the abovementioned guidelines is associated with the average number of vehicles in a 2 min interval. The recommendations suggest a minimum length of the storage bay to be equal to two car length.
To predict overflow or blockage of the turn lane, the existing methodologies and the practices of the storage length design take into account at least a 95% probability of storing all turning vehicles during the peak hour. For design purposes, we used the 95th percentile queue length consideration. Our major challenge was to develop a set of equations that accurately predicts the 95th percentile queue length of the turning traffic at the standard intersection types. Prediction models were generated to derive equations that are easy to use as design guidelines for the use by practitioners.
Ten intersections were selected in the Twin-Cities area with the help of the Mn/DOT project panel. These intersections had the following general characteristics: 4-lane and 2-way on arterial road and one turn lane for each turn 2-lane and 2-way on crossing road and one turn lane for each turn with or without channelization design on right turns
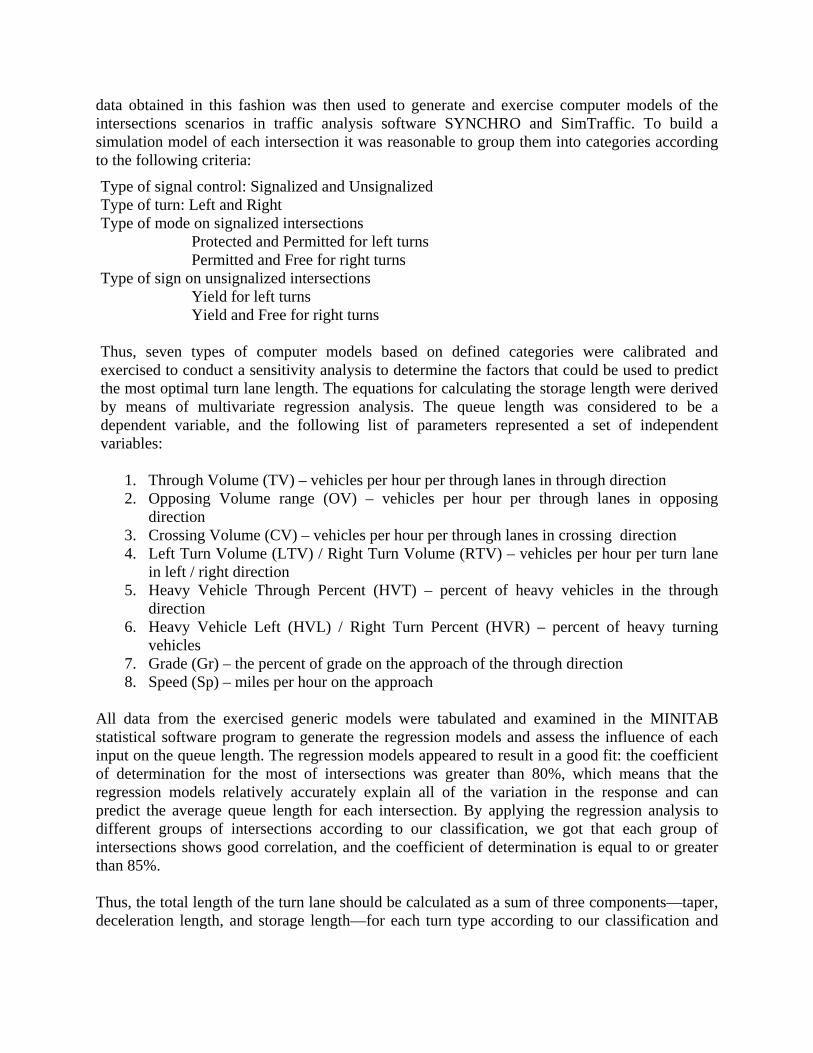
The factors that affect the queue length were obtained in field observations using a remote wireless monitoring and recording system deployed at the study intersections. Video footage was analyzed with regard to the independent variables offline, in the laboratory. The observational
data obtained in this fashion was then used to generate and exercise computer models of the intersections scenarios in traffic analysis software SYNCHRO and SimTraffic. To build a simulation model of each intersection it was reasonable to group them into categories according to the following criteria:
Type of signal control: Signalized and Unsignalized Type of turn: Left and Right Type of mode on signalized intersections Protected and Permitted for left turns Permitted and Free for right turns Type of sign on unsignalized intersections Yield for left turns Yield and Free for right turns Thus, seven types of computer models based on defined categories were calibrated and exercised to conduct a sensitivity analysis to determine the factors that could be used to predict the most optimal turn lane length. The equations for calculating the storage length were derived by means of multivariate regression analysis. The queue length was considered to be a dependent variable, and the following list of parameters represented a set of independent variables:
1. Through Volume (TV) – vehicles per hour per through lanes in through direction 2. Opposing Volume range (OV) – vehicles per hour per through lanes in opposing
direction 3. Crossing Volume (CV) – vehicles per hour per through lanes in crossing direction 4. Left Turn Volume (LTV) / Right Turn Volume (RTV) – vehicles per hour per turn lane
in left / right direction 5. Heavy Vehicle Through Percent (HVT) – percent of heavy vehicles in the through
direction 6. Heavy Vehicle Left (HVL) / Right Turn Percent (HVR) – percent of heavy turning
vehicles 7. Grade (Gr) – the percent of grade on the approach of the through direction 8. Speed (Sp) – miles per hour on the approach
All data from the exercised generic models were tabulated and examined in the MINITAB statistical software program to generate the regression models and assess the influence of each input on the queue length. The regression models appeared to result in a good fit: the coefficient of determination for the most of intersections was greater than 80%, which means that the regression models relatively accurately explain all of the variation in the response and can predict the average queue length for each intersection. By applying the regression analysis to different groups of intersections according to our classification, we got that each group of intersections shows good correlation, and the coefficient of determination is equal to or greater than 85%. Thus, the total length of the turn lane should be calculated as a sum of three components—taper, deceleration length, and storage length—for each turn type according to our classification and
design speed. The entire procedure of defining a turn lane length is divided into the following steps:
1. Identification of the type of turn: Left or Right; 2. Identification of the type of intersection: Signalized or Unsignalized; 3. Identification of the type of mode or sign control: Protected, Permitted, Yield, or Free; 4. Identification of the designed speed value; 5. Identification of the total volume of the through traffic - Through Volume; 6. Identification of the Opposing Volume of the traffic (total volume of the opposing
traffic) for left turns and Crossing Volume of the traffic (total volume of the crossing traffic) for right turns;
7. Identification of the Heavy Vehicles Mixture Percent for the turn lane; 8. Identification of the Heavy Vehicles Mixture Percent for the through lane; 9. Identification of the Grade; 10. Calculation of the storage bay for defined turn type; 11. Determination of the taper and deceleration lengths for defined design speed; 12. Calculation of the sum of the storage length obtained in Step 10 and the deceleration
distance obtained in Step 11. The influence of each independent variable within the ranges that was investigated from the regression analysis is as follows:
1. The most important and significant factors are Through Volume, Opposing Volume (for the left turns), Crossing Volume (for the right turns), Left and Right Turn Volumes, Heavy Vehicle Turn Percent for left and right turns, and Speed.
2. The influence of Heavy Vehicle Through Percent factor exists but does not appear to be significant for Permitted left turns on Signalized intersections; Free right turns on both types of intersections; Yield right and left turns on Unsignalized intersections.
3. The influence of Through Volume on Free right turns on Unsignalized intersections does not appear practically significant.
4. The Grade factor does not appear to affect the left and right turn queue length.
These recommendations are applicable for the following range of parameters: 1. Volume per Through lane – up to 500 vehicles per hour per lane 2. Turn Volume – up to 250 vehicles per hour 3. Heavy Vehicle Percent – up to 20-25% 4. Speed – from 30 mph to 70 mph 5. Grade – from -4% to +4%.
For the values that are not in these ranges, additional HCM recommendations such as double left turn lane consideration, changes in the available green time, etc. should be used.
1
1. INTRODUCTION
1.1 Problem Statement
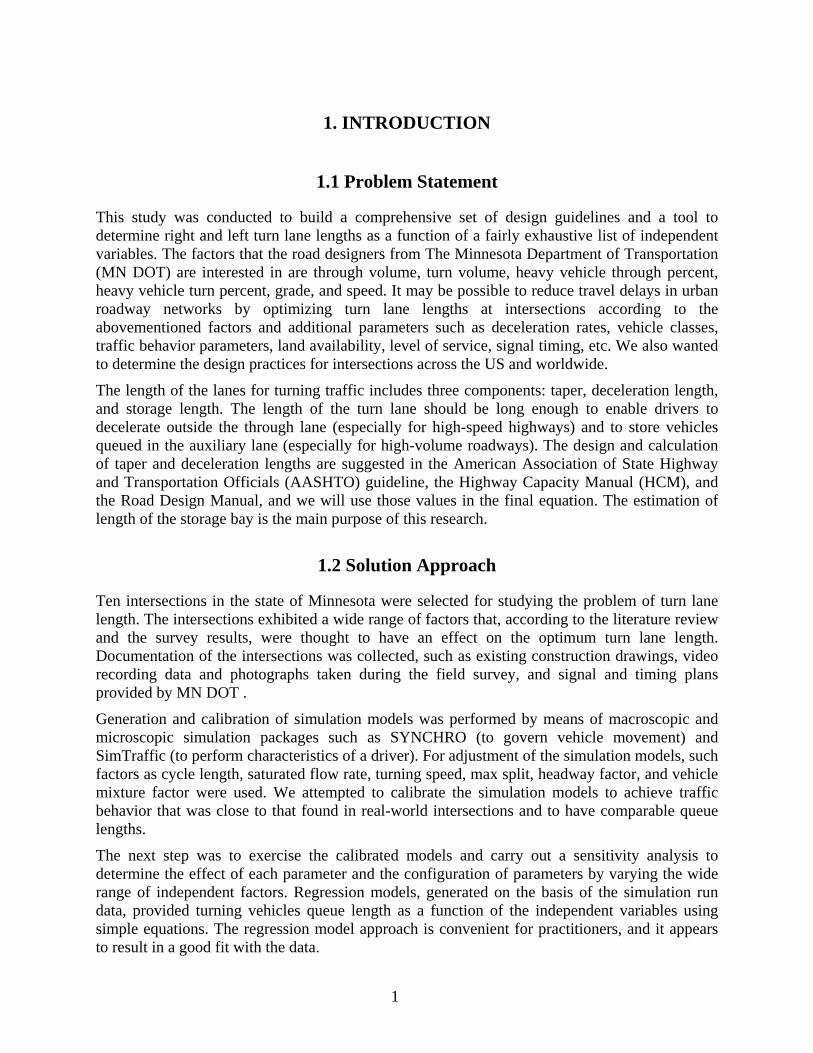
This study was conducted to build a comprehensive set of design guidelines and a tool to determine right and left turn lane lengths as a function of a fairly exhaustive list of independent variables. The factors that the road designers from The Minnesota Department of Transportation (MN DOT) are interested in are through volume, turn volume, heavy vehicle through percent, heavy vehicle turn percent, grade, and speed. It may be possible to reduce travel delays in urban roadway networks by optimizing turn lane lengths at intersections according to the abovementioned factors and additional parameters such as deceleration rates, vehicle classes, traffic behavior parameters, land availability, level of service, signal timing, etc. We also wanted to determine the design practices for intersections across the US and worldwide.
The length of the lanes for turning traffic includes three components: taper, deceleration length, and storage length. The length of the turn lane should be long enough to enable drivers to decelerate outside the through lane (especially for high-speed highways) and to store vehicles queued in the auxiliary lane (especially for high-volume roadways). The design and calculation of taper and deceleration lengths are suggested in the American Association of State Highway and Transportation Officials (AASHTO) guideline, the Highway Capacity Manual (HCM), and the Road Design Manual, and we will use those values in the final equation. The estimation of length of the storage bay is the main purpose of this research.
1.2 Solution Approach
Ten intersections in the state of Minnesota were selected for studying the problem of turn lane length. The intersections exhibited a wide range of factors that, according to the literature review and the survey results, were thought to have an effect on the optimum turn lane length. Documentation of the intersections was collected, such as existing construction drawings, video recording data and photographs taken during the field survey, and signal and timing plans provided by MN DOT .
Generation and calibration of simulation models was performed by means of macroscopic and microscopic simulation packages such as SYNCHRO (to govern vehicle movement) and SimTraffic (to perform characteristics of a driver). For adjustment of the simulation models, such factors as cycle length, saturated flow rate, turning speed, max split, headway factor, and vehicle mixture factor were used. We attempted to calibrate the simulation models to achieve traffic behavior that was close to that found in real-world intersections and to have comparable queue lengths.
The next step was to exercise the calibrated models and carry out a sensitivity analysis to determine the effect of each parameter and the configuration of parameters by varying the wide range of independent factors. Regression models, generated on the basis of the simulation run data, provided turning vehicles queue length as a function of the independent variables using simple equations. The regression model approach is convenient for practitioners, and it appears to result in a good fit with the data.
2
2. BACKGROUND AND TECHNICAL LITERATURE
2.1 Simulation and Prediction Tools
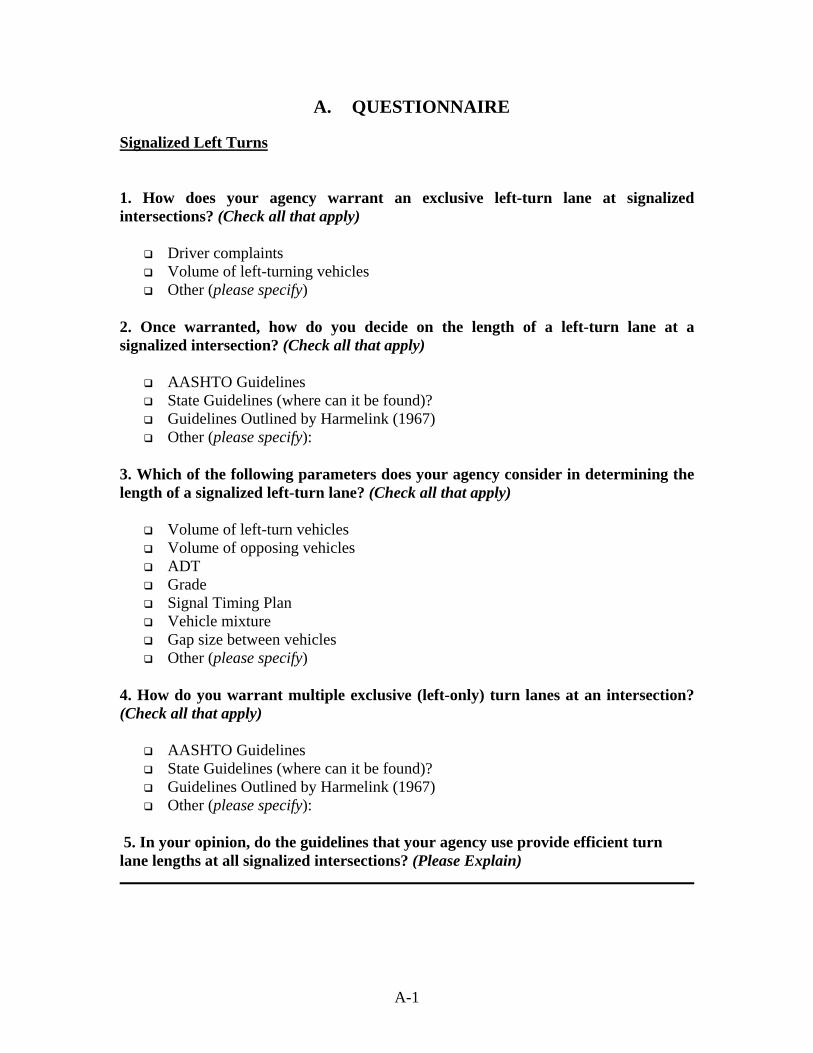
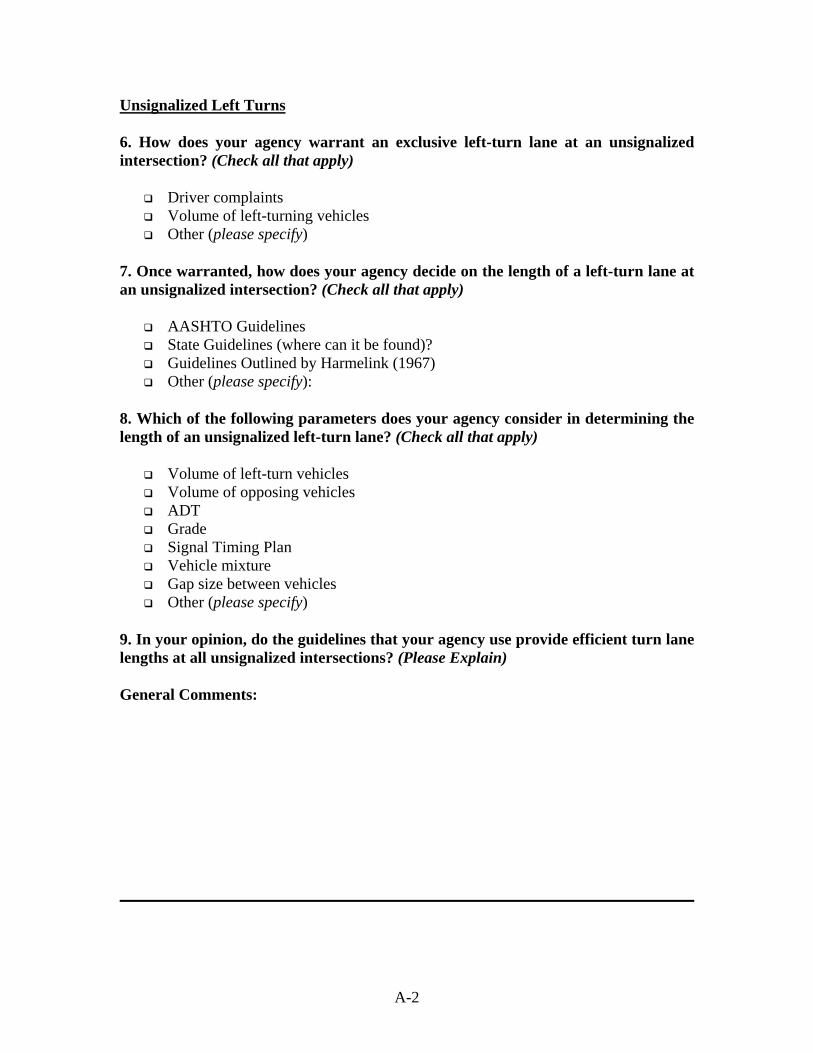
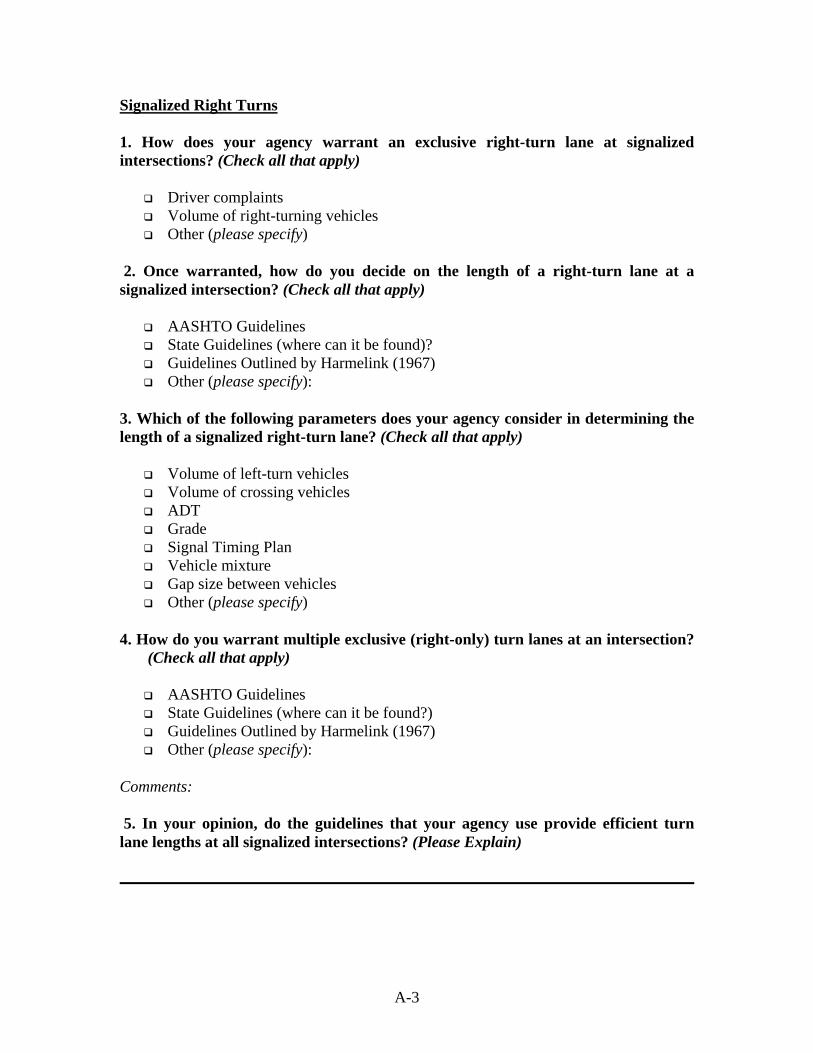
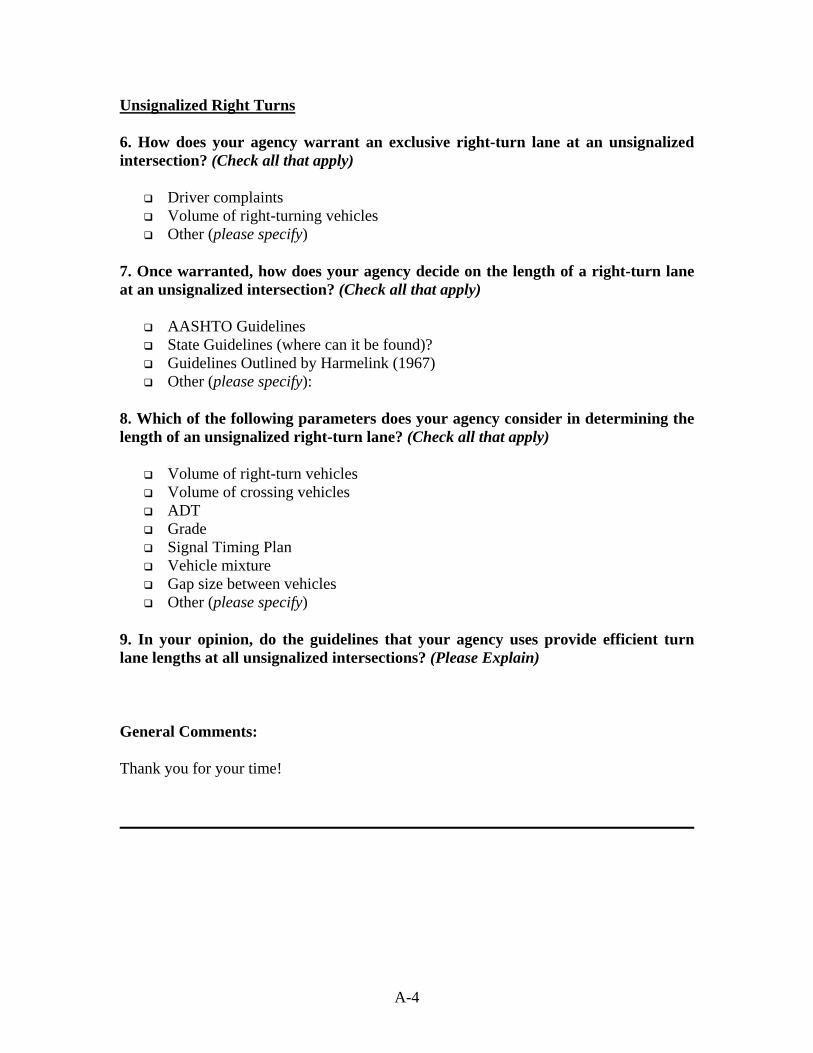
In this chapter, we delineate the existing practices and methodologies for calculating turning vehicle queue length. Existing guidelines determine the warrants of turn lanes depending on turn, through, opposing, and cross traffic; speed; signal timing; cycle length; and g/C ratios for a signalized intersection. These guidelines are available in Traffic Engineering Handbook, A Policy of Geometric Design on Highways and Streets (called the Green Book), the Highway Capacity Manual, and the Road Design Manual. In order to comprehend how the traffic engineers use the turn lane guidelines, we reviewed the existing turn lane practices by conducting a survey.
2.1.1. Survey of Intersection Design Practices and Standards
A survey was designed to investigate the current practices of determining the queue length for right and left turn lanes. The survey questionnaire is in Appendix A. Surveys were mailed out to approximately 1,000 participants, including the traffic and design engineers of the US state DOTs, Canadian province, traffic engineers in Europe and Japan, worldwide design offices, and individually designated specialists. About ten specialists were interviewed over the phone or in person. We received 37 completed surveys.
The survey was divided into two main categories: determination of left turn lanes and right turn lanes. The survey included questions about signalized turn lanes and unsignalized turn lanes for both categories. The questions were grouped as follows:
− Guidelines agencies pursue to warrant an exclusive turn lane at the intersection
− Guidelines agencies pursue when determining the length of the queue
− Agencies’ opinions about guidelines that ensure efficient queue lengths
− Ways in which agencies determine the length of the queue
− Ways in which agencies warrant exclusive left and right turn lanes
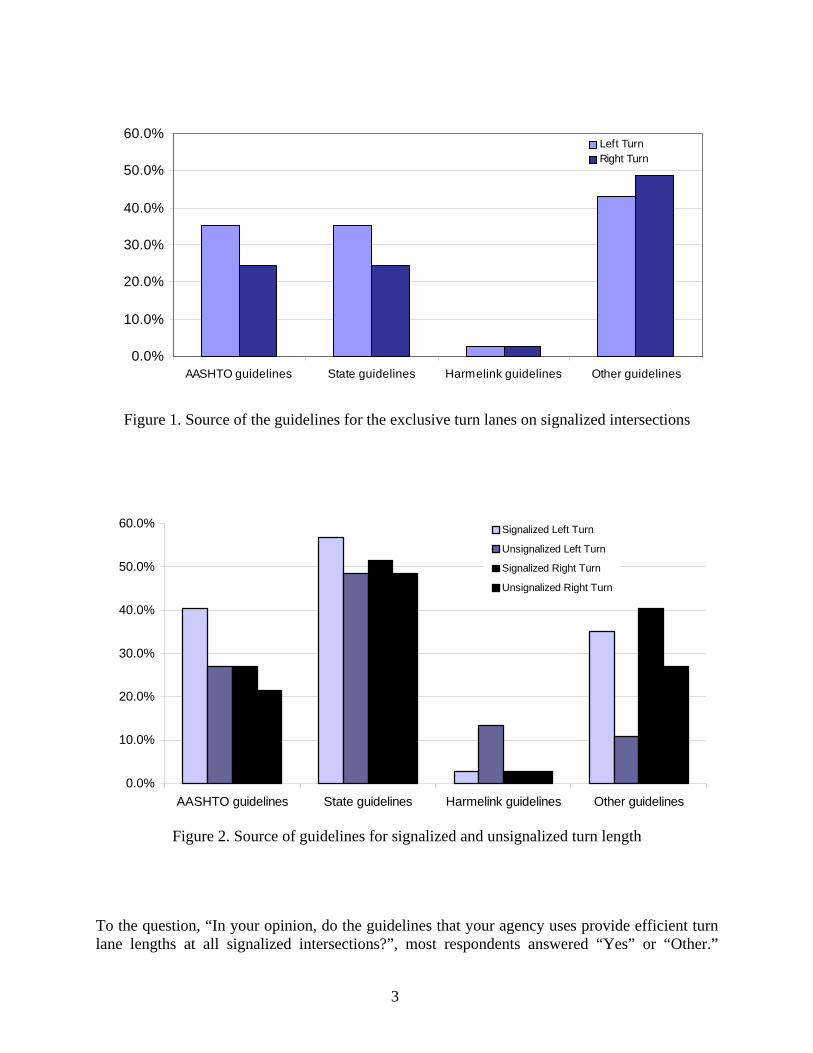
To determine the necessity of an exclusive turn lane at signalized intersections, the respondents referred to the Capacity Analysis, the Highway Capacity Manual (HCM), the Highway Capacity Software (HCS), Traffic Engineering Handbook, or to a rule of thumb if the number of vehicles turning during a peak hour is equal to or greater than 300, etc. The sources mentioned represent the Other Guidelines option. They refer to the American Association of State Highway and Transportation Officials (AASHTO) and State Guidelines with the same frequency (Figure 1).
On the question about the source of guidelines for determining the length of the turn lane, the options were the AASHTO Guidelines, the State Guidelines, the Harmelink’s Guidelines, and the Other guidelines, the respondents mainly mentioned the State Guidelines (Figure 2). The Other Guidelines option included SYNCHRO analysis, the capacity analysis, the HCS analysis, Leisch Nomograph, the HCM, etc. The AASHTO guidelines were mentioned often, mostly to determine the left turn length for a signalized intersection (40.5%).
3
0.0%
10.0%
20.0%
30.0%
40.0%
50.0%
60.0%
AASHTO guidelines State guidelines Harmelink guidelines Other guidelines
Left Turn Right Turn
Figure 1. Source of the guidelines for the exclusive turn lanes on signalized intersections
0.0%
10.0%
20.0%
30.0%
40.0%
50.0%
60.0%
AASHTO guidelines State guidelines Harmelink guidelines Other guidelines
Signalized Left Turn
Unsignalized Left Turn
Signalized Right Turn
Unsignalized Right Turn
Figure 2. Source of guidelines for signalized and unsignalized turn length
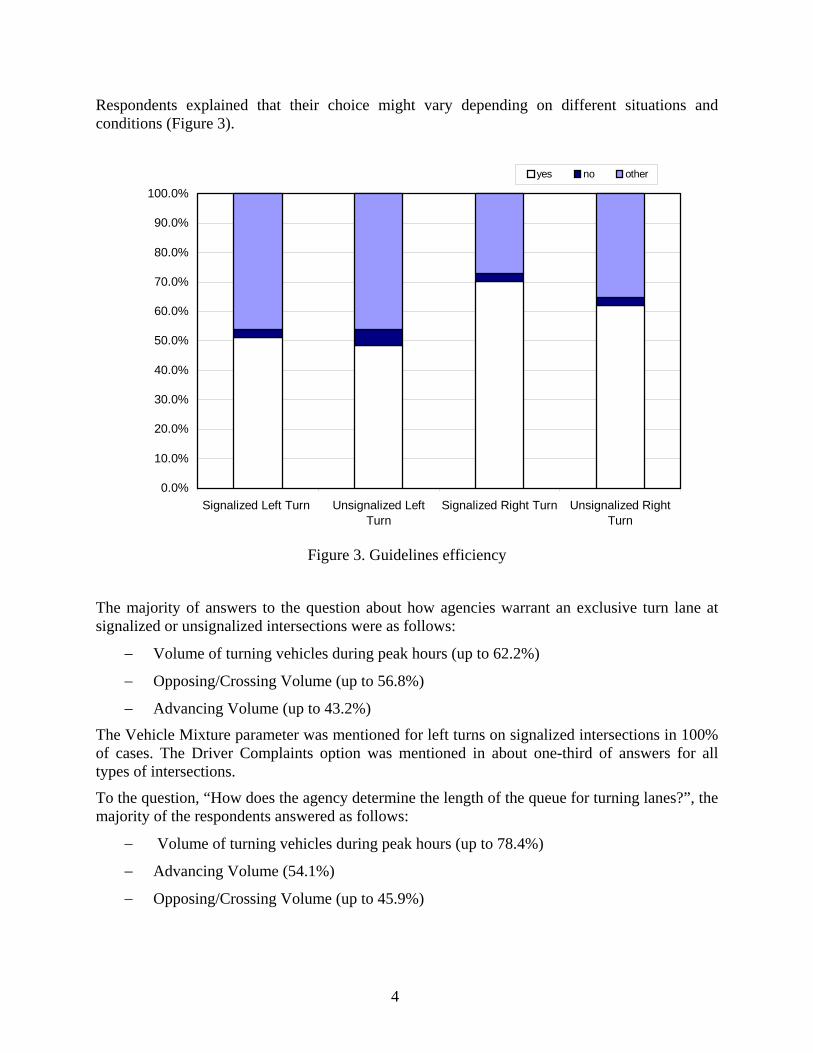
To the question, “In your opinion, do the guidelines that your agency uses provide efficient turn lane lengths at all signalized intersections?”, most respondents answered “Yes” or “Other.”
4
Respondents explained that their choice might vary depending on different situations and conditions (Figure 3).
0.0%
10.0%
20.0%
30.0%
40.0%
50.0%
60.0%
70.0%
80.0%
90.0%
100.0%
Signalized Left Turn Unsignalized LeftTurn
Signalized Right Turn Unsignalized RightTurn
yes no other
Figure 3. Guidelines efficiency
The majority of answers to the question about how agencies warrant an exclusive turn lane at signalized or unsignalized intersections were as follows:
− Volume of turning vehicles during peak hours (up to 62.2%)
− Opposing/Crossing Volume (up to 56.8%)
− Advancing Volume (up to 43.2%)
The Vehicle Mixture parameter was mentioned for left turns on signalized intersections in 100% of cases. The Driver Complaints option was mentioned in about one-third of answers for all types of intersections.
To the question, “How does the agency determine the length of the queue for turning lanes?”, the majority of the respondents answered as follows:
− Volume of turning vehicles during peak hours (up to 78.4%)
− Advancing Volume (54.1%)
− Opposing/Crossing Volume (up to 45.9%)
5
2.2 Literature Review
The research on the evaluation of left-turn lanes at unsignalized grade intersections on four-lane and two-lane highways that is well known among traffic designers is Harmelink’s work (1967). He based his derivations on a queuing model with negative exponential distribution for arrival and service rates. He presented his results in the form of graphs with the following variables: advancing volume, opposing volume, speed, and left-turn percentage. The range of speed is of 40, 50, and 60 mph, and left-turn volumes are 5, 10, 15, 20, 30, and 40 percent. The AASHTO’s Green Book contains a table determining the need for a left-turn lane on two-lane highways based on the values from the Harmelink’s graphs (Table 3).
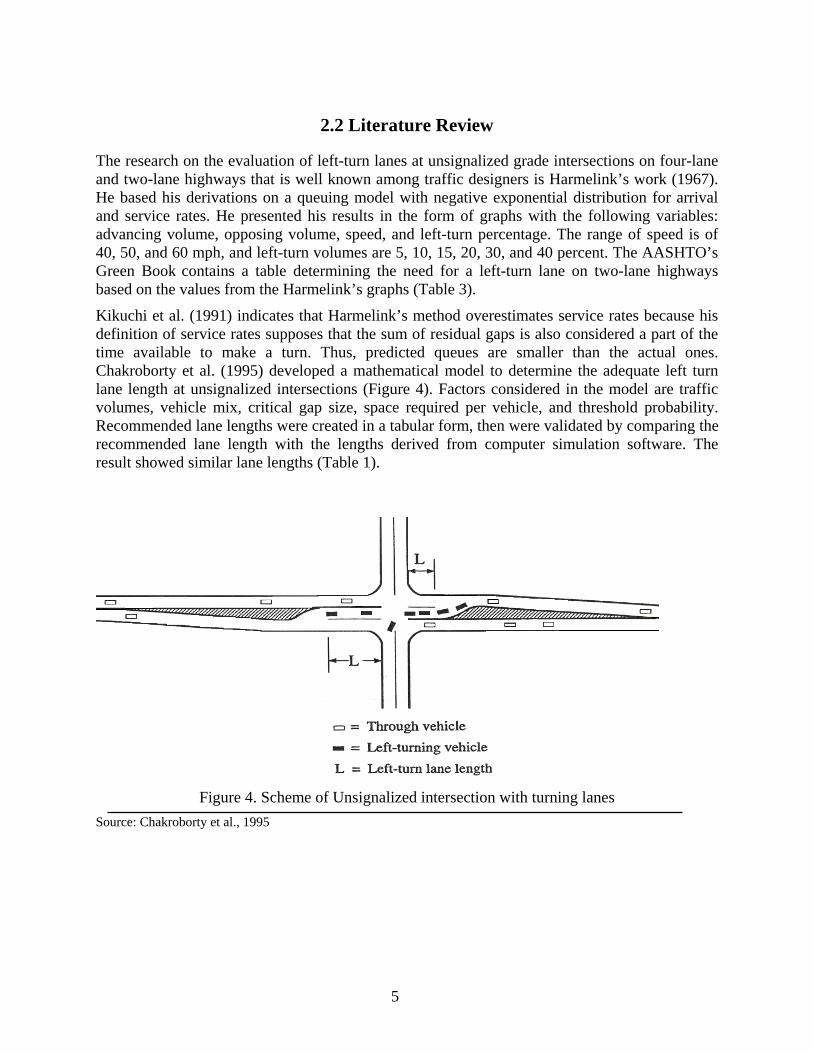
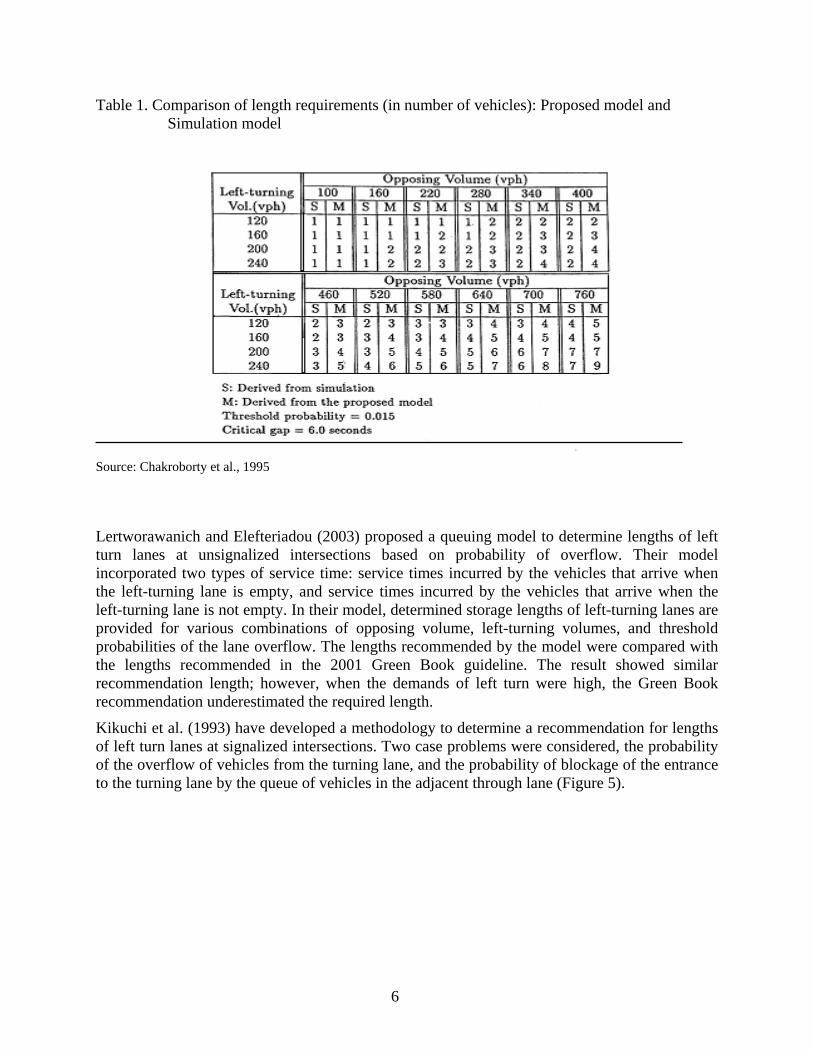
Kikuchi et al. (1991) indicates that Harmelink’s method overestimates service rates because his definition of service rates supposes that the sum of residual gaps is also considered a part of the time available to make a turn. Thus, predicted queues are smaller than the actual ones. Chakroborty et al. (1995) developed a mathematical model to determine the adequate left turn lane length at unsignalized intersections (Figure 4). Factors considered in the model are traffic volumes, vehicle mix, critical gap size, space required per vehicle, and threshold probability. Recommended lane lengths were created in a tabular form, then were validated by comparing the recommended lane length with the lengths derived from computer simulation software. The result showed similar lane lengths (Table 1).
Figure 4. Scheme of Unsignalized intersection with turning lanes
Source: Chakroborty et al., 1995
6
Table 1. Comparison of length requirements (in number of vehicles): Proposed model and Simulation model
Source: Chakroborty et al., 1995
Lertworawanich and Elefteriadou (2003) proposed a queuing model to determine lengths of left turn lanes at unsignalized intersections based on probability of overflow. Their model incorporated two types of service time: service times incurred by the vehicles that arrive when the left-turning lane is empty, and service times incurred by the vehicles that arrive when the left-turning lane is not empty. In their model, determined storage lengths of left-turning lanes are provided for various combinations of opposing volume, left-turning volumes, and threshold probabilities of the lane overflow. The lengths recommended by the model were compared with the lengths recommended in the 2001 Green Book guideline. The result showed similar recommendation length; however, when the demands of left turn were high, the Green Book recommendation underestimated the required length.
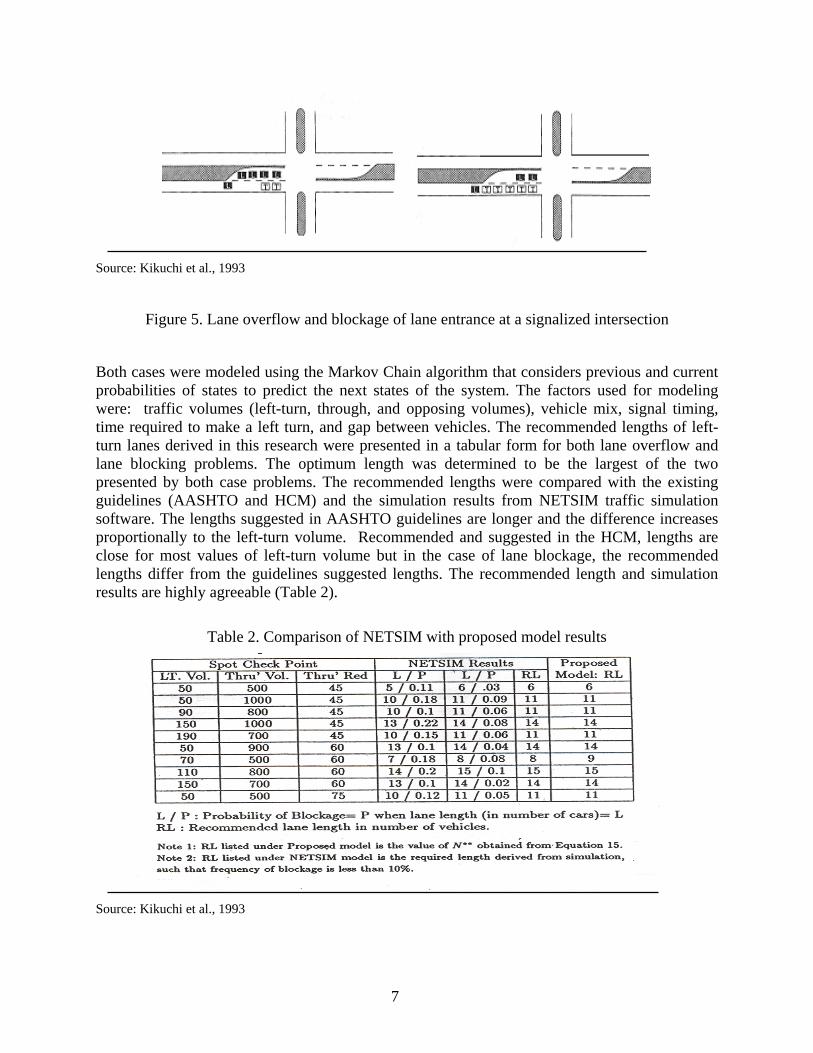
Kikuchi et al. (1993) have developed a methodology to determine a recommendation for lengths of left turn lanes at signalized intersections. Two case problems were considered, the probability of the overflow of vehicles from the turning lane, and the probability of blockage of the entrance to the turning lane by the queue of vehicles in the adjacent through lane (Figure 5).
7
Source: Kikuchi et al., 1993
Figure 5. Lane overflow and blockage of lane entrance at a signalized intersection
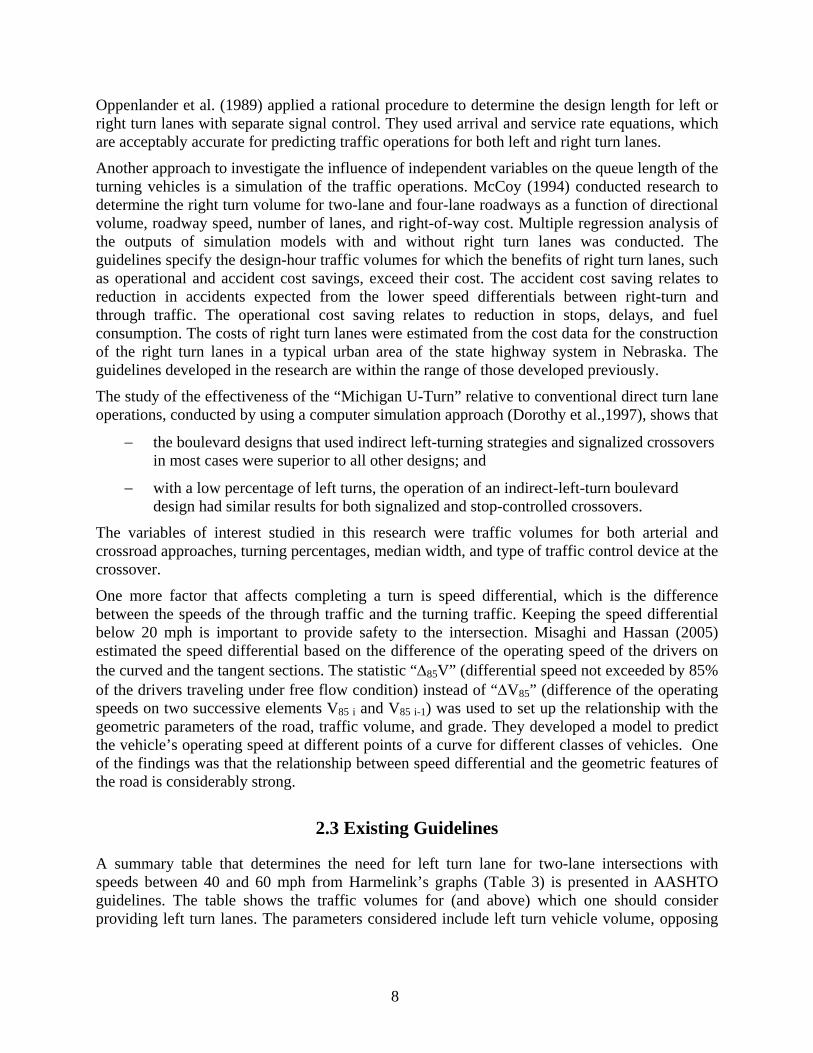
Both cases were modeled using the Markov Chain algorithm that considers previous and current probabilities of states to predict the next states of the system. The factors used for modeling were: traffic volumes (left-turn, through, and opposing volumes), vehicle mix, signal timing, time required to make a left turn, and gap between vehicles. The recommended lengths of left-turn lanes derived in this research were presented in a tabular form for both lane overflow and lane blocking problems. The optimum length was determined to be the largest of the two presented by both case problems. The recommended lengths were compared with the existing guidelines (AASHTO and HCM) and the simulation results from NETSIM traffic simulation software. The lengths suggested in AASHTO guidelines are longer and the difference increases proportionally to the left-turn volume. Recommended and suggested in the HCM, lengths are close for most values of left-turn volume but in the case of lane blockage, the recommended lengths differ from the guidelines suggested lengths. The recommended length and simulation results are highly agreeable (Table 2).
Table 2. Comparison of NETSIM with proposed model results
Source: Kikuchi et al., 1993
8
Oppenlander et al. (1989) applied a rational procedure to determine the design length for left or right turn lanes with separate signal control. They used arrival and service rate equations, which are acceptably accurate for predicting traffic operations for both left and right turn lanes.
Another approach to investigate the influence of independent variables on the queue length of the turning vehicles is a simulation of the traffic operations. McCoy (1994) conducted research to determine the right turn volume for two-lane and four-lane roadways as a function of directional volume, roadway speed, number of lanes, and right-of-way cost. Multiple regression analysis of the outputs of simulation models with and without right turn lanes was conducted. The guidelines specify the design-hour traffic volumes for which the benefits of right turn lanes, such as operational and accident cost savings, exceed their cost. The accident cost saving relates to reduction in accidents expected from the lower speed differentials between right-turn and through traffic. The operational cost saving relates to reduction in stops, delays, and fuel consumption. The costs of right turn lanes were estimated from the cost data for the construction of the right turn lanes in a typical urban area of the state highway system in Nebraska. The guidelines developed in the research are within the range of those developed previously.
The study of the effectiveness of the “Michigan U-Turn” relative to conventional direct turn lane operations, conducted by using a computer simulation approach (Dorothy et al.,1997), shows that
− the boulevard designs that used indirect left-turning strategies and signalized crossovers in most cases were superior to all other designs; and
− with a low percentage of left turns, the operation of an indirect-left-turn boulevard design had similar results for both signalized and stop-controlled crossovers.
The variables of interest studied in this research were traffic volumes for both arterial and crossroad approaches, turning percentages, median width, and type of traffic control device at the crossover.
One more factor that affects completing a turn is speed differential, which is the difference between the speeds of the through traffic and the turning traffic. Keeping the speed differential below 20 mph is important to provide safety to the intersection. Misaghi and Hassan (2005) estimated the speed differential based on the difference of the operating speed of the drivers on the curved and the tangent sections. The statistic “Δ85V” (differential speed not exceeded by 85% of the drivers traveling under free flow condition) instead of “ΔV85” (difference of the operating speeds on two successive elements V85 i and V85 i-1) was used to set up the relationship with the geometric parameters of the road, traffic volume, and grade. They developed a model to predict the vehicle’s operating speed at different points of a curve for different classes of vehicles. One of the findings was that the relationship between speed differential and the geometric features of the road is considerably strong.
2.3 Existing Guidelines
A summary table that determines the need for left turn lane for two-lane intersections with speeds between 40 and 60 mph from Harmelink’s graphs (Table 3) is presented in AASHTO guidelines. The table shows the traffic volumes for (and above) which one should consider providing left turn lanes. The parameters considered include left turn vehicle volume, opposing
9
vehicle volume, vehicle mix, and average time to make a turn. Some general guidelines for using protected left turning movements in the Highway Capacity Manual (1997) are as follows:
− Left turn protection is rarely used for left turn volumes of less than 100 vph.
− Left turn protection is almost always used for left turn volumes greater than 250-300 vph.
− Where left turn volumes exceed 300 vph, provision of a double left turn lane should be considered.
− For arrival rates between these values, the analysts must consider opposing volumes, number of lanes, accident experience, and other related factors.
− Any approaches having a protected left turn phase must have exclusive left turn lane or bay with sufficient length to accommodate the expected queues during each signal cycle.
Table 3. Guide for left-turn lanes on two-lane highways Opposing Volume
The standard practice in many design offices is to make the left turn lane equivalent in length as 1.5 to 2 times the average number of arriving turning vehicles per cycle would be. Figure 6 shows the relationship between left turn volume in passenger car equivalents and the required length of the storage bay (Highway Capacity Manual, 1994, updated in 1997).
10
Source: Highway Capacity Manual, 1994. Updated December 1997
Figure 6. Left turn bay storage requirements as a function of left turn volume
Table 4 presents a comparison of guidelines from the following sources: the AASHTO Green Book, the Highway Capacity Manual, and the Road Design Manual. Traffic Engineering Handbook suggests the design of left and right turn lanes based on operational needs, as follows:
− Lanes should be long enough to enable a driver to decelerate outside the higher speed lanes at rural intersections.
− Lanes should be of sufficient length to store vehicles queued in the turn-lane at urban signalized intersections.
11
Table 4. Summary table of some existing guidelines
Deceleration Length
(ft)
Storage Length Source
Design Speed (mph)
Deceleration Length
Signalized Unsignalized
Taper Length
30 40 45 50 55
170* 275* 340* 410* 485* * for grades less than 3 percent
AASHTO 2004
A 10 mph speed differential* is commonly acceptable on arterial roads. Higher speed differentials may be acceptable on collector highways and streets.
Length = 2 or 1.5 x average number of vehicles that would store per cycle. Minimum Length = 2 passenger cars
Length = average number of vehicles 2 min interval. Minimum length = 2 cars, with max 10% heavy vehicles. Minimum length = car and truck, with min 10% heavy vehicles.
1:15 for design speed 50 mph, 1:8 for design speed up to 30 mph OR L = S2xW/60, where S - design speed less than 40mph, W - offset L = S x W, where S - design speed greater than 45 mph, W – offset (AASHTO, 1990)**
See AASHTO recommendations
Taper is a part of deceleration lane, but not always. See Table 5-3.01A in Road Design Manual.
Additional length should be provided on downgrades. See Table 2-5.09B in Road Design Manual.
A divergence angle between 2 and 5 degrees is acceptable. 1:15 - with 3.8 degree angle, 1:5 – when a turn lane on curve or when greater storage length is needed.
Road Design Manual, June 2000.
Typical length for a turn lane is 90 m (300′) of full width (3.6 m + 0.6 m (14′) where curb or gutter are presented) + additional 54 m (180′) taper section (1:15 from 3.6 m (12′)) + additional length for downgrades.
HCM Exclusive left-turn lane should be provided for fully protected left-turn phasing Single exclusive left-turn lane – min Turn Volume = 100 veh/hour Double exclusive left-turn Lane – min Turn Volume = 300 veh/hour Exclusive right-turn lane – min Turn Volume = 300 veh/hour
* Speed Differential is the difference between the speeds of the through traffic and turning traffic ** This method of taper length estimation is mentioned in other manuals and handbooks as well and is still in use
12
The desirable length of storage should be enough to accommodate twice the average arrival rate of turning traffic during the red cycle. The storage length requirement for left turn lanes is based on peak 15-min flow rates. The following formulas are based on the probability of event occurrence and are offered in Traffic Engineering Handbook (1999) to estimate the length of storage bay for a left-turn lane (the length of a typical passenger car is considered to be 25 ft):
L = V*K*25*(1+p) / Nc
where L – storage length, in feet,
V – peak 15-min flow rate, in vph,
K – constant to reflect random arrival of vehicles, usually 2,
Nc – number of cycles per hour, and
P – percentage of trucks and buses.
For evaluation of right-turn lanes, the formula is
L = (1-G/C)*Volume*(1+p)*K*25 / Nc*n
where
L – storage length, in feet,
G – green time,
C – cycle length,
K – random arrival for vehicles equals 2 when right-turn-on-red is not permitted and 1.5 when right-turn-on-red is allowed,
n – number of traffic lanes,
V – peak 15-min flow rate, in vph,
K – constant to reflect random arrival of vehicles, usually 2,
Nc – number of cycles per hour, and
P – percentage of trucks and buses.
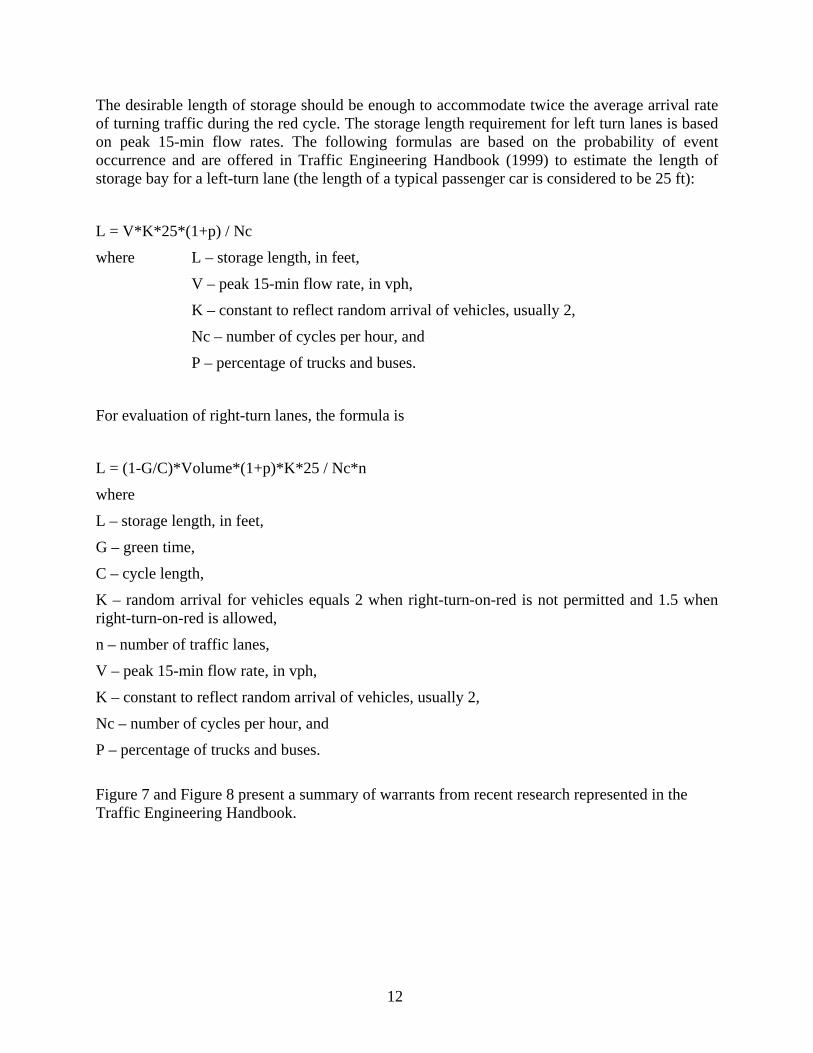
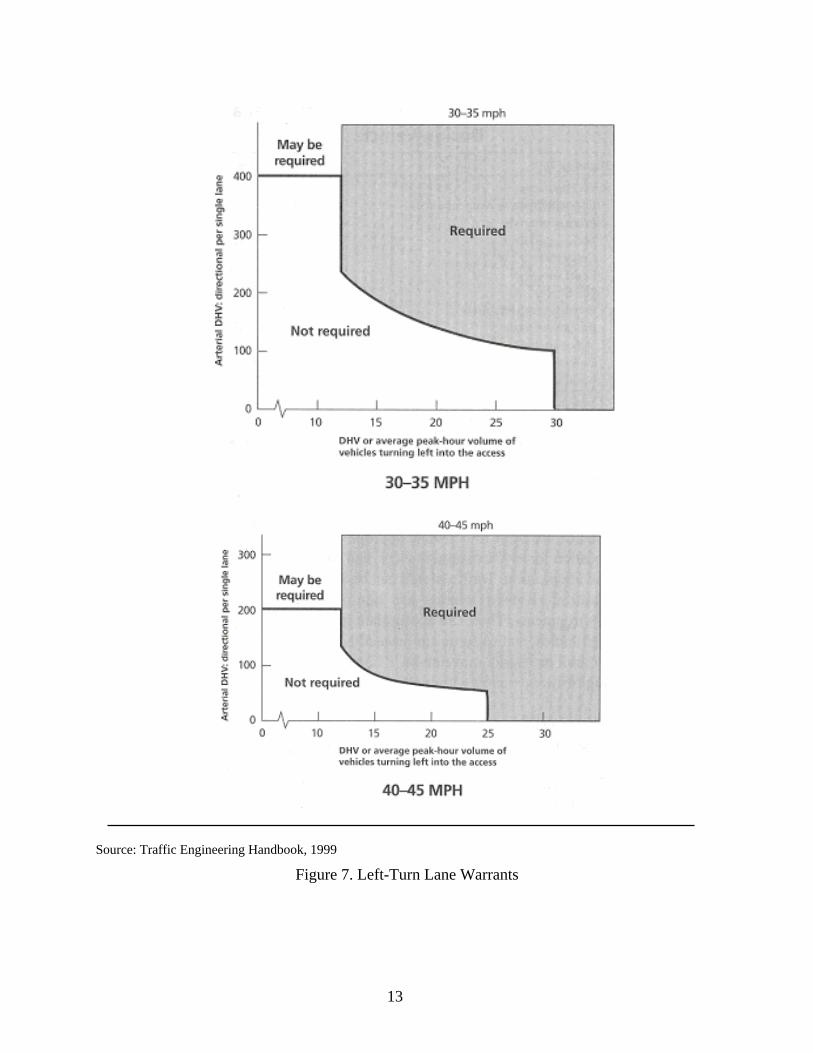
Figure 7 and Figure 8 present a summary of warrants from recent research represented in the Traffic Engineering Handbook.
13
Source: Traffic Engineering Handbook, 1999
Figure 7. Left-Turn Lane Warrants
14
Source: Traffic Engineering Handbook, 1999
Figure 8. Right-Turn Lane Warrants
15
3. DEVELOPMENT OF CALIBRATED SIMULATION MODELS
3.1 Selection and Documentation of Intersections
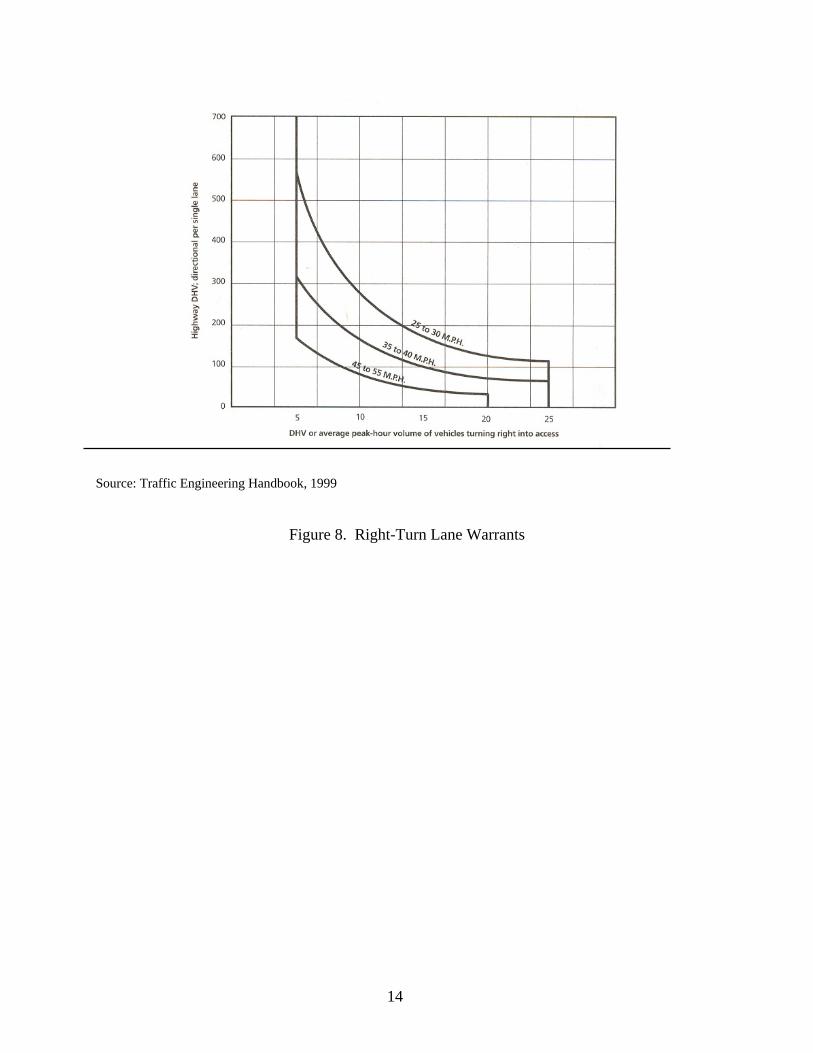
A total of ten intersections from the several evaluated intersections were selected and designated with the help of the MN DOT project panel (see Figure 9). The intersections were initially grouped by location to expedite data collection and minimize travel time.
Figure 9. Overall map of area
16
Two types of intersections were chosen for the study: Signalized (7 intersections) and Unsignalized (3 intersections). The main characteristics of the intersections are as follows:
− The majority have channelization (island design).
− A few have grades that were observed on the field study but were not documented in the construction drawings provided by MN DOT.
− Signalized intersections are actuated-uncoordinated with non-constant cycle length.
− Signalized approaches have permitted and/or protected phases for left turns and permitted and free phases for right turns.
The main characteristics of the intersections are presented in
Table 5. The intersections were documented by using existing construction drawings and signal and timing plans provided by MN DOT, and video recording data and photographs taken during the field survey. Geometry data of the intersections such as lane width, number of lanes, existing storage length, and detector location were obtained from construction plans and videotapes. Geometrical models of the intersection were built (Appendix C). Signal and timing plans provided information about cycle length, turn type, maximum and minimum splits, etc. The following list represents the geometric design and traffic control variables:
− Number of through lanes
− Number of turn lanes
− With or without channelization for right turn
− Approach grades
− Through and turn lane widths
− Total turn lane length (taper, deceleration, and storage length)
− Type of traffic control
− Type of turn phasing (if signalized)
− Warning signs
− Posted speed
− Turning speed (a speed inside the intersection; default is 15 mph for left turns and 9 mph for right turns)
− Detector location
17
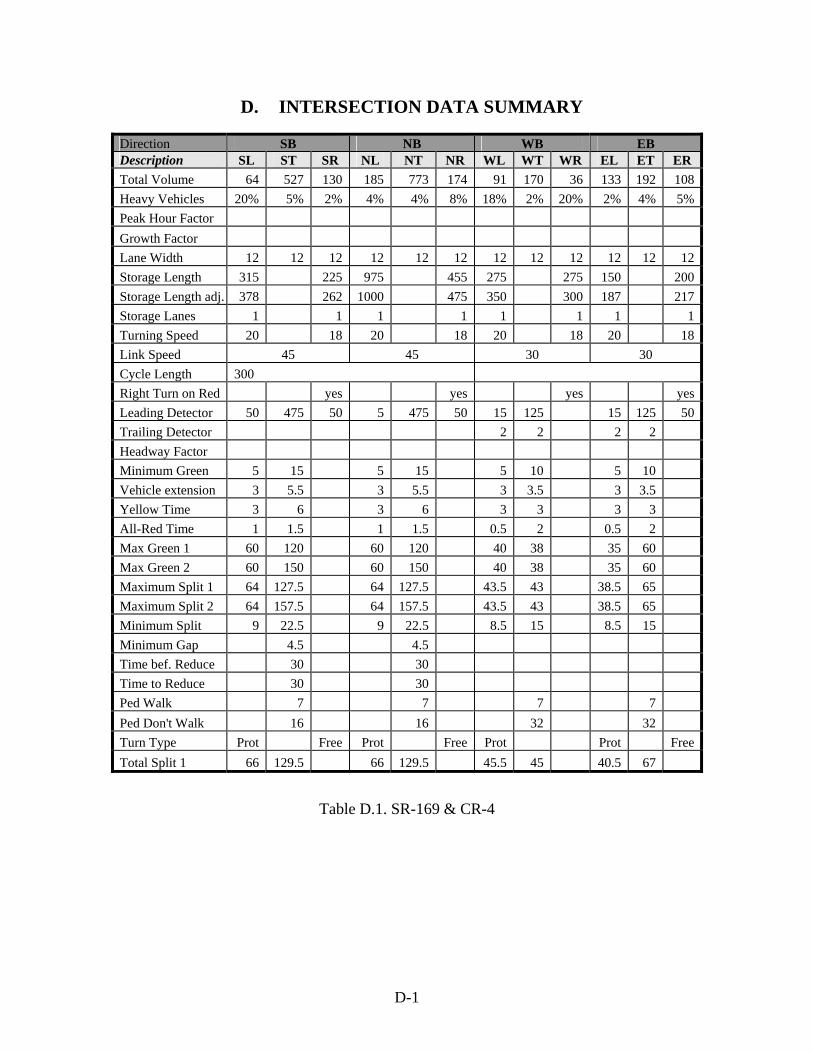
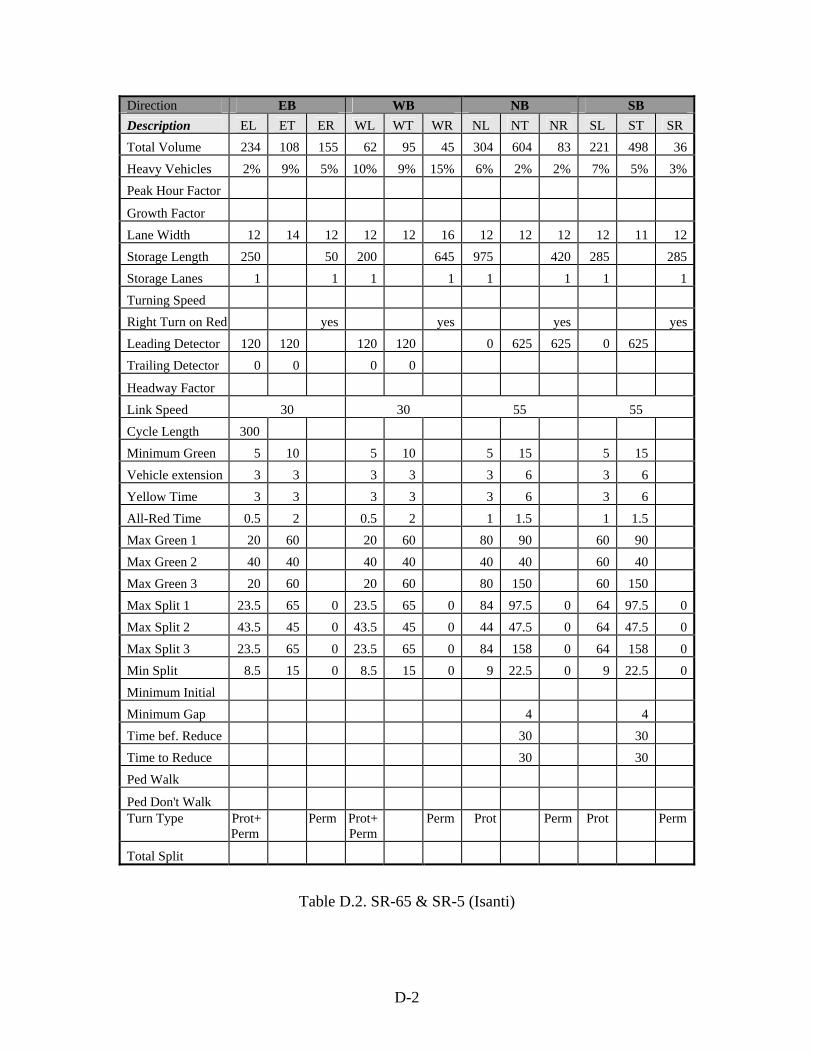
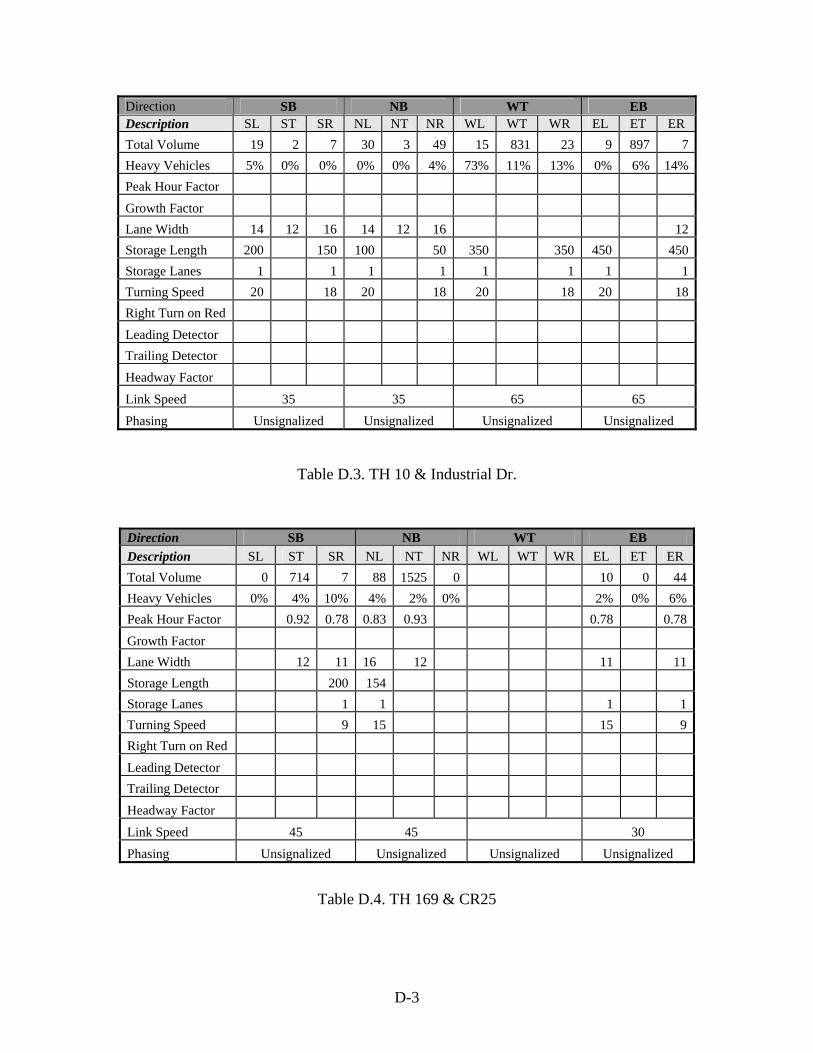
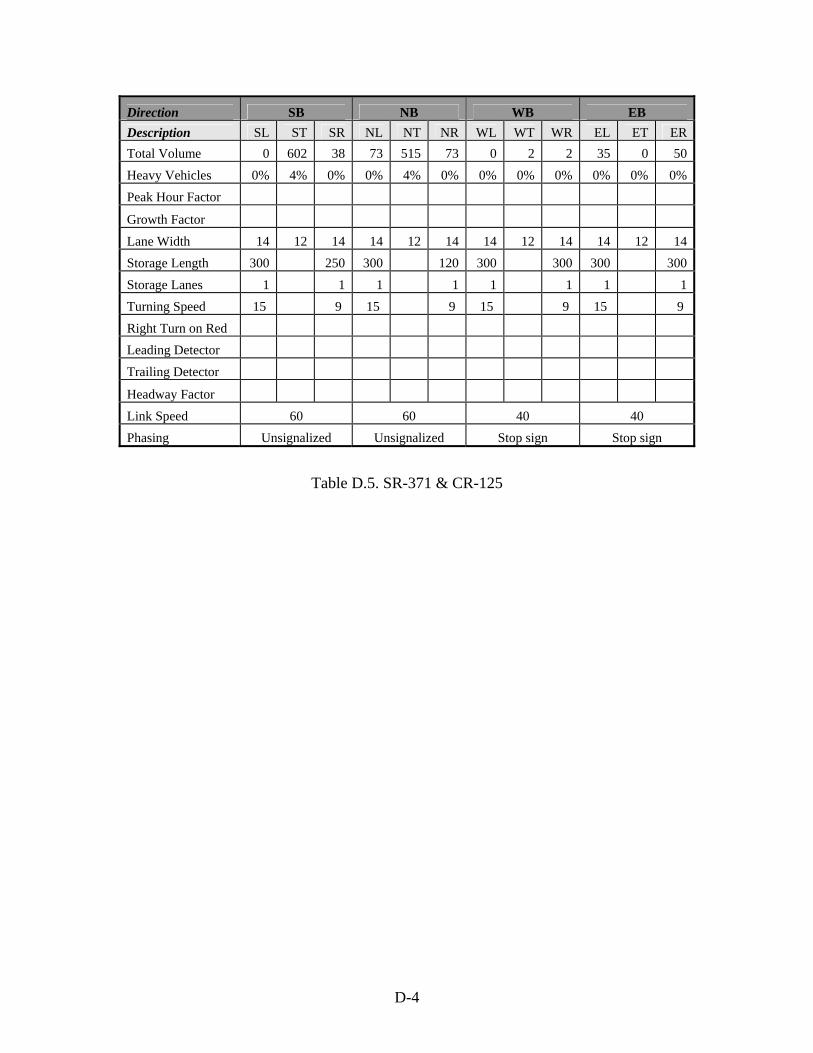
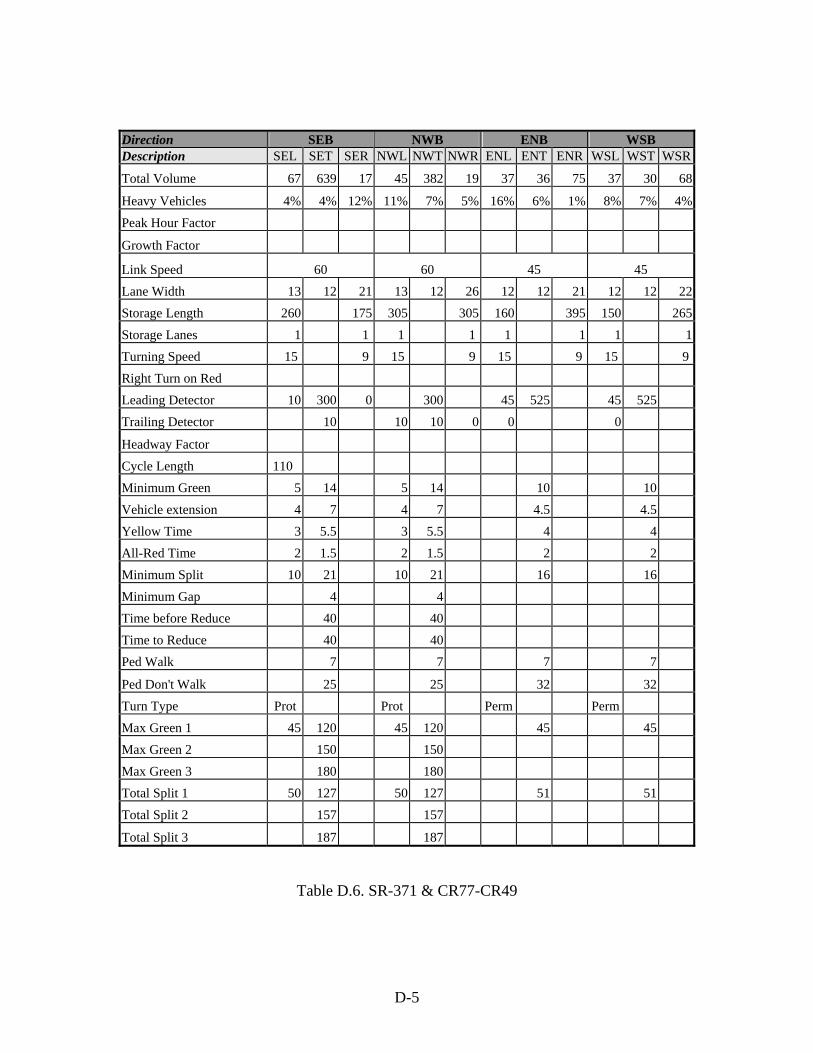
Table 5. Intersection descriptions from the field study
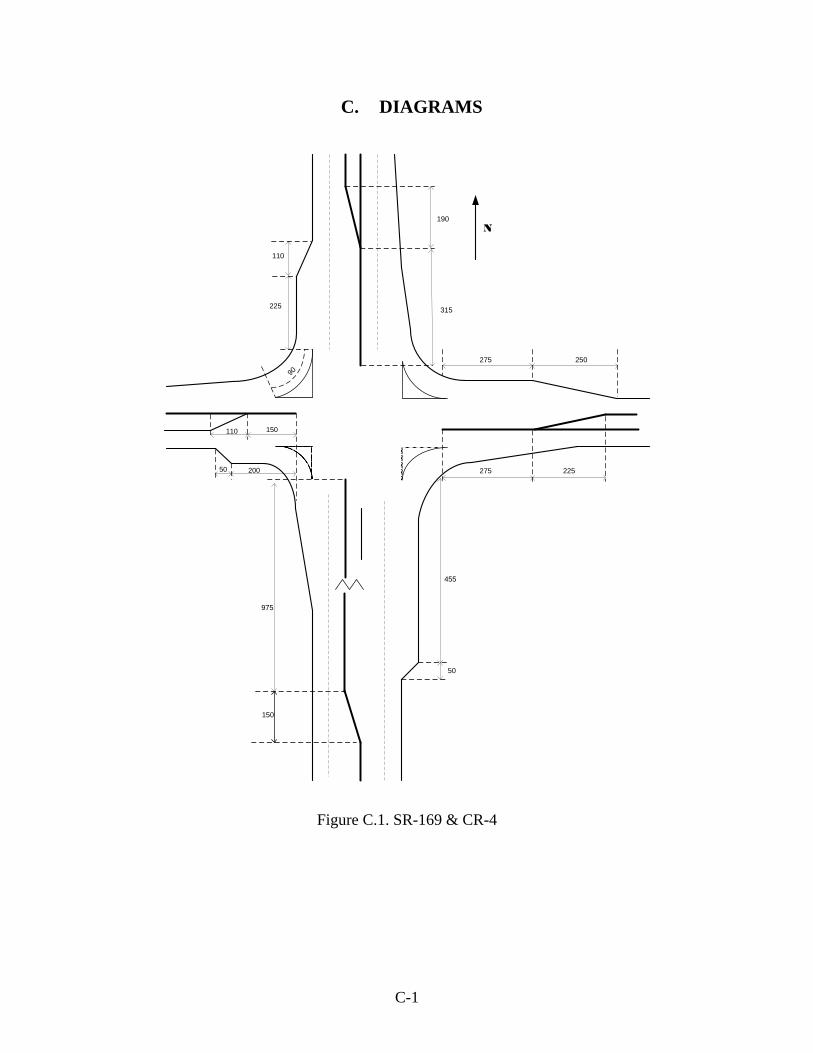
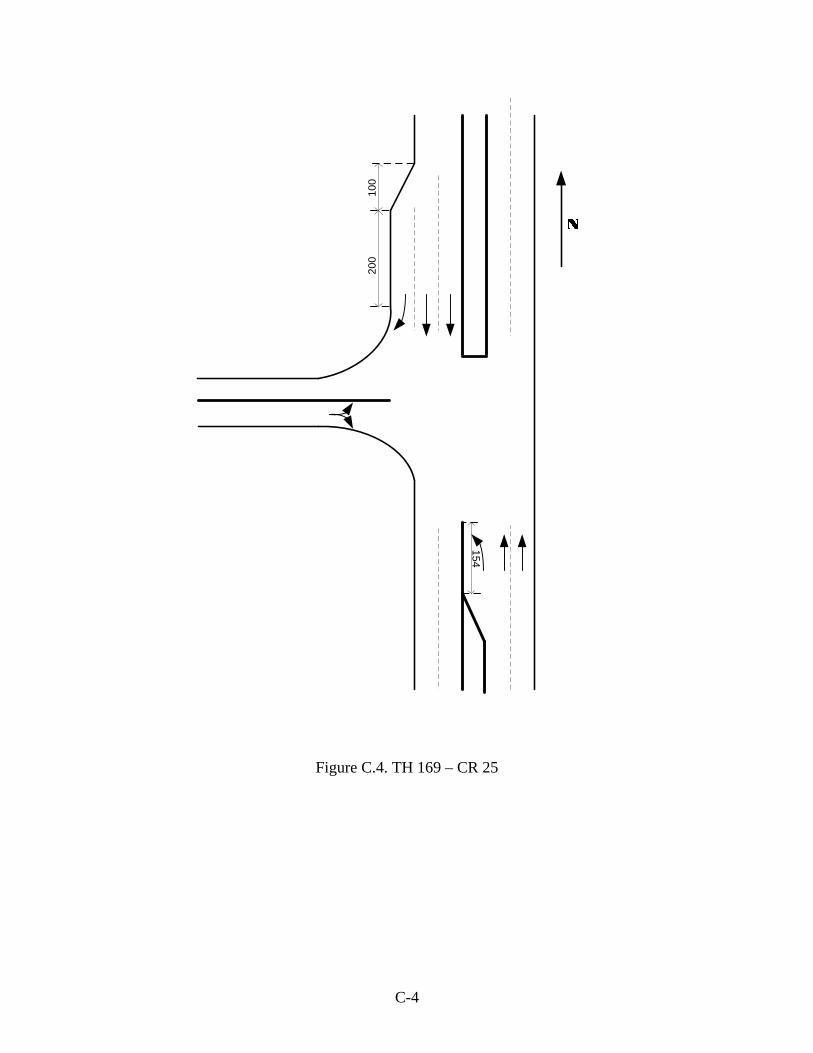
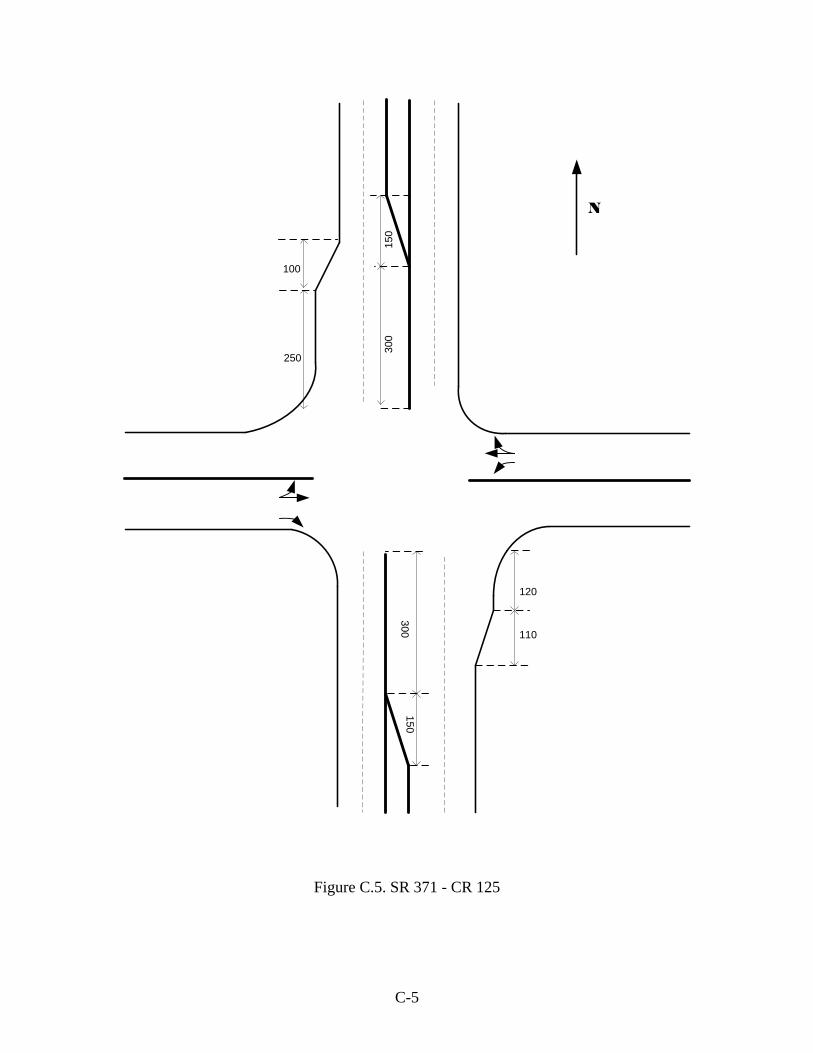
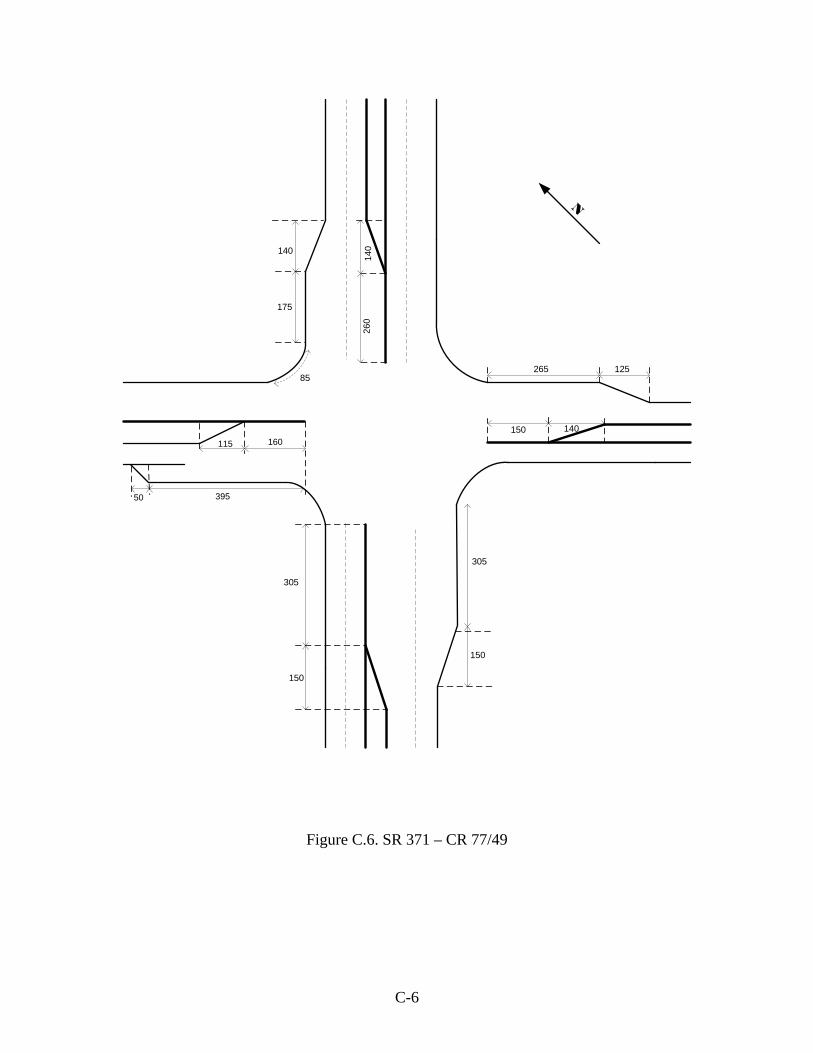
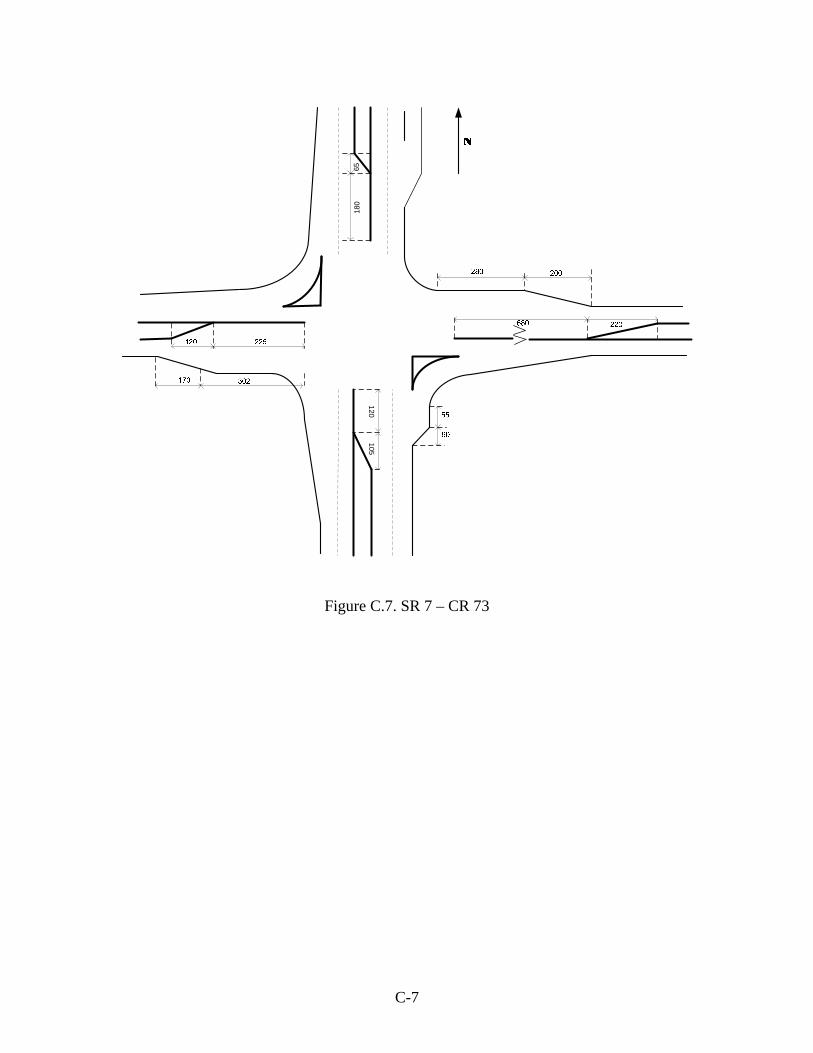
Intersection Name Lat/Lon Signal Type Description North of St. Paul SR-169 & CR-4 N452637.2
W933505.3 Signalized 4 free rights with channelization
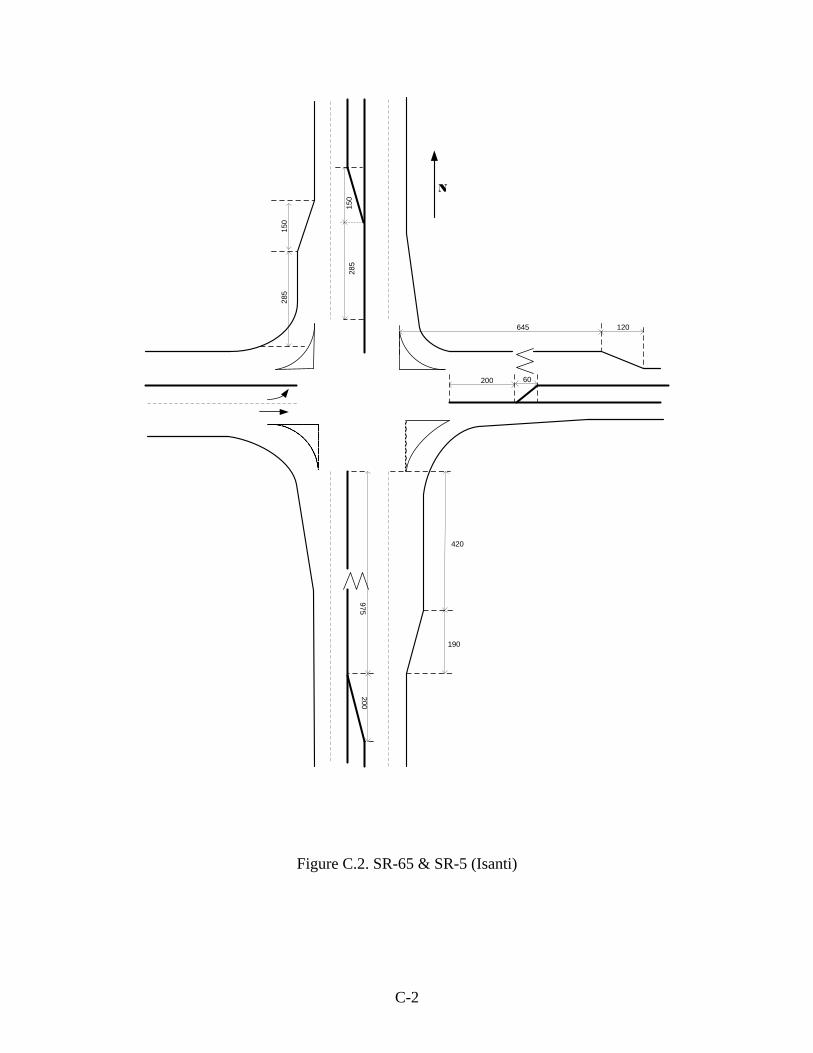
SR-65 & SR-5 (Isanti) N452934.0 W931414.8 Signalized 4 free rights with channelization
TH 10 at Big Lake Industrial Park
N455559.5 W934307.6 Unsignalized 4 free rights with channelization
TH 169 & CR25 N452440.6 W933359.5 Unsignalized 4 lane with right turn lanes into side
roads Near Brainard/Baxter SR-371 & CR-125 N462308.1
W941710.4 Unsignalized 4 lane with right turn lanes into side roads, short turn lanes
SR-371 & CR77-CR49 N463000.7 W941752.1 Signalized Rural intersection of two highways
St. Paul Metro Area SR-7 & CR-73 N445559.5
W932517.1 Signalized 2 islands with some grade on a turn lane
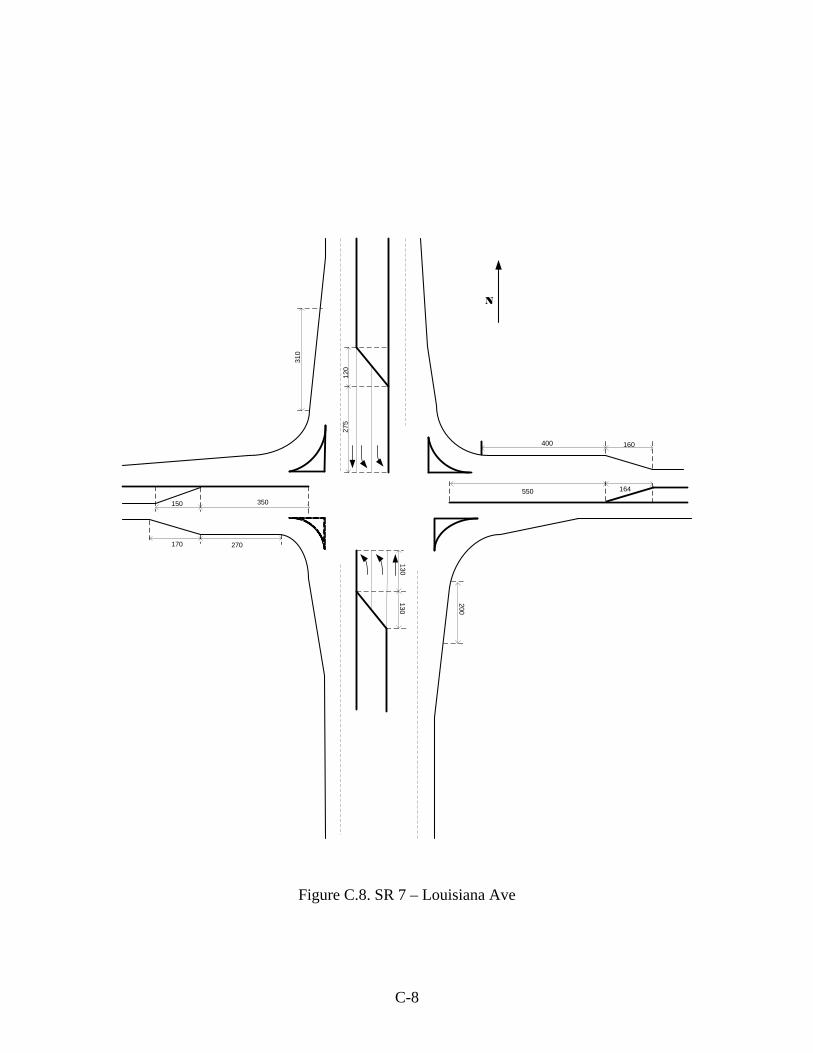
SR-7 & Louisiana Ave N445617.2 W932212.3 Signalized 4 free rights with channelization
and some grade
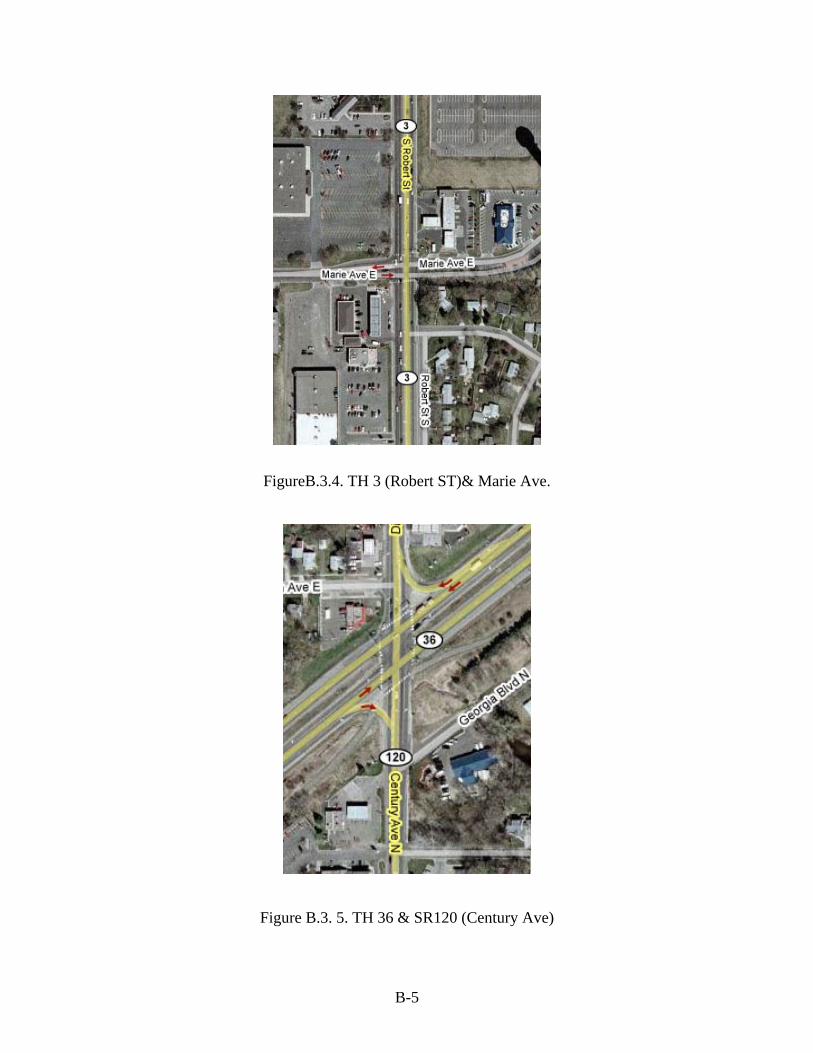
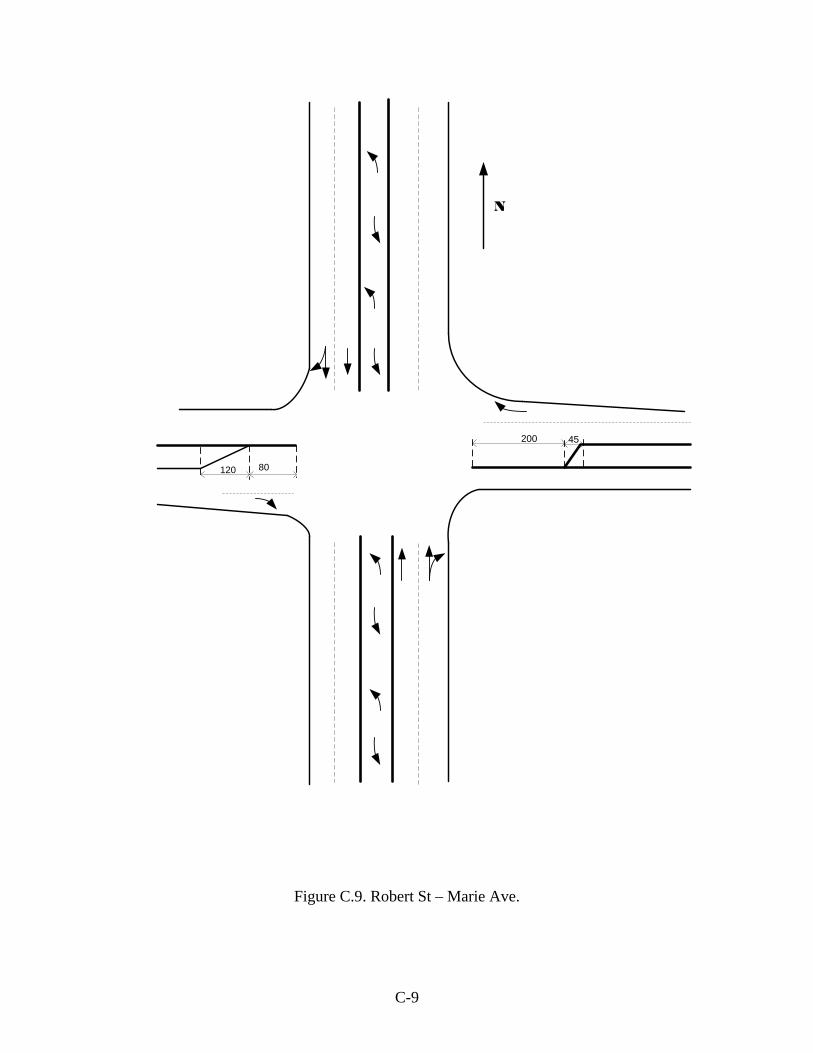
TH 3 (Robert ST) & Marie Ave N445328.0 W930447.2 Signalized Short left turn lane
Traffic characteristics of each intersection were identified from the videotapes and include:
− Volume of approach
− Volume of turning traffic
− Heavy vehicle mixture
− Queue length in two-minute intervals
All geometric design, traffic characteristics, and control data were collected for each study intersection and were tabulated for each individual intersection approach (Appendix D).
3.2 Queue Length Observation in Field
The major data sources for this research included traffic data obtained by means of an Automatic Traffic Recording (ATR) station, road geometry data from construction drawings, and photographs and video taken during the field survey during the visit to each intersection site. The major apparatus components of field data collection included:
− a trailer with a video mast and video recording equipment;
18
− measuring wheels and equipment to collect dimensional information not apparent in the drawings or not available;
− a LIDAR gun to collect speed information: the traffic turn speeds as well as average traffic speeds; and
− basic photographic equipment to have an overview of the intersection layout and placement of equipment.
To capture traffic data such as volumes, queue lengths, heavy traffic mixture, and headways, the station with video recording equipment was used. The video recording trailer was situated at an unobtrusive location at the selected intersections. The location was optimized to give views of the intersection so it would be possible to evaluate turn lanes, queue lengths, overall volumes, etc. The trailer was equipped with four cameras on remote pan tilt mounts that allowed orientating cameras and recording video of the different traveling directions of the intersection.
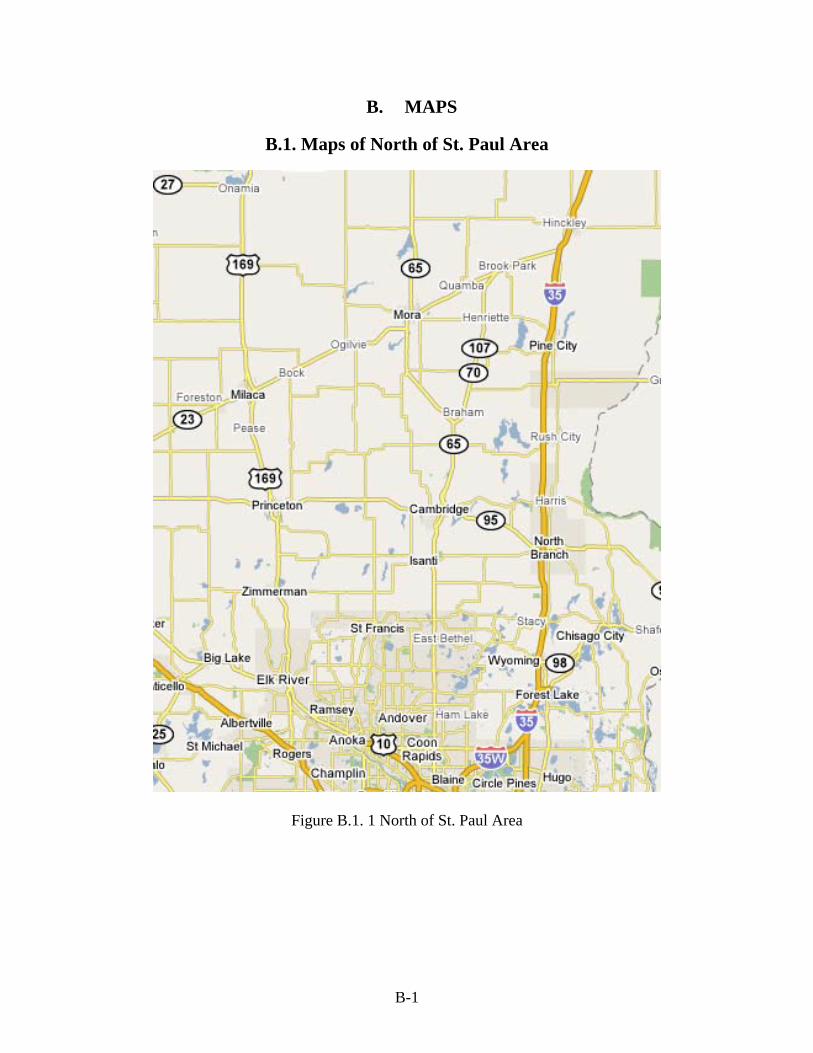
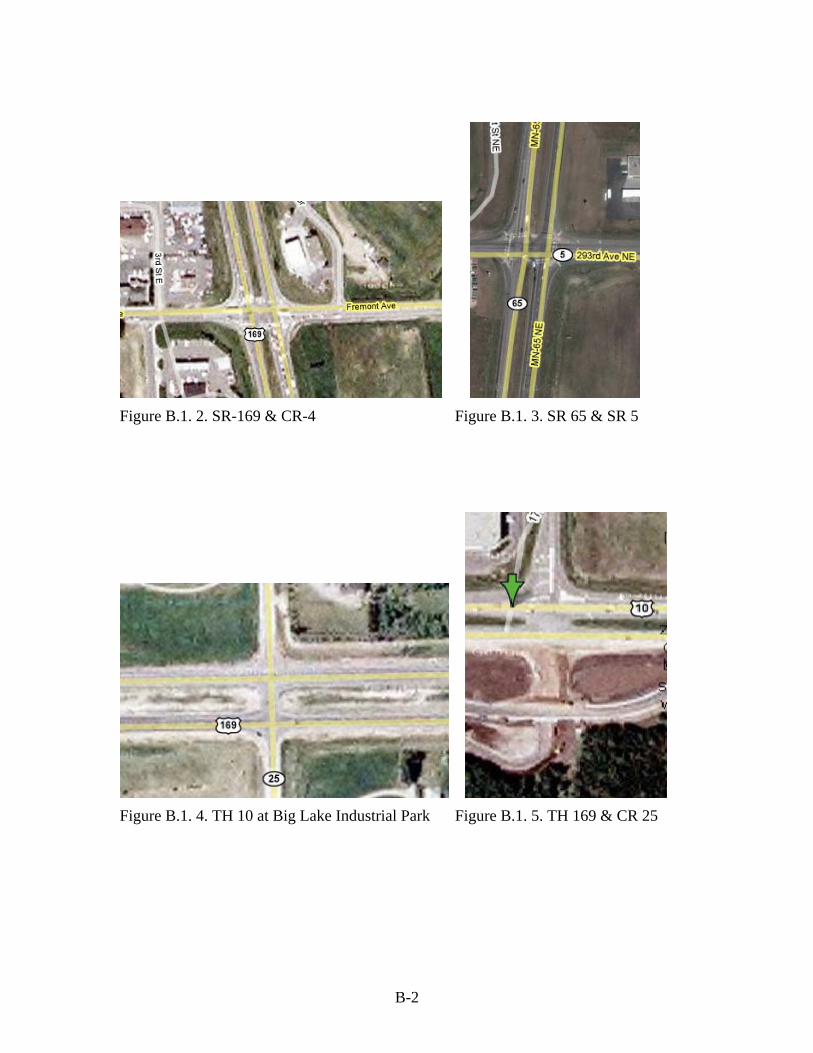
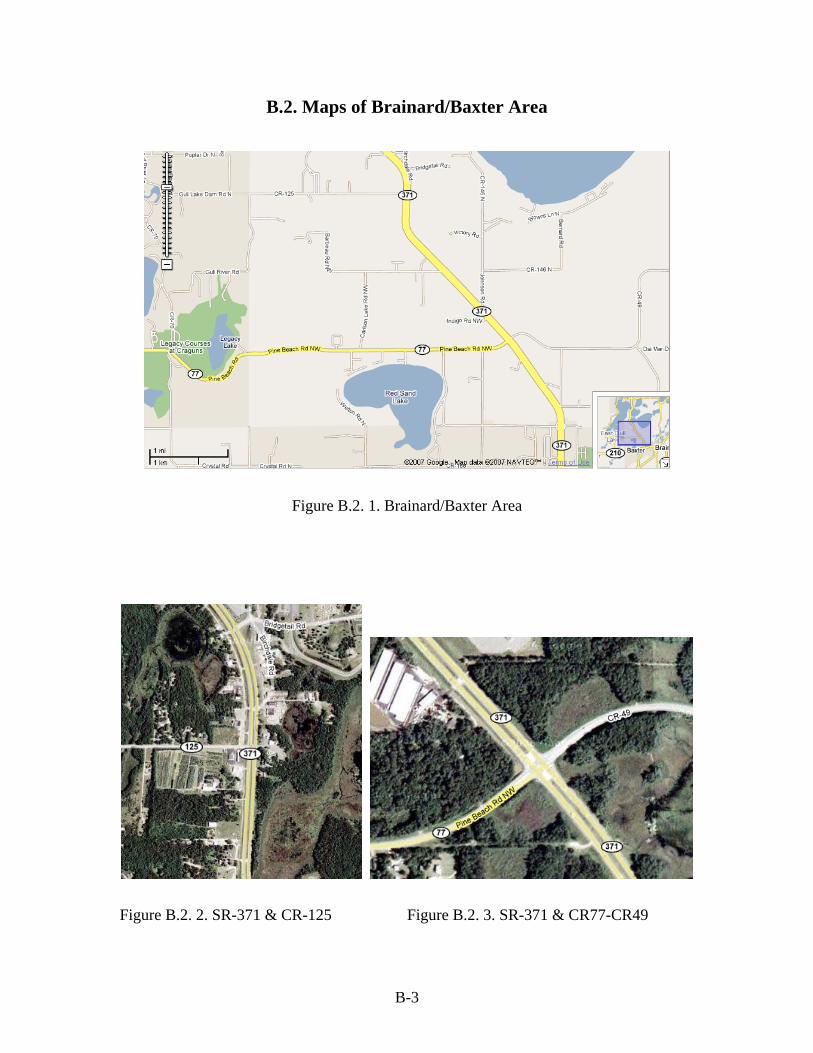
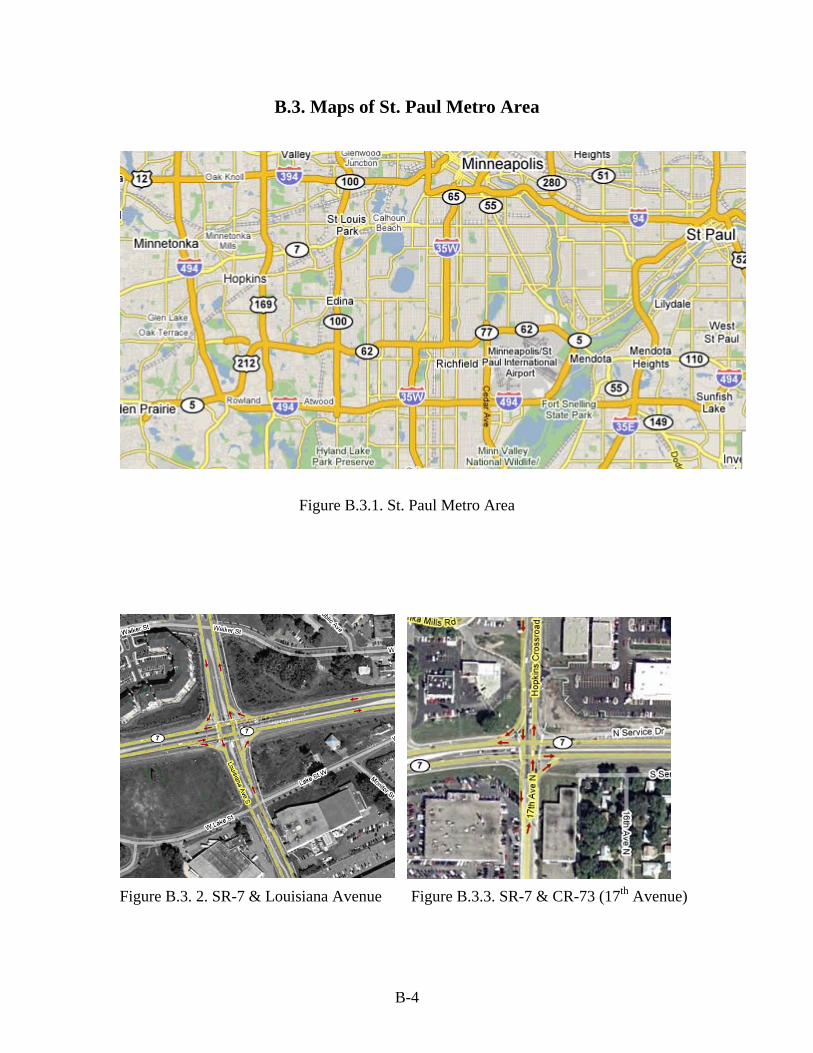
Video recordings of all intersections initially were broken into three field missions. The first recording of the intersection in the north of the St. Paul metro area (Appendix B.1, Figure B.1.1) was done in the first week of November 2005. At the first four intersections (Appendix B.1, Figures B.1.2-B.1.5), 8 hours of video at each were collected. Analyzing the obtained data, we concluded that we got more information than was needed. For our research, we needed only one hour of peak time traffic information. To save time and travel costs on the follow-up trips, we decided to collect a minimum of one hour during peak daytime conditions. Additional data would be collected as needed. Thus, the traffic was recorded at the rest of the intersections during the daytime peak hours for the next batches of intersections in the Brainard/Baxter area (Appendix B.2) and St. Paul metro area (Appendix B.3). The video recordings of intersections in the abovementioned areas were done in the second week of April 2006 (Appendix B, Figures B.2.1-B.2.3 and B.3.1- B.3.5).
Extraction of traffic data during a one-hour run such as through volume and turning volumes on each approach, number of heavy vehicles on each type of lane (through, left turn, and right turn), volume, driver behavior data such as headways, and queue lengths on turn lanes was done from the video records. Queue lengths of average, 95th percentile, and maximum in two-minute intervals during a one-hour run were calculated for each bound on left and right turns (Appendix E). Field data of ten selected intersections were collected to build, calibrate, and exercise models in simulation programs.
3.3 Analysis of Field Data
To build a simulation model of each intersection and exercise them to make a database for the regression analysis, it was reasonable to group intersections into categories (Table 6) according to the
− type of signal control;
− type of mode on signalized intersections;
− type of sign on unsignalized intersections;
19
− number of link directions;
− number of through lanes by approach;
− number of auxiliary lanes by approach.
Thus, the major groups are Signalized and Unsignalized. All signalized and unsignalized intersections have four lanes on an arterial road, are two-way, and have one auxiliary lane for each turn. The Signalized group was divided according to the type of mode or sign on the arterial road into the following subgroups (Figure 10):
for Left Turns
− Protected Left Turn
− Protected + Permitted Left Turn
for Right Turns
− Free Right Turn
− Permitted Right Turn
The Unsignalized group was divided according to the arterial road’s type of sign control into the following groups:
for Left Turns
– Yield Left Turn
for Right Turns
− Free Right Turn
− Yield Right Turn
20
Table 6. Description of intersections for categorization
Arterial Road Crossroad #
# Intersection
Turn signal type (Left/Right)
Number of lanes
Turn signal type (Left/Right)
Number of lanes
Number of approaches
UNSIGNALIZED
1
TH 10 & Industrial Park
Yield/Free
Yield/Free
4
2 TH 169 & CR25 Yield/Free
Stop
3
3 SR-371 & CR-125 Yield
Stop
4
SIGNALIZED
1 SR-169 & CR-4 Prot/Free
Prot/Free
4
2 SR-65 & SR-5 (Isanti) Prot/Free
Prot + Perm/Free
4
3 SR-371 & CR77-CR49 Prot/Perm
Perm/Perm
4
4 Robert ST & Marie Ave Prot + Perm/Perm
Prot/Perm
4
5 SR36 & SR120 Prot + Perm/Free
Prot/Perm
4
6 SR-7 & CR-73 Prot/Perm
Prot/Free
4
7 SR-7 & Louisiana Ave Prot/Free
Prot/Free
4
21
Signalized
Left Turn
Unsignalized
Left Turn
Protected Permitted Permitted Free Yield
INTERSECTION
Right Turn Right Turn
Free Yield
Figure 10. Classification chart
3.4 Simulation Model Calibration
All the data about each intersection was collected and tabulated (Appendix D). The macroscopic simulation model SYNCHRO (to govern vehicle movement) and the microscopic simulation model SimTraffic (to perform characteristics of the driver, vehicle performance, and vehicles interactions with network geometry) were chosen to build intersections and simulate traffic on them. To calibrate the simulation models for the purpose of correctly predicting the real-world traffic conditions, we adjusted the following parameters:
− heavy vehicle mixture that could affect the acceleration rate and consequently queue length;
− driver behavior parameters through headways and turning speeds;
− roadway parameters through increasing storage lane length by adding a portion of the taper, adjusting saturated flow rates, and designing acceleration lanes;
− signal timing data such as cycle length, max split, and minimum gap.
To design the channelization on the right turns, we tried two types intersection design: with and without acceleration lanes (Figure 11). The first model without acceleration lanes was a better fit for the real-world scenario of signalized intersections. By activating the “Right Turn Channelized” option in the SYNCHRO signing window for unsignalized intersections, the models performed better as well.
22
Figure 11. Channelization design on the right turns in SYNCHRO
The following features of the simulation packages should be taken into consideration when evaluating the results of the calibration outputs:
− The vehicle is considered queued when its speed is less than 7 mph. We calculated the stopped vehicles and queued behind them because we could not differentiate the speed value from the videotapes.
− SimTraffic reports the queue length based on the distance that the model run observes. We calculated the number of cars in the queue and then multiplied that number by the average car length.
− Vehicle length is considered 25 ft for passenger cars. Since average vehicle length has changed with the tendency to increase (SUVs and pickup trucks replacing some of smaller cars that were popular before), the distance of 25 ft per vehicle (average vehicle length for passenger cars, SUVs, and vans is around 15 ft) including 12 ft of inter-vehicle gap is short (Long, 2002). On the other hand, some preceding studies verify that the mentioned length is reasonable. At any rate, since SYNCRO considers this value in its calculations, we follow this rule.
− Three types of queue length are reported: average queue—average of maximum queue length in the two-minute intervals; 95th percentile queue—average queue + 1.65 standard deviations for two-minute intervals (this queue length might not be observed during an actual simulation); and maximum queue—the longest queue length observed in two-minute intervals. For calibration purposes, we compared the average queue length of the simulation model with the real-world scenario.
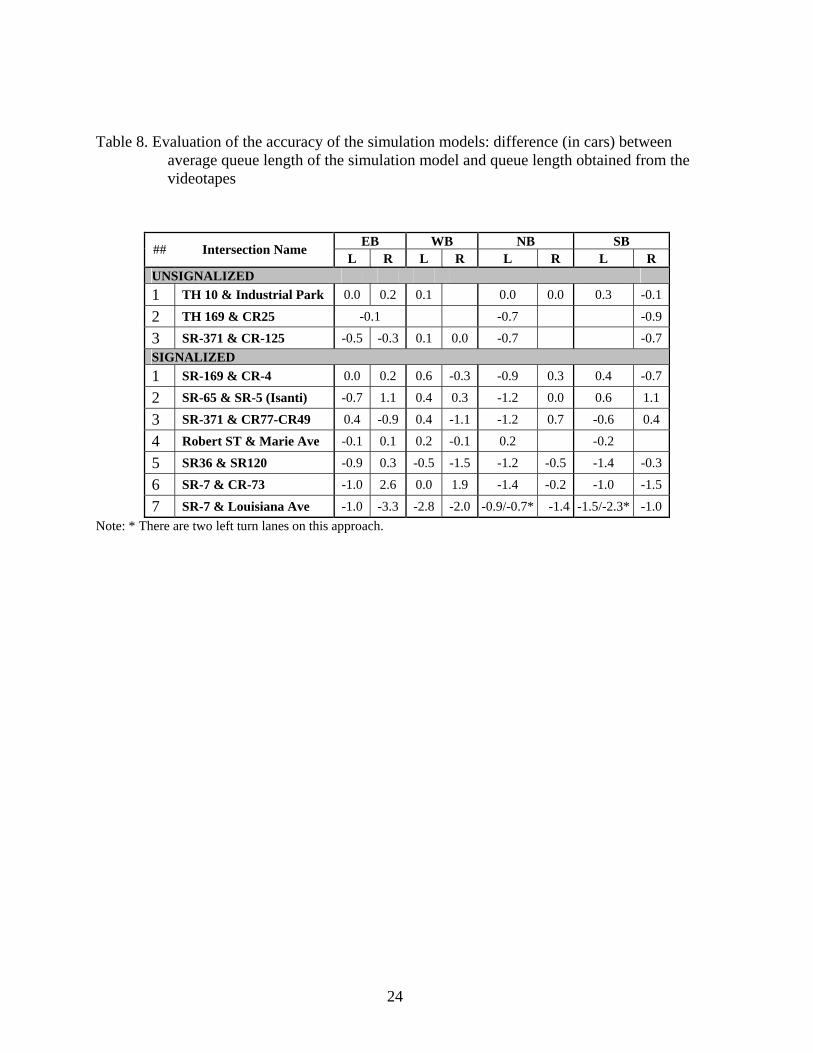
To evaluate the accuracy of the simulation models, we compared the simulation models’ average queue lengths on the turn lane with the real-world queue lengths obtained from the video (in feet) and calculated their difference expressed in percents. This evaluation was not accurate in the situations of short queue length. In those cases, even a very short difference in queue lengths between the real-world and simulation models caused significant differences, which does not
23
express real estimation. To elaborate the estimation, the difference of the turn lane queue lengths was calculated in cars as well. Table 7 shows the accuracy of our simulation model of the intersection TH 169-CR 4. The calibrated simulation model has less than one car difference with the real-world model.
All simulation models were evaluated in the same manner (Table 8). For exercising purposes, models where the difference between the average queue length of the simulation model and the real-world queue length does not exceed one car or is very close to one car (in the case of SR-65 & SR-5 (Isanti) intersection) were preferred. Thus, for exercising purposes the following intersections were chosen:
− TH 10 & Industrial Park
− TH 169 & CR25
− SR-371 & CR-125
− SR-169 & CR-4,
− SR-65 & SR-5 (Isanti),
− SR-371 & CR77-CR49
− Robert St. & Marie Ave
Table 7. Evaluation of the accuracy of the simulation model of the intersection TH 169-CR 4
EB WB NB SB Evaluation value
L R L R L R L R Difference (in %) of average queue length between simulated and real-world models
1% 26% 23% -55% -12% 49% 16% -53%
Difference (in cars) of average queue length between simulated and real-world models
0.0 0.2 0.6 -0.3 -0.9 0.3 0.4 -0.7
Standard deviation of queue length (in cars) obtained from video in 2 min intervals
2.0 0.9 1.6 0.8 3.4 0.7 1.9 1.8
Standard deviation of average queue length (in cars) for simulation model
0.4 0.3 0.4 0.2 0.6 0.3 0.3 0.1
Standard deviation of 95th percentile queue length (in cars) for simulated model
0.7 1.2 1.1 1.2 1.2 1.0 0.6 0.3
24
Table 8. Evaluation of the accuracy of the simulation models: difference (in cars) between
average queue length of the simulation model and queue length obtained from the videotapes
7 SR-7 & Louisiana Ave -1.0 -3.3 -2.8 -2.0 -0.9/-0.7* -1.4 -1.5/-2.3* -1.0 Note: * There are two left turn lanes on this approach.
25
4. GENERATION OF QUEUE LENGTH PREDICTION MODEL
4.1 Simulation Model Parameters
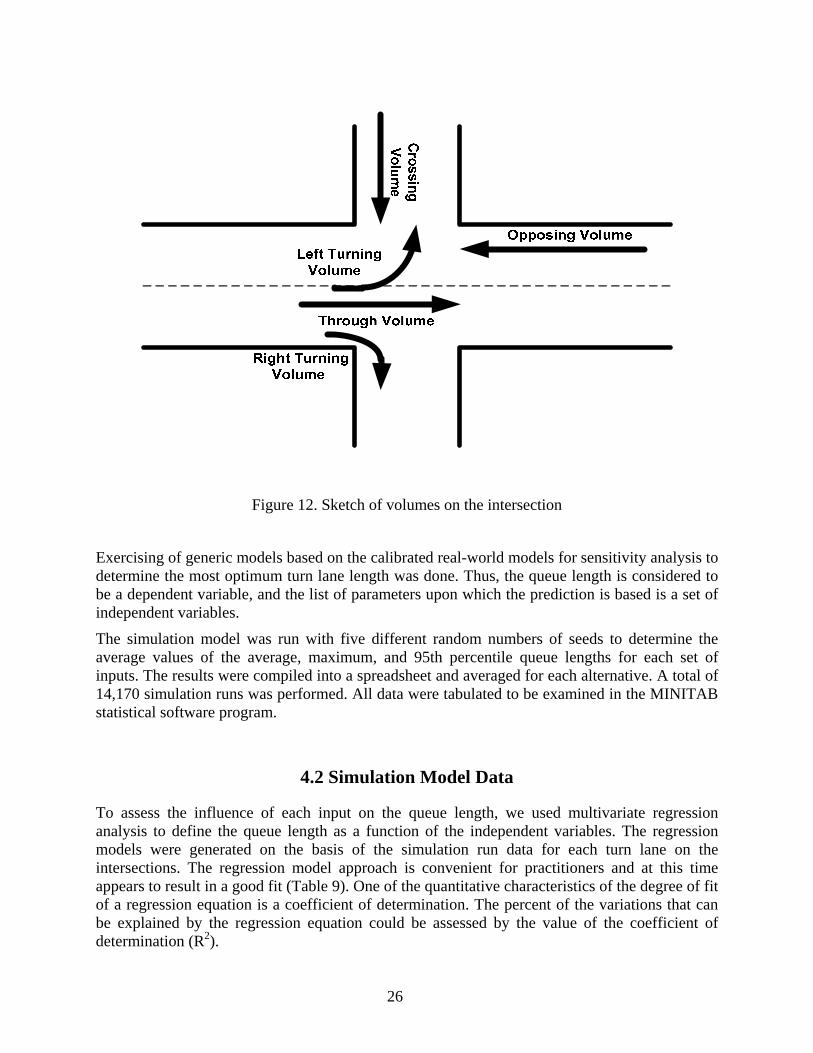
The factors that the road designers are interested in were discussed at the meeting with the panel from MN DOT. The list of those parameters is as follows: Through Volume (TV), Opposing Volume (OV), Crossing Volume (CV), Left Turn Volume (LTV), Right Turn Volume (RTV), Heavy Vehicle Through Percent (HVT), Heavy Vehicle Left Turn Percent (HVL), Heavy Vehicle Right Turn Percent (HVR), Grade (Gr), and Speed (Sp) (Figure 12). The effect of each parameter as well as their combination was considered in the sensitivity analysis. Simulations were conducted in the following ranges:
− Through Volume range – we started with the range from 200 to 800 vehicles per hour (vph) with increments of 100 vph, and then made the decision to change the range from 300 to 1100 vph with increments of 300 vph, taking into account that the arterial roads are four-lane and that the regression model reveals a good fit
− Opposing Volume range – the same as the Through Volume
− Crossing Volume range – from 50 to 350 vph with increments of 100 vph, taking into account that the opposing approaches are two-lane
− Left Turn Volume range – from 0 to 300 vph with increments of 50 vph
− Heavy Vehicle Through Percent – from 0 to 25% with increments of 5%
− Heavy Vehicle Left / Right Turn Percent – from 0 to 25% with increments of 5% at the outset
− Grade – from -4% to +4% with increments of 1%; increments of 0.5% were selected at the meeting, but SYNCHRO accepts only integers
− Speed – from 30 to 70 mph with increments of 5 mph
26
Figure 12. Sketch of volumes on the intersection
Exercising of generic models based on the calibrated real-world models for sensitivity analysis to determine the most optimum turn lane length was done. Thus, the queue length is considered to be a dependent variable, and the list of parameters upon which the prediction is based is a set of independent variables.
The simulation model was run with five different random numbers of seeds to determine the average values of the average, maximum, and 95th percentile queue lengths for each set of inputs. The results were compiled into a spreadsheet and averaged for each alternative. A total of 14,170 simulation runs was performed. All data were tabulated to be examined in the MINITAB statistical software program.
4.2 Simulation Model Data
To assess the influence of each input on the queue length, we used multivariate regression analysis to define the queue length as a function of the independent variables. The regression models were generated on the basis of the simulation run data for each turn lane on the intersections. The regression model approach is convenient for practitioners and at this time appears to result in a good fit (Table 9). One of the quantitative characteristics of the degree of fit of a regression equation is a coefficient of determination. The percent of the variations that can be explained by the regression equation could be assessed by the value of the coefficient of determination (R2).
27
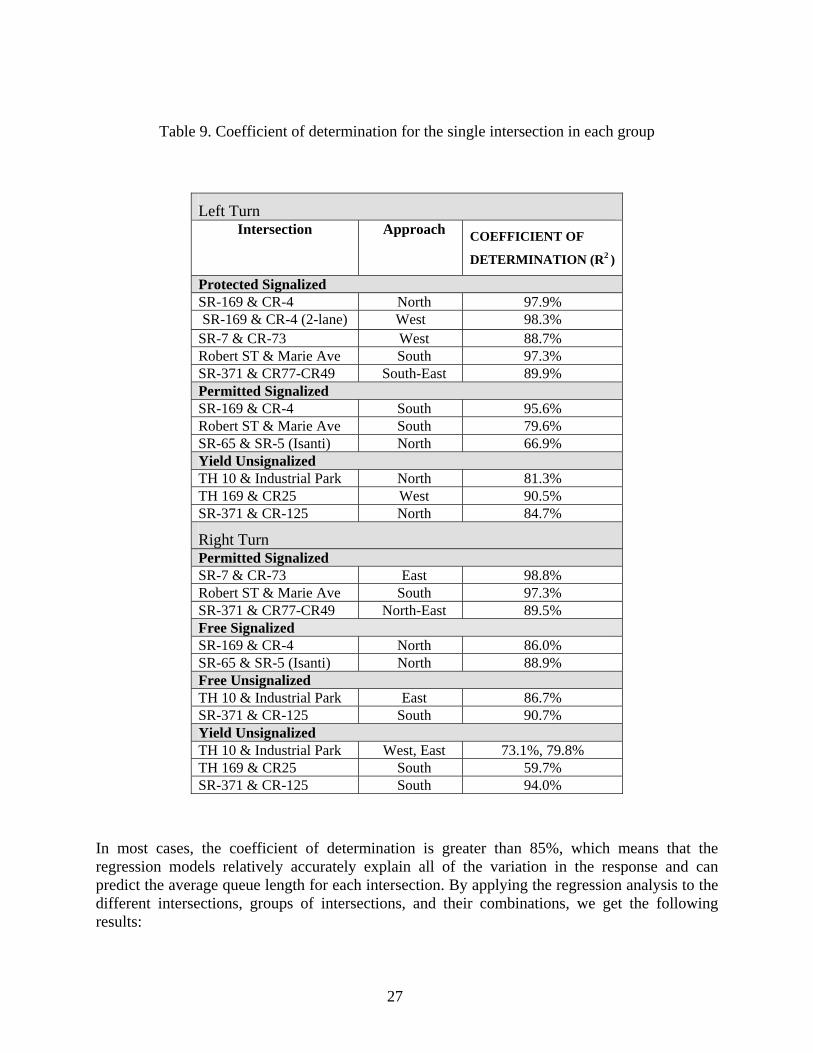
Table 9. Coefficient of determination for the single intersection in each group
Left Turn Intersection Approach COEFFICIENT OF
DETERMINATION (R2 )
Protected Signalized SR-169 & CR-4 North 97.9% SR-169 & CR-4 (2-lane) West 98.3%
SR-7 & CR-73 West 88.7% Robert ST & Marie Ave South 97.3% SR-371 & CR77-CR49 South-East 89.9% Permitted Signalized SR-169 & CR-4 South 95.6% Robert ST & Marie Ave South 79.6% SR-65 & SR-5 (Isanti) North 66.9% Yield Unsignalized TH 10 & Industrial Park North 81.3% TH 169 & CR25 West 90.5% SR-371 & CR-125 North 84.7%
Right Turn Permitted Signalized SR-7 & CR-73 East 98.8% Robert ST & Marie Ave South 97.3% SR-371 & CR77-CR49 North-East 89.5% Free Signalized SR-169 & CR-4 North 86.0% SR-65 & SR-5 (Isanti) North 88.9% Free Unsignalized TH 10 & Industrial Park East 86.7% SR-371 & CR-125 South 90.7% Yield Unsignalized TH 10 & Industrial Park West, East 73.1%, 79.8% TH 169 & CR25 South 59.7% SR-371 & CR-125 South 94.0%
In most cases, the coefficient of determination is greater than 85%, which means that the regression models relatively accurately explain all of the variation in the response and can predict the average queue length for each intersection. By applying the regression analysis to the different intersections, groups of intersections, and their combinations, we get the following results:
28
− Each intersection shows good correlation, and the coefficient of determination is equal to or greater than 80% in 18 cases out of 21.
− Each group of intersections according to our classification shows good correlation, and the coefficient of determination is greater than or equal to 85% (Table 10).
− The regression model of the combination of Permitted left turns for Signalized (S) intersections and Yield left turns for Unsignalized (U) intersections shows the acceptable fit to the function with the coefficient of determination equal to 78.4%.
− The regression model of the combination of Permitted left turns and Protected left turns for Signalized (S) intersections shows the acceptable fit to the function with the coefficient of determination equal to 76.2%.
− The regression model of the combination of Free right turns and Yield right turns for Unsignalized (U) intersections shows good fit to the data with the coefficient of determination equal to 86.2%.
Table 10. Coefficient of determination of the multivariate regression analysis of the average
queue lengths for each group of intersections and their combinations
LEFT RIGHT Prot(S) Perm(S) Yield(U) PERM(S) FREE(S) FREE(U) Yield(U) 89.7% 91.3% 85.0% 85.7% 85.1% 85.7% 87.1%
76.2% 47.2% 78.4% 66.6%
72.1% 86.2%
Note: * Coefficient of determination of the combination of Permissive (Signalized) and Yield (Unsignalized) intersections.
The equations for calculating the queue length derived from multivariate regression analysis are presented below. The absolute value of T-statistics indicates which variables add the most specifics to the regression model. The low value of P-statistics designates the significance of the variable. The lower the P value and the higher the T-statistics, the more important the variable is.
46.4% *
29
Left Turns For Protected left turns on Signalized intersections Aver = -8.64 + 0.00618*TV + 0.881*LTV - 0.119*Sp - 2.24*HVT + 0.863*HVL + 0.055*Gr (Parameters are defined in Section 4.1 ) Predictor T P Const. -1.99 0.048 TV 1.63 0.104 LTV 70.09 0.000 Sp -1.58 0.116 HVT -5.77 0.000 HVL 5.39 0.000 Gr 0.09 0.929 S = 21.51; R2 = 89.8%; R2 (adjusted) = 89.7% For Permitted left turns on Signalized intersections Aver = 20.7 - 0.00159*TV + 0.0233*OV + 0.483*LTV - 0.580*Sp - 0.192*HVT + 0.382*HVL - 0.32*Gr (Parameters defined in Section 4.1 ) Predictor T P Const. 2.14 0.033 TV -0.28 0.781 OV 8.14 0.000 LTV 52.44 0.000 Sp -4.73 0.000 HVT -0.68 0.497 HVL 2.09 0.037 Gr -0.30 0.765 S = 12.70; R2 = 91.5%; R2 (adjusted) = 91.3%
30
For Yield left turns on Unsignalized intersections Aver = -9.75 + 0.00179*TV + 0.0216*OV + 0.226*LTV - 0.0626*Sp + 0.249*HVT - 0.007*HVL + 0.204*Gr (Parameters are defined in Section 4.1 ) Predictor T P Const. -4.16 0.000 TV 1.20 0.233 OV 14.32 0.000 LTV 34.51 0.000 Sp -1.58 0.115 HVT 1.40 0.161 HVL -0.06 0.953 Gr 0.37 0.709 S = 5.987; R2= 85.5%; R2 (adjusted) = 85.0% For the combination of Permitted left turns on Signalized and Yield turns on Unsignalized intersections Aver = -29.4 + 0.00248*TV + 0.0203*OV + 0.416*LTV + 0.133*Sp - 0.315*HVT + 0.922*HVL + 0.22*Gr (Parameters are defined in Section 4.1 ) Predictor T P Const. -5.25 0.000 TV 0.70 0.482 OV 6.85 0.000 LTV 38.82 0.000 Sp 1.50 0.134 HVT -1.03 0.303 HVL 5.27 0.000 Gr 0.20 0.843 S = 17.82; R2 = 78.7% ; R2 (adjusted) = 78.4%
31
For the combination of Permitted and Protected left turns on Signalized intersections Aver = -7.69 + 0.0379*TV - 0.0409*OV + 0.859*LTV - 0.298*Sp - 2.92*HVT+ 0.106*HVL + 0.081*Gr (Parameters are defined in Section 4.1 ) Predictor T P Const. -1.25 0.210 TV 7.84 0.000 OV -8.97 0.000 LTV 55.73 0.000 Sp -3.04 0.002 HVT -5.80 0.000 HVL 0.53 0.596 Gr 0.09 0.932 S = 38.19; R2 = 76.4%; R2 (adjusted) = 76.2% For the combination of Permitted and Protected left turns on Signalized and Yield left turns on Unsignalized intersections Aver = -6.24 + 0.0282*TV - 0.0565*OV + 0.799*LTV - 0.101*Sp - 2.78*HVT+ 0.269*HVL + 0.124*Gr (Parameters are defined in Section 4.1 ) Predictor T P Const. -1.07 0.284 TV 6.16 0.000 OV -17.23 0.000 LTV 50.63 0.000 Sp -1.60 0.288 HVT -5.22 0.000 HVL 1.37 0.172 Gr 0.13 0.900 S = 40.71; R2 = 72.3%; R2 (adjusted) = 72.1%
32
Right Turns For Free right turns on Signalized intersections Aver = - 24.1 + 0.0102 TV + 0.109 CV + 0.142 RTV - 0.153 Sp - 0.150 HVT+ 0.157 HVR + 0.176 Gr (Parameters are defined in Section 4.1 ) Predictor T P Const. -9.98 0.000 TV 4.37 0.000 CV 23.50 0.000 LTV 31.21 0.000 Sp -5.21 0.000 HVT -0.77 0.443 HVL 1.59 0.113 Gr 0.36 0.721 S = 6.571 R2 = 85.5% R2 (adjusted) = 85.1% For Permitted right turns on Signalized intersections Aver = 25.2 + 0.00929 TV + 0.0265 CV + 0.152 RTV - 0.367 Sp - 0.475 HVT + 0.375 HVR - 0.129 Gr (Parameters are defined in Section 4.1 ) Predictor T P Const. 9.28 0.000 TV 4.22 0.000 CV 5.81 0.000 LTV 29.92 0.000 Sp -9.97 0.000 HVT -4.48 0.000 HVL 3.23 0.001 Gr -0.36 0.719 S = 5.543 R2 = 86.2% R2 (adjusted) = 85.7%
33
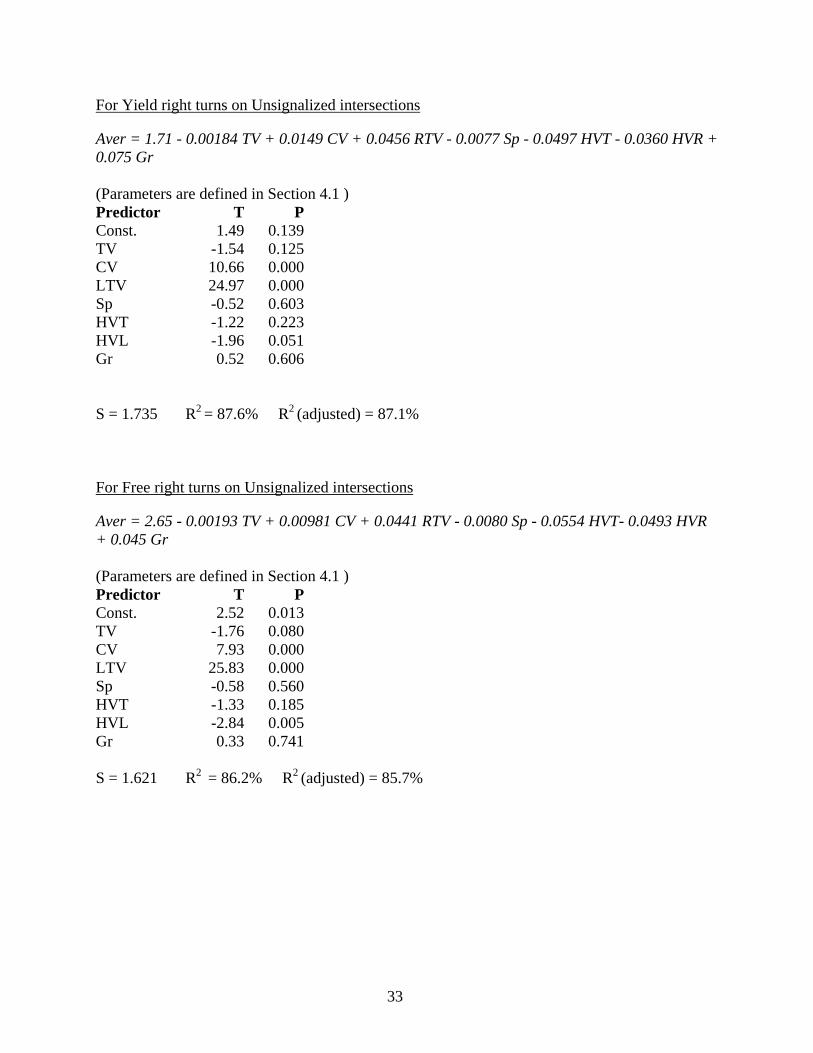
For Yield right turns on Unsignalized intersections Aver = 1.71 - 0.00184 TV + 0.0149 CV + 0.0456 RTV - 0.0077 Sp - 0.0497 HVT - 0.0360 HVR + 0.075 Gr (Parameters are defined in Section 4.1 ) Predictor T P Const. 1.49 0.139 TV -1.54 0.125 CV 10.66 0.000 LTV 24.97 0.000 Sp -0.52 0.603 HVT -1.22 0.223 HVL -1.96 0.051 Gr 0.52 0.606 S = 1.735 R2 = 87.6% R2 (adjusted) = 87.1% For Free right turns on Unsignalized intersections Aver = 2.65 - 0.00193 TV + 0.00981 CV + 0.0441 RTV - 0.0080 Sp - 0.0554 HVT- 0.0493 HVR + 0.045 Gr (Parameters are defined in Section 4.1 ) Predictor T P Const. 2.52 0.013 TV -1.76 0.080 CV 7.93 0.000 LTV 25.83 0.000 Sp -0.58 0.560 HVT -1.33 0.185 HVL -2.84 0.005 Gr 0.33 0.741 S = 1.621 R2 = 86.2% R2 (adjusted) = 85.7%
34
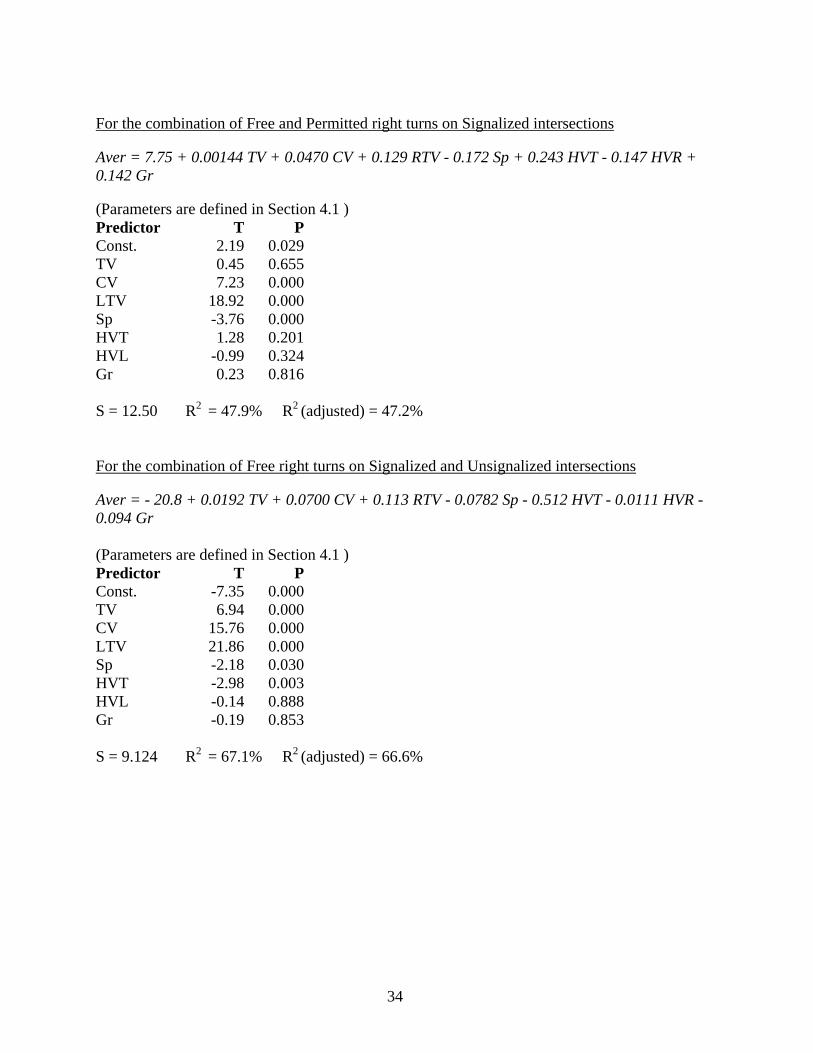
For the combination of Free and Permitted right turns on Signalized intersections Aver = 7.75 + 0.00144 TV + 0.0470 CV + 0.129 RTV - 0.172 Sp + 0.243 HVT - 0.147 HVR + 0.142 Gr (Parameters are defined in Section 4.1 ) Predictor T P Const. 2.19 0.029 TV 0.45 0.655 CV 7.23 0.000 LTV 18.92 0.000 Sp -3.76 0.000 HVT 1.28 0.201 HVL -0.99 0.324 Gr 0.23 0.816 S = 12.50 R2 = 47.9% R2 (adjusted) = 47.2% For the combination of Free right turns on Signalized and Unsignalized intersections Aver = - 20.8 + 0.0192 TV + 0.0700 CV + 0.113 RTV - 0.0782 Sp - 0.512 HVT - 0.0111 HVR - 0.094 Gr (Parameters are defined in Section 4.1 ) Predictor T P Const. -7.35 0.000 TV 6.94 0.000 CV 15.76 0.000 LTV 21.86 0.000 Sp -2.18 0.030 HVT -2.98 0.003 HVL -0.14 0.888 Gr -0.19 0.853 S = 9.124 R2 = 67.1% R2 (adjusted) = 66.6%
35
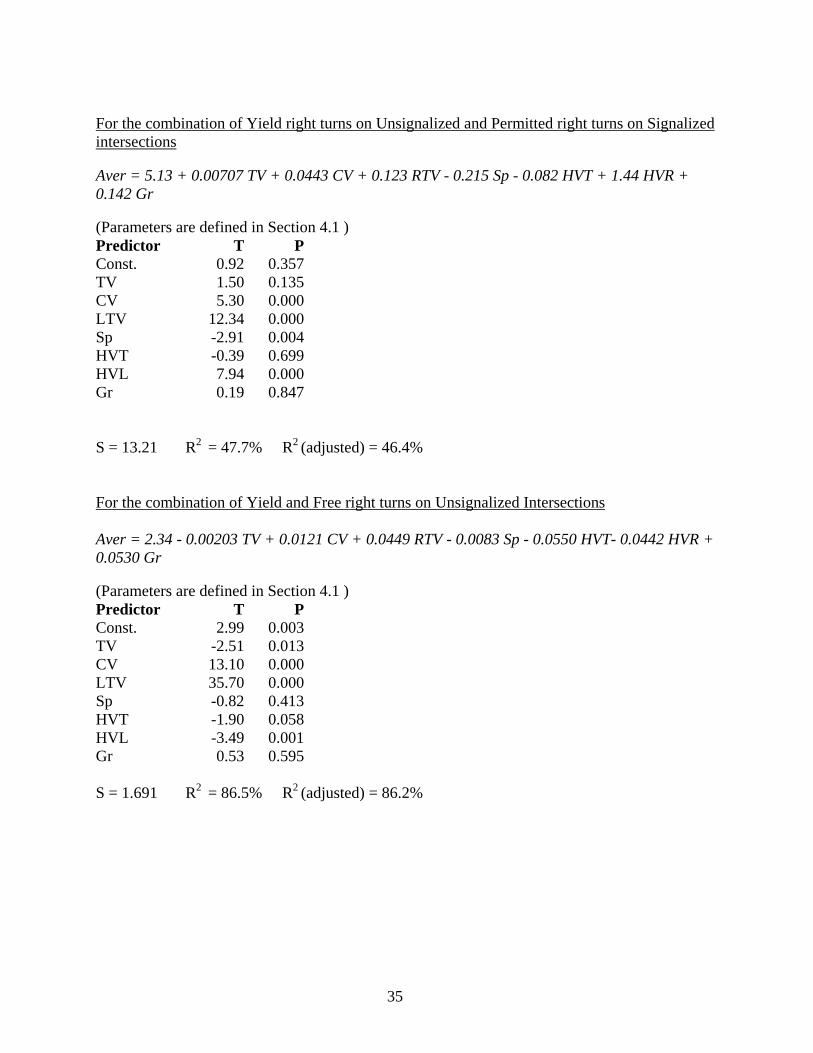
For the combination of Yield right turns on Unsignalized and Permitted right turns on Signalized intersections Aver = 5.13 + 0.00707 TV + 0.0443 CV + 0.123 RTV - 0.215 Sp - 0.082 HVT + 1.44 HVR + 0.142 Gr (Parameters are defined in Section 4.1 ) Predictor T P Const. 0.92 0.357 TV 1.50 0.135 CV 5.30 0.000 LTV 12.34 0.000 Sp -2.91 0.004 HVT -0.39 0.699 HVL 7.94 0.000 Gr 0.19 0.847 S = 13.21 R2 = 47.7% R2 (adjusted) = 46.4% For the combination of Yield and Free right turns on Unsignalized Intersections Aver = 2.34 - 0.00203 TV + 0.0121 CV + 0.0449 RTV - 0.0083 Sp - 0.0550 HVT- 0.0442 HVR + 0.0530 Gr (Parameters are defined in Section 4.1 ) Predictor T P Const. 2.99 0.003 TV -2.51 0.013 CV 13.10 0.000 LTV 35.70 0.000 Sp -0.82 0.413 HVT -1.90 0.058 HVL -3.49 0.001 Gr 0.53 0.595 S = 1.691 R2 = 86.5% R2 (adjusted) = 86.2%
36
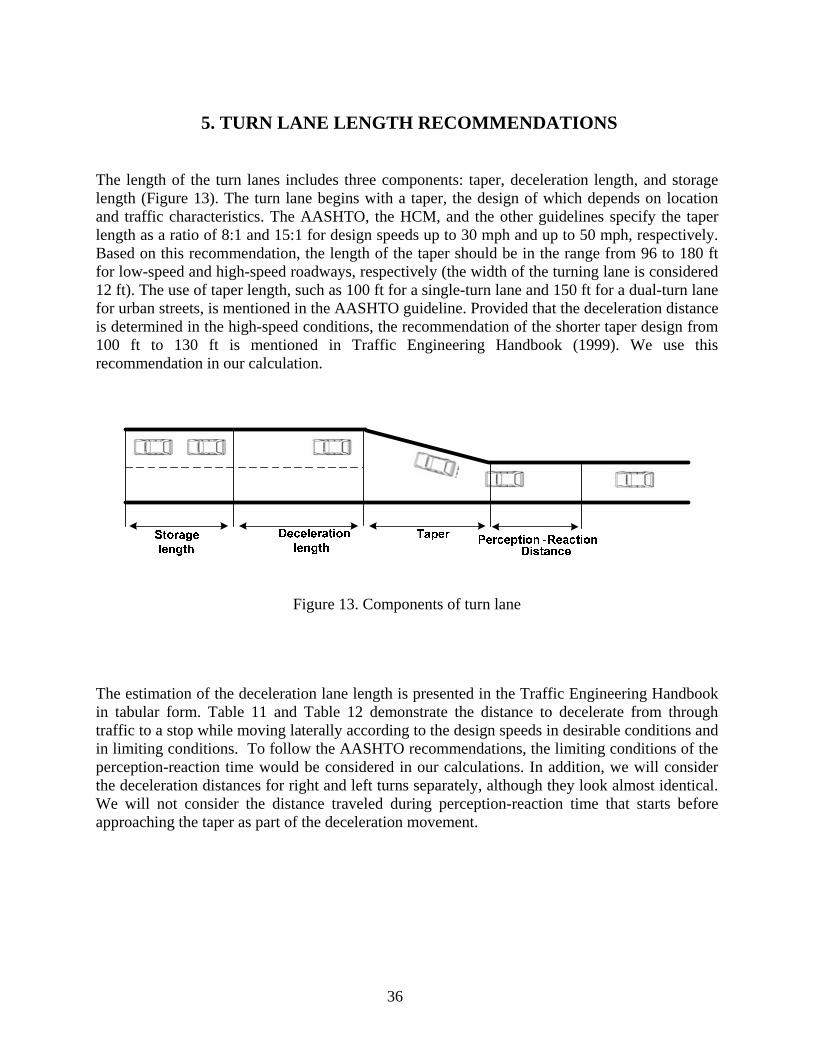
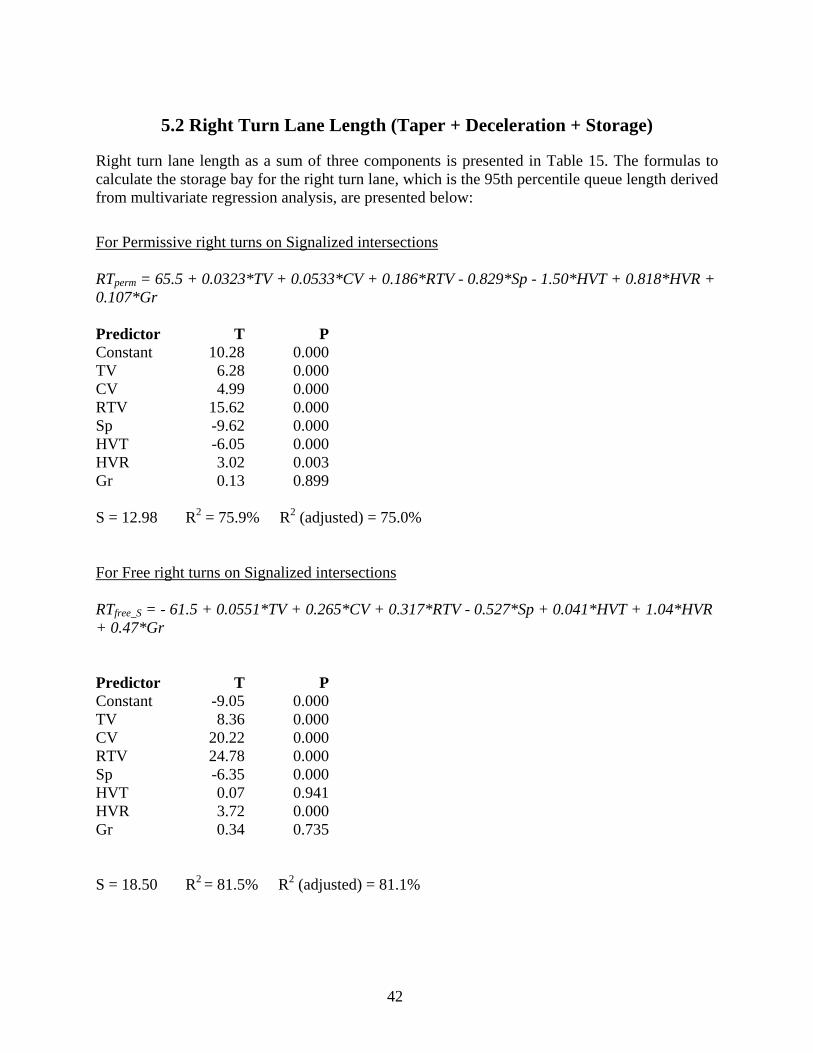
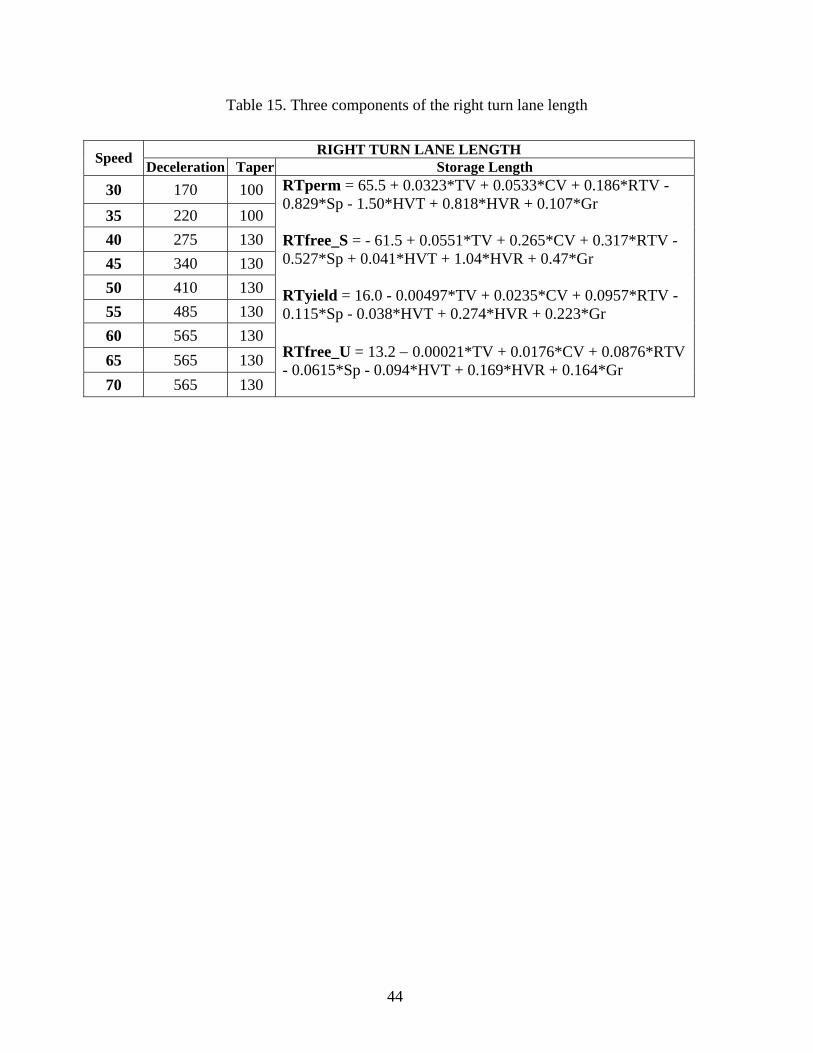
5. TURN LANE LENGTH RECOMMENDATIONS
The length of the turn lanes includes three components: taper, deceleration length, and storage length (Figure 13). The turn lane begins with a taper, the design of which depends on location and traffic characteristics. The AASHTO, the HCM, and the other guidelines specify the taper length as a ratio of 8:1 and 15:1 for design speeds up to 30 mph and up to 50 mph, respectively. Based on this recommendation, the length of the taper should be in the range from 96 to 180 ft for low-speed and high-speed roadways, respectively (the width of the turning lane is considered 12 ft). The use of taper length, such as 100 ft for a single-turn lane and 150 ft for a dual-turn lane for urban streets, is mentioned in the AASHTO guideline. Provided that the deceleration distance is determined in the high-speed conditions, the recommendation of the shorter taper design from 100 ft to 130 ft is mentioned in Traffic Engineering Handbook (1999). We use this recommendation in our calculation.
Figure 13. Components of turn lane
The estimation of the deceleration lane length is presented in the Traffic Engineering Handbook in tabular form. Table 11 and Table 12 demonstrate the distance to decelerate from through traffic to a stop while moving laterally according to the design speeds in desirable conditions and in limiting conditions. To follow the AASHTO recommendations, the limiting conditions of the perception-reaction time would be considered in our calculations. In addition, we will consider the deceleration distances for right and left turns separately, although they look almost identical. We will not consider the distance traveled during perception-reaction time that starts before approaching the taper as part of the deceleration movement.
37
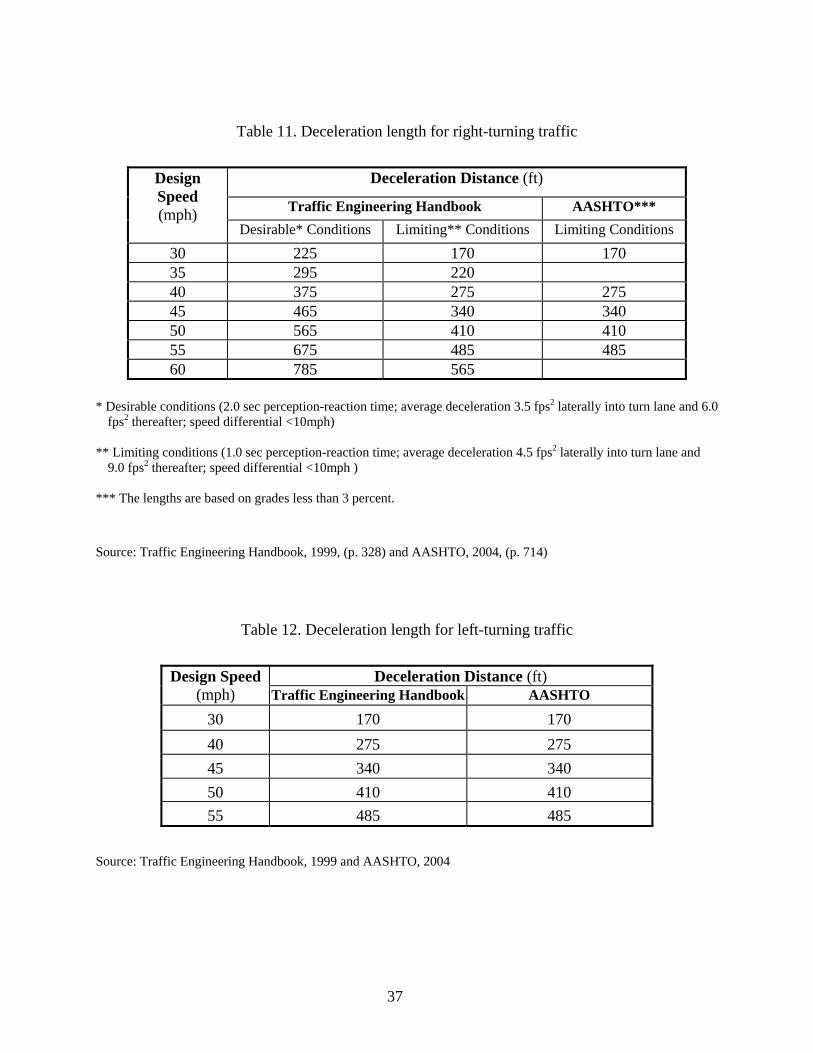
Table 11. Deceleration length for right-turning traffic
Source: Traffic Engineering Handbook, 1999 and AASHTO, 2004
38
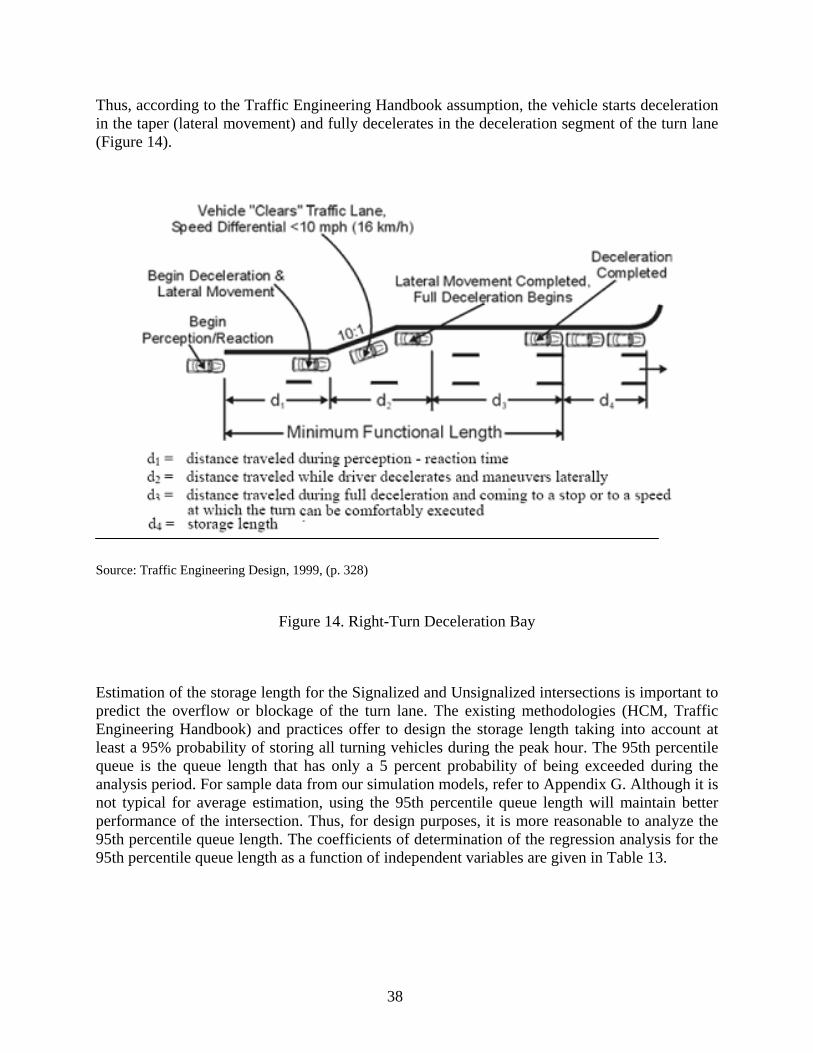
Thus, according to the Traffic Engineering Handbook assumption, the vehicle starts deceleration in the taper (lateral movement) and fully decelerates in the deceleration segment of the turn lane (Figure 14).
Estimation of the storage length for the Signalized and Unsignalized intersections is important to predict the overflow or blockage of the turn lane. The existing methodologies (HCM, Traffic Engineering Handbook) and practices offer to design the storage length taking into account at least a 95% probability of storing all turning vehicles during the peak hour. The 95th percentile queue is the queue length that has only a 5 percent probability of being exceeded during the analysis period. For sample data from our simulation models, refer to Appendix G. Although it is not typical for average estimation, using the 95th percentile queue length will maintain better performance of the intersection. Thus, for design purposes, it is more reasonable to analyze the 95th percentile queue length. The coefficients of determination of the regression analysis for the 95th percentile queue length as a function of independent variables are given in Table 13.
39
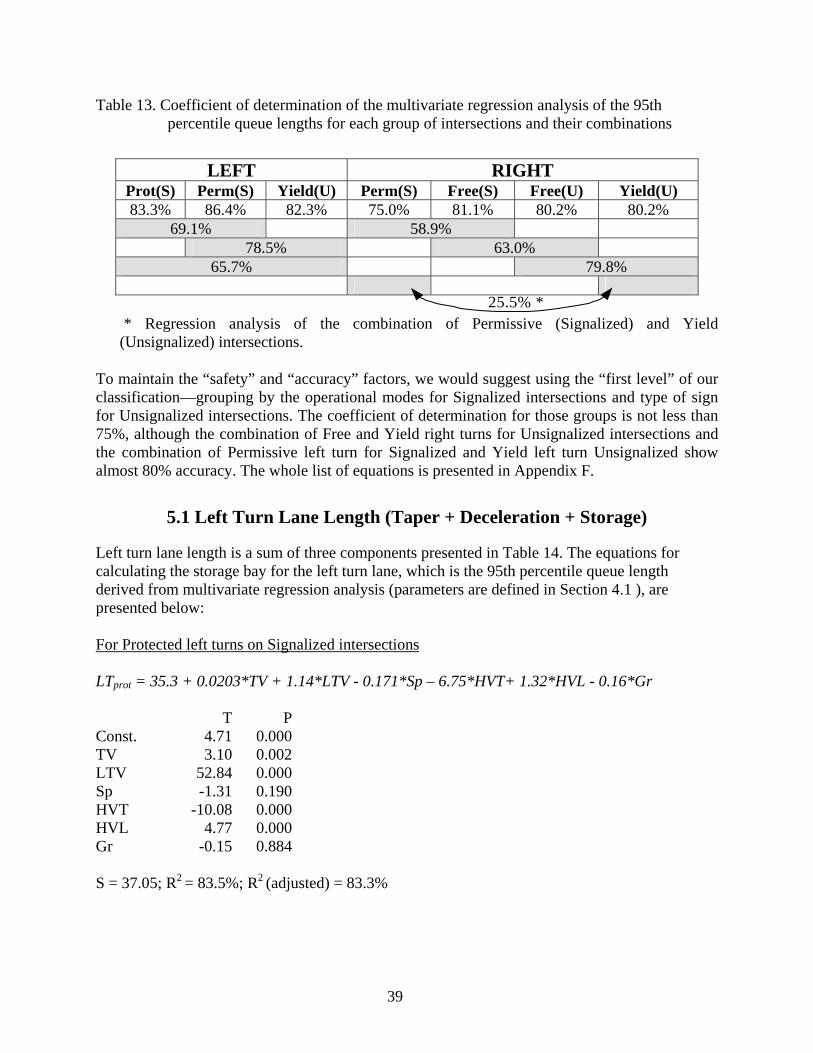
Table 13. Coefficient of determination of the multivariate regression analysis of the 95th percentile queue lengths for each group of intersections and their combinations
* Regression analysis of the combination of Permissive (Signalized) and Yield (Unsignalized) intersections.
To maintain the “safety” and “accuracy” factors, we would suggest using the “first level” of our classification—grouping by the operational modes for Signalized intersections and type of sign for Unsignalized intersections. The coefficient of determination for those groups is not less than 75%, although the combination of Free and Yield right turns for Unsignalized intersections and the combination of Permissive left turn for Signalized and Yield left turn Unsignalized show almost 80% accuracy. The whole list of equations is presented in Appendix F.
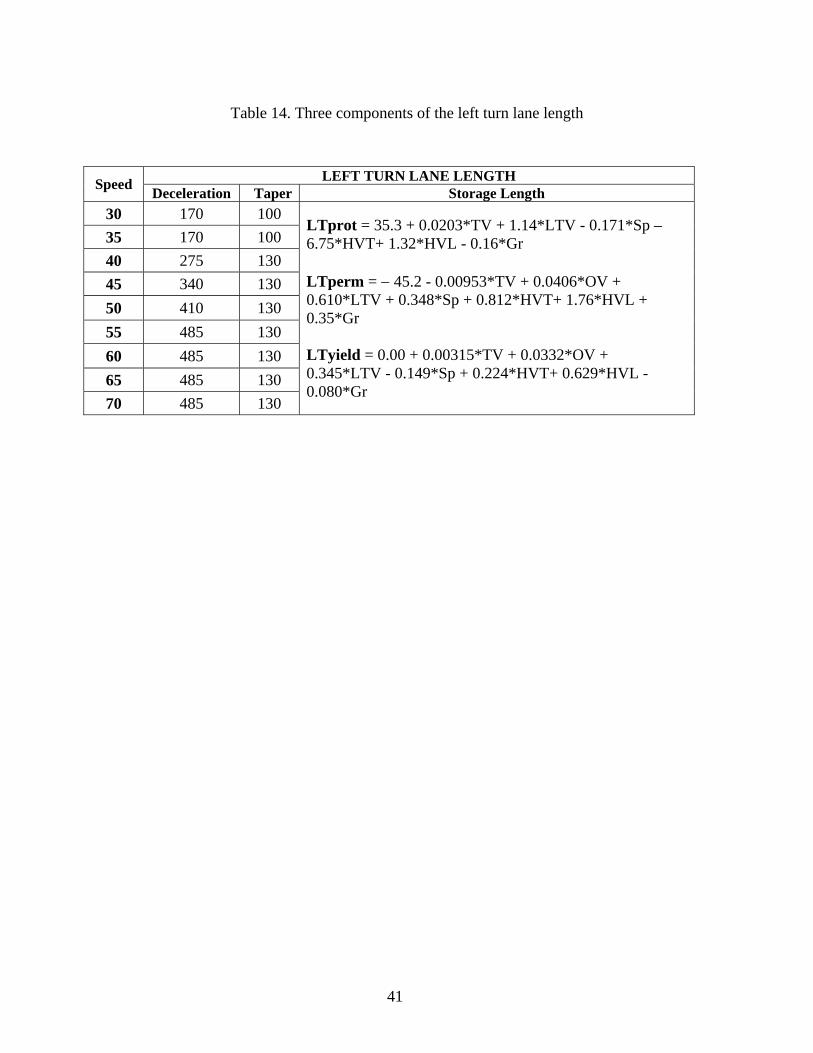
5.1 Left Turn Lane Length (Taper + Deceleration + Storage)
Left turn lane length is a sum of three components presented in Table 14. The equations for calculating the storage bay for the left turn lane, which is the 95th percentile queue length derived from multivariate regression analysis (parameters are defined in Section 4.1 ), are presented below: For Protected left turns on Signalized intersections LTprot = 35.3 + 0.0203*TV + 1.14*LTV - 0.171*Sp – 6.75*HVT+ 1.32*HVL - 0.16*Gr T P Const. 4.71 0.000 TV 3.10 0.002 LTV 52.84 0.000 Sp -1.31 0.190 HVT -10.08 0.000 HVL 4.77 0.000 Gr -0.15 0.884 S = 37.05; R2 = 83.5%; R2 (adjusted) = 83.3%
25.5% *
40
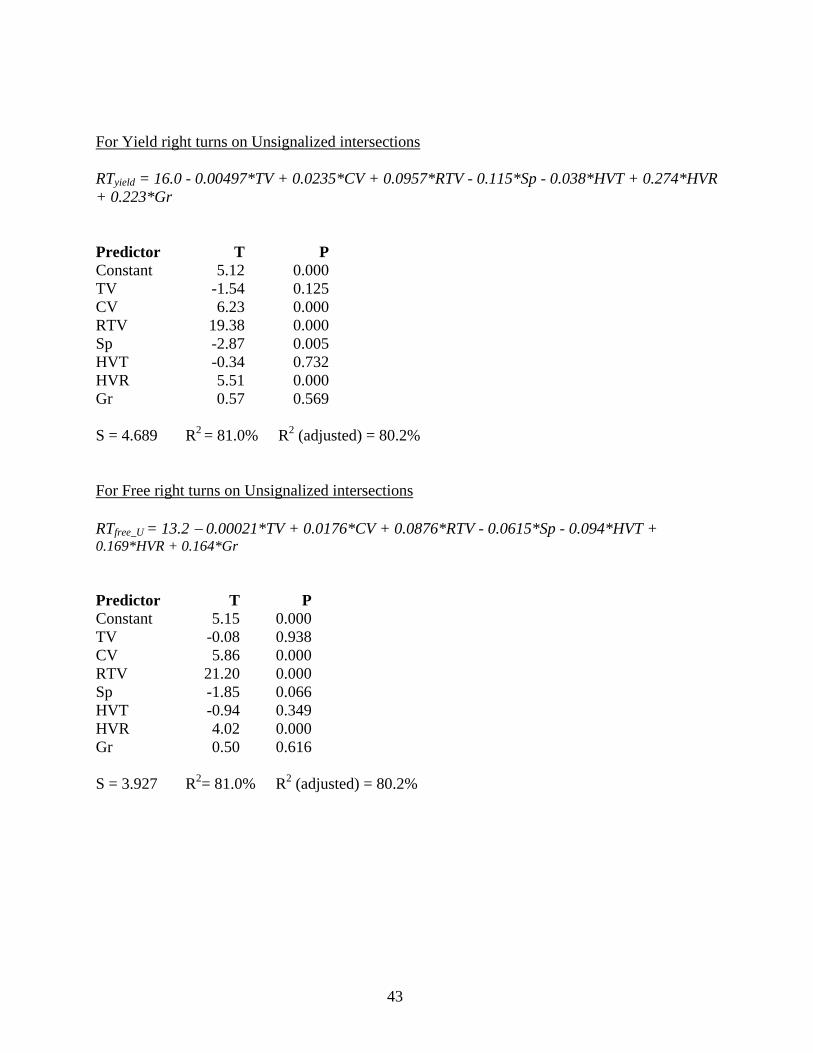
For Permitted left turns on Signalized intersections LTperm = − 45.2 - 0.00953*TV + 0.0406*OV + 0.610*LTV + 0.348*Sp + 0.812*HVT+ 1.76*HVL + 0.35*Gr T P Const. -6.09 0.000 TV -2.10 0.037 OV 10.47 0.000 LTV 42.96 0.000 Sp 2.76 0.006 HVT 1.69 0.091 HVL 7.14 0.000 Gr 0.22 0.823 S = 22.16; R2 = 86.6%; R2 (adjusted) = 86.4% For Yield left turns on Unsignalized intersections LTyield = 0.00 + 0.00315*TV + 0.0332*OV + 0.345*LTV - 0.149*Sp + 0.224*HVT+ 0.629*HVL - 0.080*Gr T P Const. 0.00 0.999 TV 1.23 0.220 OV 12.88 0.000 LTV 30.85 0.000 Sp -2.21 0.028 HVT 0.74 0.460 HVL 2.93 0.004 Gr -0.09 0.932 S = 10.23; R2 = 82.8%; R2 (adjusted) = 82.3%
41
Table 14. Three components of the left turn lane length
5.2 Right Turn Lane Length (Taper + Deceleration + Storage)
Right turn lane length as a sum of three components is presented in Table 15. The formulas to calculate the storage bay for the right turn lane, which is the 95th percentile queue length derived from multivariate regression analysis, are presented below:
For Permissive right turns on Signalized intersections RTperm = 65.5 + 0.0323*TV + 0.0533*CV + 0.186*RTV - 0.829*Sp - 1.50*HVT + 0.818*HVR + 0.107*Gr Predictor T PConstant 10.28 0.000TV 6.28 0.000CV 4.99 0.000RTV 15.62 0.000Sp -9.62 0.000HVT -6.05 0.000HVR 3.02 0.003 Gr 0.13 0.899 S = 12.98 R2 = 75.9% R2 (adjusted) = 75.0%
The total length of the turn lane is a sum of three components: taper, deceleration length, and storage length. The equations to calculate the storage length were derived by means of regression analysis of the data generated through exercising the simulation models of selected intersections. The other two components of the turn lane—taper and deceleration length—were added according to the design guidelines.
The general characteristics of the intersections that were chosen are:
− 4-lane and 2-way on arterial road and one turn lane for each turn
− 2-lane and 2-way on crossing road and one turn lane for each turn
− with or without channelization design on right turns
According to our classification, we get the correspondences of storage length as a dependent variable from the independent variables for each type of intersection. The mentioned results are applicable for the following range of parameters:
− Volume per Through lane – up to 500 vph
− Turn Volume – up to 250 vph
− Heavy Vehicle Percent – up to 20-25%
− Speed – up to 70 mph
− Grade – for range -4% to +4%
The abovementioned ranges are correlated with the HCM (2000) guidelines, which state that enough main roadway lanes should be provided to prevent the total of the through plus right-turn volume (plus left-turn volume, if present) from exceeding 450 veh/h/ln. Higher volumes can be accommodated on major approaches if a substantial portion of available green time can be allocated to the subject approach. Where left turn volumes exceed 300 vph, provision of a double left turn lane should be considered. Thus, when the through and turning volumes exceed the mentioned values, the recommendation could be an additional lane design consideration or changes in signal timing.
The influence of each independent variable within the ranges that we investigated is as follows:
For Left Turns:
1. The most important and significant factors are Through Volume, Opposing Volume, Left Turn Volume, Heavy Vehicle Left Turn Percent, and Speed.
2. The influence of Heavy Vehicle Through Percent factor exists but does not appear to be significant for the Permitted turns on Signalized and Yield turns on Unsignalized intersections.
46
3. The influence of Speed factor exists but does not appear to be significant for Protected turns on Signalized intersections.
4. The Grade factor does not appear to affect the left turn queue length.
For Right Turns:
1. The most important and significant factors are Through Volume, Crossing Volume, Right Turn Volume, Heavy Vehicle Right Turn Percent, and Speed.
2. The influence of Heavy Vehicle Through Percent factor exists but does not appear to be significant for Free turns on both types of intersections and Yield turns on Unsignalized intersections.
3. The influence of Through Volume on Free right turns on Unsignalized intersections does not appear to affect the right turn queue length.
4. The Grade factor does not appear to affect the right turn queue length.
We tried to improve the performance of regression models by removing the factors that have a weak influence. The coefficient of determination decreased, which means that even weak influence is still important for accurate performance. To calculate the total length of the turn lane, the taper and deceleration lengths that match the design speed should be added.
The whole procedure of calculations is divided into the following steps:
− Identification of the type of turn: Left or Right
− Identification of the type of Intersection: Signalized or Unsignalized
− Identification of the type of mode or sign control: Protected, Permitted, Yield, or Free
− Calculation of Storage length for defined type of turn lane
− Identification of the Speed value to define the sum of taper and deceleration length
− Calculation of the total length of turn lane by adding the defined storage length to the sum of the taper and deceleration length
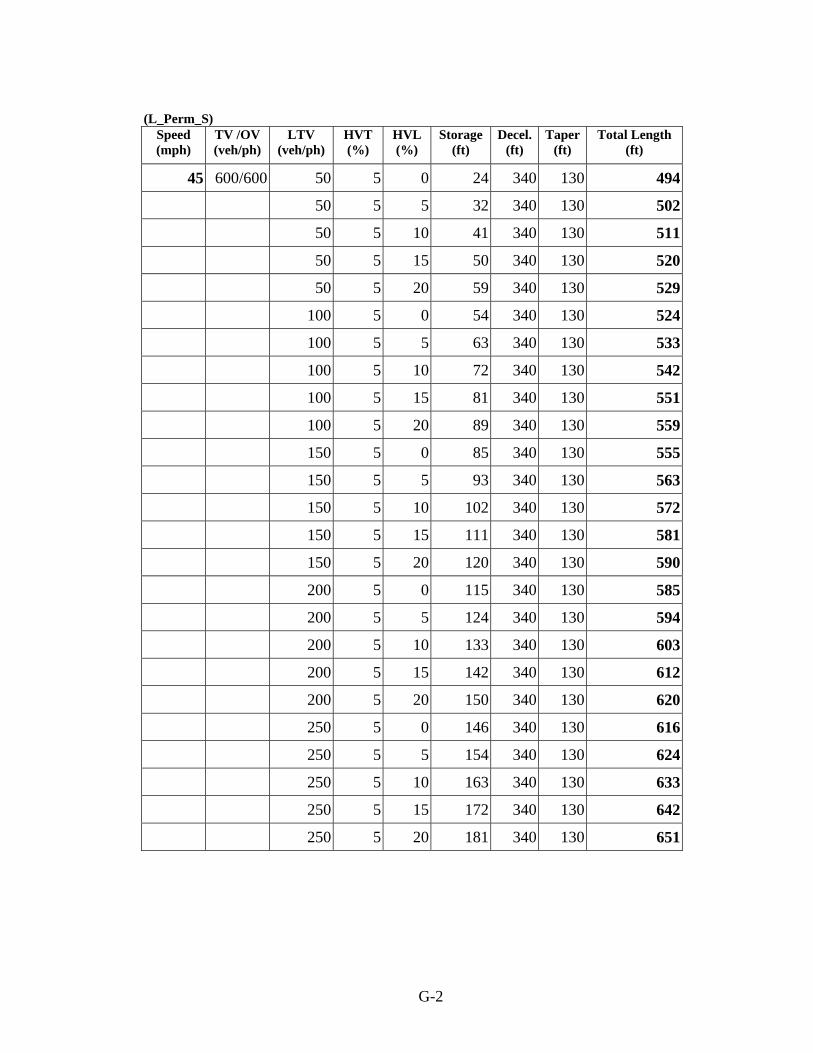
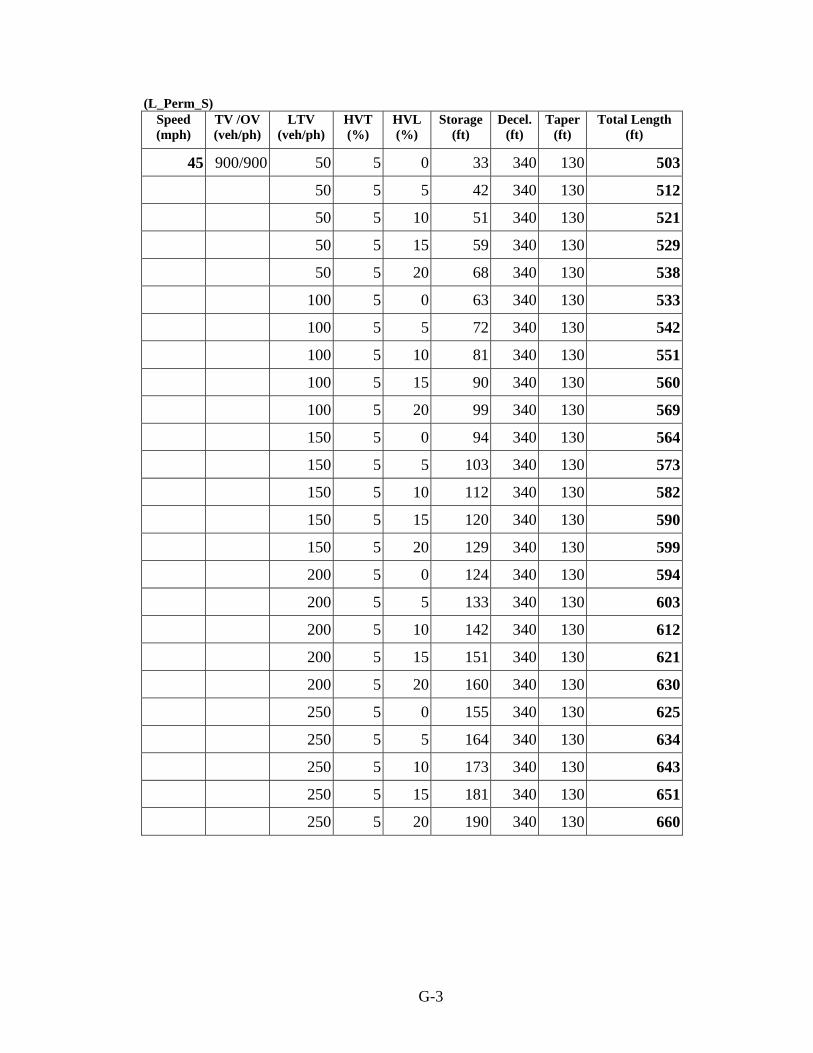
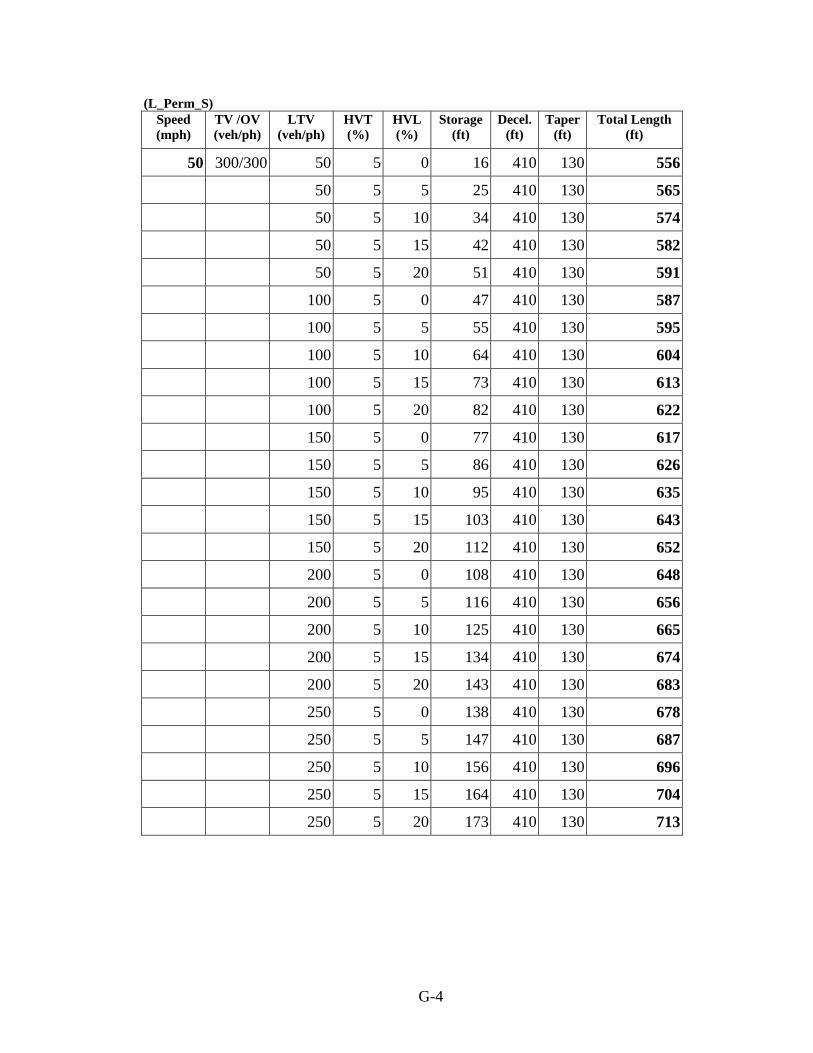
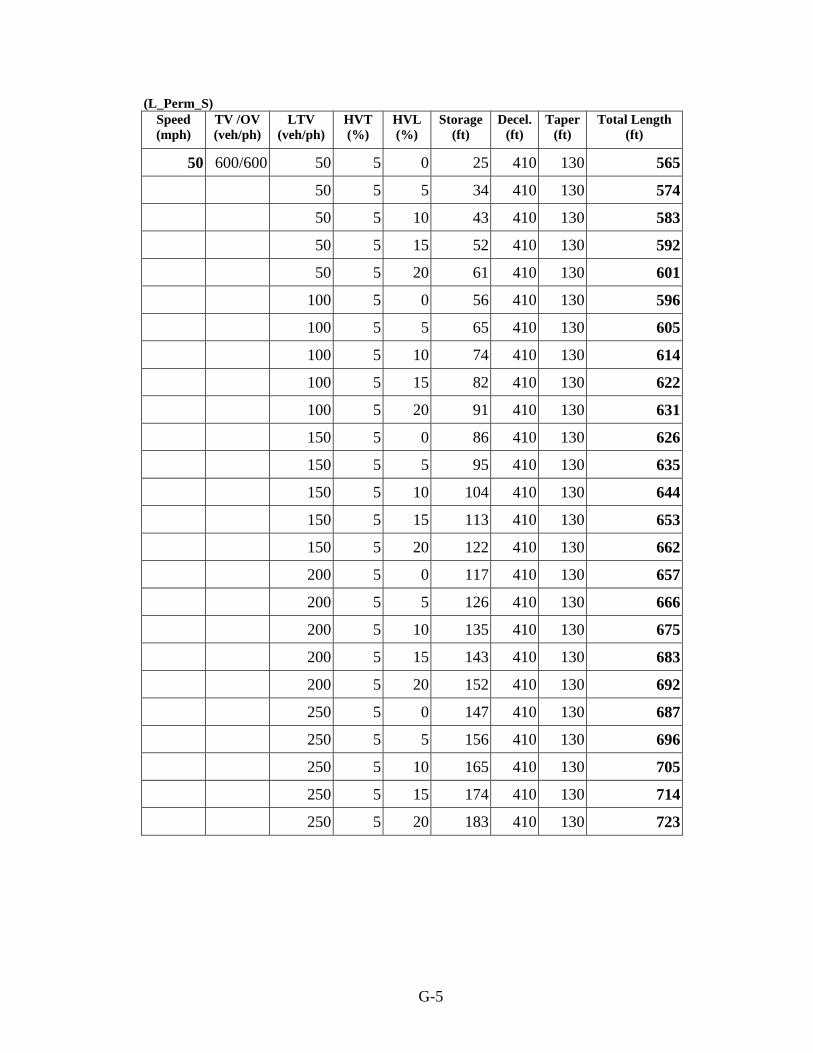
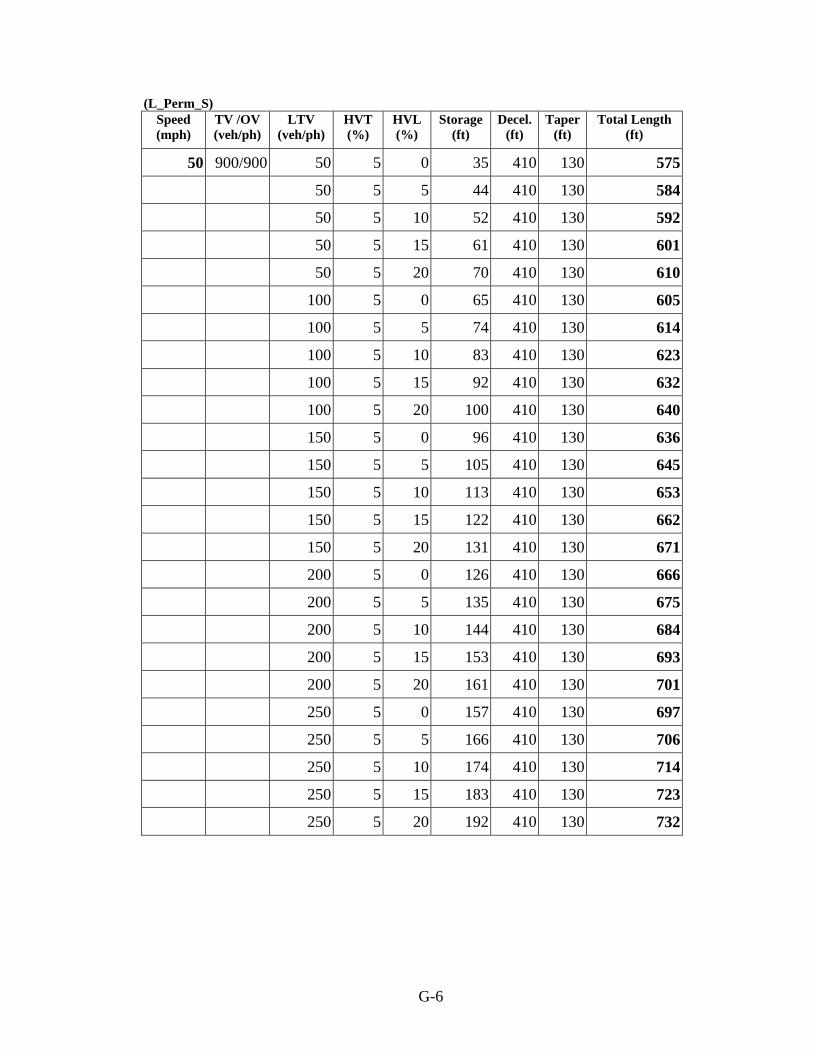
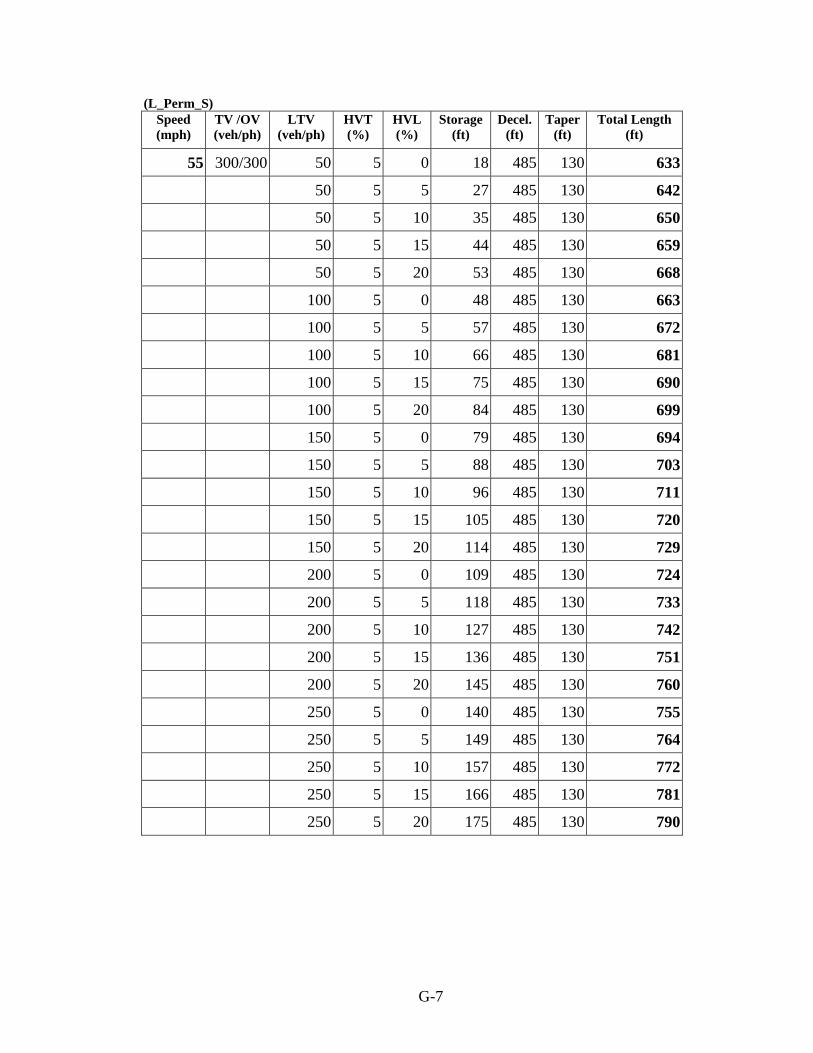
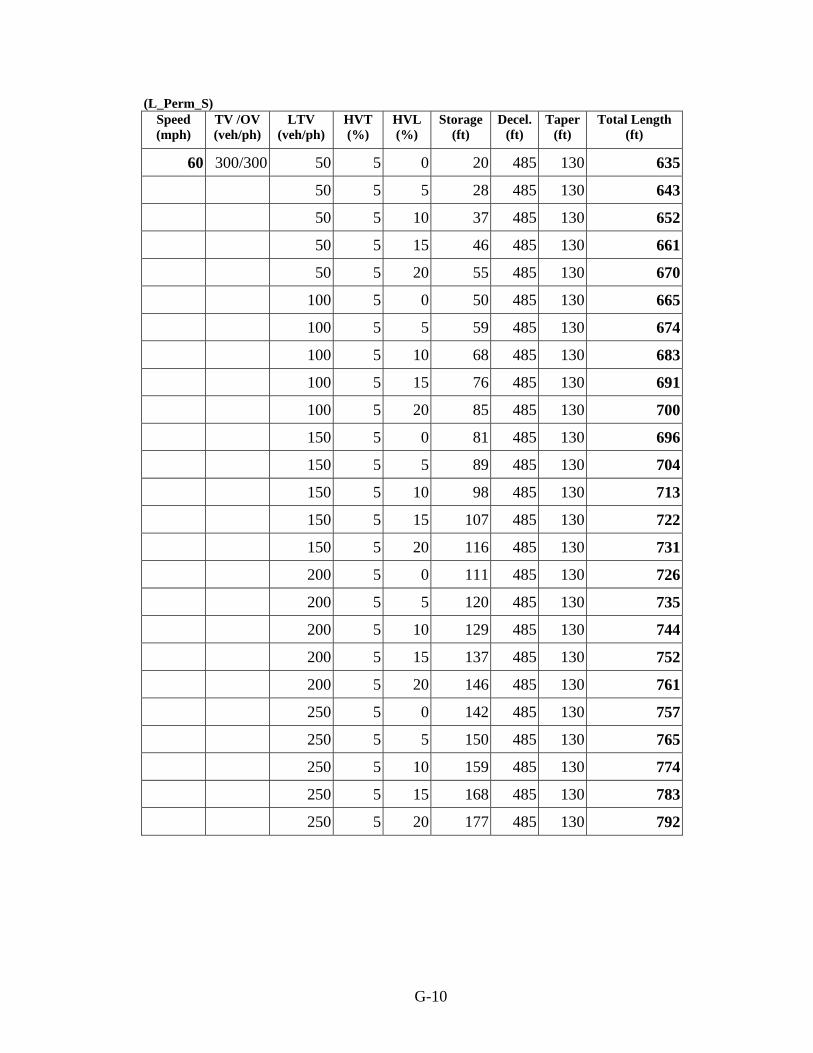
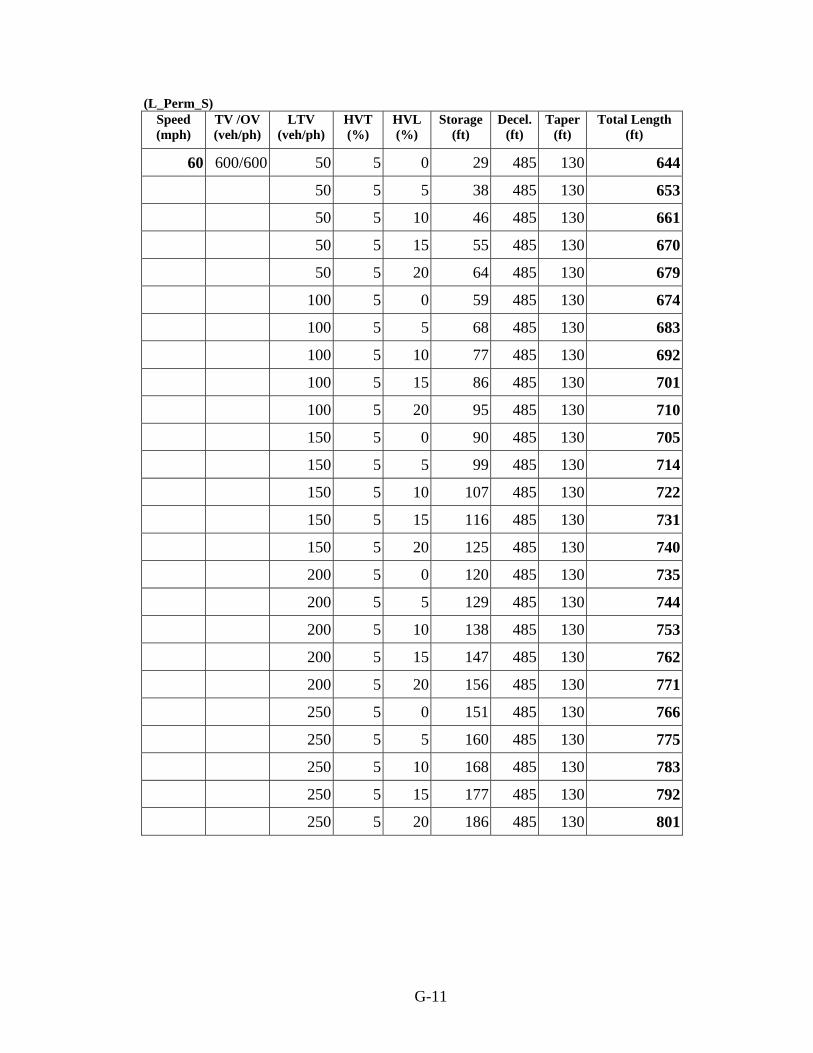
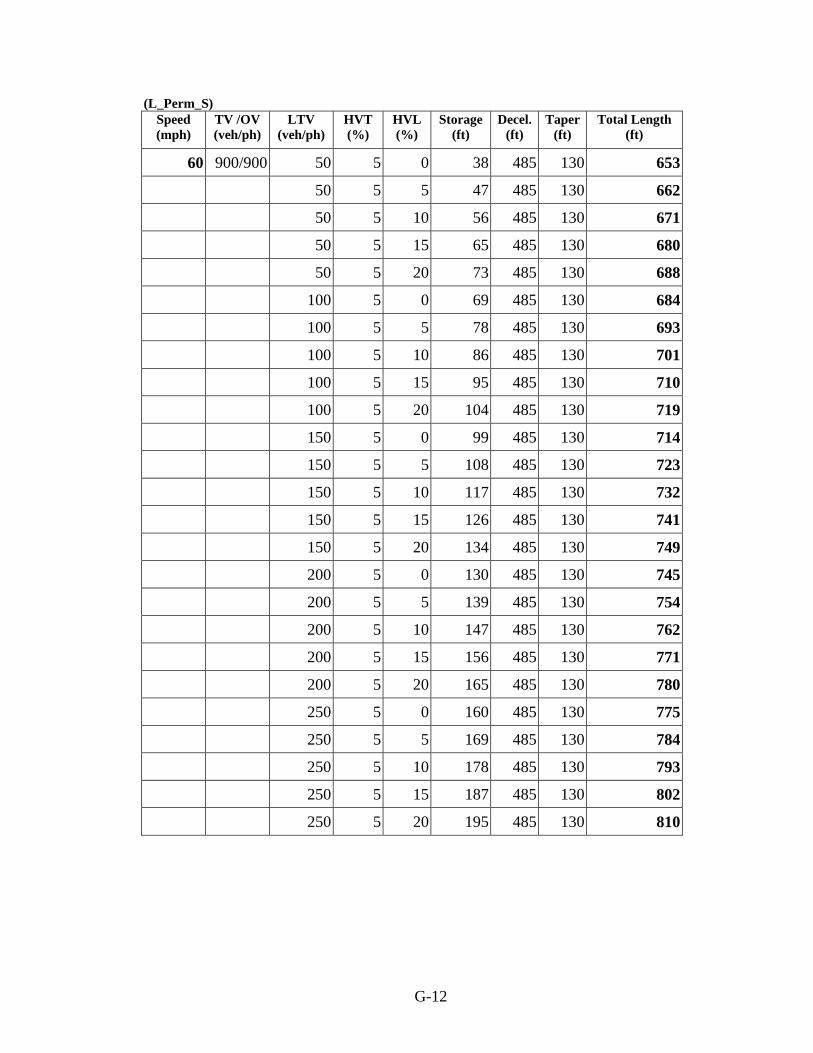
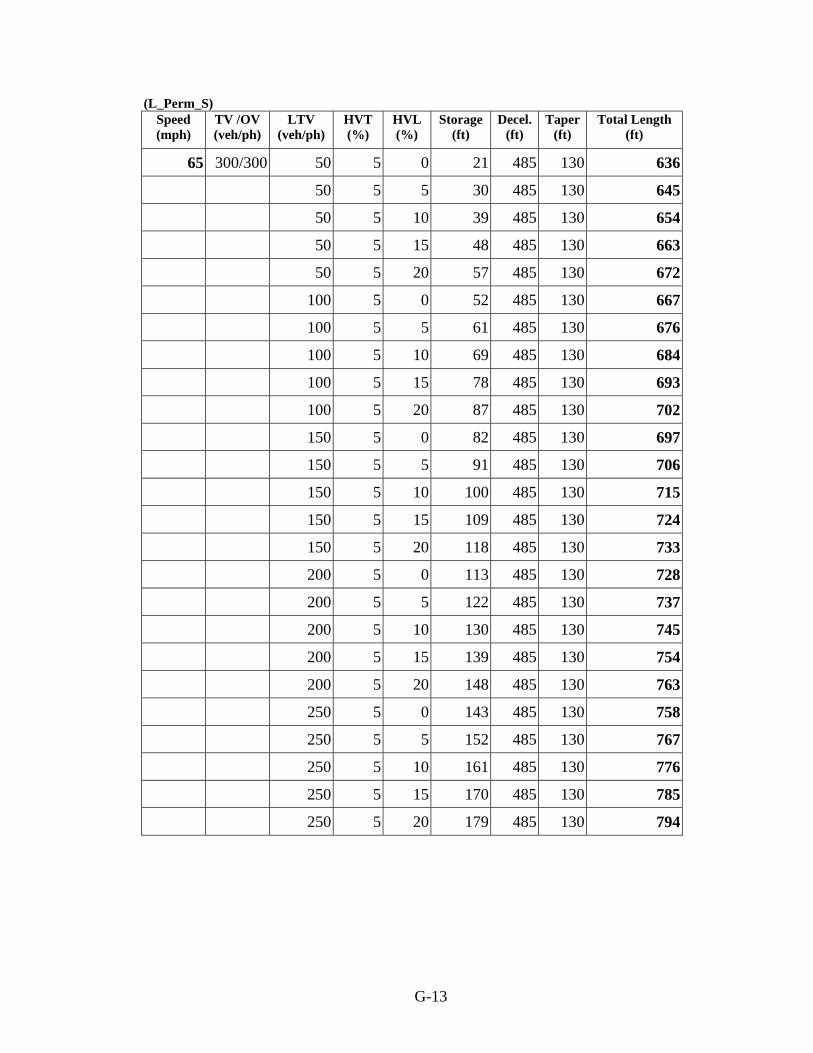
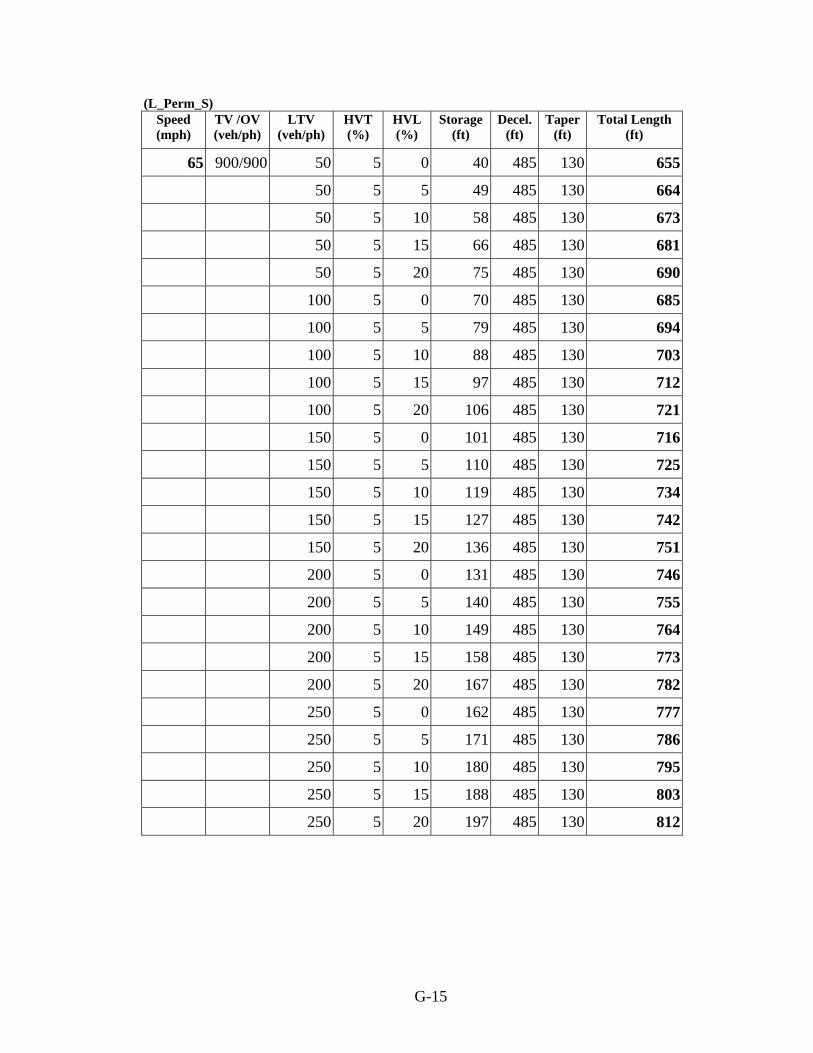
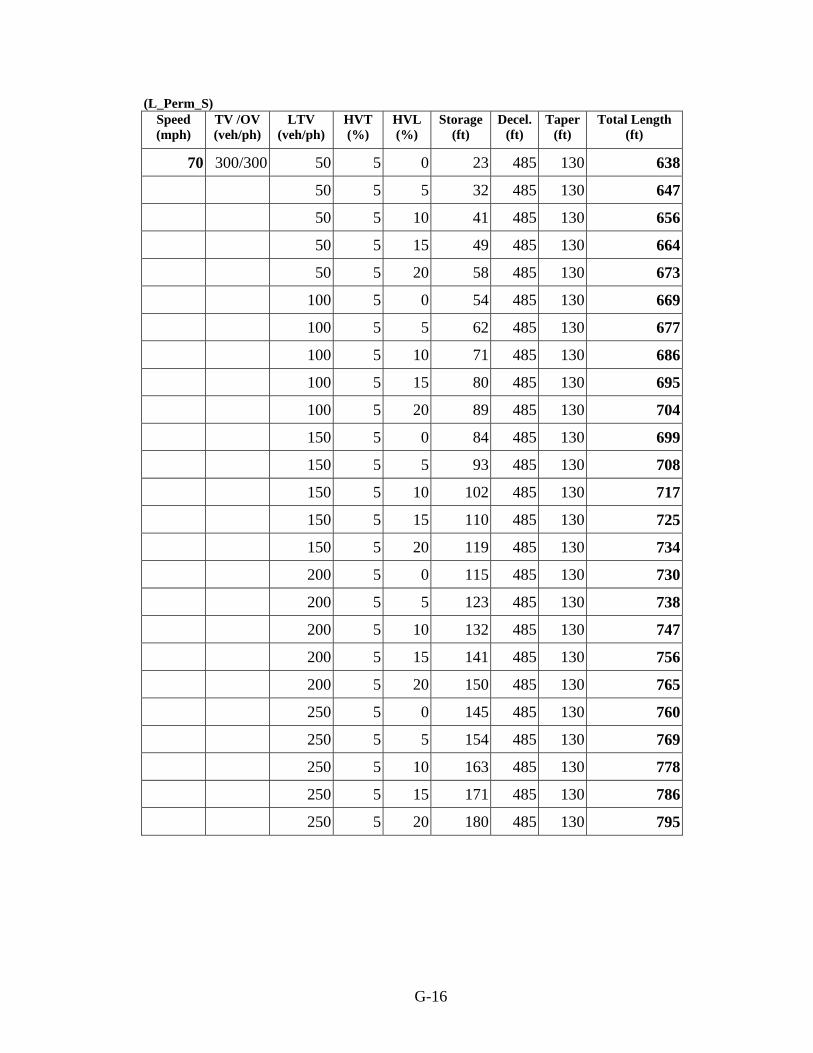
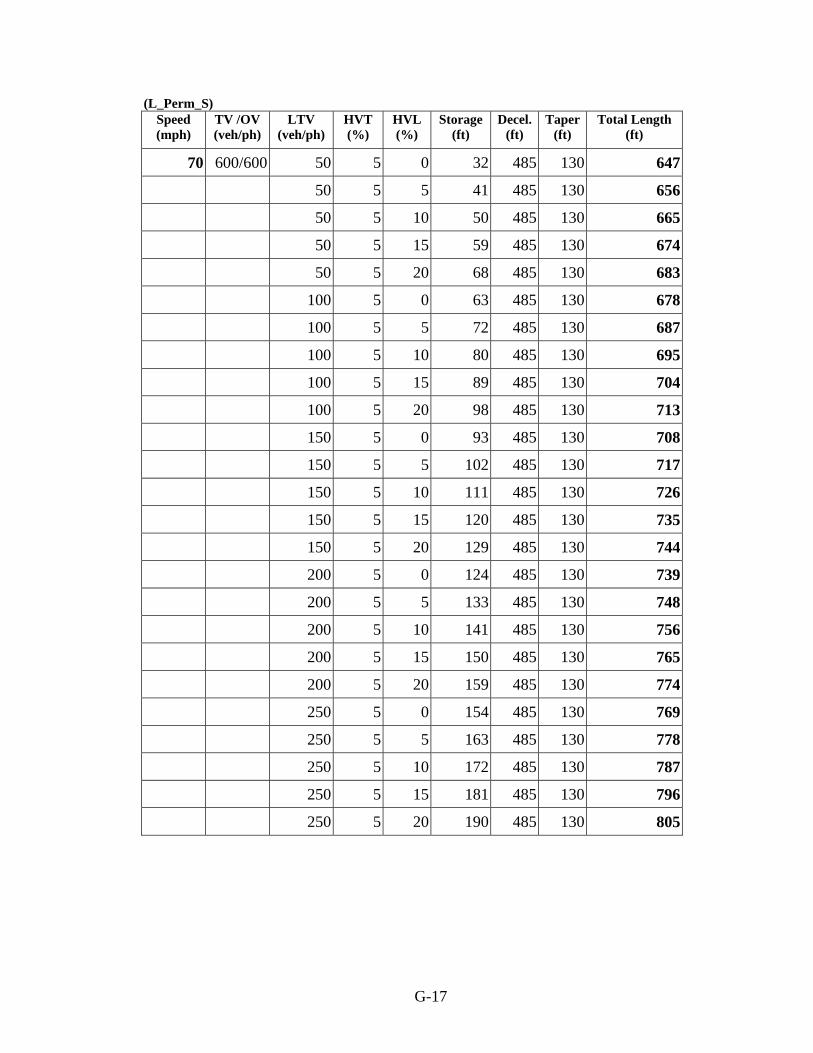
The flow chart of the turn lane length evaluation process is presented in Figure 15. As an example of the calculations, the values of the total lengths for different through and turning volumes and turning vehicles mixture (Heavy Vehicles Through percent is fixed and equals 5, Grade is 0) are presented in tabular form in Appendix G.
The turn lane design practice uses standard turning length, which works well in many cases: the turn lane length is equal to 300’ plus 180’ taper length. In our calculations, we applied the guidelines to determine a deceleration distance that exceeds the abovementioned value for high speeds. It could be possible to reduce the deceleration distance taking into consideration that
− during the peak period, speeds are considerably less than in the off-peak period, and the deceleration length could be less than suggested values;
47
− there is an assumption that some deceleration takes place within the through lane prior entering the turn lane.
At any rate, there is no recommendation on how much the deceleration length could be reduced.
It could happen that the intersection would not have a queue most of the time. This was obtained in two cases of the selected intersections, and the assumption could be that the storage bay is not required. Our models are not based on single cases. To generate the regression models, at least two different intersections from the same category were used. Our guideline would indicate one car length worth of storage. Incidentally, the recommendation of many guidelines is that the minimum storage length should be enough to store two cars. In those cases, engineering judgment needs to be used if the engineer feels that even one-car storage is too much.
The limitation of the results is that the data for this study were collected in the same geographic area. The characteristics of driver behavior and heavy vehicle mixture that were chosen for the calibration of generated models could vary for other regions. Another constraint that should be taken into account is that our results are based on the four-lane arterial road model. We exercised the same generic model by varying parameters on the minor two-lane road of the SR-169 & CR-4 intersection for Protected left turn. The regression analysis shows a good fit to the multivariate equation for the queue length for the arterial four-lane road model with a coefficient of determination of 83.9%. However, we do not have enough data to predict with accuracy the queue length on two-lane arterial roads.
48
IdentifyTurn
IdentifyIntersection
IdentifySpeed
IdentifyMode/Sign
Signalized Unsignalized
Left Right
Signalized Unsignalized
Protected
Permitted
Permitted
Free
Yield
Free
Yield
Yes
No
Yes
No
Sp =< 30
30 < Sp =< 35
50 < Sp =< 55
45 < Sp =< 50
35 < Sp =< 40
40 < Sp =< 45
Sp > 55
add 270
add 320
add 695
add 615
add 540
add 470
add 405
Sp =< 30
30 < Sp =< 40
Sp > 50
45 < Sp =< 50
40 < Sp =< 45
add 270
add 405
add 615
add 540
add 470
Use LTprot formula
Use LTperm formula
Use LTyield formulaUse RTperm formula
Use RTyield formula
Use RTfree_U formula
Use RTfree_S formula
No
No
No
Yes Yes
Yes
No
Yes
Yes
INTERSECTION
Figure 15. The flow chart of the turn lane length evaluation procedure
49
REFERENCES
Chakroborty P., Kikuchi S., and Luszcz M., “Lengths of Left-turn Lanes at Unsignalized Intersections”, Transportation Research Record, Vol. 1500, 1995; pp. 193-201. Dorothy P.W., Maleck T.L., and Nolf S.E., “Operational Aspects of Michigan Design for Divided Highways”, Transportation Research Record, Vol. 1579, 1997; pp. 18-26. Harmelink M., “Volume Warrants for Left-Turn Storage Lanes at Unsignalized Grade Intersections,” Highway Research Record, Vol. 211, 1967; pp. 1-18. Kikuchi S., Chakroborty P., “Analysis of Left-Turn Lane Warrants at Unsignalized T-intersections on Two-lane Roadways”, Transportation Research Record, Vol. 1327, 1991, pp. 80-88. Kikuchi S., Chakroborty P., Vukadinovic K., “Lengths of Left-Turn Lanes at Signalized Intersections”, Transportation Research Record, Vol. 1385, 1993, pp. 162-171. Lertworawanich P. and Elefteriadou L., “Determination of Storage Lengths of Left-Turn Lanes at Unsignalized Intersections Using M/G2/1 Queuing”. Transportation Research Record, Vol. 1847, 2003, pp. 20-28. Long G., “Intervehicle Spacings and Queue Characteristics”, Transportation Research Record, Vol. 1796, Paper No 02-3953, 2002, pp. 86-96. McCoy P.T., Bonneson J.A., Ataullan S., and Eitel D.S, “Guidelines for Right-Turn Lanes on Urban Roadways”, Transportation Research Record 1445, 1994, pp. 130-137 Misaghi P. and Hassan A., “Modeling Operating speed and Speed Differential on Two-Lane Rural Roads”, Journal of Transportation Engineering, June 2005, pp. 408-417. Oppenlander J.C., Oppenlander J.E., “Design Lengths of Left- or Right-Turn Lanes With Separate Signal Phases”, ITE Journal, Vol. 59(7), 1989, pp. 23-26. American Association of State Highway & Transportation Officials. A Policy on the Geometric Design of Highways and Streets. Washington, DC, 2001. American Association of State Highway & Transportation Officials. A Policy on the Geometric Design of Highways and Streets. Washington, DC, 2004. Minnesota Department of Transportation. Roadway Design Manual, May 2001, http://www.dot.state.mn.us/tecsup/rdm/index.html Transportation Research Board. Highway Capacity Manual. Washington, DC, 2000.
50
Institute of Transportation Engineers. Traffic Engineering Handbook, 5th edition, Washington, DC, 1999.
APPENDIX A: QUESTIONNAIRE
A-1
A. QUESTIONNAIRE
Signalized Left Turns
1. How does your agency warrant an exclusive left-turn lane at signalized intersections? (Check all that apply)
Driver complaints Volume of left-turning vehicles Other (please specify)
2. Once warranted, how do you decide on the length of a left-turn lane at a signalized intersection? (Check all that apply)
AASHTO Guidelines State Guidelines (where can it be found)? Guidelines Outlined by Harmelink (1967) Other (please specify):
3. Which of the following parameters does your agency consider in determining the length of a signalized left-turn lane? (Check all that apply)
Volume of left-turn vehicles Volume of opposing vehicles ADT Grade Signal Timing Plan Vehicle mixture Gap size between vehicles Other (please specify)
4. How do you warrant multiple exclusive (left-only) turn lanes at an intersection? (Check all that apply)
AASHTO Guidelines State Guidelines (where can it be found)? Guidelines Outlined by Harmelink (1967) Other (please specify):
5. In your opinion, do the guidelines that your agency use provide efficient turn lane lengths at all signalized intersections? (Please Explain)
A-2
Unsignalized Left Turns
6. How does your agency warrant an exclusive left-turn lane at an unsignalized intersection? (Check all that apply)
Driver complaints Volume of left-turning vehicles Other (please specify)
7. Once warranted, how does your agency decide on the length of a left-turn lane at an unsignalized intersection? (Check all that apply)
AASHTO Guidelines State Guidelines (where can it be found)? Guidelines Outlined by Harmelink (1967) Other (please specify):
8. Which of the following parameters does your agency consider in determining the length of an unsignalized left-turn lane? (Check all that apply)
Volume of left-turn vehicles Volume of opposing vehicles ADT Grade Signal Timing Plan Vehicle mixture Gap size between vehicles Other (please specify)
9. In your opinion, do the guidelines that your agency use provide efficient turn lane lengths at all unsignalized intersections? (Please Explain)
General Comments:
A-3
Signalized Right Turns
1. How does your agency warrant an exclusive right-turn lane at signalized intersections? (Check all that apply)
Driver complaints Volume of right-turning vehicles Other (please specify)
2. Once warranted, how do you decide on the length of a right-turn lane at a signalized intersection? (Check all that apply)
AASHTO Guidelines State Guidelines (where can it be found)? Guidelines Outlined by Harmelink (1967) Other (please specify):
3. Which of the following parameters does your agency consider in determining the length of a signalized right-turn lane? (Check all that apply)
Volume of left-turn vehicles Volume of crossing vehicles ADT Grade Signal Timing Plan Vehicle mixture Gap size between vehicles Other (please specify)
4. How do you warrant multiple exclusive (right-only) turn lanes at an intersection? (Check all that apply)
AASHTO Guidelines State Guidelines (where can it be found?) Guidelines Outlined by Harmelink (1967) Other (please specify):
Comments:
5. In your opinion, do the guidelines that your agency use provide efficient turn lane lengths at all signalized intersections? (Please Explain)
A-4
Unsignalized Right Turns
6. How does your agency warrant an exclusive right-turn lane at an unsignalized intersection? (Check all that apply)
Driver complaints Volume of right-turning vehicles Other (please specify)
7. Once warranted, how does your agency decide on the length of a right-turn lane at an unsignalized intersection? (Check all that apply)
AASHTO Guidelines State Guidelines (where can it be found)? Guidelines Outlined by Harmelink (1967) Other (please specify):
8. Which of the following parameters does your agency consider in determining the length of an unsignalized right-turn lane? (Check all that apply)
Volume of right-turn vehicles Volume of crossing vehicles ADT Grade Signal Timing Plan Vehicle mixture Gap size between vehicles Other (please specify)
9. In your opinion, do the guidelines that your agency uses provide efficient turn lane lengths at all unsignalized intersections? (Please Explain)
General Comments:
Thank you for your time!
APPENDIX B: MAPS
B-1
B. MAPS
B.1. Maps of North of St. Paul Area
Figure B.1. 1 North of St. Paul Area
B-2
Figure B.1. 2. SR-169 & CR-4 Figure B.1. 3. SR 65 & SR 5
Figure B.1. 4. TH 10 at Big Lake Industrial Park Figure B.1. 5. TH 169 & CR 25
Direction SB NB WB EB Description SL ST SR NL NT NR WL WT WR EL ET ER Total Volume 64 527 130 185 773 174 91 170 36 133 192 108Heavy Vehicles 20% 5% 2% 4% 4% 8% 18% 2% 20% 2% 4% 5%Peak Hour Factor Growth Factor Lane Width 12 12 12 12 12 12 12 12 12 12 12 12Storage Length 315 225 975 455 275 275 150 200Storage Length adj. 378 262 1000 475 350 300 187 217Storage Lanes 1 1 1 1 1 1 1 1Turning Speed 20 18 20 18 20 18 20 18Link Speed 45 45 30 30 Cycle Length 300 Right Turn on Red yes yes yes yesLeading Detector 50 475 50 5 475 50 15 125 15 125 50Trailing Detector 2 2 2 2 Headway Factor Minimum Green 5 15 5 15 5 10 5 10 Vehicle extension 3 5.5 3 5.5 3 3.5 3 3.5 Yellow Time 3 6 3 6 3 3 3 3 All-Red Time 1 1.5 1 1.5 0.5 2 0.5 2 Max Green 1 60 120 60 120 40 38 35 60 Max Green 2 60 150 60 150 40 38 35 60 Maximum Split 1 64 127.5 64 127.5 43.5 43 38.5 65 Maximum Split 2 64 157.5 64 157.5 43.5 43 38.5 65 Minimum Split 9 22.5 9 22.5 8.5 15 8.5 15 Minimum Gap 4.5 4.5 Time bef. Reduce 30 30 Time to Reduce 30 30 Ped Walk 7 7 7 7 Ped Don't Walk 16 16 32 32 Turn Type Prot Free Prot Free Prot Prot FreeTotal Split 1 66 129.5 66 129.5 45.5 45 40.5 67
Table D.1. SR-169 & CR-4
D-2
Direction EB WB NB SB Description EL ET ER WL WT WR NL NT NR SL ST SR Total Volume 234 108 155 62 95 45 304 604 83 221 498 36Heavy Vehicles 2% 9% 5% 10% 9% 15% 6% 2% 2% 7% 5% 3%Peak Hour Factor
Headway Factor Cycle Length 110 Minimum Green 5 14 5 14 10 10 Vehicle extension 4 7 4 7 4.5 4.5 Yellow Time 3 5.5 3 5.5 4 4 All-Red Time 2 1.5 2 1.5 2 2 Minimum Split 10 21 10 21 16 16 Minimum Gap 4 4 Time before Reduce 40 40 Time to Reduce 40 40 Ped Walk 7 7 7 7
Ped Don't Walk 25 25 32 32 Turn Type Prot Prot Perm Perm Max Green 1 45 120 45 120 45 45 Max Green 2 150 150 Max Green 3 180 180 Total Split 1 50 127 50 127 51 51 Total Split 2 157 157
Total Split 3 187 187
Table D.6. SR-371 & CR77-CR49
D-6
Direction EB WB NB SB Description EL ET ER WL WT WR NL NT NR SL ST SR
Headway Factor Cycle Length 182 Minimum Green 7 20 7 20 7 10 7 10 Vehicle extension 3 6 3 6 3 4 3 3 Yellow Time 3 4.5 3 4.5 3 3.5 3 3.5 All-Red Time 2 2 2 2 2 2.5 2 2.5 Minimum Split 12 26.5 0 12 26.5 0 12 16 0 12 16 Minimum Gap 4.5 4.5 Time bef. Reduce 30 30 Time to Reduce 20 20 Ped Walk 7 7 7 7
Ped Don't Walk 22 22 21 21 Turn Type Prot Free Prot Free Prot Free Prot Free Max green1 30 80 30 80 30 30 30 30 Max green 2 25 60 25 60 25 25 25 25 Max Green 3 30 80 20 80 20 30 30 20 Total Split 1 35 86.5 35 86.5 35 36 35 36 Total Split 2 30 66.5 0 30 66.5 0 30 31 0 30 31
Total Split 3 35 86.5 0 25 86.5 0 25 36 0 35 26
Table D.8. SR-7 & Louisiana Ave
D-8
Direction EB WB NB SB Description EL ET ER WL WT WR NL NT NR SL ST SR Cars 157 122 80 80 91 50 53 767 36 64 793 79Total Volume 158 125 81 81 93 52 54 774 37 67 799 80