19
Paper VG ’13 Turnover and output for Warehousing and Support Activities Robbert de Ruijter
Paper VG ’13
Turnover and output for Warehousing and Support Activities
Robbert de Ruijter
CBS Den Haag
Henri Faasdreef 312
2492 JP The Hague
P.O. Box 24500
2490 HA The Hague
T +31 70 337 38 00
www.cbs.nl
project number
September 20 2013
The views expressed in this paper are those of the author and do not necessarily reflect the
policies of Statistics Netherlands.
Turnover and output for Warehousing and Support Activities 3
Index
1. Introduction 4
2. Definition of service being collected 5
2.1 Classifications 5
2.2 Warehousing and support activities for transportation 5
3. Unit of measure to be collected 7
4. Market conditions and constraints 8
4.1 Market conditions and constraints 8
4.2 Available statistics 10
4.3 Warehousing and support activities: current market situation 11
5. Standard classification structure and product detail/levels 13
6. Evaluation of standard vs. definition and market conditions 14
7. NA concepts and measurement issues 16
8. Turnover/output data method(s) and criteria for choosing various output methods 17
9. Comparability of turnover/output data with price index practices 18
10. Summary 19
Turnover and output for Warehousing and Support Activities 4
1. Introduction
For centuries now the Netherlands is well known for its longstanding tradition of international
trade, which has led to an extensive logistic sector. Because of its central location in the heart
of Europe the Netherlands is considered to be the logistic gateway to Europe.
Numerous international companies serve their customers throughout Europe and beyond via a
central distribution centre in the Netherlands. It is home to Europe’s largest port, the Port of
Rotterdam and Europe’s third largest cargo airport, Amsterdam Airport Schiphol. The country
is also famous for its excellent multimodal hinterland connections. Logistic service providers
offer a wide-range of logistic activities such as: ocean and air freight forwarding, transport
throughout Europe, warehousing, value adding logistics activities (assembly, (re)labeling) and
value adding services (order entry, tracking & tracing, fiscal representation).
Strong features of the Netherlands are
o Four international airports.
o Main ports Rotterdam and Amsterdam.
o 138,199 km of roads, of which 3,051 km highways.
o 3,013 km of railway.
o 4,688 km of waterways for inland shipping.
o About 18,000 km of pipelines (for gas, oil and refined products).
The sector transportation and storage is very important for the Netherlands in terms of
employment and added value. This paper describes the importance of the division
warehousing and support activities for transportation based on data which are collected and
published by Statistics Netherlands.
Turnover and output for Warehousing and Support Activities 5
2. Definition of service being collected
2.1 Classifications
The Dutch Standard Enterprise Classification (SBI 2008) also called the Standard Industrial
Classification (SIC) is based on the activity classification of the European Union (Nomenclature
statistique des activités économiques dans la Communauté Européenne, NACE) and on the
classification of the United Nations (International Standard Industrial Classification of All
Economic Activities, ISIC).
The first four digits of the SBI are the four digits of NACE and the first two digits of the SBI and
NACE are the same as the first two digits of ISIC. The fifth digit is a Dutch differentiation.
2.2 Warehousing and support activities for transportation
The SIC 52 division includes warehousing and support activities for transportation, such as
operating of transport infrastructure (e.g. airports, harbours, tunnels, bridges, etc.), as well as
cargo handling services and forwarding agencies.
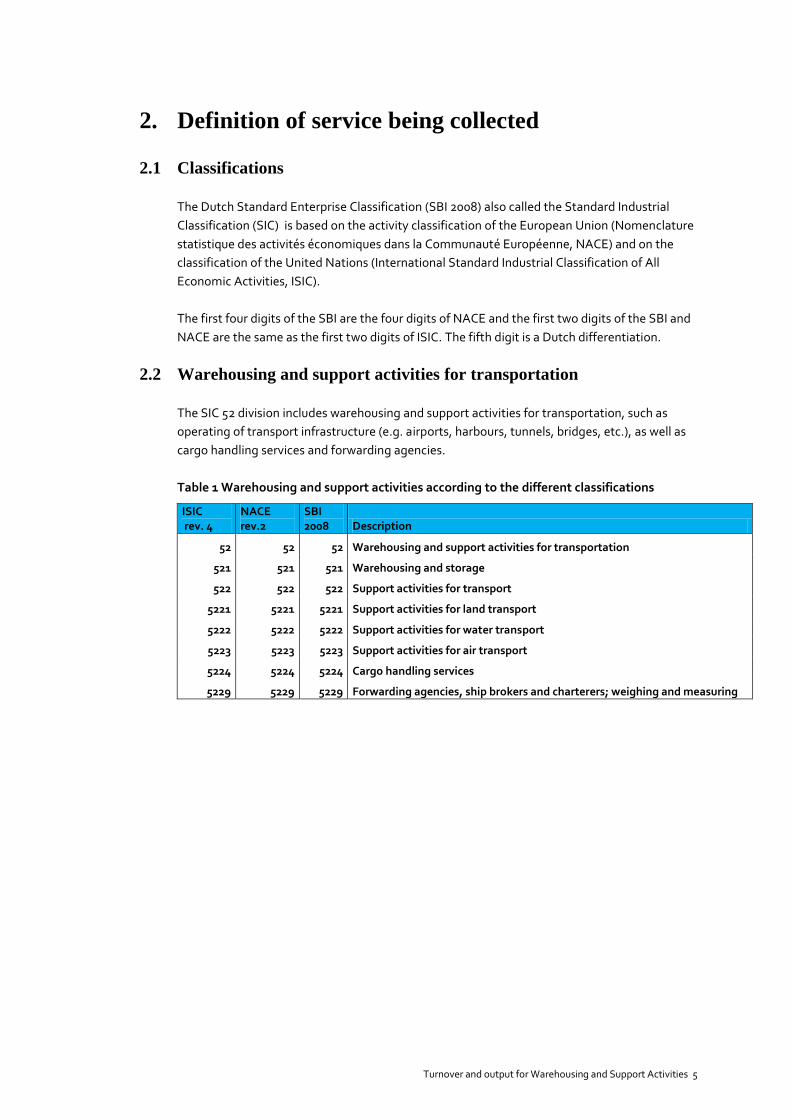
Table 1 Warehousing and support activities according to the different classifications
ISIC rev. 4
NACE rev.2
SBI 2008 Description
52 52 52 Warehousing and support activities for transportation
521 521 521 Warehousing and storage
522 522 522 Support activities for transport
5221 5221 5221 Support activities for land transport
5222 5222 5222 Support activities for water transport
5223 5223 5223 Support activities for air transport
5224 5224 5224 Cargo handling services
5229 5229 5229 Forwarding agencies, ship brokers and charterers; weighing and measuring
Turnover and output for Warehousing and Support Activities 6
The sector transportation and storage employs more than 500 thousand people in 30 thousand
enterprises and has an annual turnover of almost 72 billion euro. The division warehousing and
support activities employs more than 100 thousand people in 5 thousand enterprises. In 2011
the generated turnover was almost 24 billion euro.
Table 2 Overview of the transportation and storage activities in the Netherlands
Period 2011
Subject Enterprises Employees FTE Turnover
Sector/division (SIC 2008) x 1 000 x 1 000 x mln euro
H Transportation and storage 30235 505,5 388,4 71874
52 Warehousing and support activities 5140 103,3 90,1 23542
521 Warehousing and storage 680 23,3 18,6 3677
522 Support activities for transport 4465 80,1 71,5 19865
5221 Support activities for land transport 870 9,4 7,8 799
5222 Support activities for water transport 450 4,7 4,3 1312
5223 Support activities for air transport 125 6,3 5,5 1500
5224 Cargo handling services 370 13,8 12 2609
5229 Agents for transport and weighing 2650 45,9 41,8 13645
Source: Structural Business Statistics, NACE rev. 2, 2011
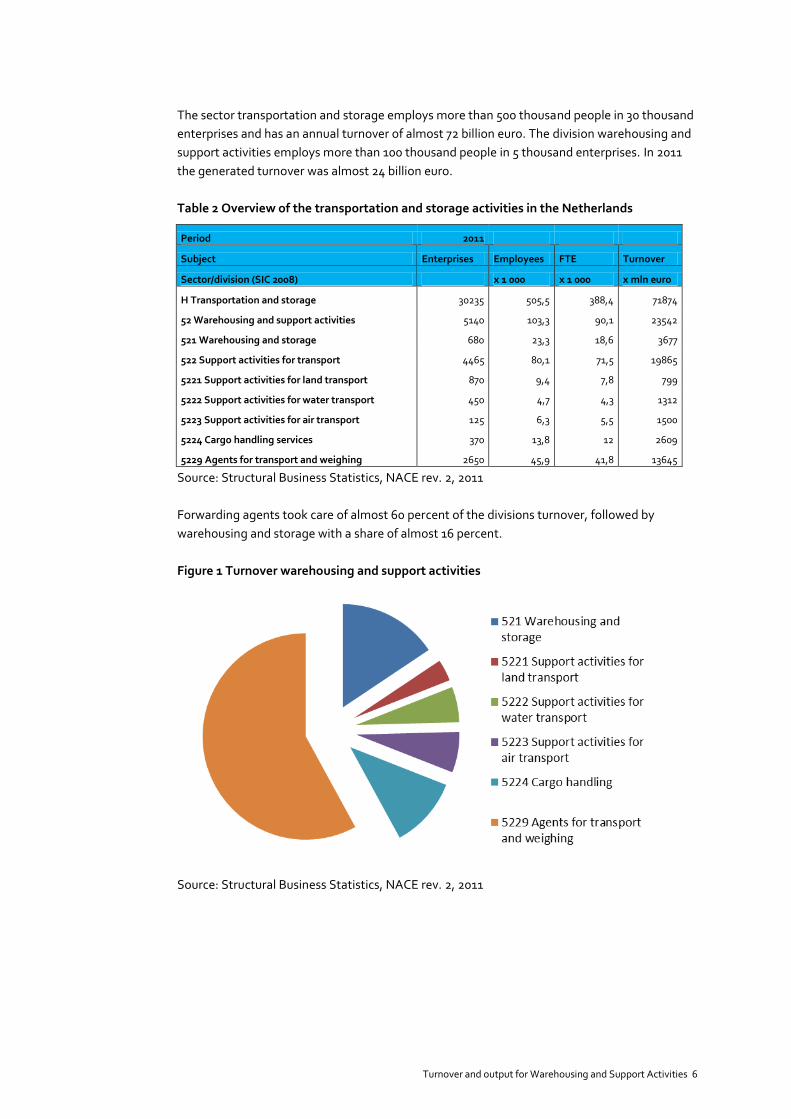
Forwarding agents took care of almost 60 percent of the divisions turnover, followed by
warehousing and storage with a share of almost 16 percent.
Figure 1 Turnover warehousing and support activities
Source: Structural Business Statistics, NACE rev. 2, 2011
Turnover and output for Warehousing and Support Activities 7
3. Unit of measure to be collected
Turnover is measured as net turnover, proceeds from sales, excluding value-added tax (VAT),
deducting discounts, premiums, deposits and freight charges. The enterprise, employing at
least one person for 15 hours work or more, is used as the statistical unit. For the warehousing
and support activities direct data collection is used, by means of electronic questionnaires.
The use of VAT data instead of survey data is already enforced in 9 of the 18 market segments
Statistics Netherlands distinguishes within the sector transportation and storage. At this
moment the use of VAT-data is still under investigation with regard to the division
warehousing and support activities. Implementation of the methodology and publication of the
figures on Statline, the online database of Statistics Netherlands, is expected for the year 2014.
Turnover and output for Warehousing and Support Activities 8
4. Market conditions and constraints
4.1 Market conditions and constraints
Because of the longstanding tradition of international trade an important logistic support
sector developed over the years in the Netherlands. The two main Dutch gateways, the Port of
Rotterdam and Amsterdam Airport, combined with the excellent multimodal hinterland
connections are ideal to access the European market. With a turnover of almost 24 billion euro
the division warehousing and support activities is a very important economic activity in the
Netherlands. In 2011 more than 5 thousand companies employed 103 thousand people of
whom about 46 thousand in the forwarding agency business.
Economic crisis
Since the economic crisis, which started at the end of 2008, the golden years ended. Turnover
growth rates declined steadily, however, not as strong as compared to other branches like for
example road transportation in building materials. Two main reasons are responsible for this.
First, many enterprises in the warehousing and support activities area focus on different
markets, both foreign and domestic. Second, most of the companies in warehousing and
support activities are service providers with a wide range of services. Therefore these
companies are less sensitive to economic fluctuations.
Maasvlakte 2
Already in the 1970s, economists predicted that the Port of Rotterdam would one day be too
small1. At that time however, the newly completed Maasvlakte could still keep the port going
for some time to come. Concrete plans to expand the port even further have existed since
1993. This finally resulted in a plan to expand the current Maasvlakte to the west.
The construction of Maasvlakte 2 started in 2008 and aimed at 2014 for the processing of2.
Maasvlakte 2 will be a direct extension of the existing Maasvlakte and will have access to all
connections with the European hinterland. Maasvlakte 2 will be a new top location in the heart
of the European market, with 1,000 hectares of space for deep-sea related container trans-
shipment, distribution and chemical industry. These activities are of great interest for the
industrial sites located near the deep waterways of Maasvlakte 2. Nowhere else in Europe will
the largest ships in the world be able to moor 24 hours a day.
The expansion of the port is considered to be a huge stimulus for the warehousing and support
activities. However, on the short term, it can also result in an overcapacity which causes low
price levels.
1 Source: www.Maasvlakte2.com 2 Source: www.PortofRotterdam.com
Turnover and output for Warehousing and Support Activities 9
Monitor Logistics and Supply Chain Management
To increase the added value of the logistic sector in the Netherlands, the Ministry of
Infrastructure and the Environment commissioned Statistics Netherlands to collect en publish
specific figures about the logistic sector.
The policy goal is to increase the added value of the sector without raising extra burden like
road congestion. In other words the Netherlands want to earn more money by innovating the
sector. The report ‘Monitor Logistiek & Supply Chain Management can be found on the
website of Statistics Netherlands (only available in Dutch).
The main idea is to create a relative shift from traditional transportation (low-tech) to support
services (high-tech) as an addition, not as a substitute. The target is to increase the shares of
the so called high-tech services like Value Added Logistics and Services (VAL/VAS) and supply
chain management services3.
Top sector Logistics
The transport sector is showing a worldwide growth. Customer demand for quality is high. The
Dutch logistic sector aims to use this development to obtain a leading global position. This
ambition requires innovation. The government has earmarked the logistics sector as a top
sector in view of its current strong position and scope for growth. The government, industry
and science will target investment in this sector4. Strategic partnerships and cooperation in the
supply chain, as well as vertically as horizontally, in the logistic sector is considered to be the
road to success for innovation and growth.
3 Source: Monitor Logistiek en Supply Chain Management: www.cbs.nl 4 Source: www.government.nl
Turnover and output for Warehousing and Support Activities 10
4.2 Available statistics
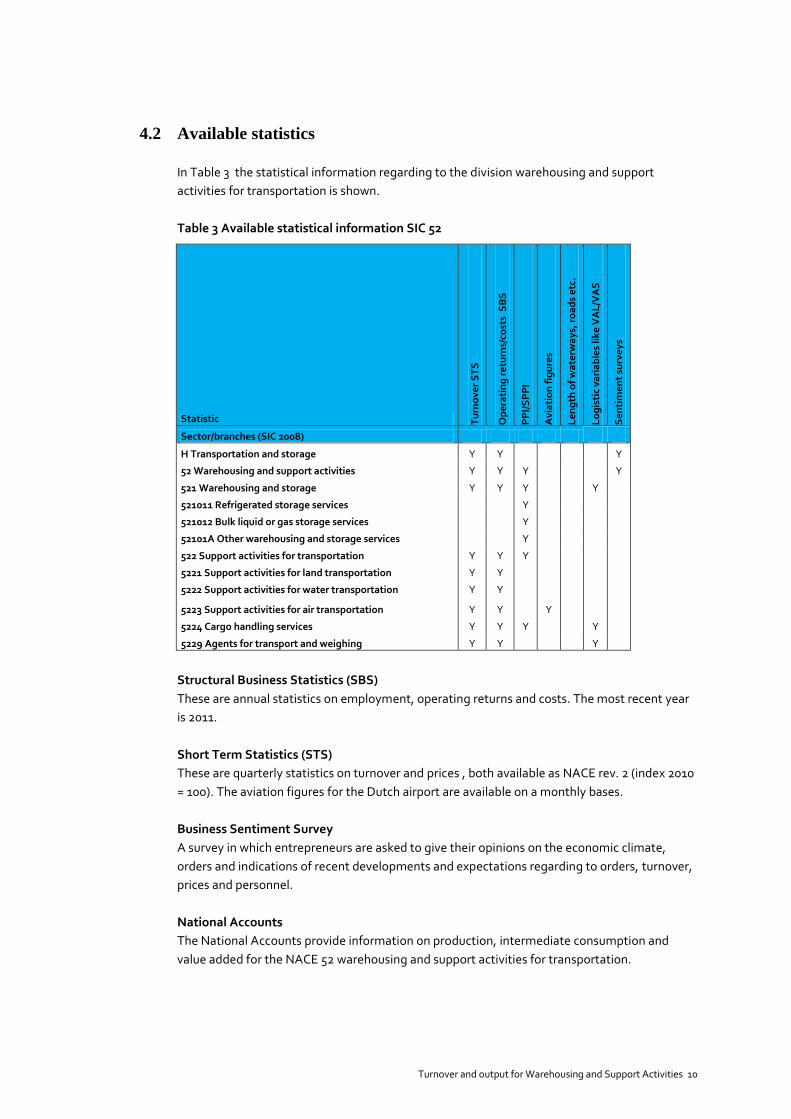
In Table 3 the statistical information regarding to the division warehousing and support
activities for transportation is shown.
Table 3 Available statistical information SIC 52
Statistic Tu
rno
ver
ST
S
Op
era
tin
g r
etu
rns/
cost
s S
BS
PP
I/S
PP
I
Avi
ati
on
fig
ure
s
Le
ng
th o
f w
ate
rwa
ys,
ro
ad
s e
tc.
Lo
gis
tic
vari
ab
les
like
VA
L/V
AS
Se
nti
me
nt
surv
ey
s
Sector/branches (SIC 2008)
H Transportation and storage Y Y
Y
52 Warehousing and support activities Y Y Y
Y
521 Warehousing and storage Y Y Y
Y
521011 Refrigerated storage services
Y
521012 Bulk liquid or gas storage services
Y
52101A Other warehousing and storage services
Y
522 Support activities for transportation Y Y Y
5221 Support activities for land transportation Y Y
5222 Support activities for water transportation Y Y
5223 Support activities for air transportation Y Y Y
5224 Cargo handling services Y Y Y
Y
5229 Agents for transport and weighing Y Y Y
Structural Business Statistics (SBS)
These are annual statistics on employment, operating returns and costs. The most recent year
is 2011.
Short Term Statistics (STS)
These are quarterly statistics on turnover and prices , both available as NACE rev. 2 (index 2010
= 100). The aviation figures for the Dutch airport are available on a monthly bases.
Business Sentiment Survey
A survey in which entrepreneurs are asked to give their opinions on the economic climate,
orders and indications of recent developments and expectations regarding to orders, turnover,
prices and personnel.
National Accounts
The National Accounts provide information on production, intermediate consumption and
value added for the NACE 52 warehousing and support activities for transportation.
Turnover and output for Warehousing and Support Activities 11
4.3 Warehousing and support activities: current market situation
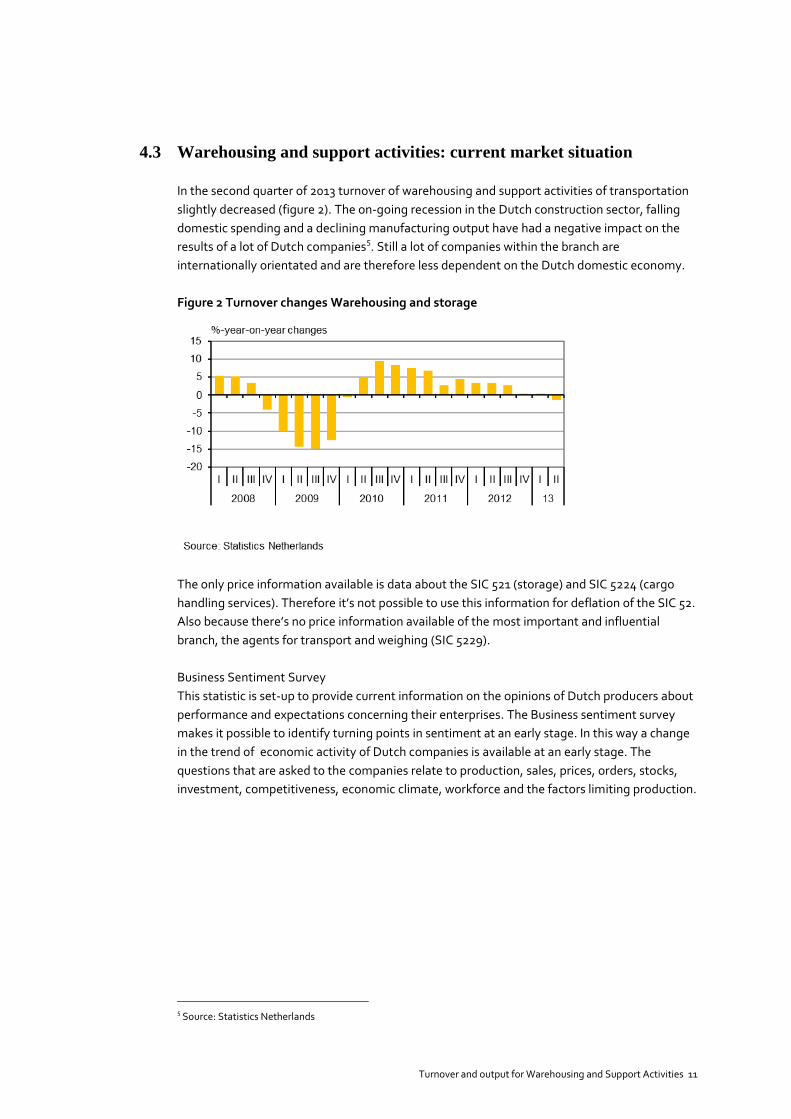
In the second quarter of 2013 turnover of warehousing and support activities of transportation
slightly decreased (figure 2). The on-going recession in the Dutch construction sector, falling
domestic spending and a declining manufacturing output have had a negative impact on the
results of a lot of Dutch companies5. Still a lot of companies within the branch are
internationally orientated and are therefore less dependent on the Dutch domestic economy.
Figure 2 Turnover changes Warehousing and storage
The only price information available is data about the SIC 521 (storage) and SIC 5224 (cargo
handling services). Therefore it’s not possible to use this information for deflation of the SIC 52.
Also because there’s no price information available of the most important and influential
branch, the agents for transport and weighing (SIC 5229).
Business Sentiment Survey
This statistic is set-up to provide current information on the opinions of Dutch producers about
performance and expectations concerning their enterprises. The Business sentiment survey
makes it possible to identify turning points in sentiment at an early stage. In this way a change
in the trend of economic activity of Dutch companies is available at an early stage. The
questions that are asked to the companies relate to production, sales, prices, orders, stocks,
investment, competitiveness, economic climate, workforce and the factors limiting production.
5 Source: Statistics Netherlands
Turnover and output for Warehousing and Support Activities 12
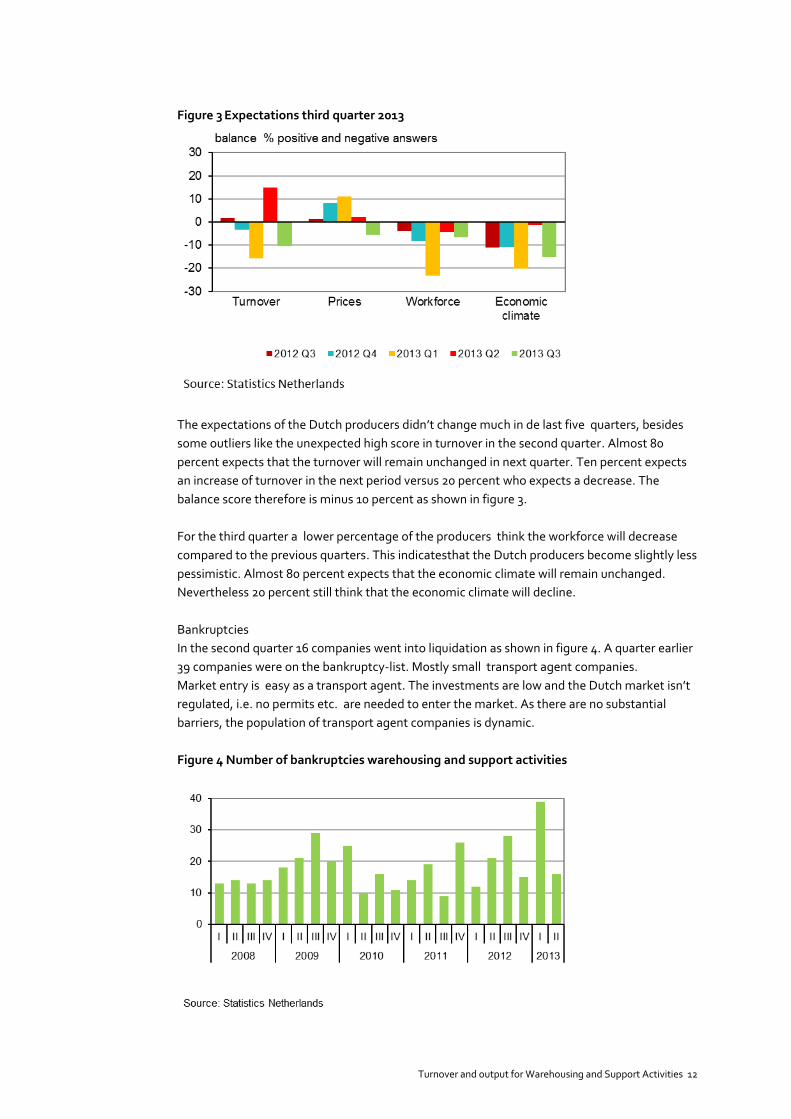
Figure 3 Expectations third quarter 2013
The expectations of the Dutch producers didn’t change much in de last five quarters, besides
some outliers like the unexpected high score in turnover in the second quarter. Almost 80
percent expects that the turnover will remain unchanged in next quarter. Ten percent expects
an increase of turnover in the next period versus 20 percent who expects a decrease. The
balance score therefore is minus 10 percent as shown in figure 3.
For the third quarter a lower percentage of the producers think the workforce will decrease
compared to the previous quarters. This indicatesthat the Dutch producers become slightly less
pessimistic. Almost 80 percent expects that the economic climate will remain unchanged.
Nevertheless 20 percent still think that the economic climate will decline.
Bankruptcies
In the second quarter 16 companies went into liquidation as shown in figure 4. A quarter earlier
39 companies were on the bankruptcy-list. Mostly small transport agent companies.
Market entry is easy as a transport agent. The investments are low and the Dutch market isn’t
regulated, i.e. no permits etc. are needed to enter the market. As there are no substantial
barriers, the population of transport agent companies is dynamic.
Figure 4 Number of bankruptcies warehousing and support activities
Turnover and output for Warehousing and Support Activities 13
5. Standard classification structure and product
detail/levels
Regarding to the STS and SBS statistics there is no further breakdown into product categories,
except for the SPPI of SIC 521 into 521011, 521012 and 5210aA as shown in table 3.
Turnover and output for Warehousing and Support Activities 14
6. Evaluation of standard vs. definition and market
conditions
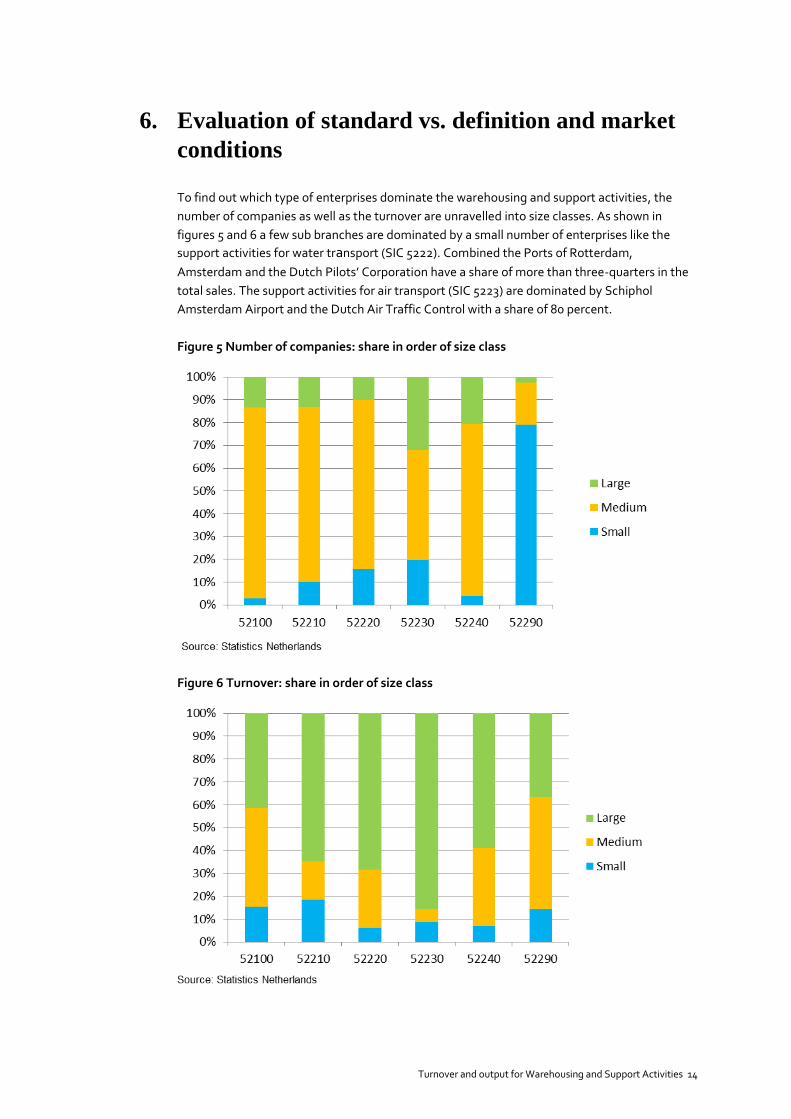
To find out which type of enterprises dominate the warehousing and support activities, the
number of companies as well as the turnover are unravelled into size classes. As shown in
figures 5 and 6 a few sub branches are dominated by a small number of enterprises like the
support activities for water transport (SIC 5222). Combined the Ports of Rotterdam,
Amsterdam and the Dutch Pilots’ Corporation have a share of more than three-quarters in the
total sales. The support activities for air transport (SIC 5223) are dominated by Schiphol
Amsterdam Airport and the Dutch Air Traffic Control with a share of 80 percent.
Figure 5 Number of companies: share in order of size class
Figure 6 Turnover: share in order of size class
Turnover and output for Warehousing and Support Activities 15
Table 4 shows, amongst others, the shares of turnover per size class at the level of SIC 52. As
earlier said, the large enterprises have a dominant share of 60 to 75 percent in the figures of all
variables. The share of almost 9 percent in personnel costs of the small enterprises and a share
of 15 percent in turnover is remarkable. The personnel costs per person employed in FTE are
the lowest for the small sized enterprises with 41 thousand euro per fte, 55 thousand for the
medium size enterprises and more than 60 thousand euro for the large enterprises.
Table 4 SIC 52: shares in order of size class
Warehousing and support activities for transportation Enterprises
Small Medium Large
2011 %
Business turnover, net 15,0 26,3 58,8
Persons employed, annual average 13,4 17,1 69,6
Persons employed, annual average in FTE 12,4 17,3 70,3
Personnel costs 8,9 16,8 74,3
Operating costs 11,5 20,3 68,3
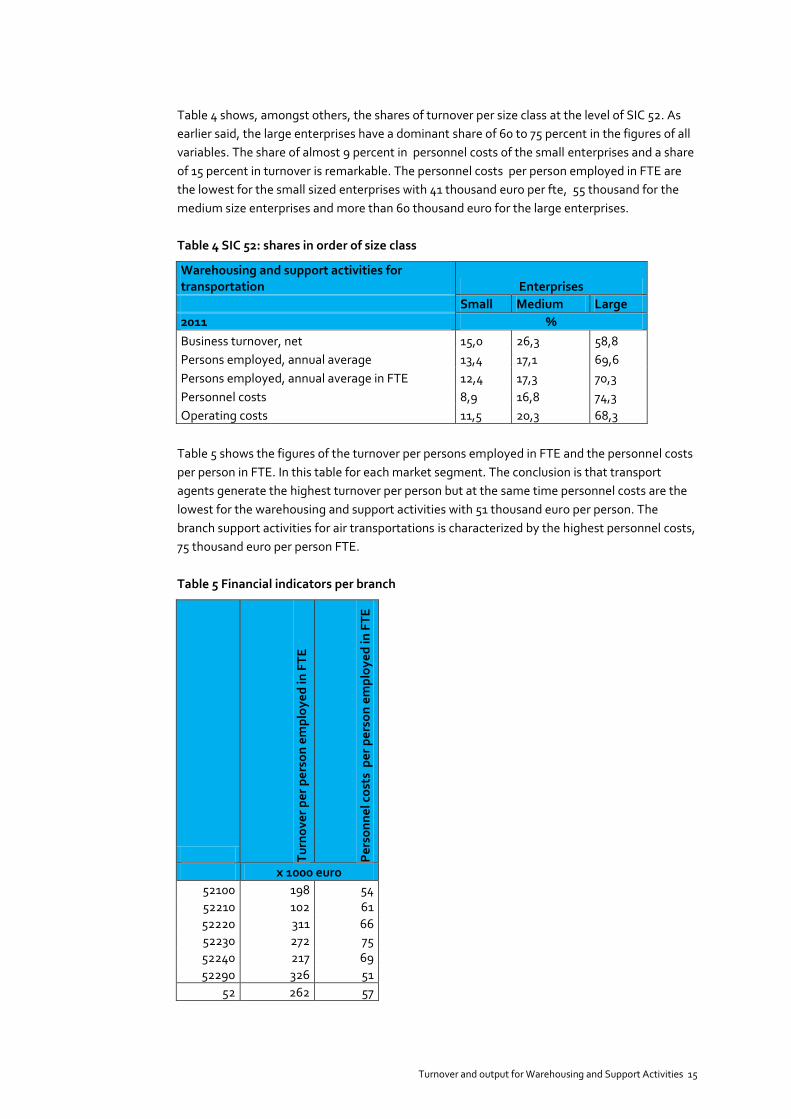
Table 5 shows the figures of the turnover per persons employed in FTE and the personnel costs
per person in FTE. In this table for each market segment. The conclusion is that transport
agents generate the highest turnover per person but at the same time personnel costs are the
lowest for the warehousing and support activities with 51 thousand euro per person. The
branch support activities for air transportations is characterized by the highest personnel costs,
75 thousand euro per person FTE.
Table 5 Financial indicators per branch
Tu
rno
ver
pe
r p
ers
on
em
plo
ye
d in
FT
E
Pe
rso
nn
el c
ost
s p
er
pe
rso
n e
mp
loy
ed
in F
TE
x 1000 euro
52100 198 54
52210 102 61
52220 311 66
52230 272 75
52240 217 69
52290 326 51
52 262 57
Turnover and output for Warehousing and Support Activities 16
7. NA concepts and measurement issues
The National Accounts provide statistical information on production, intermediate
consumption and value added for warehousing and support activities as shown in table 6. The
National Accounts use source statistics like the STS turnover figures to compile macro figures.
The methodology used in source statistics may differ from the concepts used in the National
Accounts. Some items which are not covered by source statistics are estimated and adjusted so
everything will perfectly fit. That’s why the figures of source statistics and the National Account
may differ.
Table 6 Production, intermediate consumption and value added SIC 52
Production basic prices Intermediate consumption (-) Gross value added basic prices
mln euro mln euro mln euro
2010 12525 5068 7457
2011* 13195 5249 7946
2012* 13499 5305 8194
* provisional figures
In table 7 three different outcomes are shown on turnover changes. The STS figures and those
of the National Accounts are nearly the same because the STS turnover growth rates are being
used as inputs for the calculation of the production level. The National Accounts calculate the
production level by multiplying the STS turnover growth rate with the production level of the
previous year.
The growth rate of the SBS turnover differs with respect to the STS turnover growth rate as the
methodologies are not similar. This is caused by the fact that the user purposes of these
statistics differ. SBS provides structural information, STS provides estimations of the growth
rates. Therefore the information of the SBS statistics are being used to fine-tuning the
structures within the already determined new production level.
The STS turnover statistics main purpose is to cover the economic market trends on the short
term. So, therefore non-real population shifts are excluded in the STS turnover statistic as well
as in the National Accounts. In the SBS however these shifts are included and may cause a
differences in growth rates.
Table 7 Turnover changes STS, SBS and NA SIC 52
Period STS SBS National Accounts
2010 5,6 4,9 5,6
2011 5,4 9,9 5,3
2012 2,4
2,3
The goal for the near future is to use a similar methodology for the STS and SBS statistics
regarding to Warehousing and support activities, so the output must be near the same. The
solution for reducing different outcomes is the use of VAT to estimate a quarterly turnover
level. Which can be used to calculate the growth rate per quarter and four quarters of a year
added up means that the turnover level is already known. The result will be that the STS
turnover changes are equal to the SBS turnover changes and the structural information will fit
without major adjustments. This methodology is already implemented for certain statistics like
the Wholesale trade and the commercial services.
Turnover and output for Warehousing and Support Activities 17
8. Turnover/output data method(s) and criteria for
choosing various output methods
Statistics Netherlands doesn’t have a survey to collect ‘volume changes’ for warehousing and
support activities. Volume changes are estimated by using price information and turnover data.
The turnover data is considered to be the primary variable, so only the price data can be
adjusted.
The only available price data (SPPI) which can directly linked to SIC 52 turnover data is
information about the SIC 521 (storage) and SIC 5224 (cargo handling services). Therefore it’s
not possible to use this information for direct deflation purposes of SIC 52. Also because there’s
no price information available of the most important and influential branch with a turnover
share of 60 percent, the agents for transport and weighing (SIC 5229). The populations of both
statistics match quite well.
The National Accounts appr0ximates volumes by using the available price data combined with
additional information of for instance wages as determined in collective labour agreements,
CPI data, external price data, volume figures from airports, ports etc.
Volume figures are published at a 2/4-digit level (SIC 52, SIC 5222, SIC 5223 and SIC 52 other
services) and on an annual bases.

Turnover and output for Warehousing and Support Activities 18
9. Comparability of turnover/output data with price
index practices
See chapter 8.
Turnover and output for Warehousing and Support Activities 19
10. Summary
To collect STS turnover data primary data collection is used for the SIC 52. The use of VAT data
regarding to warehousing and support activities is under investigation. Implementation of the
methodology and publication of the figures on Statline, the online database of Statistics
Netherlands, is expected for the year 2014.
The only price information currently available is information about the SIC 521 (storage) and
SIC 5224 (cargo handling services). Therefore it’s not possible to use this information for direct
deflation of the SIC 52. Also because there’s no price information available of the most
important and influential branch, the agents for transport and weighing (SIC 5229).
The National Accounts however estimate volumes by using the available price data combined
with additional information of for instance wages as determined in collective labour, CPI data,
external price data, volume figures from airports, ports etc.
Volume figures are published at a 2/4-digit level (SIC 52, SIC 5222, SIC 5223 and SIC 52 other
services) and on an annual bases.
To increase the usability and reliability of the volume figures of warehousing and support
activities it’s desirable to obtain more price information with respect to the sub branches of
SIC 52.


