Turnover and storage of C and N in five density fractions from California annual grassland surface soils W. T. Baisden 1 and R. Amundson Ecosystem Sciences Division, Department of ESPM, University of California, Berkeley, Berkeley, California, USA A. C. Cook Center for Accelerator Mass Spectrometry, Lawrence Livermore National Laboratory, Livermore, California, USA D. L. Brenner Ecosystem Sciences Division, Department of ESPM, University of California, Berkeley, Berkeley, California, USA Received 31 October 2001; revised 5 July 2002; accepted 31 July 2002; published 6 December 2002. [1] We measured 14 C/ 12 C in density fractions from soils collected before and after atmospheric thermonuclear weapons testing to examine soil organic matter (SOM) dynamics along a 3 million year California soil chronosequence. The mineral-free particulate organic matter (FPOM; <1.6 g cm 3 ) mainly contains recognizable plant material, fungal hyphae, and charcoal. Mineral-associated light fractions (1.6–2.2 g cm 3 ) display partially or completely humified fine POM, while the dense fraction (>2.2 g cm 3 ) consists of relatively OM-free sand and OM-rich clays. Three indicators of decomposition (C:N, d 13 C, and d 15 N) all suggest increasing SOM decomposition with increasing fraction density. The D 14 C-derived SOM turnover rates suggest that 90% of FPOM turns over in <10 years. The four mineral-associated fractions contain 69–86% ‘‘stabilized’’ (decadal) SOM with the remainder assumed to be ‘‘passive’’ (millenial) SOM. Within each soil, the four mineral-associated fractions display approximately the same residence time (34–42 years in 200 kyr soil, 29–37 years in 600 kyr soil, and 18–26 years in 1–3 Myr soils), indicating that a single stabilized SOM ‘‘pool’’ exists in these soils and may turn over primarily as a result of soil disruption. INDEX TERMS: 1615 Global Change: Biogeochemical processes (4805); 1694 Global Change: Instruments and techniques; 1803 Hydrology: Anthropogenic effects; 1851 Hydrology: Plant ecology; 9350 Information Related to Geographic Region: North America; KEYWORDS: Soil organic matter turnover, density fractionation, radiocarbon, stable isotopes, decomposition Citation: Baisden, W. T., R. Amundson, A. C. Cook, and D. L. Brenner, Turnover and storage of C and N in five density fractions from California annual grassland surface soils, Global Biogeochem. Cycles, 16(4), 1117, doi:10.1029/2001GB001822, 2002. 1. Introduction [2] Hierarchies of chemical and physical bonding bet- ween soil organic matter (SOM) and mineral soil particles play a critical, and often dominant, role in determining whether the soil retains C inputs for a period of weeks, months, years, decades, centuries, or millennia [Oades, 1989, 1995; Tisdall and Oades, 1982; Torn et al., 1997]. Of the world’s major ecosystem types, grassland and agricultural systems best exhibit the control of soil structure, texture, and mineralogy over SOM dynamics [Burke et al., 1989; Carter, 1996; Kooistra and van Noordwijk, 1996]. In fact, the two can provide a valuable contrast: grassland soils are noted for their high SOM contents and strong soil structure, while agricultural soils have lost considerable SOM compared to their uncultivated counterparts as a result of the destruction of soil structure via tillage [Carter, 1996; Davidson and Ackerman, 1993; Elliott, 1986]. [3] SOM can be restored to agricultural soil over a period of years by careful management including conservation tillage [Beare et al., 1994; Karlen and Cambardella, 1996; Lal and Kimble, 1997]. Agricultural management for increased SOM may improve the productivity and function of agroecosystems, reduce nutrient losses from the system, and sequester C from atmospheric CO 2 . In addition, the return of degraded agricultural land to grass- land and forest systems presents similar benefits. While these possibilities are all beneficial, best management deci- sions require understanding of the processes controlling SOM storage and turnover. [4] Many studies and reviews provide a useful conceptual understanding of the role soil structure plays in SOM GLOBAL BIOGEOCHEMICAL CYCLES, VOL. 16, NO. 4, 1117, doi:10.1029/2001GB001822, 2002 1 Now at Landcare Research, Massey University, Palmerston North, New Zealand. Copyright 2002 by the American Geophysical Union. 0886-6236/02/2001GB001822$12.00 64 - 1
Transcript
Turnover and storage of C and N in five density fractions from
California annual grassland surface soils
W. T. Baisden1 and R. AmundsonEcosystem Sciences Division, Department of ESPM, University of California, Berkeley, Berkeley, California, USA
A. C. CookCenter for Accelerator Mass Spectrometry, Lawrence Livermore National Laboratory, Livermore, California, USA
D. L. BrennerEcosystem Sciences Division, Department of ESPM, University of California, Berkeley, Berkeley, California, USA
Received 31 October 2001; revised 5 July 2002; accepted 31 July 2002; published 6 December 2002.
[1] We measured 14C/12C in density fractions from soils collected before and afteratmospheric thermonuclear weapons testing to examine soil organic matter (SOM)dynamics along a 3 million year California soil chronosequence. The mineral-freeparticulate organic matter (FPOM; <1.6 g cm�3) mainly contains recognizable plantmaterial, fungal hyphae, and charcoal. Mineral-associated light fractions (1.6–2.2 gcm�3) display partially or completely humified fine POM, while the dense fraction(>2.2 g cm�3) consists of relatively OM-free sand and OM-rich clays. Three indicators ofdecomposition (C:N, d13C, and d15N) all suggest increasing SOM decomposition withincreasing fraction density. The D14C-derived SOM turnover rates suggest that �90% ofFPOM turns over in <10 years. The four mineral-associated fractions contain 69–86%‘‘stabilized’’ (decadal) SOM with the remainder assumed to be ‘‘passive’’ (millenial)SOM. Within each soil, the four mineral-associated fractions display approximately thesame residence time (34–42 years in 200 kyr soil, 29–37 years in 600 kyr soil, and18–26 years in 1–3 Myr soils), indicating that a single stabilized SOM ‘‘pool’’ existsin these soils and may turn over primarily as a result of soil disruption. INDEX TERMS:
1615 Global Change: Biogeochemical processes (4805); 1694 Global Change: Instruments and techniques;
1803 Hydrology: Anthropogenic effects; 1851 Hydrology: Plant ecology; 9350 Information Related to
Geographic Region: North America; KEYWORDS: Soil organic matter turnover, density fractionation,
radiocarbon, stable isotopes, decomposition
Citation: Baisden, W. T., R. Amundson, A. C. Cook, and D. L. Brenner, Turnover and storage of C and N in five density fractions
from California annual grassland surface soils, Global Biogeochem. Cycles, 16(4), 1117, doi:10.1029/2001GB001822, 2002.
1. Introduction
[2] Hierarchies of chemical and physical bonding bet-ween soil organic matter (SOM) and mineral soil particlesplay a critical, and often dominant, role in determiningwhether the soil retains C inputs for a period of weeks,months, years, decades, centuries, or millennia [Oades,1989, 1995; Tisdall and Oades, 1982; Torn et al., 1997].Of the world’s major ecosystem types, grassland andagricultural systems best exhibit the control of soil structure,texture, and mineralogy over SOM dynamics [Burke et al.,1989; Carter, 1996; Kooistra and van Noordwijk, 1996]. Infact, the two can provide a valuable contrast: grassland soils
are noted for their high SOM contents and strong soilstructure, while agricultural soils have lost considerableSOM compared to their uncultivated counterparts as a resultof the destruction of soil structure via tillage [Carter, 1996;Davidson and Ackerman, 1993; Elliott, 1986].[3] SOM can be restored to agricultural soil over a period
of years by careful management including conservationtillage [Beare et al., 1994; Karlen and Cambardella,1996; Lal and Kimble, 1997]. Agricultural managementfor increased SOM may improve the productivity andfunction of agroecosystems, reduce nutrient losses fromthe system, and sequester C from atmospheric CO2. Inaddition, the return of degraded agricultural land to grass-land and forest systems presents similar benefits. Whilethese possibilities are all beneficial, best management deci-sions require understanding of the processes controllingSOM storage and turnover.[4] Many studies and reviews provide a useful conceptual
understanding of the role soil structure plays in SOM
GLOBAL BIOGEOCHEMICAL CYCLES, VOL. 16, NO. 4, 1117, doi:10.1029/2001GB001822, 2002
1Now at Landcare Research, Massey University, Palmerston North,New Zealand.
Copyright 2002 by the American Geophysical Union.0886-6236/02/2001GB001822$12.00
64 - 1
storage and turnover [Carter and Stewart, 1996; Oades,1989; Tisdall and Oades, 1982; VanVeen and Kuikman,1990]. Nevertheless, these studies provide only a limitedquantification of SOM turnover rates. Efforts to movetoward a truly quantitative and predictive understandingare impeded by the complicated hierarchical nature of soilstructure. That is, humic materials adhere to clay platelets toform small microaggregates, which are bound together withfine silt particles to form somewhat larger microaggregates.Successively larger mineral particles and aggregates arebound together as the binding agents change from humicmaterials to fine roots and fungal hyphae when aggregatesizes exceed �200 mm [Kooistra and van Noordwijk, 1996;Oades, 1993, 1995; Oades and Waters, 1991]. Recently,methods have successfully utilized aggregate size and/ordensity to isolate SOM playing different roles in theaggregate hierarchy [e.g., Beare et al., 1994; Cambardellaand Elliott, 1993, 1994; Golchin et al., 1995a, 1995b].These methods describe the strength or type of mineral-organic association; the strongest mineral-organic bonds arebelieved to exist at the smallest scales and require the mostenergy to disrupt. Remaining methodological problemsinclude: (1) comparability between different methods [Car-ter and Gregorich, 1996], and (2) failure of individualmethods to yield reproducible results in different soil types[Six et al., 2000]. Improved understanding of SOM dynam-ics requires greater characterization of the processes, whichcontrol the flow of SOM into and out of soil fractions withdifferent degrees of mineral-association.[5] To characterize the flows of SOM into and out of a
series of detailed soil density fractions, we apply indicespreviously used to study SOM in whole soils or soilfractions. First, to characterize the processes responsiblefor the flow of SOM into mineral-associated SOM pools,we measure C:N, d13C, and d15N. These tracers generallyreflect the degree of decomposition of SOM if the values ofplant inputs to the soil remain constant [Nadelhoffer andFry, 1988]. To quantitatively determine the rate at whichSOM flows out of soil fractions, we apply radiocarbon fromarchived and contemporary samples as an isotopic tracer.Radiocarbon reflects decadal and millennial SOC turnoverrates if a time series of samples spanning atmospheric ‘‘14C-spike’’ can be analyzed [Trumbore et al., 1996; Trumbore,1993]. We utilize these element and isotope ratios in soilsfrom a 3-million-year soil chronosequence in the easternSan Joaquin Valley, CA [Harden, 1987] to study theformation and turnover of stabilized SOM pools across agradient of fertility and other soil properties appropriate toimproving models of the terrestrial C cycle.
2. Methods
2.1. Sites
[6] Archived and contemporary samples were obtainedfrom undisturbed sites on alluvial terraces formed by theMerced and Tuolumne Rivers, in the Eastern San JoaquinValley, CA, USA [Arkley, 1962, 1964; Harden, 1987]. Thesoil parent material at all sites consisted of arkosic alluviumderived primarily from granodioritic rocks of the SierraNevada Batholith. All sites are in close proximity (25 km,
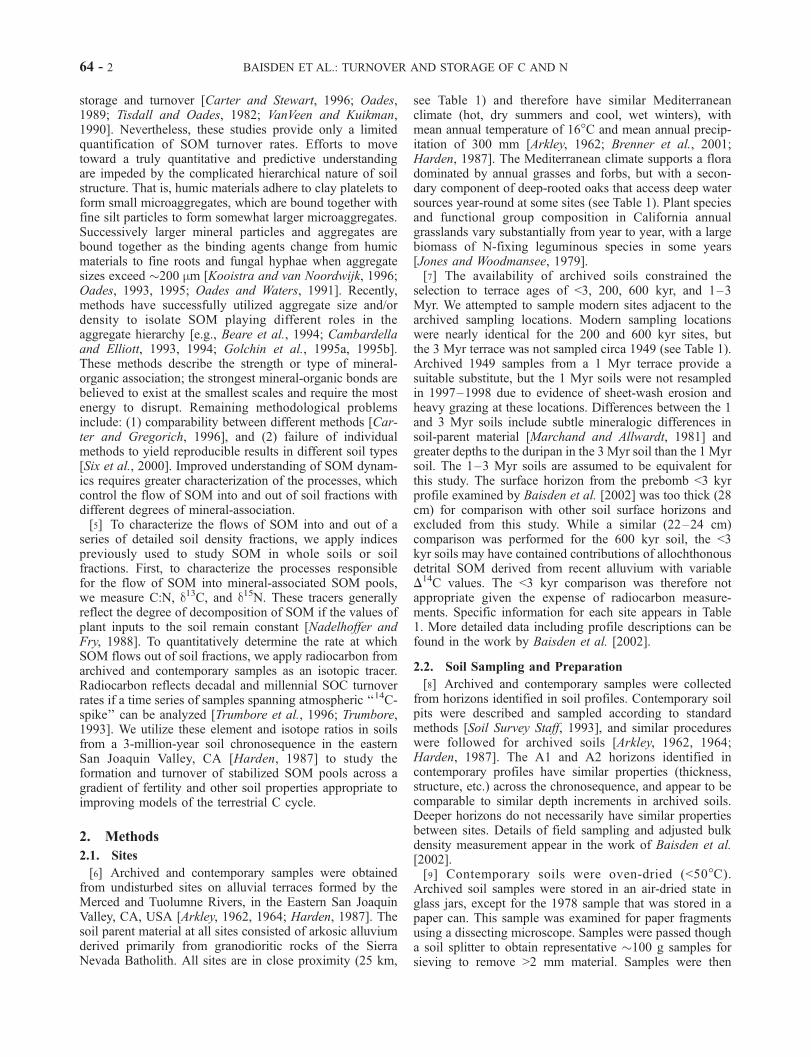
see Table 1) and therefore have similar Mediterraneanclimate (hot, dry summers and cool, wet winters), withmean annual temperature of 16�C and mean annual precip-itation of 300 mm [Arkley, 1962; Brenner et al., 2001;Harden, 1987]. The Mediterranean climate supports a floradominated by annual grasses and forbs, but with a secon-dary component of deep-rooted oaks that access deep watersources year-round at some sites (see Table 1). Plant speciesand functional group composition in California annualgrasslands vary substantially from year to year, with a largebiomass of N-fixing leguminous species in some years[Jones and Woodmansee, 1979].[7] The availability of archived soils constrained the
selection to terrace ages of <3, 200, 600 kyr, and 1–3Myr. We attempted to sample modern sites adjacent to thearchived sampling locations. Modern sampling locationswere nearly identical for the 200 and 600 kyr sites, butthe 3 Myr terrace was not sampled circa 1949 (see Table 1).Archived 1949 samples from a 1 Myr terrace provide asuitable substitute, but the 1 Myr soils were not resampledin 1997–1998 due to evidence of sheet-wash erosion andheavy grazing at these locations. Differences between the 1and 3 Myr soils include subtle mineralogic differences insoil-parent material [Marchand and Allwardt, 1981] andgreater depths to the duripan in the 3 Myr soil than the 1 Myrsoil. The 1–3 Myr soils are assumed to be equivalent forthis study. The surface horizon from the prebomb <3 kyrprofile examined by Baisden et al. [2002] was too thick (28cm) for comparison with other soil surface horizons andexcluded from this study. While a similar (22–24 cm)comparison was performed for the 600 kyr soil, the <3kyr soils may have contained contributions of allochthonousdetrital SOM derived from recent alluvium with variableD14C values. The <3 kyr comparison was therefore not
appropriate given the expense of radiocarbon measure-ments. Specific information for each site appears in Table1. More detailed data including profile descriptions can befound in the work by Baisden et al. [2002].
2.2. Soil Sampling and Preparation
[8] Archived and contemporary samples were collectedfrom horizons identified in soil profiles. Contemporary soilpits were described and sampled according to standardmethods [Soil Survey Staff, 1993], and similar procedureswere followed for archived soils [Arkley, 1962, 1964;Harden, 1987]. The A1 and A2 horizons identified incontemporary profiles have similar properties (thickness,structure, etc.) across the chronosequence, and appear to becomparable to similar depth increments in archived soils.Deeper horizons do not necessarily have similar propertiesbetween sites. Details of field sampling and adjusted bulkdensity measurement appear in the work of Baisden et al.[2002].[9] Contemporary soils were oven-dried (<50�C).
Archived soil samples were stored in an air-dried state inglass jars, except for the 1978 sample that was stored in apaper can. This sample was examined for paper fragmentsusing a dissecting microscope. Samples were passed thougha soil splitter to obtain representative �100 g samples forsieving to remove >2 mm material. Samples were then
64 - 2 BAISDEN ET AL.: TURNOVER AND STORAGE OF C AND N
passed through a smaller soil splitter to obtain samples of2–8 g for further analysis. Bulk soil samples (2–5 g) wereground in a corundum mortar and pestle to pass a 70-meshsieve for C, N, and isotope analysis.
2.3. Density Fractionation
[10] Soils were subjected to a density fractionation pro-cedure based on that of Golchin et al. [1994a, 1994b,1995a, 1995b] to yield fractions listed in Table 2. Soils(4–8 g) were weighed into 50 mL polycarbonate centrifugetubes and filled with 35 mL of 1.60 ± 0.03 g cm�3 sodiumpolytungstate (SPT) solution. The tubes were shaken gentlyend over end five times, and allowed to sit for 1 hour ormore. The tubes were shaken gently again and the walls ofthe tube washed with an additional �5mL of SPT from awash bottle. The samples were then centrifuged to settle allparticles >0.2 mm and <1.6 g cm�3. After centrifugation, thefloating FPOM fraction was aspirated onto a 7 cm quartzfiber filter (Whatman QM-A; prebaked 3hours at 850�C).Residual soil was resuspended in 35 mL of 1.60 ± 0.03 gcm�3 SPT, placed in an ice bath, and subjected to 6 min ofultrasonic disruption at 66% power and 50% pulse time on aBranson 350 sonifier with a 1/2-inch probe tip. For the last10 s of sonication, the power was ramped to zero in order toassist the separation of light and dense particles [Golchin etal., 1994b]. The floating <1.6 g cm�3 material comprisedthe first mineral-associated light fraction (MALF-1) and
was aspirated onto a quartz filter as before. Subsequentmineral-associated light fractions (MALF-2 and MALF-3)were isolated in SPT of densities 1.85 ± 0.03 and 2.22 ±0.05 g cm�3, respectively. In each case, residual soil wasresuspended by shaking, sonicated for 10 s at 20% power,and then the sonicator power was reduced to zero overanother 10 s to enhance separation of organic material,which may have recombined with mineral particles. Thesuspensions were centrifuged and the floating materialaspirated onto quartz filters as before. The residual >2.22g cm�3 dense fraction (DF) was repeatedly resuspended,rinsed with deionized water (DI), and centrifuged again.Dissolved organic matter (DOM) lost to the SPT and DI wasnot recovered. Averaging across all soil samples, 11 ± 5% ofthe SOC in bulk soils was not recovered following fractio-nation, and is assumed to represent losses. However, forindividual samples, the lost C is highly uncertain andtherefore not reported.[11] The DF was freeze-dried, and the FPOM and MALFs
were freeze-dried if they did not air-dry during filtration.The mass of fractions collected on filters was calculated bysubtracting the mass of the filter from the mass of thefraction on the filter. The FPOM and MALFs were groundto a fine powder in an SPEX 6800 cryogenic grinding mill,using stainless steel grinding tubes. The DF was ground in acorundum mortar and pestle to pass a 70-mesh sieve.Fractions were photographed prior to grinding using a Sony
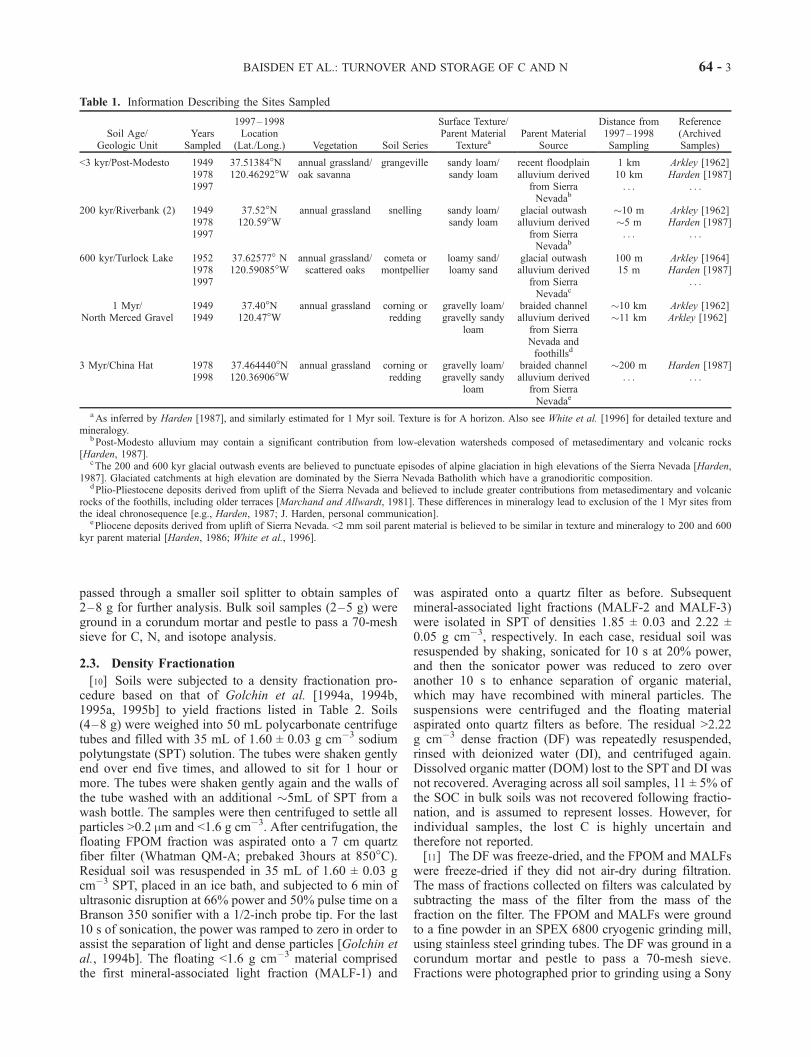
Table 1. Information Describing the Sites Sampled
Soil Age/Geologic Unit
YearsSampled
1997–1998Location
(Lat./Long.) Vegetation Soil Series
Surface Texture/Parent Material
TextureaParent Material
Source
Distance from1997–1998Sampling
Reference(ArchivedSamples)
<3 kyr/Post-Modesto 194919781997
37.51384�N120.46292�W
annual grassland/oak savanna
grangeville sandy loam/sandy loam
recent floodplainalluvium derived
from SierraNevadab
1 km10 km. . .
Arkley [1962]Harden [1987]
. . .
200 kyr/Riverbank (2) 194919781997
37.52�N120.59�W
annual grassland snelling sandy loam/sandy loam
glacial outwashalluvium derived
from SierraNevadab
�10 m�5 m. . .
Arkley [1962]Harden [1987]
. . .
600 kyr/Turlock Lake 195219781997
37.62577� N120.59085�W
annual grassland/scattered oaks
cometa ormontpellier
loamy sand/loamy sand
glacial outwashalluvium derived
from SierraNevadac
100 m15 m
Arkley [1964]Harden [1987]
. . .
1 Myr/North Merced Gravel
19491949
37.40�N120.47�W
annual grassland corning orredding
gravelly loam/gravelly sandy
loam
braided channelalluvium derived
from SierraNevada andfoothillsd
�10 km�11 km
Arkley [1962]Arkley [1962]
3 Myr/China Hat 19781998
37.464440�N120.36906�W
annual grassland corning orredding
gravelly loam/gravelly sandy
loam
braided channelalluvium derived
from SierraNevadae
�200 m. . .
Harden [1987]. . .
aAs inferred by Harden [1987], and similarly estimated for 1 Myr soil. Texture is for A horizon. Also see White et al. [1996] for detailed texture andmineralogy.
bPost-Modesto alluvium may contain a significant contribution from low-elevation watersheds composed of metasedimentary and volcanic rocks[Harden, 1987].
cThe 200 and 600 kyr glacial outwash events are believed to punctuate episodes of alpine glaciation in high elevations of the Sierra Nevada [Harden,1987]. Glaciated catchments at high elevation are dominated by the Sierra Nevada Batholith which have a granodioritic composition.
dPlio-Pliestocene deposits derived from uplift of the Sierra Nevada and believed to include greater contributions from metasedimentary and volcanicrocks of the foothills, including older terraces [Marchand and Allwardt, 1981]. These differences in mineralogy lead to exclusion of the 1 Myr sites fromthe ideal chronosequence [e.g., Harden, 1987; J. Harden, personal communication].
ePliocene deposits derived from uplift of Sierra Nevada. <2 mm soil parent material is believed to be similar in texture and mineralogy to 200 and 600kyr parent material [Harden, 1986; White et al., 1996].
BAISDEN ET AL.: TURNOVER AND STORAGE OF C AND N 64 - 3
DKC5000 digital camera mounted on a Leica M10 dissect-ing photomicroscope.[12] One difficulty with the method was the tendency of
the quartz filters to clog, thus limiting the amount of soilthat could be processed. After grinding, the quartz filtersalso caused a blank problem for samples with very low Cand N concentrations (discussed below). Therefore futureresearchers should attempt to avoid the use of quartz fiberfilters for low OM-samples. Cambardella and Elliott [1993]present an alternative method.
2.4. Total C, N, and Isotope Analysis
[13] The d13C and d15N values as well as C and N contentof most samples were determined using an elementalanalyzer interfaced via continuous flow to an isotope ratiomass spectrometer (EA-CF-IRMS, Europa Scientific 20/20). The EA-CF-IRMS was calibrated to NIST 1547 PeachLeaves, assuming d13C = �25.9% and d15N = +2.1% forthis material. Samples varied in C and N content, so a largesuite of internal laboratory standards was used to correcteach run for instrumental variation in observed d13C andd15N as a function of beam area. Reported d13C and d15Nvalues were suitably bracketed by standards in both isotoperatio and measured beam area. Based on calibration runs forinternal standards, we report an absolute precision relativeto international isotope standards (NIST 8547 IAEA N-1,NIST 8540 PEF-1, and NIST 8542 ANU Sucrose) for thisdata set of approximately ±0.3% for d15N and ±0.15% ford13C (1s error). Reported uncertainties are standard errorscalculated either on the basis of replicate analyses or fromthe statistical fit of the calibration used to correct d13C ord15N as a function of beam area. Absolute precision can beneglected for comparison within the data set but should beadded in quadrature to reported uncertainty when comparedto other data sets.[14] For most bulk samples, d15N and percentage of N
were measured on a VG Optima EA-CF-IRMS at the USGSin Menlo Park, CA [Baisden et al., 2002], using a proceduresimilar to that outlined above. The d13C and percentage of Cof bulk samples were measured by dual inlet IRMS on aVG-Prism III at Lawrence Berkeley National Laboratory inconjunction with the analysis of 14C samples as outlinedbelow. Internal laboratory standards were used to demon-strate that data obtained from different instruments aregenerally comparable within reported uncertainty. Stableisotope data are presented in d13C and d15N notation, wheredifferences in isotope ratios are given in part per thousand
(%) relative to the PDB standard for C isotopes andatmospheric N2 for N.[15] Samples for radiocarbon analysis were sealed in
evacuated Vycor tubes with 0.5 g Cu, 1.0 g CuO, and astrip of Ag foil. These samples were combusted for 4hours or more at 850�C, cooled at 1�C min�1, and heldfor 2 hours at 650�C before further cooling. The CO2, andin some cases N2, were purified cryogenically [Minagawaet al., 1984] using 13X molecular sieves to collect the N2
gas at liquid nitrogen temperatures. CO2 was converted tographite for 14C at the Center for Accelerator MassSpectrometry (CAMS), Lawrence Livermore NationalLaboratory (LLNL). After purification, the quantities ofCO2 and N2 released from the combustion of sampleswere measured manometrically. Radiocarbon data arepresented in D
14C notation and include correction forstable isotope fractionation based on d13C. The standard(0%) represents approximately the 14C/12C ratio of thepreindustrial atmosphere.[16] For fractions <2.22 g cm�3, percentage of C and
percentage of N in the soil fractions are calculated byadjusting for the proportion of the quartz filter in the groundsample. We expected the quartz filters to be perfectly C- andN-free, but found a blank of 0.10 ± 0.03% C (n = 4) and0.027 ± 0.010% N (n = 2). This background C and N wasunimportant for most samples, but affects samples with loworganic matter concentrations. Within the method outlinedabove, the high background appears after the filters areground to a fine powder, suggesting that the blank mayrepresent CO2 and N2 sorbed onto the surface of the finelydivided silica either from the atmosphere, or from the liquidnitrogen bath in which the samples were ground in theSPEX mill. It is not clear that the full measured blankaffects samples if OM coats the surfaces of the groundsilica. Therefore we subtracted one-half of the blank con-centration from all samples, and added one-half the blankconcentration to estimates of uncertainty, which were car-ried through all subsequent calculations. Stable isotoperatios were not adjusted to account for the blank, and stableisotope data for samples with a high blank contribution(>�10%) are not reported. For D14C, we recognized that thebackground could result in significant errors if it containedfossil-fuel-derived C with D14C of �1000%. Therefore thebackground D
14C was directly measured and a value of�150 ± 40% (n = 3) was derived. We incorporated thisblank value into the D14C values we report for the fractionsand propagated the uncertainty.
Table 2. Description of the Fractions Separated From Soils
Fraction Abbreviation Fraction Name Densitya (g cm�3)Separated After
Ultrasonic DisruptionLight
FractionsMineral-Associated
Fractions
FPOM Free particulateorganic matter
<1.60 no X
MALF-1 Mineral-associatedlight fraction (1)
<1.60 yes X X
MALF-2 Mineral-associatedlight fraction (2)
1.60–0.85 yes X X
MALF-3 Mineral-associatedlight fraction (3)
1.85–2.22 yes X
DF Dense fraction >2.22 yes X
aDensities separated in SPT prepared to ±0.03 g cm�3.
64 - 4 BAISDEN ET AL.: TURNOVER AND STORAGE OF C AND N
[17] When necessary to obtain calculated results (bycombining multiple horizons or using mass balance tocalculate isotope ratios for a horizon by difference),mixing calculations were performed according to theequation d1+2 = d1M1 + d2M2 in which d representsd13C, d15N, or D14C values, and M represents mass forcomponents 1 and 2 of the mixture. Uncertainties werepropagated through all calculations using Gaussian errorpropagation rules, generally by adding the uncertainty orrelative uncertainty in quadrature [Bevington, 1969]. In thefinal step of some calculations to obtain d13C, d15N, 14Cfrom mixing models, only the largest terms were includedin the propagation of uncertainty. Propagated uncertaintiesrepresent one standard error.
2.5. Modeling D14C to Estimate SOM Turnover Rates
[18] We estimated the turnover rate of SOM based onmeasured D
14C values using an approach similar to the boxmodel presented in Trumbore [1993]. The approach recog-nizes that two ‘‘‘pools’’ of SOM with different residencetimes can exist within the same soil or soil fraction. Weassume one pool (Cpool) has annual to decadal residencetimes, while the other pool (Cpassive) is passive (millennialturnover times). The model assumes that both pools havereached steady state (inputs = outputs). Starting in 1909,the model numerically incorporates C with a 14C/12C ratioderived from winter-growing (November-May) season-atmospheric CO2 [Berger, 1987; Levin and Kromer,1997; Levin et al., 1994; Nydal and Lovseth, 1997;Schonhofer, 1992] into Cpool [for details, see Baisden etal., 2002]:
DCpool ¼ I � kCpool
� �Dt; ð1aÞ
D 14Cpool
� �Dt
¼ Ayear�lagI � k þ lð Þ14Cpool
h iDt: ð1bÞ
In these equations, Cpool and14Cpool represent SOC mass
and 14C mass in a portion of the soil fraction, while Dtrepresents a time step and is generally 1 year. An Ayear-lag isthe 14C/12C ratio of the atmosphere corresponding to thesubscript year, and is lagged by at least 1 year to representthe residence time of C in plant biomass and/or theresidence time of SOC in ‘‘feeder’’ pools [Gaudinski et al.,2000]. The decay constant for radiocarbon (l) is set to 1.21� 10�4 yr�1. The D
14C of the passive pool was calculatedbased solely on radioactive decay (l) and assumed age, andthe D
14C of the modeled fraction is calculated as themixture of the passive pool (Cpassive) and Cpool in Equations(1a) and (1b) according to the following equation
D14Cfraction ¼ 1� Ppassive
� �D14Cpool þ PpassiveD
14Cpassive; ð2Þ
where Ppassive is the proportion [Cpassive/(Cpassive + Cpool)] ofthe density fraction, which is passive C.[19] The model was implemented in Microsoft Excel with
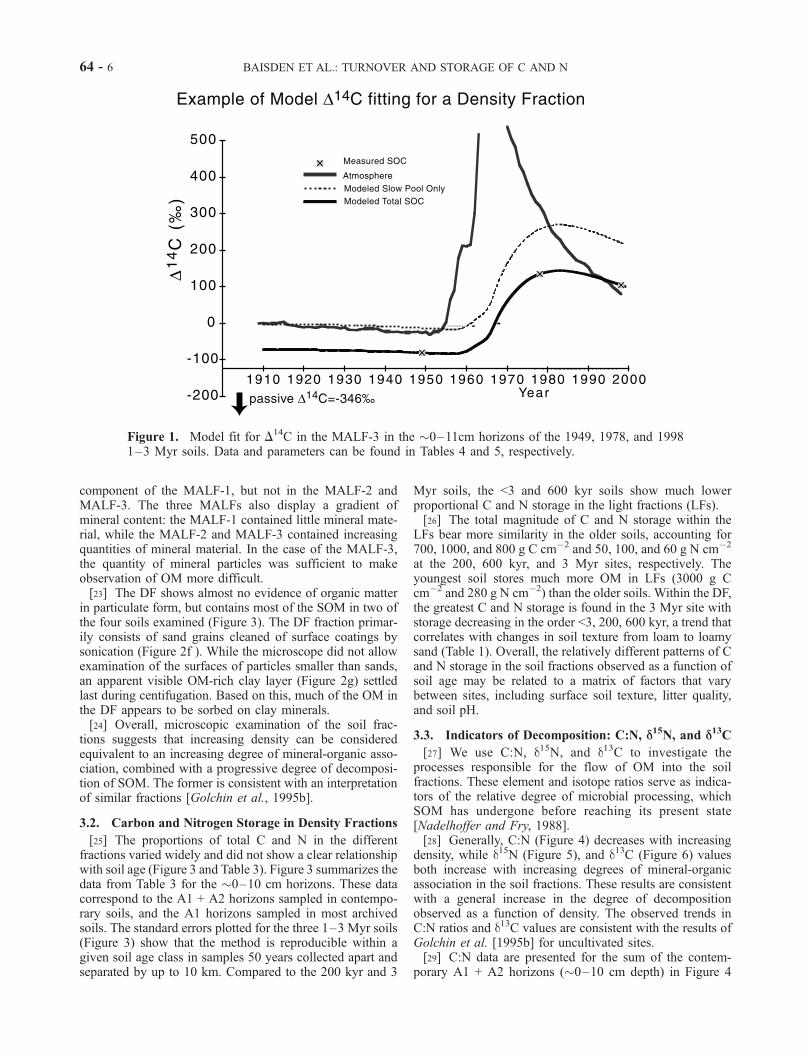
an annual time step. The values of k, lag, and Ppassive wereoptimized using Excel’s ‘‘solver’’ application. The opti-mized fit minimized the sum of squared errors betweenthe modeled and measured fraction D
14C obtained for eachyear a sample was available. In most cases, the summed
error was zero (see Table 5). Figure 1 presents an exampleof a model fit. The measured D
14C data did not constrainboth the passive SOM D
14C value (D14Cpassive) and the lagtime (lag). Variation of Cpassive residence times within areasonable range (2000–5000 years) causes little variationin estimated parameters using this approach. ThereforeD14Cpassive was set to the middle of this range, �346%
(equivalent to 3500 years), for consistency. This value wasalso consistent with passive SOM D
14C at similar depths inthe model in Baisden et al. [2002].[20] When only two samples (1949–1952 and 1997) were
available, lag also was not constrained. Therefore lag for theFPOM was set to the account for the D14C value measuredfor belowground biomass (Table 4). The lag was thenestimated for MALFs based on the estimated residence timeof FPOM and the D
14C value measured for belowgroundbiomass (Table 4). To estimate error in model-derivedestimates of turnover, a Monte Carlo simulation was per-formed for each fraction using 20 normally distributedsimulated errors applied to measured D
14C values for thearchived and contemporary samples (Table 4). Reporteduncertainties in parameters derived from the model are thestandard deviation of the solutions to the 20 Monte Carloruns. These uncertainties result only from propagation ofestimated analytical uncertainty in measured soil D
14Cvalues, and do not include uncertainty from other sourcesincluding the D
14C of atmospheric CO2.
3. Results
3.1. Photography
[21] The density fractions were examined using a dissect-ing microscope to establish that the expected variation indegrees of mineral association was observed across thespectrum of fractions. Typical photographs representingeach density fraction appear in Figure 2. We observedmarked visual differences between the lightest and densestfractions (FPOM and DF, see Table 2 for fraction descrip-tions), but more subtle differences among the MALF-1,MALF-2, and MALF-3 fractions. The FPOM consistsalmost entirely of recognizable plant debris (Figure 2a), aswell as some active fungal hyphae. Fungal hyphae appear inassociation with surface plant debris (Figure 2a) and asapparent mycorrhizal associates of recently living plant rootfragments (Figure 2b). Figure 2b illustrates that roots androot fragments may either appear exposed (lower), or coatedwith various organic and mineral particles (upper right). TheFPOM fraction appears to play a role in macroaggregateformation, whereby smaller aggregates, mineral, andorganic particles become bound together by roots andhyphae [Tisdall and Oades, 1982].[22] The MALF-1, MALF-2, and MALF-3 (Figures 2c–
2e) show large quantities of fine (<100 mm) particulateorganic matter (POM) and lesser quantities of larger (>100mm) POM. In most cases, the observable surfaces of thePOM in the MALFs are partially or completely humified, instrong contrast to the FPOM fraction. Spores and pollencomprised the only recognizable plant materials in thesefractions, and were generally found in the MALF-1 fraction.We also found charcoal and/or charred POM as a significant
BAISDEN ET AL.: TURNOVER AND STORAGE OF C AND N 64 - 5
component of the MALF-1, but not in the MALF-2 andMALF-3. The three MALFs also display a gradient ofmineral content: the MALF-1 contained little mineral mate-rial, while the MALF-2 and MALF-3 contained increasingquantities of mineral material. In the case of the MALF-3,the quantity of mineral particles was sufficient to makeobservation of OM more difficult.[23] The DF shows almost no evidence of organic matter
in particulate form, but contains most of the SOM in two ofthe four soils examined (Figure 3). The DF fraction primar-ily consists of sand grains cleaned of surface coatings bysonication (Figure 2f ). While the microscope did not allowexamination of the surfaces of particles smaller than sands,an apparent visible OM-rich clay layer (Figure 2g) settledlast during centifugation. Based on this, much of the OM inthe DF appears to be sorbed on clay minerals.[24] Overall, microscopic examination of the soil frac-
tions suggests that increasing density can be consideredequivalent to an increasing degree of mineral-organic asso-ciation, combined with a progressive degree of decomposi-tion of SOM. The former is consistent with an interpretationof similar fractions [Golchin et al., 1995b].
3.2. Carbon and Nitrogen Storage in Density Fractions
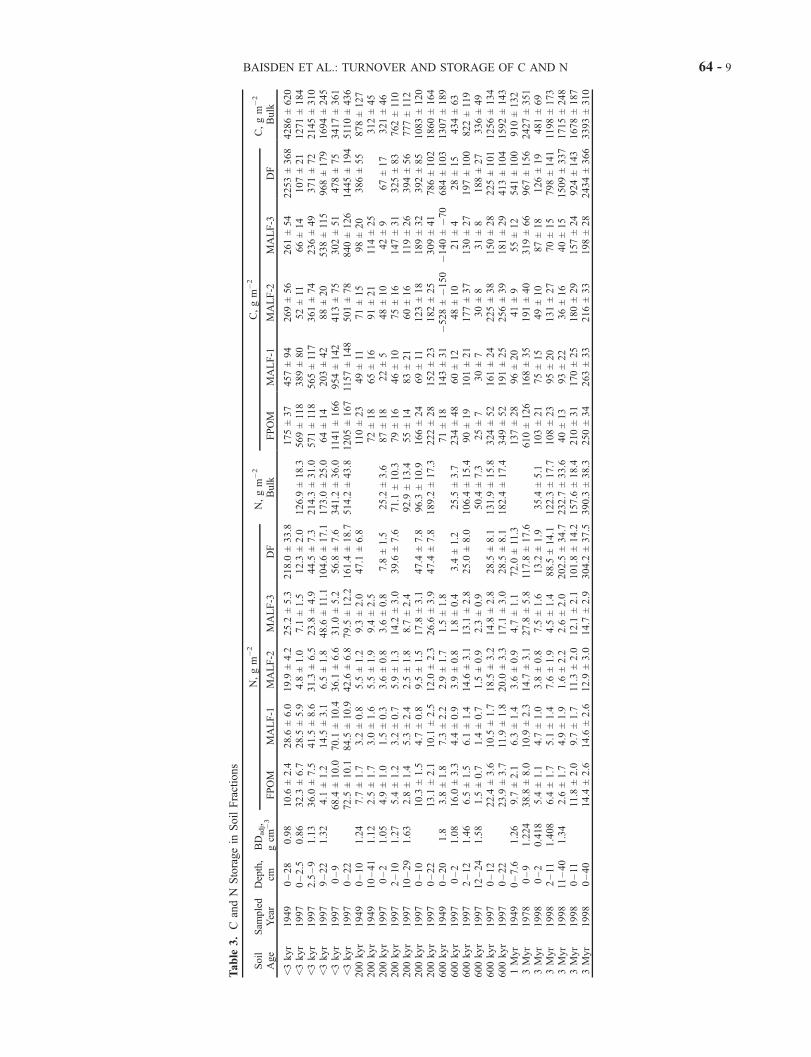
[25] The proportions of total C and N in the differentfractions varied widely and did not show a clear relationshipwith soil age (Figure 3 and Table 3). Figure 3 summarizes thedata from Table 3 for the �0–10 cm horizons. These datacorrespond to the A1 + A2 horizons sampled in contempo-rary soils, and the A1 horizons sampled in most archivedsoils. The standard errors plotted for the three 1–3 Myr soils(Figure 3) show that the method is reproducible within agiven soil age class in samples 50 years collected apart andseparated by up to 10 km. Compared to the 200 kyr and 3
Myr soils, the <3 and 600 kyr soils show much lowerproportional C and N storage in the light fractions (LFs).[26] The total magnitude of C and N storage within the
LFs bear more similarity in the older soils, accounting for700, 1000, and 800 g C cm�2 and 50, 100, and 60 g N cm�2
at the 200, 600 kyr, and 3 Myr sites, respectively. Theyoungest soil stores much more OM in LFs (3000 g Ccm�2 and 280 g N cm�2) than the older soils. Within the DF,the greatest C and N storage is found in the 3 Myr site withstorage decreasing in the order <3, 200, 600 kyr, a trend thatcorrelates with changes in soil texture from loam to loamysand (Table 1). Overall, the relatively different patterns of Cand N storage in the soil fractions observed as a function ofsoil age may be related to a matrix of factors that varybetween sites, including surface soil texture, litter quality,and soil pH.
3.3. Indicators of Decomposition: C:N, D15N, and D13C
[27] We use C:N, d15N, and d13C to investigate theprocesses responsible for the flow of OM into the soilfractions. These element and isotope ratios serve as indica-tors of the relative degree of microbial processing, whichSOM has undergone before reaching its present state[Nadelhoffer and Fry, 1988].[28] Generally, C:N (Figure 4) decreases with increasing
density, while d15N (Figure 5), and d13C (Figure 6) valuesboth increase with increasing degrees of mineral-organicassociation in the soil fractions. These results are consistentwith a general increase in the degree of decompositionobserved as a function of density. The observed trends inC:N ratios and d13C values are consistent with the results ofGolchin et al. [1995b] for uncultivated sites.[29] C:N data are presented for the sum of the contem-
porary A1 + A2 horizons (�0–10 cm depth) in Figure 4
Figure 1. Model fit for D14C in the MALF-3 in the �0–11cm horizons of the 1949, 1978, and 19981–3 Myr soils. Data and parameters can be found in Tables 4 and 5, respectively.
64 - 6 BAISDEN ET AL.: TURNOVER AND STORAGE OF C AND N
because C:N ratio does not vary consistently with soil depthwithin a given soil fraction, except for the FPOM fractionwhich displays decreasing C:N with depth. The changingC:N of the FPOM is consistent with the lower C:N ofbelowground relative to aboveground plant parts. Themarginally higher C:N observed for the MALF-1 relative
to the FPOM fraction at some sites could result from theinclusion of chemically recalcitrant high C:N OM such ascharcoal.[30] The d13C and d15N values increase by 2–5% with
increasing density at most sites (Figures 5 and 6). Surfacesoil (A1, 0–2 cm) FPOM is generally closest to above- and
Figure 2. Digital images of soil fractions as described in frames A–G. The white background in (B) isthe quartz filter.
BAISDEN ET AL.: TURNOVER AND STORAGE OF C AND N 64 - 7
belowground plant values, while the MALF-3 and DFdisplay the greatest 13C and 15N enrichment. Except in the<3-kyr soil, the deeper A2 SOM has higher .d13C and d15Nvalues than the A1 SOM. The pattern of d13C and d15Nvalues observed across the density fractions did not varysystematically as a function of soil age. Patterns in plant andtotal SOM d15N values viewed as a function of soil age arediscussed in Brenner et al. [2001].
3.4. D14C and Estimated Turnover Rates
[31] To estimate passive SOM turnover rates, we meas-ured D
14C in archived samples predating the pulse 14Cenrichment of atmospheric CO2. In the 1949 samples, themeasured D
14C values of density fractions (Table 4)decrease with increasing density, although not necessarilymonotonically. The D
14C values for FPOM fractions in the1949 200 kyr and 1 Myr samples closely match the 1949atmospheric D
14C, reflecting a decline of �30–35% frompreindustrial values due to 14C-depleted fossil fuel C (theSuess effect). The lowest measured D14C values occur in the1949 1 Myr MALF-2 (�117 ± 6%) and the 1952 600 kyrDF (�113 ± 4%), and correspond to conventional 14C agesof 900–1000 years.[32] When available, surface soil samples from 1978
provide improved resolution of bomb 14C incorporation inactive and decadal SOM pools. All density fractions in the1978 3 Myr soil display D
14C values greater than 100%(Table 4), suggesting the incorporation bomb-14C during aperiod of 15–20 years. This 1978 3 Myr soil displays amarked decline in D
14C across the two lightest fractions,and a less pronounced decline across the remaining frac-tions. The D14C value of the 1978 FPOM lags the estimatedvalue for the 1978 atmosphere by approximately 20%,suggesting a tight coupling between FPOM and atmos-pheric D14C during this period when atmospheric D
14Cdecreased by roughly 20% per year.[33] The contemporary samples had the highest D
14Cvalues in MALFs (Table 4), suggesting that these fractionscontain the largest proportions of decadal cycling poolsthat retain bomb 14C. Within most fractions, the D
14Cvalues of A1 (0–2 cm) horizons differ from those of A2(�2–10 cm) horizons. This indicates that the upper 10 cmof soil is not well-mixed, a result that is consistent with theanalysis of SOM transport performed by Baisden et al.[2002]. Beyond these observations, interpretation of con-temporary D
14C values requires consideration of D14C
from comparable archived samples and numerical incorpo-ration of the changes in the D
14C values of atmosphericCO2. For this reason, we employ a two-box model (equa-tions (1a), (1b), and (2)) to interpret the D14C data for eachsoil fraction.
Figure 3. (opposite) C and N storage in surface horizons(a) 1997 <3 kyr soil 0–9 cm. (b) 1949 and 1997 200 kyrsoil 0–10 cm. (c) 1997 600 kyr soil 0–12 cm. (d) 1949 1Myr soil 0–8 cm, 1978 3Myr soil 0–9 cm, and 1997 3 Myrsoil 0–11cm. In Figure 3a–3c, error bars indicatepropagated uncertainties. In Figure 3d, error bars indicatestandard errors calculated from the three replicates (1949,1978, and 1998).
64 - 8 BAISDEN ET AL.: TURNOVER AND STORAGE OF C AND N
Table
3.C
andN
Storagein
SoilFractions
Soil
Age
Sam
pled
Year
Depth,
cmBDadj,
gcm
�3
N,gm
�2
N,gm
�2
Bulk
C,gm
�2
C,gm
�2
Bulk
FPOM
MALF-1
MALF-2
MALF-3
DF
FPOM
MALF-1
MALF-2
MALF-3
DF
<3kyr
1949
0–28
0.98
10.6
±2.4
28.6
±6.0
19.9
±4.2
25.2
±5.3
218.0
±33.8
175±37
457±94
269±56
261±54
2253±368
4286±620
<3kyr
1997
0–2.5
0.86
32.3
±6.7
28.5
±5.9
4.8
±1.0
7.1
±1.5
12.3
±2.0
126.9
±18.3
569±118
389±80
52±11
66±14
107±21
1271±184
<3kyr
1997
2.5–9
1.13
36.0
±7.5
41.5
±8.6
31.3
±6.5
23.8
±4.9
44.5
±7.3
214.3
±31.0
571±118
565±117
361±74
236±49
371±72
2145±310
<3kyr
1997
9–22
1.32
4.1
±1.2
14.5
±3.1
6.5
±1.8
48.6
±11.1
104.6
±17.1
173.0
±25.0
64±14
203±42
88±20
538±115
968±179
1694±245
<3kyr
1997
0–9
68.4
±10.0
70.1
±10.4
36.1
±6.6
31.0
±5.2
56.8
±7.6
341.2
±36.0
1141±166
954±142
413±75
302±51
478±75
3417±361
<3kyr
1997
0–22
72.5
±10.1
84.5
±10.9
42.6
±6.8
79.5
±12.2
161.4
±18.7
514.2
±43.8
1205±167
1157±148
501±78
840±126
1445±194
5110±436
200kyr
1949
0–10
1.24
7.7
±1.7
3.2
±0.8
5.5
±1.2
9.3
±2.0
47.1
±6.8
110±23
49±11
71±15
98±20
386±55
878±127
200kyr
1949
10–41
1.12
2.5
±1.7
3.0
±1.6
5.5
±1.9
9.4
±2.5
72±18
65±16
91±21
114±25
312±45
200kyr
1997
0–2
1.05
4.9
±1.0
1.5
±0.3
3.6
±0.8
3.6
±0.8
7.8
±1.5
25.2
±3.6
87±18
22±5
48±10
42±9
67±17
321±46
200kyr
1997
2–10
1.27
5.4
±1.2
3.2
±0.7
5.9
±1.3
14.2
±3.0
39.6
±7.6
71.1
±10.3
79±16
46±10
75±16
147±31
325±83
762±110
200kyr
1997
10–29
1.63
2.8
±1.4
5.3
±2.4
2.5
±1.8
8.7
±2.4
92.9
±13.4
55±14
83±21
60±16
119±26
394±56
777±112
200kyr
1997
0–10
10.3
±1.5
4.7
±0.8
9.5
±1.5
17.8
±3.1
47.4
±7.8
96.3
±10.9
166±24
69±11
123±18
189±32
392±85
1083±120
200kyr
1997
0–22
13.1
±2.1
10.1
±2.5
12.0
±2.3
26.6
±3.9
47.4
±7.8
189.2
±17.3
222±28
152±23
182±25
309±41
786±102
1860±164
600kyr
1949
0–20
1.8
3.8
±1.8
7.3
±2.2
2.9
±1.7
1.5
±1.8
71±18
143±31
�528±�150
�140±�70
684±103
1307±189
600kyr
1997
0–2
1.08
16.0
±3.3
4.4
±0.9
3.9
±0.8
1.8
±0.4
3.4
±1.2
25.5
±3.7
234±48
60±12
48±10
21±4
28±15
434±63
600kyr
1997
2–12
1.46
6.5
±1.5
6.1
±1.4
14.6
±3.1
13.1
±2.8
25.0
±8.0
106.4
±15.4
90±19
101±21
177±37
130±27
197±100
822±119
600kyr
1997
12–24
1.58
1.5
±0.7
1.4
±0.7
1.5
±0.9
2.3
±0.9
50.4
±7.3
25±7
30±7
30±8
31±8
188±27
336±49
600kyr
1997
0–12
22.4
±3.6
10.5
±1.7
18.5
±3.2
14.8
±2.8
28.5
±8.1
131.9
±15.8
324±52
161±24
225±38
150±28
225±101
1256±134
600kyr
1997
0–22
23.9
±3.7
11.9
±1.8
20.0
±3.3
17.1
±3.0
28.5
±8.1
182.4
±17.4
349±52
191±25
256±39
181±29
413±104
1592±143
1Myr
1949
0–7.6
1.26
9.7
±2.1
6.3
±1.4
3.6
±0.9
4.7
±1.1
72.0
±11.3
137±28
96±20
41±9
55±12
541±100
910±132
3Myr
1978
0–9
1.224
38.8
±8.0
10.9
±2.3
14.7
±3.1
27.8
±5.8
117.8
±17.6
610±126
168±35
191±40
319±66
967±156
2427±351
3Myr
1998
0–2
0.418
5.4
±1.1
4.7
±1.0
3.8
±0.8
7.5
±1.6
13.2
±1.9
35.4
±5.1
103±21
75±15
49±10
87±18
126±19
481±69
3Myr
1998
2–11
1.408
6.4
±1.7
5.1
±1.4
7.6
±1.9
4.5
±1.4
88.5
±14.1
122.3
±17.7
108±23
95±20
131±27
70±15
798±141
1198±173
3Myr
1998
11–40
1.34
2.6
±1.7
4.9
±1.9
1.6
±2.2
2.6
±2.0
202.5
±34.7
232.7
±33.6
40±13
93±22
36±16
40±15
1509±337
1715±248
3Myr
1998
0–11
11.8
±2.0
9.7
±1.7
11.3
±2.0
12.1
±2.1
101.8
±14.2
157.6
±18.4
210±31
170±25
180±29
157±24
924±143
1678±187
3Myr
1998
0–40
14.4
±2.6
14.6
±2.6
12.9
±3.0
14.7
±2.9
304.2
±37.5
390.3
±38.3
250±34
263±33
216±33
198±28
2434±366
3393±310
BAISDEN ET AL.: TURNOVER AND STORAGE OF C AND N 64 - 9
[34] Model-derived results (Figure 7 and Table 5) suggestsubstantial differences in the turnover rates of FPOM andmineral-associated fractions (MALFs and DF). Most of theSOC in the FPOM fractions appear to have turnover rates of�6 years or less. The residence times of C in FPOM aredifficult to interpret using D
14C because they are short with
respect to temporal variation in atmospheric D14C. Further,
uncertainty results from variation in the D14C values of
aboveground plant material and belowground plant materialand litter (Table 4).
Figure 5. d15N in soil fractions for soils sampled in 1997–1998. (a) <3 kyr. (b) 200 kyr. (c) 600 kyr. (d) 3 Myr. Theletters A and B plotted on the left side of each graph denotethe d15N values of above- and belowground plant inputs,respectively. Bulk soil values are from Brenner et al. [2001].A value for the sum of all light fractions (LF) was calculatedby difference, to determine if simplified methods can berecommended.
Figure 4. C:N ratio for soil density fractions from similargenetic horizons. (a) <3 kyr soil 0–9 cm sampled in 1997.(b) 200 kyr soil 0–10 cm sampled in both 1949 and 1997.(c) 600 kyr 0–12 cm sampled in 1997. (d) 1 Myr soil 0–7.6cm sampled in 1949, 3 Myr soil 0–9 cm sampled in 1978,and 0–12 cm sampled in 1998. ABG and BGB are above-and belowground biomass, respectively.
64 - 10 BAISDEN ET AL.: TURNOVER AND STORAGE OF C AND N
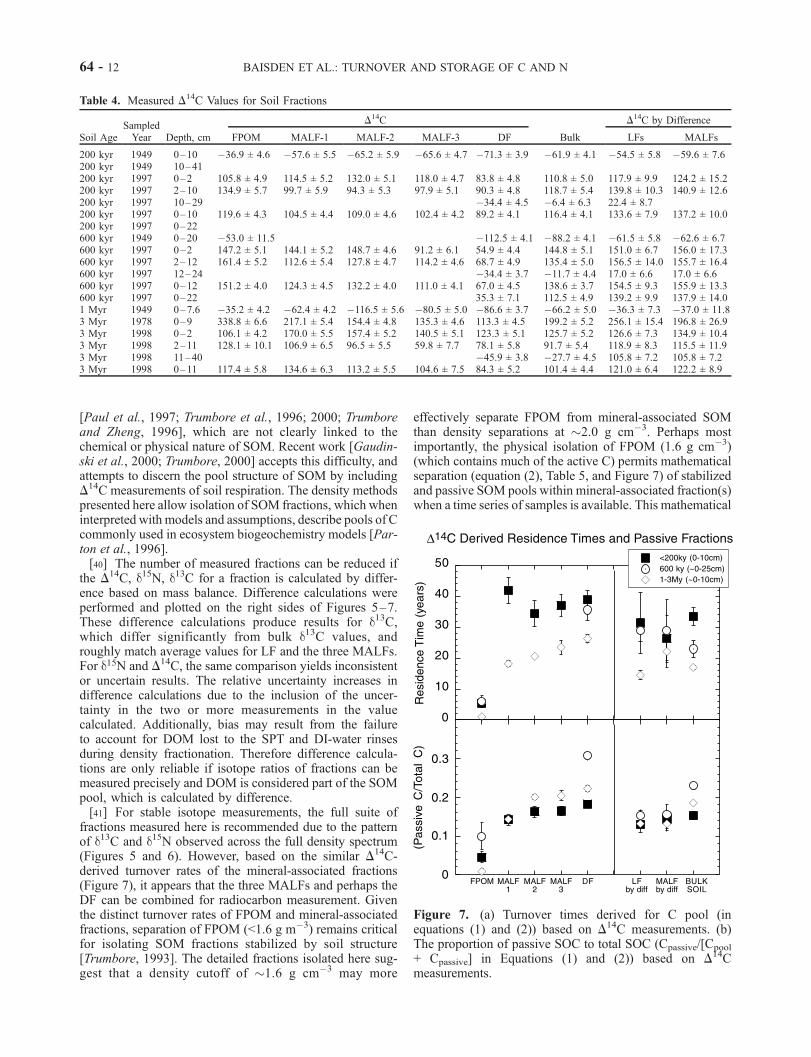
[35] In contrast, we calculate well-defined residencetimes for mineral-associated fractions. The MALFs andDF display SOC turnover rates of 18–42 years for acalculated pool representing 69–86% of the total C inthese fractions. Assuming a passive SOC pool with a
residence time of 3500 years, passive SOC represents<10% of FPOM fractions and 14–20% of the MALFs,and 16–31% of the DF. In the 1–3 Myr soils, the residencetimes of MALF and DF appear to increase slightly withincreasing density, although this trend is only marginallysignificant since error estimates do not include uncertaintyin atmospheric D
14C and model assumptions. Mineral-associated fractions at other sites show no clear trend ofresidence time versus density.[36] For each soil horizon, the passive SOM pool can be
viewed as 14–31% of the C in the MALF and DF plus asmall amount (<10%) of C in the FPOM. Similarly, 69–86% of C in the MALF plus DF describes the stabilized(decadal) SOM pool, and the remainder of SOC representsthe active pool. In this sense, active SOM includes both the90–99% of FPOM with residence times <6 years and anyDOM lost to the SPT and DI-water rinses during densityfractionation. We suggest that these interpreted active,stabilized, and passive pools correspond to the three poolsof SOM considered in ecosystem biogeochemistry models[Jenkinson, 1990; Parton et al., 1987, 1996] and found bymodeling D
14C as a function of depth [Baisden et al.,2002].[37] Examining model-derived parameters (Figure 7 and
Table 5) for these three pools in the 200, 600 kyr, and 3 Myrsoils, neither the fraction of passive SOC in the isolatedfractions nor the C residence time in FPOM appear to varyconsistently as a function of soil age. However, the resi-dence time of the stabilized SOC pool suggests decreasingresidence times as a function of soil age. This trendprimarily results from more rapid turnover in the 3 Myrsoil. The 600 kyr soil does not appear to differ significantlyfrom the 200 kyr soil in stabilized SOC residence time, butthe greater sampling depth in the 1952 600 kyr samplehinders this comparison. Based on Baisden et al. [2002], themost likely effect of calculating turnover rates based on adeeper sampling interval is an increase in the observedresidence times, due to the inclusion of older SOC at depth.Given this, the calculated stabilized SOC pool residencetimes appear to decrease with soil age in a manner consistentwith the residence times calculated in Baisden et al. [2002].
4. Discussion
4.1. Density Fractionation Procedures
[38] The density fractionation procedures presented hereseparate soil fractions in which the degree of mineral-organic association increases with increasing density. Inmost cases, C:N, d15N, and d13C indicate that the degreeof SOM decomposition increases with increasing density.Yet, stabilized (decadal) SOM with similar calculated turn-over rates exists within all mineral-associated fractions froma given soil sample. Thus these procedures yield usefulfractions for understanding SOM cycling and calibratingterrestrial ecosystem biogeochemistry models.[39] However, the number of fractions may be larger than
needed to develop reliable estimates of C pools and residencetimes. Can the density fractionation procedures be simplifiedto yield fewer fractions and retain a similar understanding ofC cycling? Currently, 14C studies of SOM turnover rely on amixture of chemical and physical fractionation methods
Figure 6. The d13C (%) in soil fractions for soils sampledin 1997–1998. (a) <3 kyr. (b) 200 kyr. (c) 600 kyr. (d) 3Myr. The letters A and B plotted on the left side of eachgraph denote the d13C values of above- and belowgroundplant inputs, respectively. A value for the sum of all lightfractions (LF) was calculated by difference, to determine ifsimplified methods can be recommended.
BAISDEN ET AL.: TURNOVER AND STORAGE OF C AND N 64 - 11
[Paul et al., 1997; Trumbore et al., 1996; 2000; Trumboreand Zheng, 1996], which are not clearly linked to thechemical or physical nature of SOM. Recent work [Gaudin-ski et al., 2000; Trumbore, 2000] accepts this difficulty, andattempts to discern the pool structure of SOM by includingD14C measurements of soil respiration. The density methods
presented here allow isolation of SOM fractions, which wheninterpreted with models and assumptions, describe pools of Ccommonly used in ecosystem biogeochemistry models [Par-ton et al., 1996].[40] The number of measured fractions can be reduced if
the D14C, d15N, d13C for a fraction is calculated by differ-
ence based on mass balance. Difference calculations wereperformed and plotted on the right sides of Figures 5–7.These difference calculations produce results for d13C,which differ significantly from bulk d13C values, androughly match average values for LF and the three MALFs.For d15N and D14C, the same comparison yields inconsistentor uncertain results. The relative uncertainty increases indifference calculations due to the inclusion of the uncer-tainty in the two or more measurements in the valuecalculated. Additionally, bias may result from the failureto account for DOM lost to the SPT and DI-water rinsesduring density fractionation. Therefore difference calcula-tions are only reliable if isotope ratios of fractions can bemeasured precisely and DOM is considered part of the SOMpool, which is calculated by difference.[41] For stable isotope measurements, the full suite of
fractions measured here is recommended due to the patternof d13C and d15N observed across the full density spectrum(Figures 5 and 6). However, based on the similar D
14C-derived turnover rates of the mineral-associated fractions(Figure 7), it appears that the three MALFs and perhaps theDF can be combined for radiocarbon measurement. Giventhe distinct turnover rates of FPOM and mineral-associatedfractions, separation of FPOM (<1.6 g m�3) remains criticalfor isolating SOM fractions stabilized by soil structure[Trumbore, 1993]. The detailed fractions isolated here sug-gest that a density cutoff of �1.6 g cm�3 may more
effectively separate FPOM from mineral-associated SOMthan density separations at �2.0 g cm�3. Perhaps mostimportantly, the physical isolation of FPOM (1.6 g cm�3)(which contains much of the active C) permits mathematicalseparation (equation (2), Table 5, and Figure 7) of stabilizedand passive SOM pools within mineral-associated fraction(s)when a time series of samples is available. This mathematical
Figure 7. (a) Turnover times derived for C pool (inequations (1) and (2)) based on D
14C measurements. (b)The proportion of passive SOC to total SOC (Cpassive/[Cpool
+ Cpassive] in Equations (1) and (2)) based on D14C
measurements.
64 - 12 BAISDEN ET AL.: TURNOVER AND STORAGE OF C AND N
separation represents an alternative method to acid hydrol-ysis [Trumbore and Zheng, 1996]. However, these recom-mendations should be viewed with caution for soils unlikethose studied, as density fractionation can yield results highlydependent on soil mineralogy [Six et al., 2000].
4.2. Conceptual Model: Decadal Stabilization of SOM
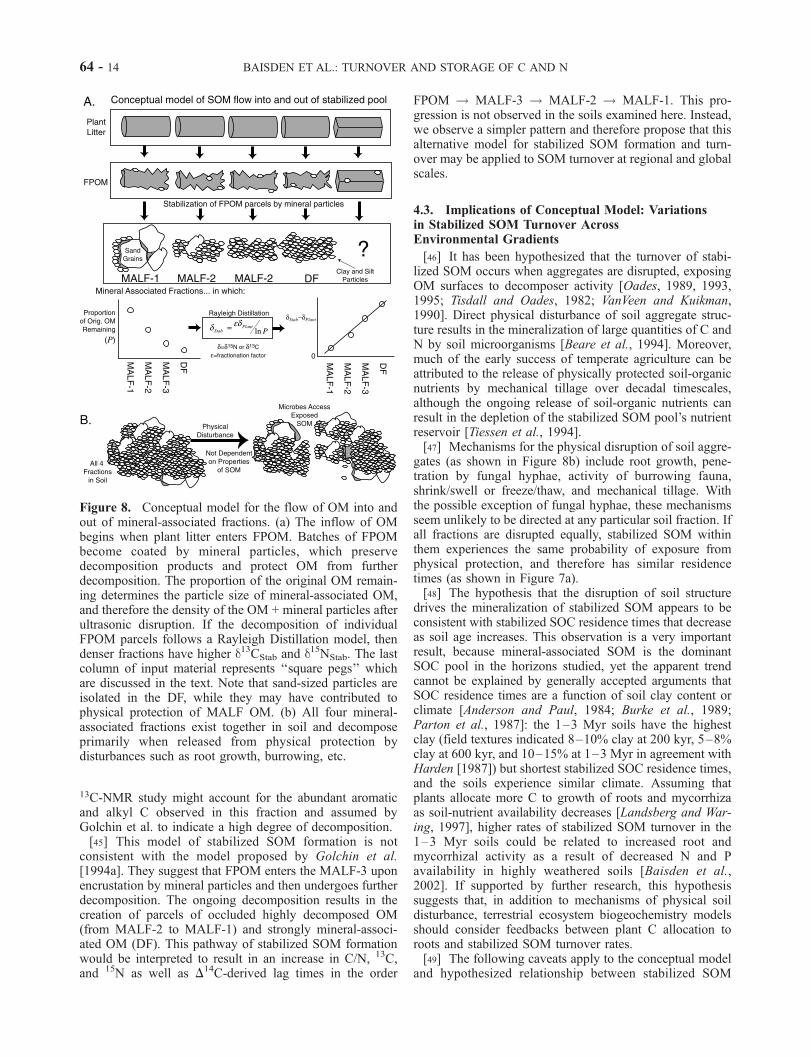
[42] The indicators of decomposition (d13C, d15N, andC:N; Figures 4–6) vary systematically across the densityfractions representing a gradient of mineral-organic associ-ation. In contrast, D14C-derived stabilized SOC residencetimes vary little across the same MALF and DF fractions.This contrast can be explained by recognizing that thedegree of SOM decomposition reflects the processes occur-ring before or during the inflow of OM to the isolatedfraction, while the D14C-derived residence times describethe rate of flow through each fraction. Given this logic, wepropose a conceptual model (Figure 8) that is consistentwith our observations.[43] Our conceptual model assumes that plant debris
enters the FPOM pool. Because this fraction has littlemineral material, few decomposition products are pre-served. But as decomposition proceeds, fungal hyphae andbacterial cells begin to bind mineral particles to the organicdebris. As the organic matter becomes humified, the numberof carboxylic groups on OM surfaces increase, facilitatingstrong bonds to negatively charged clay particles via multi-valent cation bridges [Oades, 1989]. At this point, mineralparticles begin to protect microbial debris and humifiedPOM from further microbial attack. Decomposition pro-ceeds with preservation of humified debris until the physicalprotection of the remaining OM from microbes is complete.During the stage in which some decomposition products are
preserved by mineral-organic associations, decompositionwithin a parcel of OM may be expected to follow aRayleigh distillation model [Amundson and Baisden,2000; Nadelhoffer and Fry, 1988] in which a proportion,P, of the original FPOM substrate is preserved, and the 13C-and 15N-depleted metabolic products (primarily CO2 andinorganic N compounds) are removed. C:N will alsodecrease if microbial products, which have lower C:N thanFPOM, are preserved. If P is related to the particle size ofthe preserved OM, which becomes coated with mineralparticles, then it follows that microaggregates with low Pwill have a small amount of OM preserved among abundantmineral particles, leading to separation at high density (orvice versa). The concept of Rayleigh distillation is consis-tent with visual observation (Figure 2) the MALFs appear tocontain individual fragments of POM and associated min-eral particles, with MALF-1 dominated by organic debris,and MALF-2 and MALF-3 displaying increasing quantitiesof mineral material, and smaller OM fragments.[44] However, some processes do not fit this simple
model. These processes are represented by the ‘‘squarepegs’’ in Figure 8, and include apparent preservation ofPOM with tough organic coatings, such as spores, pollen,and seeds (Figure 2c). Charcoal, charred plant debris, andlignin coils may also be included in this category. Theresistant organic surfaces of these materials appear toprevent strong mineral-organic bonds, and these types ofOM therefore appear in the MALF-1 [see Golchin et al.,1994b] although they generally represent <20% of thisfraction in the soils examined here by microscopic inspec-tion. As indicated in Figure 8, the fate of these materials insoil is not well understood. Preservation of a higher pro-portion of these ‘‘square pegs’’ by Golchin et al.’s [1994b]
Table 5. D14C Derived Parameters Describing SOM Turnover
aAssumes the residence time of passive C to be 3500 years.bThis fit was deemed unreasonable. The 1949 D
14C value (�116%) was unusual.cThis fit replaces * by fitting 1978 and 1998 data only.
BAISDEN ET AL.: TURNOVER AND STORAGE OF C AND N 64 - 13
13C-NMR study might account for the abundant aromaticand alkyl C observed in this fraction and assumed byGolchin et al. to indicate a high degree of decomposition.[45] This model of stabilized SOM formation is not
consistent with the model proposed by Golchin et al.[1994a]. They suggest that FPOM enters the MALF-3 uponencrustation by mineral particles and then undergoes furtherdecomposition. The ongoing decomposition results in thecreation of parcels of occluded highly decomposed OM(from MALF-2 to MALF-1) and strongly mineral-associ-ated OM (DF). This pathway of stabilized SOM formationwould be interpreted to result in an increase in C/N, 13C,and 15N as well as D
14C-derived lag times in the order
FPOM ! MALF-3 ! MALF-2 ! MALF-1. This pro-gression is not observed in the soils examined here. Instead,we observe a simpler pattern and therefore propose that thisalternative model for stabilized SOM formation and turn-over may be applied to SOM turnover at regional and globalscales.
4.3. Implications of Conceptual Model: Variationsin Stabilized SOM Turnover AcrossEnvironmental Gradients
[46] It has been hypothesized that the turnover of stabi-lized SOM occurs when aggregates are disrupted, exposingOM surfaces to decomposer activity [Oades, 1989, 1993,1995; Tisdall and Oades, 1982; VanVeen and Kuikman,1990]. Direct physical disturbance of soil aggregate struc-ture results in the mineralization of large quantities of C andN by soil microorganisms [Beare et al., 1994]. Moreover,much of the early success of temperate agriculture can beattributed to the release of physically protected soil-organicnutrients by mechanical tillage over decadal timescales,although the ongoing release of soil-organic nutrients canresult in the depletion of the stabilized SOM pool’s nutrientreservoir [Tiessen et al., 1994].[47] Mechanisms for the physical disruption of soil aggre-
gates (as shown in Figure 8b) include root growth, pene-tration by fungal hyphae, activity of burrowing fauna,shrink/swell or freeze/thaw, and mechanical tillage. Withthe possible exception of fungal hyphae, these mechanismsseem unlikely to be directed at any particular soil fraction. Ifall fractions are disrupted equally, stabilized SOM withinthem experiences the same probability of exposure fromphysical protection, and therefore has similar residencetimes (as shown in Figure 7a).[48] The hypothesis that the disruption of soil structure
drives the mineralization of stabilized SOM appears to beconsistent with stabilized SOC residence times that decreaseas soil age increases. This observation is a very importantresult, because mineral-associated SOM is the dominantSOC pool in the horizons studied, yet the apparent trendcannot be explained by generally accepted arguments thatSOC residence times are a function of soil clay content orclimate [Anderson and Paul, 1984; Burke et al., 1989;Parton et al., 1987]: the 1–3 Myr soils have the highestclay (field textures indicated 8–10% clay at 200 kyr, 5–8%clay at 600 kyr, and 10–15% at 1–3 Myr in agreement withHarden [1987]) but shortest stabilized SOC residence times,and the soils experience similar climate. Assuming thatplants allocate more C to growth of roots and mycorrhizaas soil-nutrient availability decreases [Landsberg and War-ing, 1997], higher rates of stabilized SOM turnover in the1–3 Myr soils could be related to increased root andmycorrhizal activity as a result of decreased N and Pavailability in highly weathered soils [Baisden et al.,2002]. If supported by further research, this hypothesissuggests that, in addition to mechanisms of physical soildisturbance, terrestrial ecosystem biogeochemistry modelsshould consider feedbacks between plant C allocation toroots and stabilized SOM turnover rates.[49] The following caveats apply to the conceptual model
and hypothesized relationship between stabilized SOM
Figure 8. Conceptual model for the flow of OM into andout of mineral-associated fractions. (a) The inflow of OMbegins when plant litter enters FPOM. Batches of FPOMbecome coated by mineral particles, which preservedecomposition products and protect OM from furtherdecomposition. The proportion of the original OM remain-ing determines the particle size of mineral-associated OM,and therefore the density of the OM + mineral particles afterultrasonic disruption. If the decomposition of individualFPOM parcels follows a Rayleigh Distillation model, thendenser fractions have higher d13CStab and d15NStab. The lastcolumn of input material represents ‘‘square pegs’’ whichare discussed in the text. Note that sand-sized particles areisolated in the DF, while they may have contributed tophysical protection of MALF OM. (b) All four mineral-associated fractions exist together in soil and decomposeprimarily when released from physical protection bydisturbances such as root growth, burrowing, etc.
64 - 14 BAISDEN ET AL.: TURNOVER AND STORAGE OF C AND N
turnover and plant belowground C allocation. First, densityfractionation results can vary considerably between soilswith different mineralogies [Six et al., 2000], so caution isadvised in applying these concepts to soils that are differentfrom those studied. Despite this, soils derived from graniticalluvium were selected to be representative of typicalcontinental environments and represent a substantial weath-ering gradient [White et al., 1996]. In addition, the turnovertimes obtained from density fractionation are supported by alargely independent method [Baisden et al., 2002]. Second,these results are representative of soil aggregration at scales<2 mm but may not incorporate larger scale soil structure.Larger scale soil structure may be important when roots,colloids, and dissolved OM regularly pass through limitedpore space or cracks between aggregates rather than soilvolume as a whole [Kooistra and van Noordwijk, 1996]. Weobserved this phenomenon in horizons below 20 cm, andtherefore note that the active zone of SOM cycling may beconcentrated within ‘‘hot spots’’ in some soils and soilhorizons. Large-scale separation of ‘‘hot spots’’ from zonesof inactivity could lead to differences in stabilized SOMresidence times.[50] In summary, the conceptual model, as drawn in
Figure 8, implies the following for models of SOM turn-over. Lag times (Equation (1a) and Table 5) suggest thatthese pathways of stabilized SOM formation are not pro-longed, and that stabilized SOM does not progress througha series of stages. Despite this, stabilized SOM may form bya variety of pathways involving varying degrees of preser-vation of the original organic matter input. The stabilizedpool remains physically protected until disturbance occurs.Research and models of SOM should consider the possi-bility that stabilized SOM turnover is linked to belowgroundplant allocation as well as other physical disturbance mech-anisms.
5. Conclusions
[51] We separated five soil-density fractions, which dis-play clear differences in the properties of SOM containedwithin them. All three indicators of decomposition (C:Nratio, d13C, and d15N) suggest higher degrees of SOMdecomposition with increasing density across the soil frac-tions. SOM turnover rates derived from D
14C measurementssuggest that FPOM contains �90% active SOC which turnsover much more quickly than SOM in the mineral-associ-ated fractions. The four mineral-associated fractions contain69–86% stabilized (decadal) SOC with the remainderassumed to be passive (millennial) SOC with a residencetime of �3500 years. Within each soil, the four mineral-associated fractions display approximately the same resi-dence time (34–42 years in 200 kyr soil, 29–37 years in600 kyr soil, and 18–26 year in 1–3 Myr soils), indicatingthat a single stabilized SOM pool exists in these soils. Forfuture use of D14C to measure SOC turnover in similar soils,the use of FPOM is recommended to separate an activeSOM pool from stabilized and passive mineral-associatedSOM pools. The trend of decreasing stabilized SOM resi-dence times as a function of soil age suggests that processeswhich release stabilized SOM from physical protection
within soil aggregate structure are more abundant in theolder soil. Candidates for processes that disrupt soil struc-ture include burrowing fauna, clay shrink/swell activity, andthe growth of plant roots and fungal hyphae. If the growthof plant roots and fungal hyphae play a role in stabilizedSOM turnover, this effect could be included in ecosystembiogeochemistry models.
[52] Acknowledgments. We thank the graphite laboratory at CAMSfor assistance with samples, as well as Mary Firestone and Teri C. Balserfor ideas that helped this project develop. Julia Gaudinski and JenniferHarden provided helpful suggestions for laboratory methods and fieldsampling, respectively. Carrie Masiello, Cristina Castahna, and two anon-ymous reviewers provided helpful reviews of earlier drafts. Funding for thiswork was provided by a NASA Earth System Science Fellowship to WTB,the Kearney Foundation for Soil Science, an LLNL-UC collaborativeresearch program, and the University of California DANR.
ReferencesAmundson, R., and W. T. Baisden, Stable isotope tracers and mathematicalmodels in soil organic matter studies, in Methods in Ecosystem Science,edited by O. E. Sala et al., pp. 117–134, Springer–Verlag, New York,2000.
Anderson, D. W., and E. A. Paul, Organo-mineral complexes and the studyby radiocarbon dating, Soil Sci. Soc. Am. J., 48, 298–301, 1984.
Arkley, R. J., Soil Survey of the Merced Area, California, U.S.D.A. SoilSurvey Serial, Washington, D. C., 1962.
Arkley, R. J., Soil Survey of the Eastern Stanislaus Area, California,U.S.D.A. Soil Survey Serial, Washington, D. C., 1964.
Baisden, W. T., R. G. Amundson, D. L. Brenner, A. C. Cook, C. Kendall,and J. Harden, A multi-isotope C and N modeling analysis of soil organicmatter turnover and transport as a function of soil depth in a Californiaannual grassland soil chronosequence, Global Biogeochem. Cycles, 16,doi:10.1029/2001GB001823, in press, 2002.
Beare, M. H., M. L. Cabrera, P. F. Hendrix, and D. C. Coleman, Aggregate-protected and unprotected organic matter pools in conventional and notillage soils, Soil Sci. Soc. Am. J., 58, 787–795, 1994.
Berger, R., Clean air D14C from a California high desert site, Radiocarbon,29, 18–23, 1987.
Bevington, P. R., Data Reduction and Error Analysis for the PhysicalSciences, 336 pp., McGraw-Hill, New York, 1969.
Brenner, D. L., W. T. Baisden, C. Kendall, J. Harden, and R. Amundson,Soil N and 15N variation with time in a California Annual GrasslandEcosystem, Geochim. Cosmochim. Acta, 65(22), 4171–4186, 2001.
Burke, I., C. Yonker, W. Parton, C. Cole, K. Flach, and D. Schimel, Tex-ture, climate and cultivation effects on soil organic matter content in U.S.grassland soils, Soil Sci. Soc. Am. J., 53, 800–805, 1989.
Cambardella, C. A., and E. T. Elliott, Methods for physical separation andcharacterization of soil organic matter fractions, Geoderma, 56(1 –4),449–457, 1993.
Cambardella, C. A., and E. T. Elliot, Carbon and nitrogen dynamics of soilorganic matter fractions from cultivated grassland soils, Soil Sci. Soc. Am.J., 58, 123–130, 1994.
Carter, M. R., Analysis of soil organic matter storage in agroecosystems, inStructure and Organic Matter Storage in Agricultural Soils, edited by M.R. Carter and B. A. Stewart, pp. 3–14, CRC Press, Boca Raton, Fla.,1996.
Carter, M. R., and E. G. Gregorich, Methods to characterize and quantifyorganic matter storage in soil fractions and aggregates, in Structure andOrganic Matter Storage in Agroecosystems, edited by M. R. Carter andB. A. Stewart, pp. 449–468, CRC Press, Boca Raton, Fla., 1996.
Carter, M. R., and B. A. Stewart, Structure and Organic Matter Storage inAgricultural Soils, 477 pp., CRC Press, Boca Raton, Fla., 1996.
Davidson, E. A., and I. L. Ackerman, Changes in soil carbon inventoriesfollowing cultivation of previously untilled soils, Biogeochemistry, 20,161–193, 1993.
Elliott, E. T., Aggregate structure and carbon, nitrogen and phosphorus innative and cultivated soils, Soil Sci. Soc. Am. J., 50, 627–633, 1986.
Gaudinski, J. B., S. E. Trumbore, E. A. Davidson, and S. H. Zheng, Soilcarbon cycling in a temperate forest: Radiocarbon-based estimates ofresidence times, sequestration rates and partitioning of fluxes, Biogeo-chemistry, 51(1), 33–69, 2000.
Golchin, A., J. M. Oades, J. O. Skjemstad, and P. Clarke, Soil structure andcarbon cycling, Aust. J. Soil Res., 32, 1043–1068, 1994a.
BAISDEN ET AL.: TURNOVER AND STORAGE OF C AND N 64 - 15
Golchin, A., J. M. Oades, J. O. Skjemstad, and P. Clarke, Study of free andoccluded particulate organic matter in soils by solid state 13C CP/MASNMR spectroscopy and scanning electron microscopy, Aust. J. Soil. Res.,32, 285–309, 1994b.
Golchin, A., P. Clarke, J. M. Oades, and J. O. Skjemstad, The effects ofcultivation on the composition of organic matter and structural stability ofsoils, Aust. J. Soil Res., 33, 975–993, 1995a.
Golchin, A., J. M. Oades, J. O. Skjemstad, and P. Clarke, Structural anddynamic properties of soil organic matter as reflected by 13C naturalabundance, pyrolysis mass spectrometry and solid state 13C NMR spec-troscopy in density fractions of an oxisol under forest and pasture, Aust.J. Soil Res., 33, 59–76, 1995b.
Harden, J. W., Soils Developed on Granitic Alluvium near Merced, Cali-fornia, USGS, 1987.
Jenkinson, D. S., The turnover of organic carbon and nitrogen in soil,Philos. Trans. R. Soc. London, Ser. B, 329, 361–368, 1990.
Jones, M. B., and R. G. Woodmansee, Biogeochemical cycling in annualgrassland ecosystems, Bot. Rev., 45(2), 111–144, 1979.
Karlen, D. L., and C. Cambardella, Conservation strategies for improvingsoil quality and organic matter storage, in Structure and Organic MatterStorage in Agroecosystems, edited by M. R. Carter and B. A. Stewart, pp.395–420, CRC Press, Boca Raton, Fla., 1996.
Kooistra, M. J., and M. van Noordwijk, Soil architecture and distribution oforganic matter, in Structure and Organic Matter Storage in Agroecosys-tems, edited by M. R. Carter and B. A. Stewart, pp. 15–56, CRC Press,Boca Raton, Fla., 1996.
Lal, R., and J. M. Kimble, Conservation tillage for carbon sequestration,Nutrient Cycling Agroecosystems, 49(1–3), 243–253, 1997.
Landsberg, J. J., and R. H. Waring, A generalised model of forest produc-tivity using simplified concepts of radiation-use efficiency, carbon bal-ance and partitioning, For. Ecol. Manage., 95, 209–228, 1997.
Levin, I., and B. Kromer, Twenty years of atmospheric (CO2)-C-14 obser-vations at Schauinsland station, Germany, Radiocarbon, 39(2), 205–218,1997.
Levin, I., B. Kromer, H. Schoch-Fischer, M. Bruns, M. Munnich, D. Ber-dau, J. C. Vogel, and K. O. Munnich, D14CO2 record from Vermunt, inTrends: A Compendium Of Data On Global Change, Carbon DioxideInformation Analysis Center, Oak Ridge National Laboratory, OakRidge, TN, USA, 1994.
Marchand, D., and A. Allwardt, Late Cenozoic Stratigraphic Units in TheNortheastern San Joaquin Valley, California, U.S.G.S. Bulletin, 1981.
Minagawa, M., D. Winter, and I. Kaplan, Comparison of Kjeldahl andcombustion methods for measurement of nitrogen isotope ratios in or-ganic matter, Anal. Chem., 56, 1859–1861, 1984.
Nadelhoffer, K., and B. Fry, Controls on natural nitrogen-15 and carbon-13abundances in forest soil organic matter, Soil Sci. Soc. Am. J., 52, 1633–1640, 1988.
Nydal, R., and K. Lovseth, Carbon-14 Measurements in Atmospheric CO2-
From Northern and Southern Hemisphere Sites, 1962–1993, Oak RidgeNational Laboratory, Oak Ridge, TN, USA, 1997.
Oades, J. M., An introduction to organic matter in mineral soils, inMineralsin Soil Environments, edited by J. B. Dixon and S. B. Weed, pp. 89–159,Soil Sci. Soc. of Am., Madison, Wis., 1989.
Oades, J. M., The role of biology in the formation, stabilization and de-gradation of soil structure, Geoderma, 56, 377–400, 1993.
Oades, J., An overview of processes affecting the cycling of organic carbonin soils, in The Role of Nonliving Organic Matter in the Earth’s Carbon
Cycle, edited by R. Zepp and C. Sontagg, pp. 293–304, John Wiley, NewYork, 1995.
Oades, J. M., and A. G. Waters, Aggregate hierarchy in soils, Aust. J. SoilRes., 29, 815–828, 1991.
Parton, W. J., D. S. Schimel, C. V. Cole, and D. S. Ojima, Analysis offactors controlling soil organic matter levels in Great Plains grasslands,Soil Sci. Soc. Am. J., 51, 1173–1179, 1987.
Parton, W. J., D. S. Ojima, and D. S. Schimel, Models to evaluate soilorganic matter storage and dynamics, in Structure and Organic MatterStorage in Agroecosystems, edited by M. R. Carter and B. A. Stewart,CRC Press, Boca Raton, Fla., 1996.
Paul, E., R. Follet, S. Leavitt, A. Halvorson, G. Peterson, and D. Lyon,Radiocarbon dating for determination of soil organic matter pool sizesand dynamics, Soil Sci. Soc. Am. J., 61, 1058–1068, 1997.
Schonhofer, F., C-14 in Austrian Wine and Vinegar, Radiocarbon, 34(3),768–771, 1992.
Six, J., R. Merckx, K. Kimpe, K. Paustian, and E. T. Elliott, A re-evaluationof the enriched labile soil organic matter fraction, Eur. J. Soil Sci., 51(2),283–293, 2000.
Tiessen, H., E. Cuevas, and P. Chacon, The role of soil organic matter insustaining soil fertility, Nature, 371, 783–785, 1994.
Tisdall, J. M., and J. M. Oades, Organic matter and water-stable aggregatesin soils, J. Soil Sci., 33, 141–163, 1982.
Torn, M. S., S. E. Trumbore, O. A. Chadwick, P. M. Vitousek, and D. M.Hendricks, Mineral control of soil organic carbon storage and turnover,Nature, 389(6647), 170–173, 1997.
Trumbore, S. E., Comparison of carbon dynamics in tropical and temperatesoils using radiocarbon measurements, Global Biogeochem. Cycles, 7,275–290, 1993.
Trumbore, S. E., Age of soil organic matter and soil respiration: Radio-carbon constraints on belowground dynamics, Ecol. Appl., 10(2), 399–411, 2000.
Trumbore, S. E., and S. Zheng, Comparison of fractionation methods forsoil organic matter 14C analysis, Radiocarbon, 38, 219–229, 1996.
Trumbore, S., O. Chadwick, and R. Amundson, Rapid exchange betweensoil carbon and atmospheric carbon dioxide driven by temperaturechange, Science, 272, 393–396, 1996.
VanVeen, J. A., and P. J. Kuikman, Soil structural aspects of decompositionof organic matter by micro-organisms, Biogeochemistry, 11, 213–233,1990.
White, A., A. Blum, M. Schulz, T. Bullen, J. Harden, and M. Peterson,Chemical weathering rates of a soil chronosequence on granitic alluvium,part I. Quantification of mineralogical and surface area changes andcalculations of primary silicate reaction rates, Geochim. Cosmochim.Acta, 60, 2533–2550, 1996.
�������������������������R. Amundson and D. L. Brenner, Ecosystem Sciences Division,
Department of ESPM, University of California, Berkeley, Berkeley, CA94720, USA.W. T. Baisden, Landcare Research, Massey University Campus, Private
Bag 11052, Palmerston North, New Zealand. ([email protected])A. C. Cook, Center for Accelerator Mass Spectrometry, Lawrence
Livermore National Laboratory, Livermore, CA 94550, USA.
64 - 16 BAISDEN ET AL.: TURNOVER AND STORAGE OF C AND N