34
© EnerNOC, Inc. All rights reserved. www.enernoc.com Updated Q1 2018 TVA EnerNOC Demand Response Program
© EnerNOC, Inc. All rights reserved. www.enernoc.com
Updated Q1 2018
TVA EnerNOC Demand Response Program
1 © EnerNOC, Inc. All rights reserved. www.enernoc.com
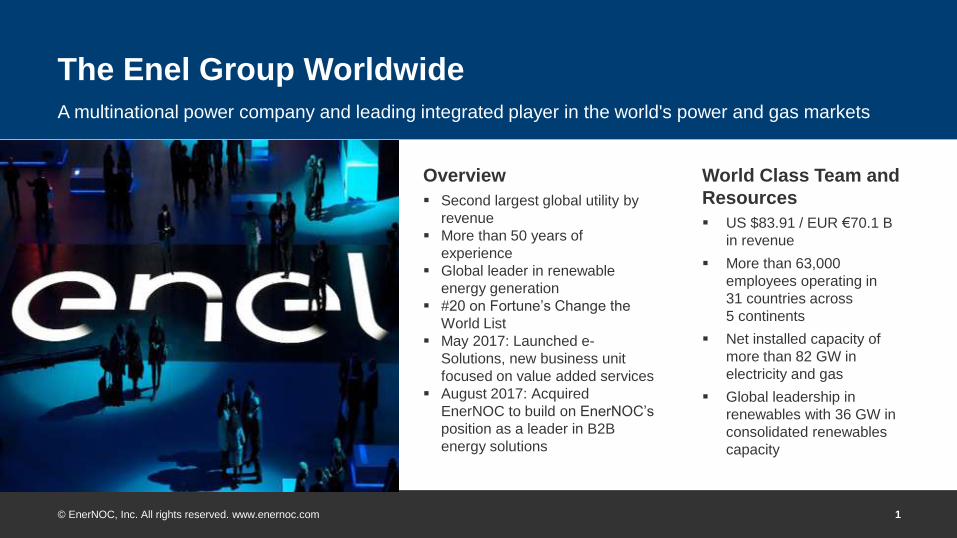
The Enel Group Worldwide
A multinational power company and leading integrated player in the world's power and gas markets
World Class Team and
Resources
US $83.91 / EUR €70.1 B
in revenue
More than 63,000
employees operating in
31 countries across
5 continents
Net installed capacity of
more than 82 GW in
electricity and gas
Global leadership in
renewables with 36 GW in
consolidated renewables
capacity
Overview
Second largest global utility by
revenue
More than 50 years of
experience
Global leader in renewable
energy generation
#20 on Fortune’s Change the
World List
May 2017: Launched e-
Solutions, new business unit
focused on value added services
August 2017: Acquired
EnerNOC to build on EnerNOC’s
position as a leader in B2B
energy solutions
2 © EnerNOC, Inc. All rights reserved. www.enernoc.com
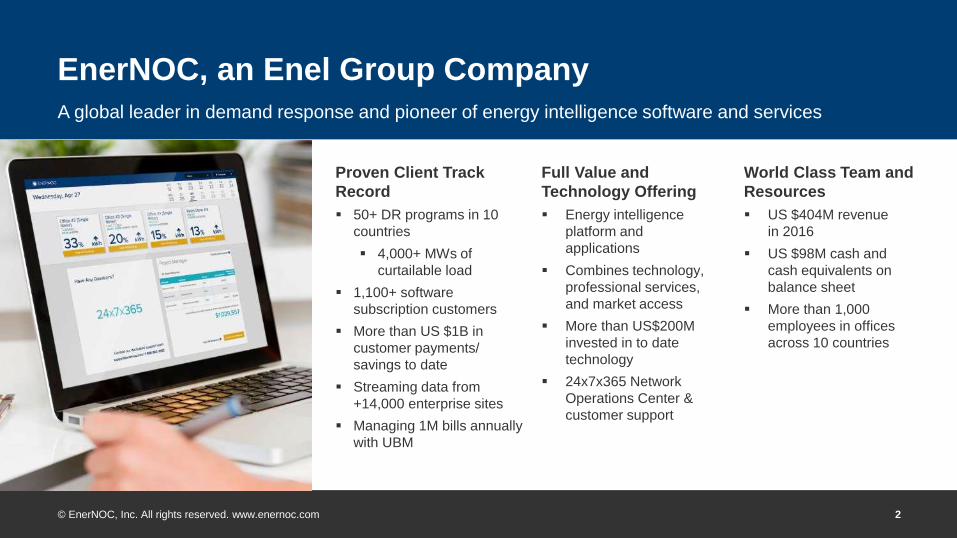
EnerNOC, an Enel Group Company
A global leader in demand response and pioneer of energy intelligence software and services
World Class Team and
Resources
US $404M revenue
in 2016
US $98M cash and
cash equivalents on
balance sheet
More than 1,000
employees in offices
across 10 countries
Proven Client Track
Record
50+ DR programs in 10
countries
4,000+ MWs of
curtailable load
1,100+ software
subscription customers
More than US $1B in
customer payments/
savings to date
Streaming data from
+14,000 enterprise sites
Managing 1M bills annually
with UBM
Full Value and
Technology Offering
Energy intelligence
platform and
applications
Combines technology,
professional services,
and market access
More than US$200M
invested in to date
technology
24x7x365 Network
Operations Center &
customer support
3 © EnerNOC, Inc. All rights reserved. www.enernoc.com
Intro to Demand Response
4 © EnerNOC, Inc. All rights reserved. www.enernoc.com
Winter
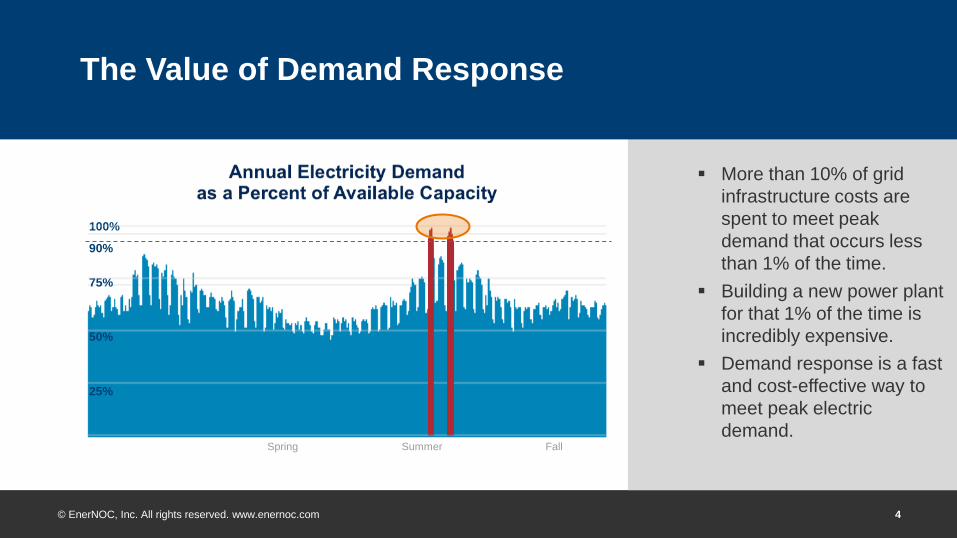
The Value of Demand Response
More than 10% of grid
infrastructure costs are
spent to meet peak
demand that occurs less
than 1% of the time.
Building a new power plant
for that 1% of the time is
incredibly expensive.
Demand response is a fast
and cost-effective way to
meet peak electric
demand.
Spring Summer Fall
100%
25%
50%
75%
90%
5 © EnerNOC, Inc. All rights reserved. www.enernoc.com
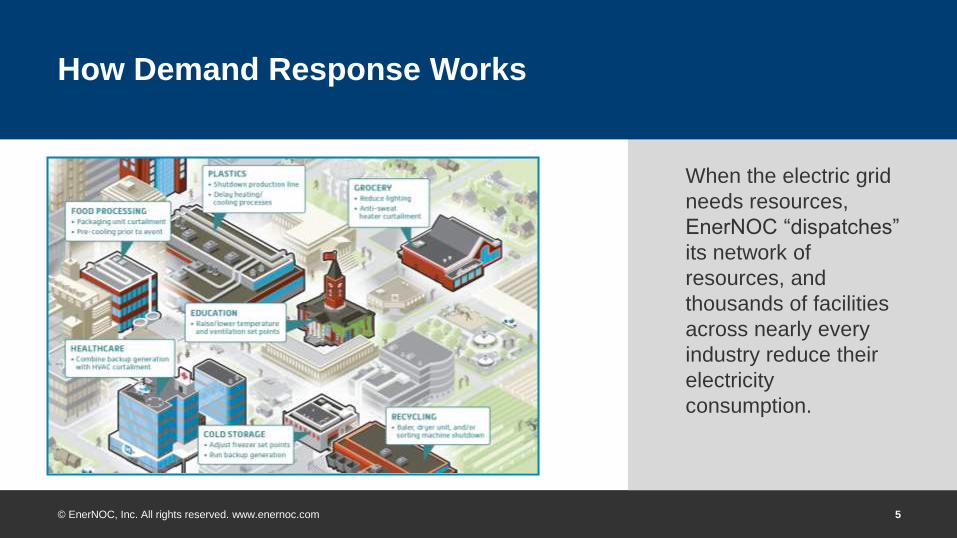
How Demand Response Works
When the electric grid
needs resources,
EnerNOC “dispatches”
its network of
resources, and
thousands of facilities
across nearly every
industry reduce their
electricity
consumption.
6 © EnerNOC, Inc. All rights reserved. www.enernoc.com
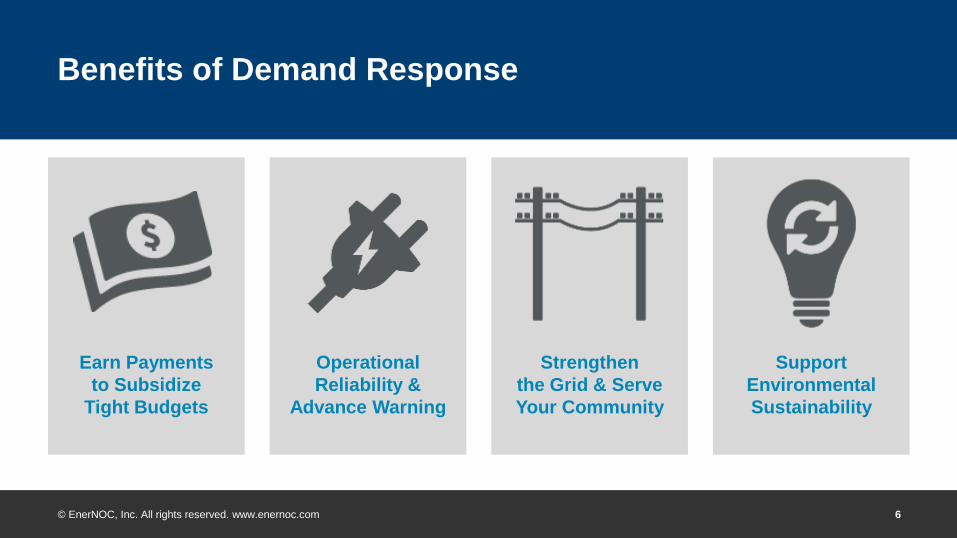
Benefits of Demand Response
Earn Payments
to Subsidize
Tight Budgets
Operational
Reliability &
Advance Warning
Strengthen
the Grid & Serve
Your Community
Support
Environmental
Sustainability
7 © EnerNOC, Inc. All rights reserved. www.enernoc.com
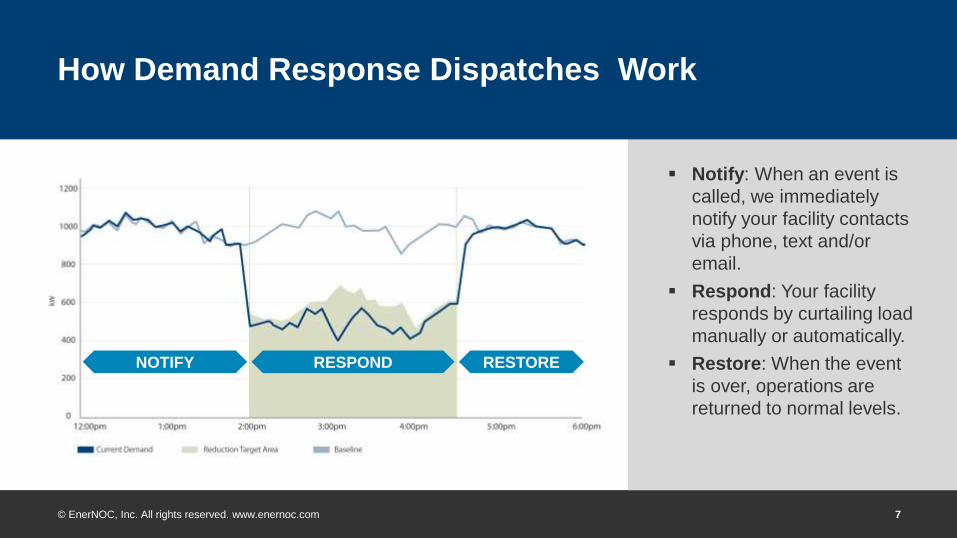
How Demand Response Dispatches Work
Notify: When an event is
called, we immediately
notify your facility contacts
via phone, text and/or
email.
Respond: Your facility
responds by curtailing load
manually or automatically.
Restore: When the event
is over, operations are
returned to normal levels.
NOTIFY RESPOND RESTORE
8 © EnerNOC, Inc. All rights reserved. www.enernoc.com
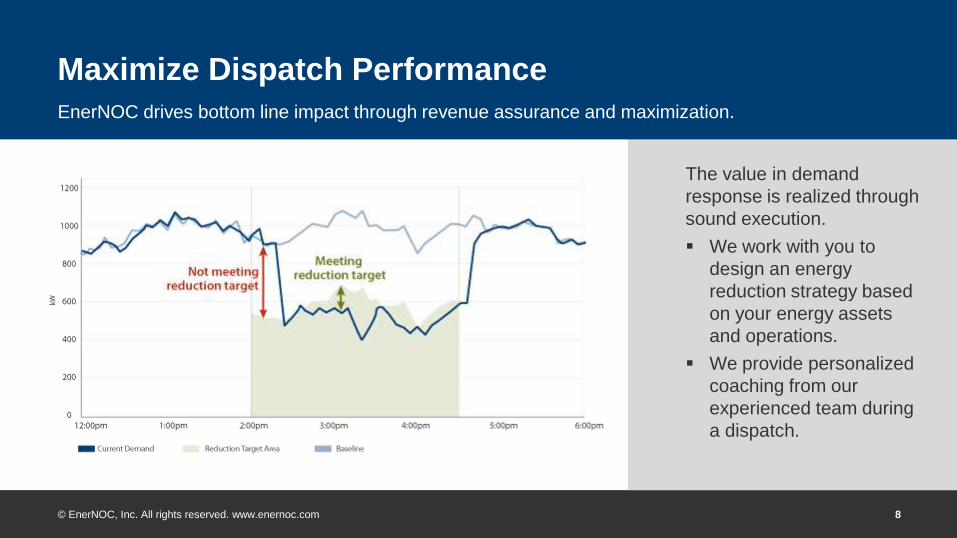
Maximize Dispatch Performance
EnerNOC drives bottom line impact through revenue assurance and maximization.
The value in demand
response is realized through
sound execution.
We work with you to
design an energy
reduction strategy based
on your energy assets
and operations.
We provide personalized
coaching from our
experienced team during
a dispatch.
9 © EnerNOC, Inc. All rights reserved. www.enernoc.com
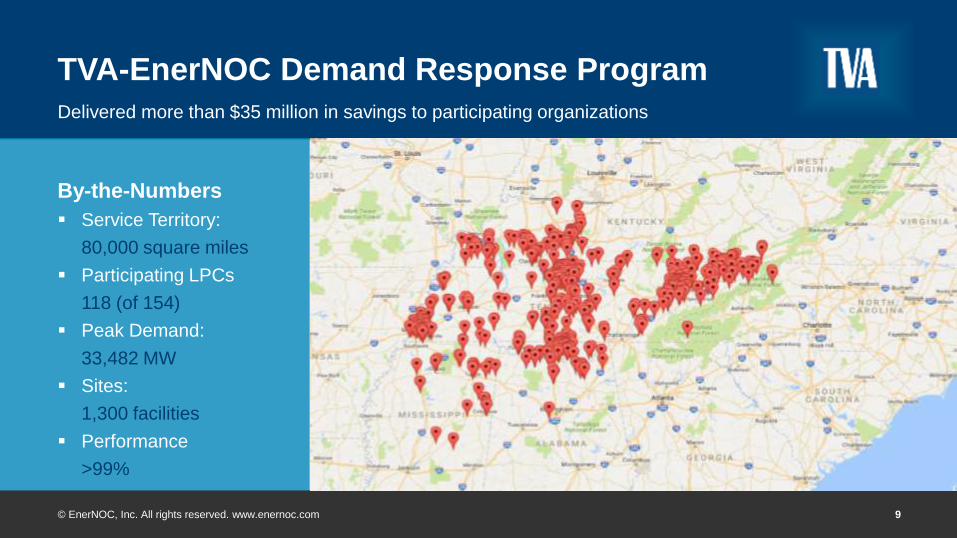
TVA-EnerNOC Demand Response Program
Delivered more than $35 million in savings to participating organizations
By-the-Numbers
Service Territory:
80,000 square miles
Participating LPCs
118 (of 154)
Peak Demand:
33,482 MW
Sites:
1,300 facilities
Performance
>99%
10 © EnerNOC, Inc. All rights reserved. www.enernoc.com
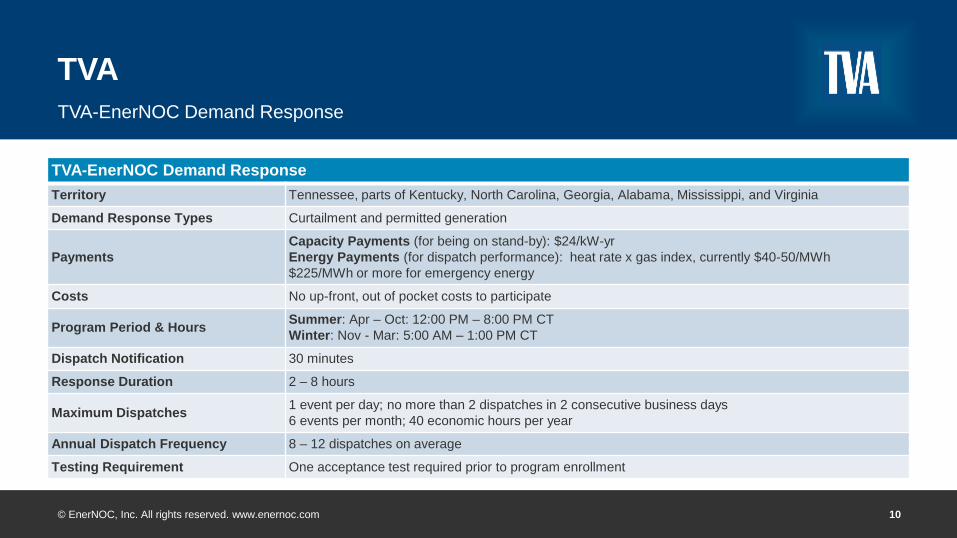
TVA
TVA-EnerNOC Demand Response
TVA-EnerNOC Demand Response
Territory Tennessee, parts of Kentucky, North Carolina, Georgia, Alabama, Mississippi, and Virginia
Demand Response Types Curtailment and permitted generation
Payments
Capacity Payments (for being on stand-by): $24/kW-yr
Energy Payments (for dispatch performance): heat rate x gas index, currently $40-50/MWh
$225/MWh or more for emergency energy
Costs No up-front, out of pocket costs to participate
Program Period & Hours Summer: Apr – Oct: 12:00 PM – 8:00 PM CT
Winter: Nov - Mar: 5:00 AM – 1:00 PM CT
Dispatch Notification 30 minutes
Response Duration 2 – 8 hours
Maximum Dispatches 1 event per day; no more than 2 dispatches in 2 consecutive business days
6 events per month; 40 economic hours per year
Annual Dispatch Frequency 8 – 12 dispatches on average
Testing Requirement One acceptance test required prior to program enrollment
11 © EnerNOC, Inc. All rights reserved. www.enernoc.com
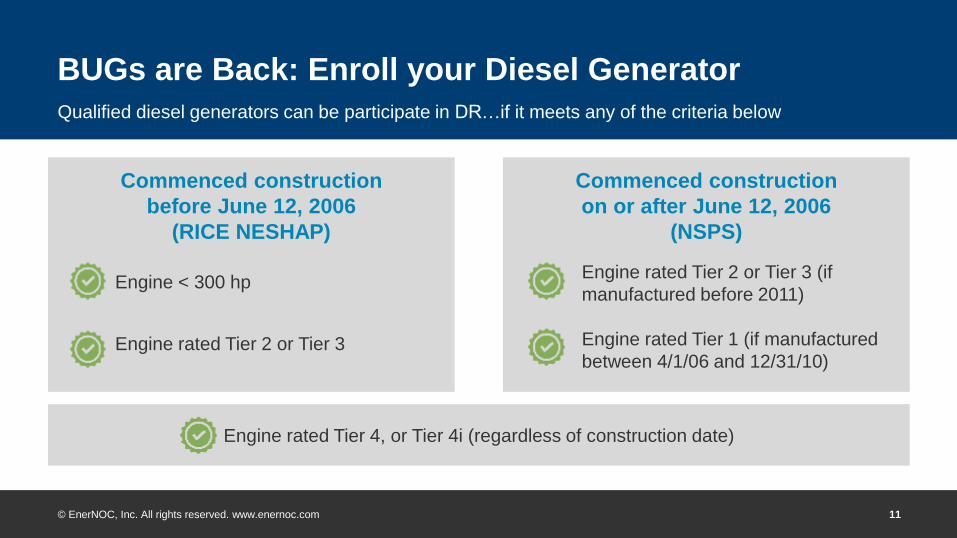
Engine rated Tier 4, or Tier 4i (regardless of construction date)
BUGs are Back: Enroll your Diesel Generator
Qualified diesel generators can be participate in DR…if it meets any of the criteria below
Commenced construction
on or after June 12, 2006
(NSPS)
Engine rated Tier 2 or Tier 3 (if
manufactured before 2011)
Engine rated Tier 1 (if manufactured
between 4/1/06 and 12/31/10)
Commenced construction
before June 12, 2006
(RICE NESHAP)
Engine < 300 hp
Engine rated Tier 2 or Tier 3
12 © EnerNOC, Inc. All rights reserved. www.enernoc.com
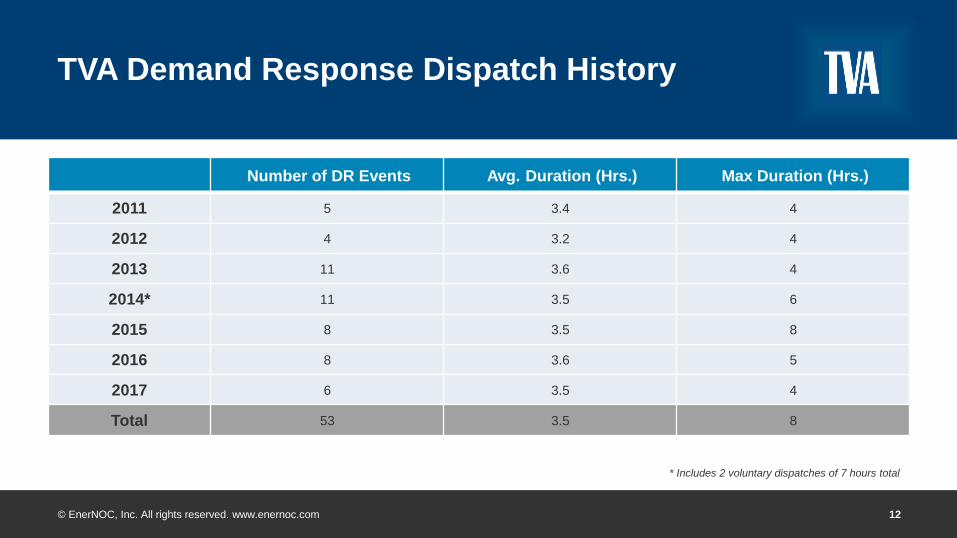
* Includes 2 voluntary dispatches of 7 hours total
TVA Demand Response Dispatch History
Number of DR Events Avg. Duration (Hrs.) Max Duration (Hrs.)
2011 5 3.4 4
2012 4 3.2 4
2013 11 3.6 4
2014* 11 3.5 6
2015 8 3.5 8
2016 8 3.6 5
2017 6 3.5 4
Total 53 3.5 8
13 © EnerNOC, Inc. All rights reserved. www.enernoc.com
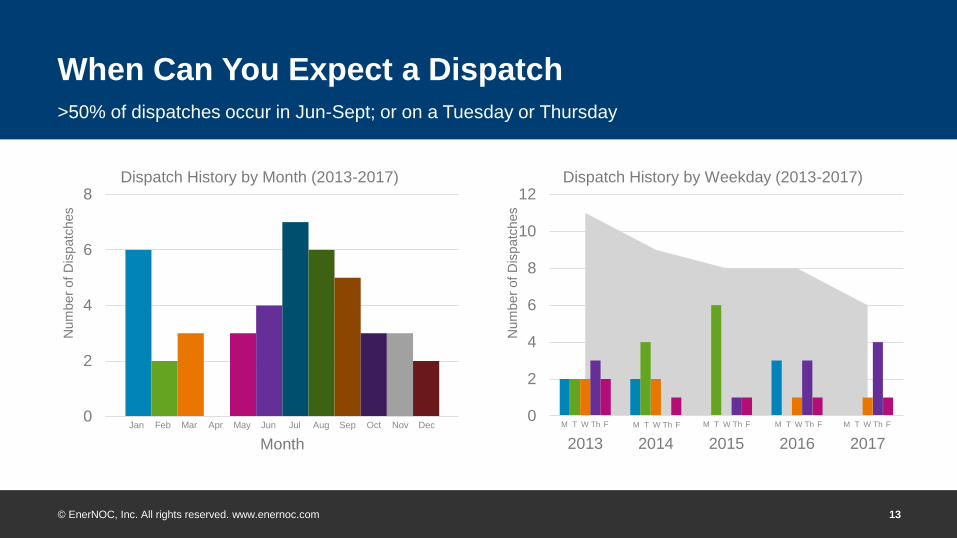
When Can You Expect a Dispatch
>50% of dispatches occur in Jun-Sept; or on a Tuesday or Thursday
0
2
4
6
8
10
12
2013 2014 2015 2016 2017
Num
ber
of
Dis
patc
hes
Dispatch History by Weekday (2013-2017)
M T W Th F Jan Feb Mar Apr May Jun Jul Aug Sep Oct Nov Dec 0
2
4
6
8
Month
Num
ber
of
Dis
patc
hes
Dispatch History by Month (2013-2017)
M T W Th F M T W Th F M T W Th F M T W Th F
14 © EnerNOC, Inc. All rights reserved. www.enernoc.com
The Value of Real-time Energy Data
15 © EnerNOC, Inc. All rights reserved. www.enernoc.com
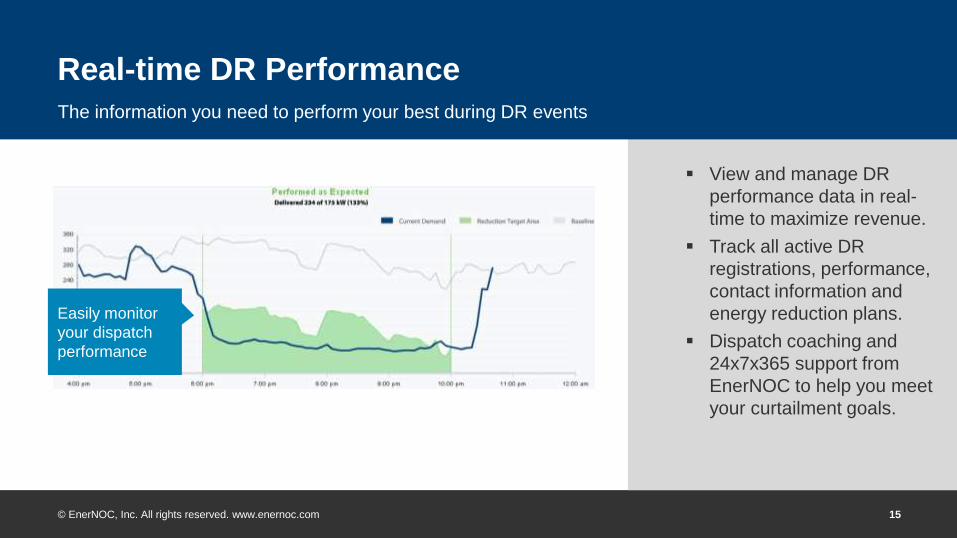
Real-time DR Performance
The information you need to perform your best during DR events
View and manage DR
performance data in real-
time to maximize revenue.
Track all active DR
registrations, performance,
contact information and
energy reduction plans.
Dispatch coaching and
24x7x365 support from
EnerNOC to help you meet
your curtailment goals.
Easily monitor
your dispatch
performance
16 © EnerNOC, Inc. All rights reserved. www.enernoc.com
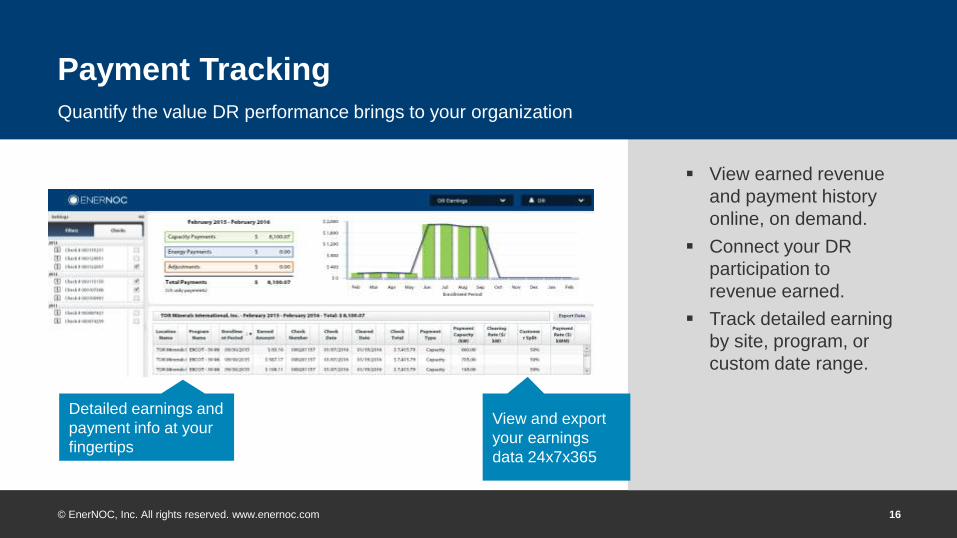
Payment Tracking
Quantify the value DR performance brings to your organization
View earned revenue
and payment history
online, on demand.
Connect your DR
participation to
revenue earned.
Track detailed earning
by site, program, or
custom date range.
Detailed earnings and
payment info at your
fingertips
View and export
your earnings
data 24x7x365
17 © EnerNOC, Inc. All rights reserved. www.enernoc.com
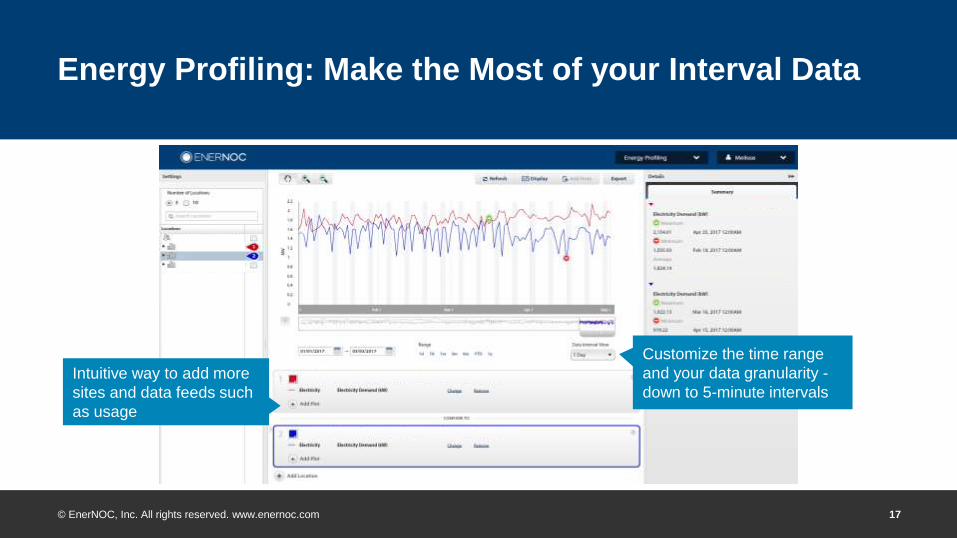
Energy Profiling: Make the Most of your Interval Data
Customize the time range
and your data granularity -
down to 5-minute intervals
Intuitive way to add more
sites and data feeds such
as usage
18 © EnerNOC, Inc. All rights reserved. www.enernoc.com
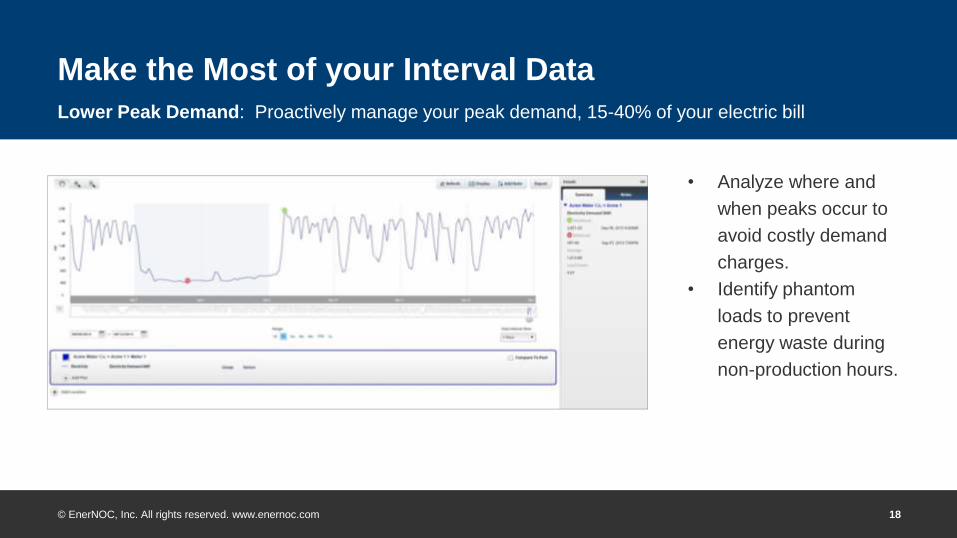
Make the Most of your Interval Data
Lower Peak Demand: Proactively manage your peak demand, 15-40% of your electric bill
• Analyze where and
when peaks occur to
avoid costly demand
charges.
• Identify phantom
loads to prevent
energy waste during
non-production hours.
19 © EnerNOC, Inc. All rights reserved. www.enernoc.com
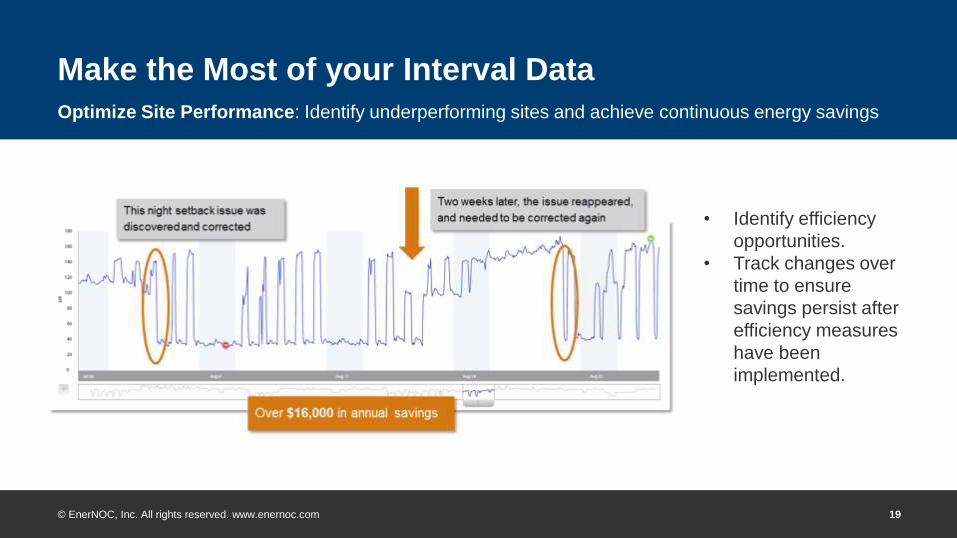
Make the Most of your Interval Data
Optimize Site Performance: Identify underperforming sites and achieve continuous energy savings
• Identify efficiency
opportunities.
• Track changes over
time to ensure
savings persist after
efficiency measures
have been
implemented.
20 © EnerNOC, Inc. All rights reserved. www.enernoc.com
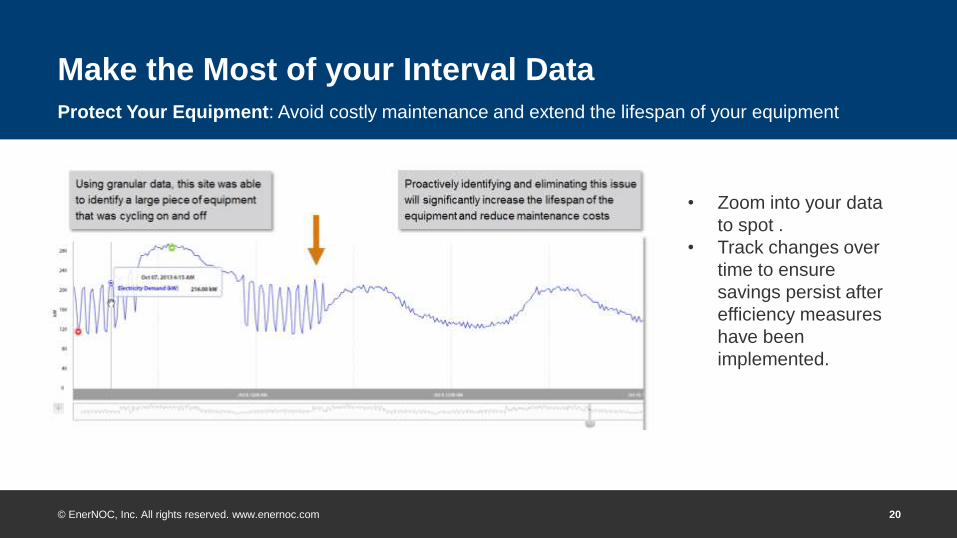
Make the Most of your Interval Data
Protect Your Equipment: Avoid costly maintenance and extend the lifespan of your equipment
• Zoom into your data
to spot .
• Track changes over
time to ensure
savings persist after
efficiency measures
have been
implemented.

21 © EnerNOC, Inc. All rights reserved. www.enernoc.com
Case Studies
22 © EnerNOC, Inc. All rights reserved. www.enernoc.com
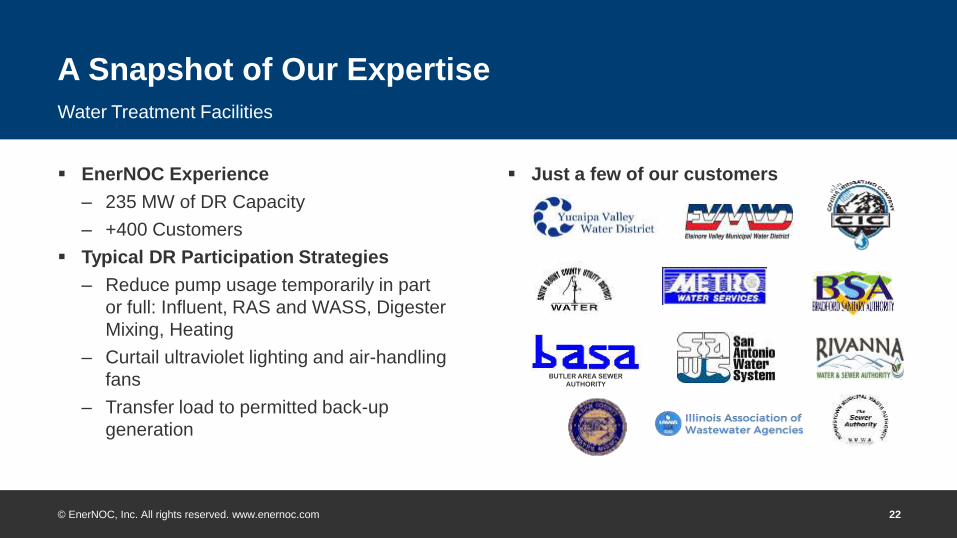
A Snapshot of Our Expertise
Water Treatment Facilities
EnerNOC Experience
– 235 MW of DR Capacity
– +400 Customers
Typical DR Participation Strategies
– Reduce pump usage temporarily in part
or full: Influent, RAS and WASS, Digester
Mixing, Heating
– Curtail ultraviolet lighting and air-handling
fans
– Transfer load to permitted back-up
generation
Just a few of our customers
BUTLER AREA SEWER
AUTHORITY
23 © EnerNOC, Inc. All rights reserved. www.enernoc.com
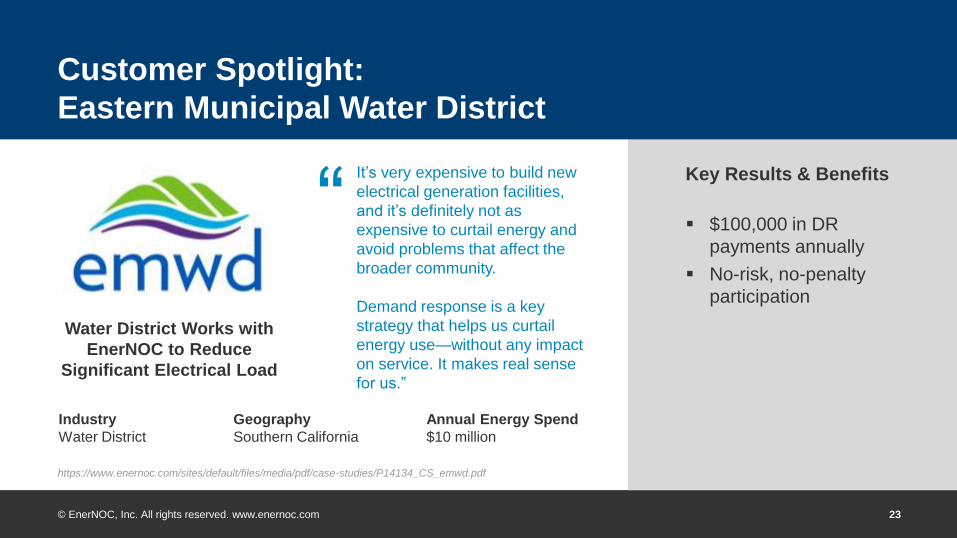
https://www.enernoc.com/sites/default/files/media/pdf/case-studies/P14134_CS_emwd.pdf
Customer Spotlight:
Eastern Municipal Water District
Key Results & Benefits
$100,000 in DR
payments annually
No-risk, no-penalty
participation
It’s very expensive to build new
electrical generation facilities,
and it’s definitely not as
expensive to curtail energy and
avoid problems that affect the
broader community.
Demand response is a key
strategy that helps us curtail
energy use—without any impact
on service. It makes real sense
for us.”
Industry
Water District
Water District Works with
EnerNOC to Reduce
Significant Electrical Load
Geography
Southern California
Annual Energy Spend
$10 million
“
24 © EnerNOC, Inc. All rights reserved. www.enernoc.com
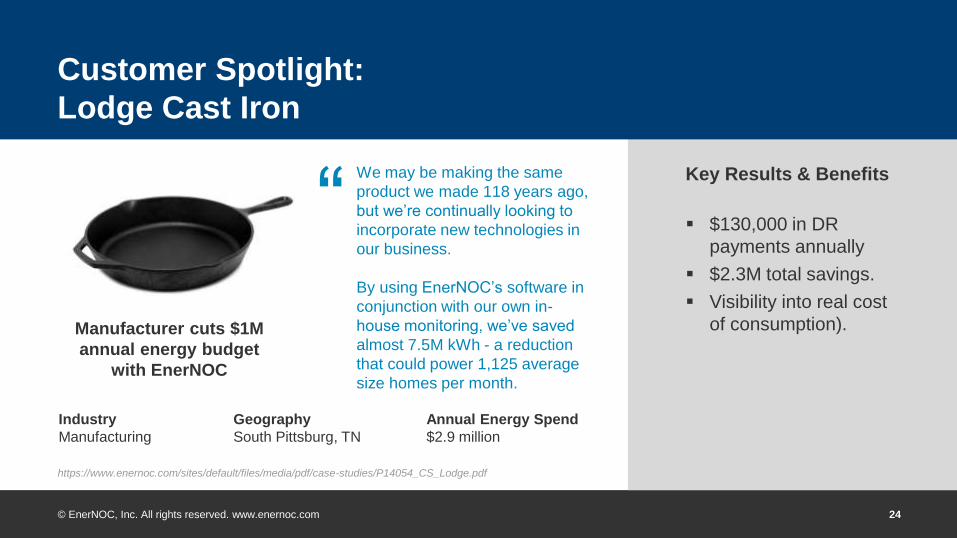
https://www.enernoc.com/sites/default/files/media/pdf/case-studies/P14054_CS_Lodge.pdf
Customer Spotlight:
Lodge Cast Iron
Key Results & Benefits
$130,000 in DR
payments annually
$2.3M total savings.
Visibility into real cost
of consumption).
We may be making the same
product we made 118 years ago,
but we’re continually looking to
incorporate new technologies in
our business.
By using EnerNOC’s software in
conjunction with our own in-
house monitoring, we’ve saved
almost 7.5M kWh - a reduction
that could power 1,125 average
size homes per month.
Industry
Manufacturing
Manufacturer cuts $1M
annual energy budget
with EnerNOC
Geography
South Pittsburg, TN
Annual Energy Spend
$2.9 million
“
25 © EnerNOC, Inc. All rights reserved. www.enernoc.com
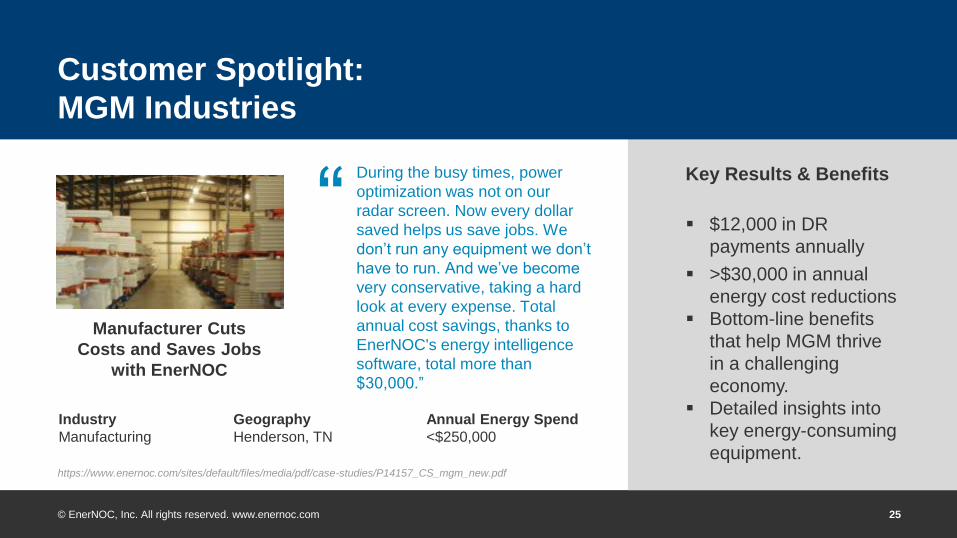
https://www.enernoc.com/sites/default/files/media/pdf/case-studies/P14157_CS_mgm_new.pdf
Customer Spotlight:
MGM Industries
Key Results & Benefits
$12,000 in DR
payments annually
>$30,000 in annual
energy cost reductions
Bottom-line benefits
that help MGM thrive
in a challenging
economy.
Detailed insights into
key energy-consuming
equipment.
During the busy times, power
optimization was not on our
radar screen. Now every dollar
saved helps us save jobs. We
don’t run any equipment we don’t
have to run. And we’ve become
very conservative, taking a hard
look at every expense. Total
annual cost savings, thanks to
EnerNOC's energy intelligence
software, total more than
$30,000.”
Industry
Manufacturing
Manufacturer Cuts
Costs and Saves Jobs
with EnerNOC
Geography
Henderson, TN
Annual Energy Spend
<$250,000
“
26 © EnerNOC, Inc. All rights reserved. www.enernoc.com
https://www.enernoc.com/sites/default/files/media/pdf/case-studies/P14055_cs_us-silica.pdf
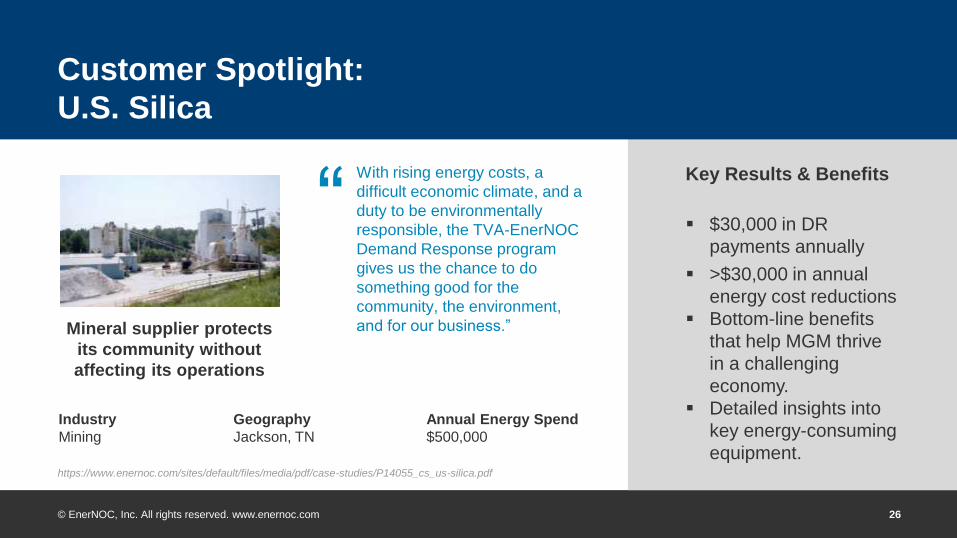
Customer Spotlight:
U.S. Silica
Key Results & Benefits
$30,000 in DR
payments annually
>$30,000 in annual
energy cost reductions
Bottom-line benefits
that help MGM thrive
in a challenging
economy.
Detailed insights into
key energy-consuming
equipment.
With rising energy costs, a
difficult economic climate, and a
duty to be environmentally
responsible, the TVA-EnerNOC
Demand Response program
gives us the chance to do
something good for the
community, the environment,
and for our business.”
Industry
Mining
Mineral supplier protects
its community without
affecting its operations
Geography
Jackson, TN
Annual Energy Spend
$500,000
“

27 © EnerNOC, Inc. All rights reserved. www.enernoc.com
Q&A

© EnerNOC, Inc. All rights reserved. www.enernoc.com
Andrew Geshwiler, Business Development Manager II
615-300-7942
Thank you!
29 © EnerNOC, Inc. All rights reserved. www.enernoc.com
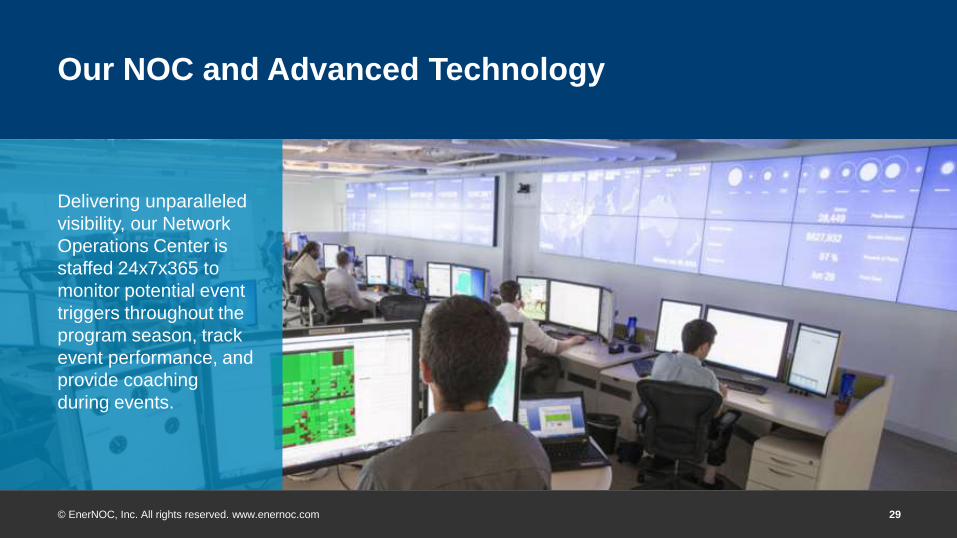
Our NOC and Advanced Technology
Delivering unparalleled
visibility, our Network
Operations Center is
staffed 24x7x365 to
monitor potential event
triggers throughout the
program season, track
event performance, and
provide coaching
during events.
30 © EnerNOC, Inc. All rights reserved. www.enernoc.com
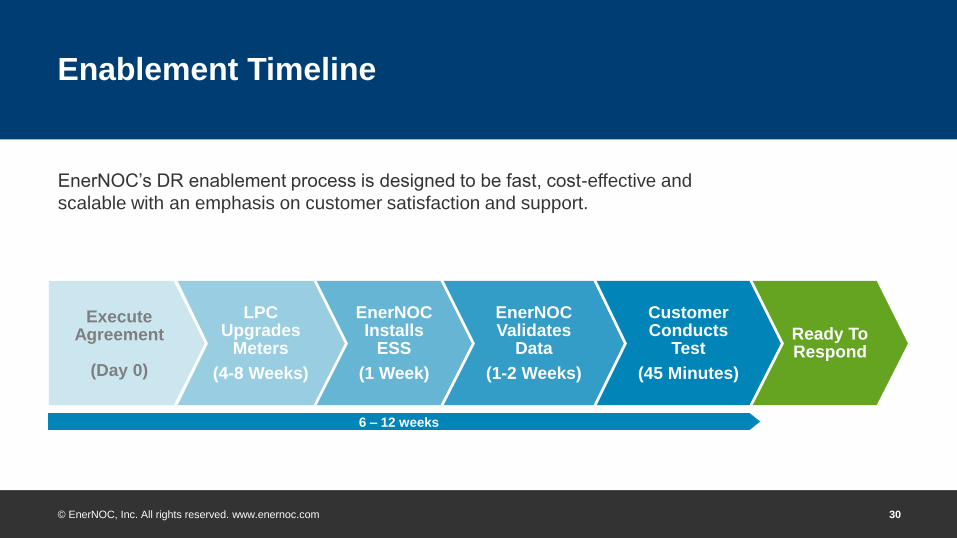
Enablement Timeline
Execute Agreement
(Day 0)
LPC Upgrades
Meters
(4-8 Weeks)
EnerNOC Installs
ESS
(1 Week)
EnerNOC Validates
Data
(1-2 Weeks)
Customer Conducts
Test
(45 Minutes)
Ready To Respond
EnerNOC’s DR enablement process is designed to be fast, cost-effective and
scalable with an emphasis on customer satisfaction and support.
6 – 12 weeks
31 © EnerNOC, Inc. All rights reserved. www.enernoc.com
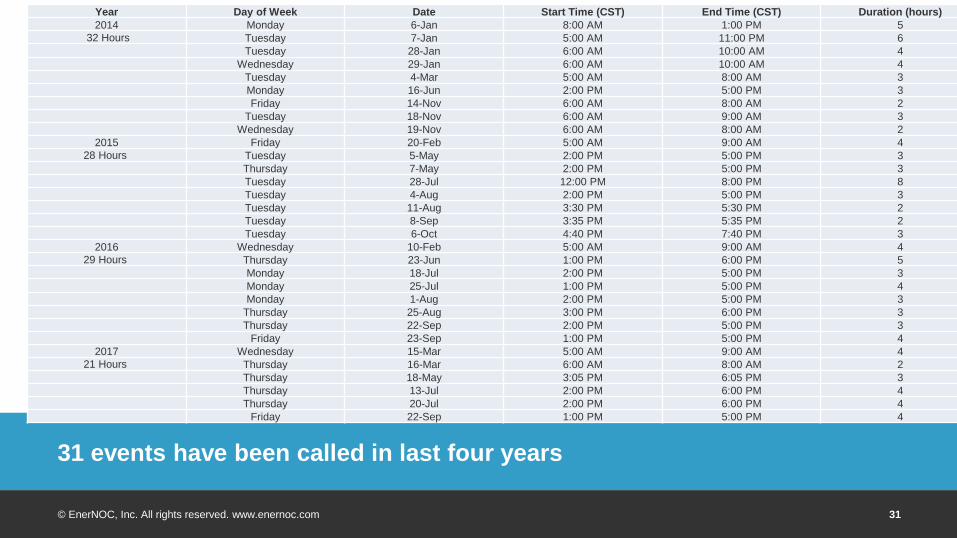
31 events have been called in last four years
Year Day of
Week Date Start Time (CST) End Time (CST) Duration (hours) 2014 Monday January 06 8:00 AM 1:00 PM 5
Tuesday January 07 5:00 AM 11:00 PM 6
Tuesday January 28 6:00 AM 10:00 AM 4
Wednesday January 29 6:00 AM 10:00 AM 4
Tuesday March 04 5:00 AM 8:00 AM 3
Monday June 16 2:00 PM 5:00 PM 3
Friday November 14 6:00 AM 8:00 AM 2
Tuesday November 18 6:00 AM 9:00 AM 3
Wednesday November 19 6:00 AM 8:00 AM 2
2015 Friday February 20 5:00 AM 9:00 AM 4
Tuesday May 05 2:00 PM 5:00 PM 3
Thursday May 07 2:00 PM 5:00 PM 3
Tuesday July 28 12:00 PM 8:00 PM 8
Tuesday August 04 2:00 PM 5:00 PM 3
Tuesday August 11 3:30 PM 5:30 PM 2
Tuesday September 08 3:35 PM 5:35 PM 2
Tuesday October 06 4:40 PM 7:40 PM 3
2016 Wednesday February 10 5:00 AM 9:00 AM 4
Thursday June 23 1:00 PM 6:00 PM 5
Monday July 18 2:00 PM 5:00 PM 3
Monday July 25 1:00 PM 5:00 PM 4
Monday August 01 2:00 PM 5:00 PM 3
Thursday August 25 3:00 PM 6:00 PM 3
Thursday September 22 2:00 PM 5:00 PM 3
Friday September 23 1:00 PM 5:00 PM 4
Year Day of Week Date Start Time (CST) End Time (CST) Duration (hours)
2014 Monday 6-Jan 8:00 AM 1:00 PM 5
32 Hours Tuesday 7-Jan 5:00 AM 11:00 PM 6
Tuesday 28-Jan 6:00 AM 10:00 AM 4
Wednesday 29-Jan 6:00 AM 10:00 AM 4
Tuesday 4-Mar 5:00 AM 8:00 AM 3
Monday 16-Jun 2:00 PM 5:00 PM 3
Friday 14-Nov 6:00 AM 8:00 AM 2
Tuesday 18-Nov 6:00 AM 9:00 AM 3
Wednesday 19-Nov 6:00 AM 8:00 AM 2
2015 Friday 20-Feb 5:00 AM 9:00 AM 4
28 Hours Tuesday 5-May 2:00 PM 5:00 PM 3
Thursday 7-May 2:00 PM 5:00 PM 3
Tuesday 28-Jul 12:00 PM 8:00 PM 8
Tuesday 4-Aug 2:00 PM 5:00 PM 3
Tuesday 11-Aug 3:30 PM 5:30 PM 2
Tuesday 8-Sep 3:35 PM 5:35 PM 2
Tuesday 6-Oct 4:40 PM 7:40 PM 3
2016 Wednesday 10-Feb 5:00 AM 9:00 AM 4
29 Hours Thursday 23-Jun 1:00 PM 6:00 PM 5
Monday 18-Jul 2:00 PM 5:00 PM 3
Monday 25-Jul 1:00 PM 5:00 PM 4
Monday 1-Aug 2:00 PM 5:00 PM 3
Thursday 25-Aug 3:00 PM 6:00 PM 3
Thursday 22-Sep 2:00 PM 5:00 PM 3
Friday 23-Sep 1:00 PM 5:00 PM 4
2017 Wednesday 15-Mar 5:00 AM 9:00 AM 4
21 Hours Thursday 16-Mar 6:00 AM 8:00 AM 2
Thursday 18-May 3:05 PM 6:05 PM 3
Thursday 13-Jul 2:00 PM 6:00 PM 4
Thursday 20-Jul 2:00 PM 6:00 PM 4
Friday 22-Sep 1:00 PM 5:00 PM 4

32 © EnerNOC, Inc. All rights reserved. www.enernoc.com
Opportunities to Optimize Earnings
33 © EnerNOC, Inc. All rights reserved. www.enernoc.com
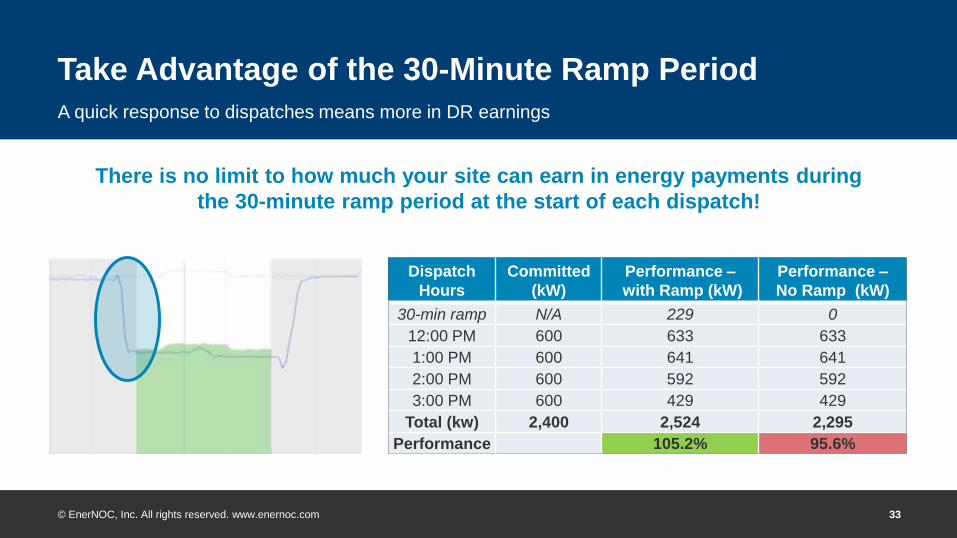
Take Advantage of the 30-Minute Ramp Period
A quick response to dispatches means more in DR earnings
There is no limit to how much your site can earn in energy payments during
the 30-minute ramp period at the start of each dispatch!
Dispatch
Hours
Committed
(kW)
Performance –
with Ramp (kW)
Performance –
No Ramp (kW)
30-min ramp N/A 229 0
12:00 PM 600 633 633
1:00 PM 600 641 641
2:00 PM 600 592 592
3:00 PM 600 429 429
Total (kw) 2,400 2,524 2,295
Performance 105.2% 95.6%


