Please refer to important disclosures at the end of this report 1 Quarterly highlights (Standalone) Y/E March (` cr) 2QFY13 2QFY12 % chg (yoy) 1QFY13 % chg (qoq) Net Sales 1,691 1,991 (15.1) 1,820 (7.1) EBITDA 101 139 (26.9) 108 (5.8) Adj. EBITDA margin (%) 6.0 7.0 (97)bp 5.9 8bp Adj. PAT 45 77 (41.5) 51 (11.6) Source: Company, Angel Research TVS Motor Company (TVSL) posted a 41.5% yoy (11.6% qoq) decline in net profit for 2QFY2013 which was in-line with our expectations given that volumes during the quarter registered a decline of 19.6% yoy (6.4% qoq). We broadly retain our estimates for the company. We expect the operating environment to remain challenging for TVSL due to rising competition in the sector amidst moderation in demand. We believe that the new launches, Phoenix, launched in September 2012 and two scooters and one motorcycle slated to be launched in FY2014 will be crucial for the company to regain volume momentum going ahead. Nonetheless, due to attractive valuations we maintain our Buy rating the stock. Weak performance for 2QFY2013: For 2QFY2013, TVSL’s top-line registered a decline of 15.1% yoy (7.1% qoq) to `1,691cr mainly due to a 19.6% yoy (6.4% qoq) decline in volumes. The weak volume performance can be attributed to general slowdown in the two-wheeler industry and increasing competitive intensity in the two-wheeler sector. At the operating level, the EBITDA margins came in-line with our estimates at 6%, witnessing a decline of 97bp yoy (flat qoq) primarily due to lower operating leverage benefits. While the raw-material cost as a percentage of sales declined 204bp yoy (110bp qoq); employee expenses as a percentage of sales witnessed a sharp increase of 170bp yoy (80bp qoq). As a result, the operating profit and net profit registered a decline of 26.9% (5.8% qoq) and 41.5% yoy (11.6% qoq) respectively. Outlook and valuation: We model in a volume growth of 1.8%/7.8% for FY2013E/14E to factor in the sharp slowdown in the domestic and export two-wheeler markets. We expect the operating margin to remain under pressure due to rising competition which will result in higher advertising spends. Nonetheless, at `39, TVSL is trading at an attractive valuation of 6.9x FY2014E EPS. Thus we maintain our Buy rating on the stock with a target price of `45. Key financials (Standalone) Y/E March (` cr) FY2011 FY2012 FY2013E FY2014E Net Sales 6,288 7,126 7,466 8,290 % chg 41.9 13.3 4.8 11.0 Net Profit 199 249 228 266 % chg 65.7 25.3 (8.5) 17.0 EBITDA (%) 6.2 6.6 6.2 6.3 EPS (`) 4.2 5.2 4.8 5.6 P/E (x) 9.2 7.4 8.1 6.9 P/BV (x) 1.8 1.6 1.4 1.2 RoE (%) 21.3 22.9 18.2 18.7 RoCE (%) 15.2 18.5 15.6 16.9 EV/Sales (x) 0.3 0.2 0.2 0.2 EV/EBITDA (x) 4.6 3.4 3.4 2.8 Source: Company, Angel Research BUY CMP `39 Target Price `45 Investment Period 12 Months Stock Info Sector Bloomberg Code Shareholding Pattern (%) Promoters MF / Banks / Indian Fls FII / NRIs / OCBs Indian Public / Others Abs. (%) 3m 1yr 3yr Sensex 7.6 6.2 16.8 TVS Motor 0.4 (41.4) 42.7 59.3 20.1 2.8 17.8 TVSL@IN 1,836 1.2 69/32 354,294 Nifty Reuters Code 1.0 18,562 5,645 TVSM.BO Avg. Daily Volume Market Cap (` cr) Beta 52 Week High / Low Net Debt (` cr) 638 Automobile Face Value (`) BSE Sensex Yaresh Kothari 022-3935 7800 Ext: 6844 [email protected]TVS Motor Company Performance Highlights 2QFY2013 Result Update | Automobile November 1, 2012
Transcript
Please refer to important disclosures at the end of this report 1
TVS Motor Company (TVSL) posted a 41.5% yoy (11.6% qoq) decline in net profit for 2QFY2013 which was in-line with our expectations given that volumes during the quarter registered a decline of 19.6% yoy (6.4% qoq). We broadly retain our estimates for the company. We expect the operating environment to remain challenging for TVSL due to rising competition in the sector amidst moderation in demand. We believe that the new launches, Phoenix, launched in September 2012 and two scooters and one motorcycle slated to be launched in FY2014 will be crucial for the company to regain volume momentum going ahead. Nonetheless, due to attractive valuations we maintain our Buy rating the stock.
Weak performance for 2QFY2013: For 2QFY2013, TVSL’s top-line registered a decline of 15.1% yoy (7.1% qoq) to `1,691cr mainly due to a 19.6% yoy (6.4% qoq) decline in volumes. The weak volume performance can be attributed to general slowdown in the two-wheeler industry and increasing competitive intensity in the two-wheeler sector. At the operating level, the EBITDA margins came in-line with our estimates at 6%, witnessing a decline of 97bp yoy (flat qoq) primarily due to lower operating leverage benefits. While the raw-material cost as a percentage of sales declined 204bp yoy (110bp qoq); employee expenses as a percentage of sales witnessed a sharp increase of 170bp yoy (80bp qoq). As a result, the operating profit and net profit registered a decline of 26.9% (5.8% qoq) and 41.5% yoy (11.6% qoq) respectively.
Outlook and valuation: We model in a volume growth of 1.8%/7.8% for FY2013E/14E to factor in the sharp slowdown in the domestic and export two-wheeler markets. We expect the operating margin to remain under pressure due to rising competition which will result in higher advertising spends. Nonetheless, at `39, TVSL is trading at an attractive valuation of 6.9x FY2014E EPS. Thus we maintain our Buy rating on the stock with a target price of `45.
Total three-wheelers 12,213 11,683 4.5 9,079 34.5 21,292 21,984 (3.1)
Source: Company, Angel Research
Top-line down 15.1% yoy: For 2QFY2013, TVSL’s top-line registered a decline of 15.1% yoy (7.1% qoq) to `1,691cr mainly due to 19.6% yoy (6.4% qoq) decline in volumes during the quarter. The weak volume performance can be attributed to a general slowdown in the two-wheeler industry and also increasing competition from Honda Motorcycle and Scooters India Ltd (HMSI). As a result, motorcycle and scooters volume registered a sharp decline of 28.4% (11.6% qoq) and 24.4% yoy (up 5.6% qoq) respectively. Three-wheeler sales on the other hand staged a recovery, posting a 4.5% yoy (34.5% qoq) growth driven by 24.4% yoy (38.9% qoq) growth in the domestic markets.
Exhibit 4: Total volumes decline 19.6% yoy
Source: Company, Angel Research
Exhibit 5: Strong growth in net average realization
Source: Company, Angel Research
524,954 524,171 519,514 535,008
604,226
527,700 528,099 519,132 485,999
33.4 39.9 24.0
15.3 15.1
0.7 1.7 (3.0) (19.6)
(30.0)
(20.0)
(10.0)
0.0
10.0
20.0
30.0
40.0
50.0
0
100,000
200,000
300,000
400,000
500,000
600,000
700,000
2QFY
11
3QFY
11
4QFY
11
1QFY
12
2QFY
12
3QFY
12
4QFY
12
1QFY
13
2QFY
13
(%)(units) Total volume yoy growth (RHS)
30,285 30,781 30,968
31,911 32,300
32,808
30,352
34,502 34,191
6.8 7.6
8.9 8.1
6.7 6.6
(2.0)
8.1 5.9
(4.0)
(2.0)
0.0
2.0
4.0
6.0
8.0
10.0
28,000
29,000
30,000
31,000
32,000
33,000
34,000
35,000
2QFY
11
3QFY
11
4QFY
11
1QFY
12
2QFY
12
3QFY
12
4QFY
12
1QFY
13
2QFY
13
(%)(`) Net average realization yoy growth (RHS)
TVS Motor Company | 2QFY2013 Result Update
November 1, 2012
4
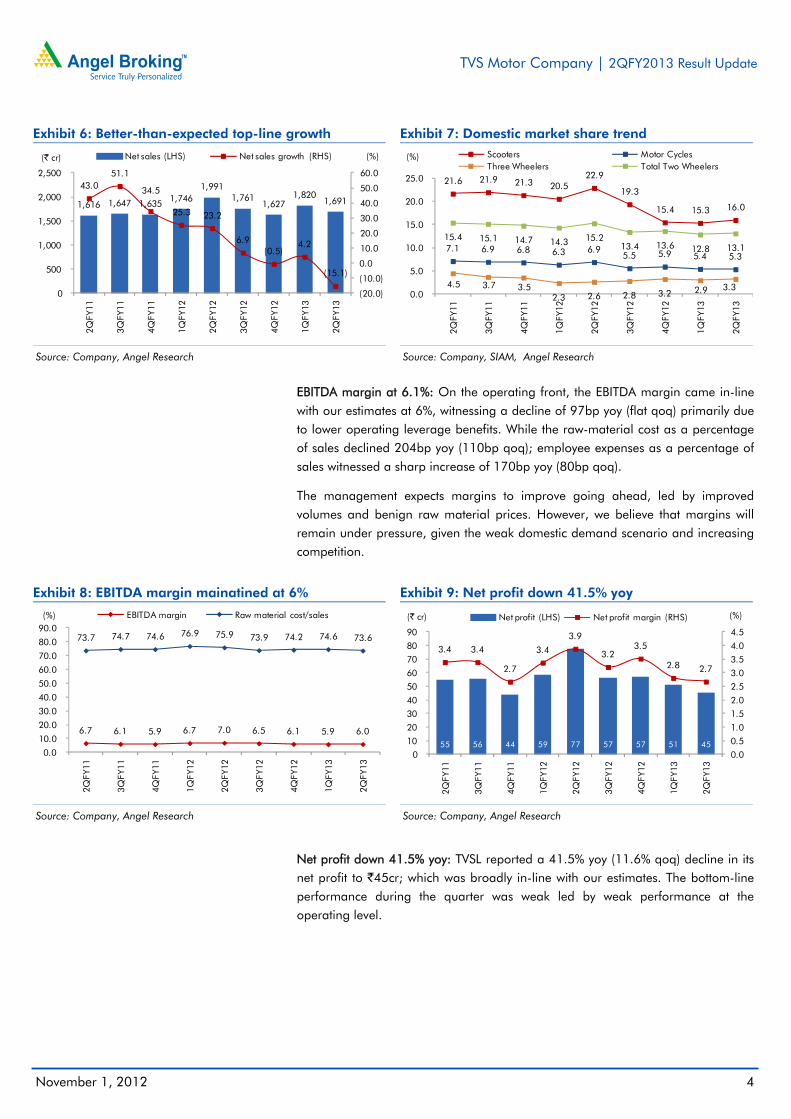
Exhibit 6: Better-than-expected top-line growth
Source: Company, Angel Research
Exhibit 7: Domestic market share trend
Source: Company, SIAM, Angel Research
EBITDA margin at 6.1%: On the operating front, the EBITDA margin came in-line with our estimates at 6%, witnessing a decline of 97bp yoy (flat qoq) primarily due to lower operating leverage benefits. While the raw-material cost as a percentage of sales declined 204bp yoy (110bp qoq); employee expenses as a percentage of sales witnessed a sharp increase of 170bp yoy (80bp qoq).
The management expects margins to improve going ahead, led by improved volumes and benign raw material prices. However, we believe that margins will remain under pressure, given the weak domestic demand scenario and increasing competition.
Exhibit 8: EBITDA margin mainatined at 6%
Source: Company, Angel Research
Exhibit 9: Net profit down 41.5% yoy
Source: Company, Angel Research
Net profit down 41.5% yoy: TVSL reported a 41.5% yoy (11.6% qoq) decline in its net profit to `45cr; which was broadly in-line with our estimates. The bottom-line performance during the quarter was weak led by weak performance at the operating level.
1,616 1,647 1,635 1,746 1,991
1,761 1,627
1,820 1,691
43.0 51.1
34.5
25.3 23.2
6.9 (0.5)
4.2
(15.1)
(20.0)
(10.0)
0.0
10.0
20.0
30.0
40.0
50.0
60.0
0
500
1,000
1,500
2,000
2,500
2QFY
11
3QFY
11
4QFY
11
1QFY
12
2QFY
12
3QFY
12
4QFY
12
1QFY
13
2QFY
13
(%)(` cr) Net sales (LHS) Net sales growth (RHS)
21.6 21.9 21.3 20.5 22.9
19.3
15.4 15.3 16.0
7.1 6.9 6.8 6.3 6.9 5.5 5.9 5.4 5.3
4.5 3.7 3.5 2.3 2.6 2.8 3.2 2.9 3.3
15.4 15.1 14.7 14.3 15.2 13.4 13.6 12.8 13.1
0.0
5.0
10.0
15.0
20.0
25.0
2QFY
11
3QFY
11
4QFY
11
1QFY
12
2QFY
12
3QFY
12
4QFY
12
1QFY
13
2QFY
13
(%) Scooters Motor CyclesThree Wheelers Total Two Wheelers
6.7 6.1 5.9 6.7 7.0 6.5 6.1 5.9 6.0
73.7 74.7 74.6 76.9 75.9 73.9 74.2 74.6 73.6
0.0
10.0
20.0
30.0
40.0
50.0
60.0
70.0
80.0
90.0
2QFY
11
3QFY
11
4QFY
11
1QFY
12
2QFY
12
3QFY
12
4QFY
12
1QFY
13
2QFY
13
(%) EBITDA margin Raw material cost/sales
55 56 44 59 77 57 57 51 45
3.4 3.4
2.7
3.4
3.9
3.2 3.5
2.8 2.7
0.0
0.5
1.0
1.5
2.0
2.5
3.0
3.5
4.0
4.5
0
10
20
30
40
50
60
70
80
90
2QFY
11
3QFY
11
4QFY
11
1QFY
12
2QFY
12
3QFY
12
4QFY
12
1QFY
13
2QFY
13
(%)(` cr) Net profit (LHS) Net profit margin (RHS)
TVS Motor Company | 2QFY2013 Result Update
November 1, 2012
5
Investment arguments
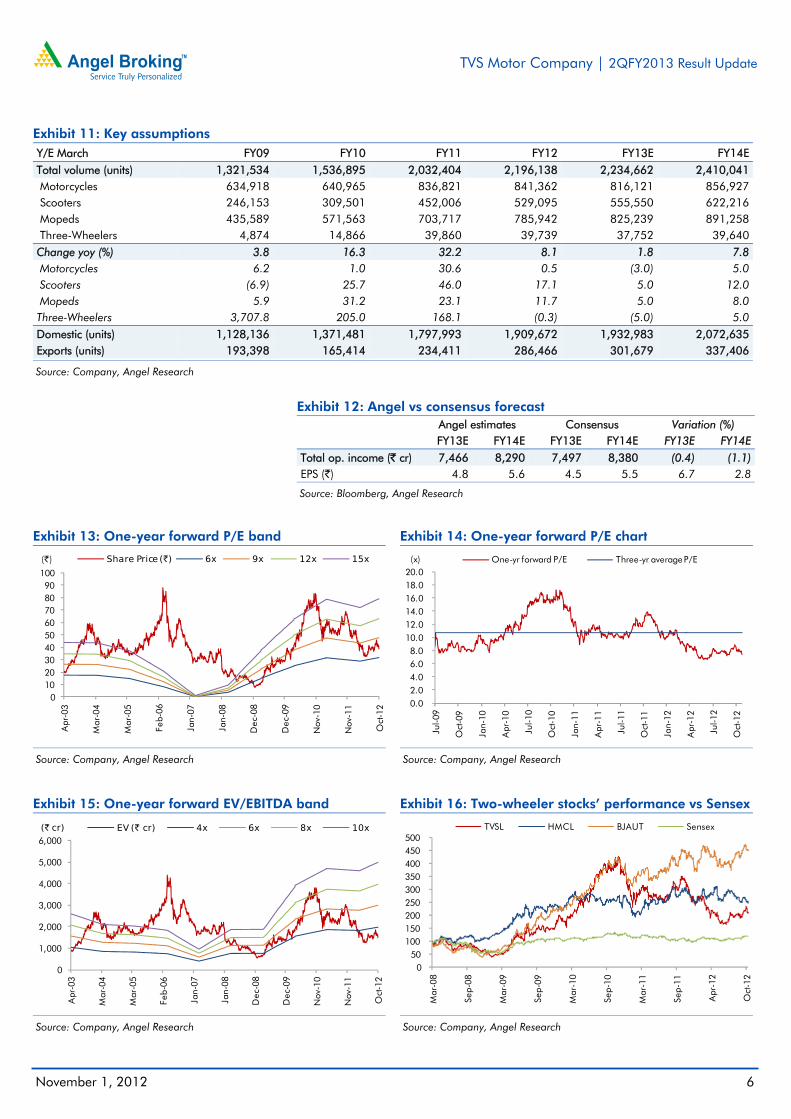
Success of new launches key to volume growth: TVSL posted a healthy 8.1% yoy growth in its volumes in FY2012 amidst slowdown in two-wheeler demand and rising competitive intensity in the sector. TVSL is in the process of launching three new models in FY2014 (executive segment bike, two scooters and a diesel three-wheeler), and we believe the success of these new launches is the key for the company to register volume growth going ahead. We expect the new launches to enable TVSL to ramp up its monthly run rate of two-wheelers and post annual volumes of 2.41mn units in FY2014E.
Adverse product mix to weaken margins: Declining contribution of
three-wheelers and scooters in the overall product mix coupled with rising
competition is likely to pressurize the company’s operating margin going
ahead. Nonetheless, weakening of commodity prices will provide some
comfort on the margin front. We expect the company’s margin to decline by
~40bp in FY2013.
Outlook and valuation
We model in a volume growth of 1.8%/7.8% for FY2013E/14E to factor in the sharp slowdown in the domestic and export two-wheeler markets. We expect operating margins to remain under pressure due to rising competition which will result in higher advertising spends. Nevertheless, we broadly retain our estimates for the company.
Exhibit 10: Change in estimates Y/E March Earlier Estimates Revised Estimates % chg
FY2013E FY2014E FY2013E FY2014E FY2013E FY2014E
Net Sales (` cr) 7,500 8,350 7,466 8,290 (0.5) (0.7)
OPM (%) 6.3 6.4 6.2 6.3 (10)bp (6)bp
EPS (`) 4.8 5.5 4.8 5.6 (0.4) 1.7
Source: Company, Angel Research
We expect the operating environment to remain challenging for TVSL due to rising competition in the sector amidst moderation in demand. We believe that the new launch, Phoenix, launched in September 2012 and two scooters and one motorcycle slated to be launched in FY2014 will be crucial for the company to regain volume momentum going ahead. At the current market price of `39, TVSL is trading at an attractive valuation of 6.9x FY2014E EPS. Thus we maintain our Buy rating on the stock with a target price of `45.
TVS Motor (TVSL), a flagship company of the TVS Group, is the third largest 2W manufacturer in India. The company is present across the motorcycles, scooters and mopeds segments, having a market share of ~8%, ~22% and 100%, respectively. The company successfully ventured into the 3W segment in FY2009 and garnered a ~5% market share as of March 31, 2012. The company has three manufacturing facilities in India, located at Hosur (Tamil Nadu), Mysore (Karnataka) and Solan (Himachal Pradesh) with 2W and 3W capacity of 2.75mn and 75,000 units, respectively. TVSL is also the second largest exporter of two-wheelers in the country.
TVS Motor Company | 2QFY2013 Result Update
November 1, 2012
8
Profit and loss statement (Standalone)
Y/E March (` cr) FY2009 FY2010 FY2011 FY2012 FY2013E FY2014E
Total operating income 3,739 4,430 6,288 7,126 7,466 8,290
% chg 14.2 18.5 41.9 13.3 4.8 11.0
Total expenditure 3,552 4,243 5,896 6,657 7,006 7,764
Net raw material costs 2,783 3,137 4,614 5,261 5,524 6,126
Research Team Tel: 022 - 39357800 E-mail: [email protected] Website: www.angelbroking.com DISCLAIMER This document is solely for the personal information of the recipient, and must not be singularly used as the basis of any investment decision. Nothing in this document should be construed as investment or financial advice. Each recipient of this document should make such investigations as they deem necessary to arrive at an independent evaluation of an investment in the securities of the companies referred to in this document (including the merits and risks involved), and should consult their own advisors to determine the merits and risks of such an investment.
Angel Broking Limited, its affiliates, directors, its proprietary trading and investment businesses may, from time to time, make investment decisions that are inconsistent with or contradictory to the recommendations expressed herein. The views contained in this document are those of the analyst, and the company may or may not subscribe to all the views expressed within.
Reports based on technical and derivative analysis center on studying charts of a stock's price movement, outstanding positions and trading volume, as opposed to focusing on a company's fundamentals and, as such, may not match with a report on a company's fundamentals.
The information in this document has been printed on the basis of publicly available information, internal data and other reliable sources believed to be true, but we do not represent that it is accurate or complete and it should not be relied on as such, as this document is for general guidance only. Angel Broking Limited or any of its affiliates/ group companies shall not be in any way responsible for any loss or damage that may arise to any person from any inadvertent error in the information contained in this report. Angel Broking Limited has not independently verified all the information contained within this document. Accordingly, we cannot testify, nor make any representation or warranty, express or implied, to the accuracy, contents or data contained within this document. While Angel Broking Limited endeavours to update on a reasonable basis the information discussed in this material, there may be regulatory, compliance, or other reasons that prevent us from doing so. This document is being supplied to you solely for your information, and its contents, information or data may not be reproduced, redistributed or passed on, directly or indirectly.
Angel Broking Limited and its affiliates may seek to provide or have engaged in providing corporate finance, investment banking or other advisory services in a merger or specific transaction to the companies referred to in this report, as on the date of this report or in the past.
Neither Angel Broking Limited, nor its directors, employees or affiliates shall be liable for any loss or damage that may arise from or in connection with the use of this information.
Note: Please refer to the important `Stock Holding Disclosure' report on the Angel website (Research Section). Also, please refer to the latest update on respective stocks for the disclosure status in respect of those stocks. Angel Broking Limited and its affiliates may have investment positions in the stocks recommended in this report.
Disclosure of Interest Statement TVS Motor Company
1. Analyst ownership of the stock No
2. Angel and its Group companies ownership of the stock No
3. Angel and its Group companies' Directors ownership of the stock No
4. Broking relationship with company covered No
Ratings (Returns): Buy (> 15%) Accumulate (5% to 15%) Neutral (-5 to 5%) Reduce (-5% to 15%) Sell (< -15%)
Note: We have not considered any Exposure below ` 1 lakh for Angel, its Group companies and Directors