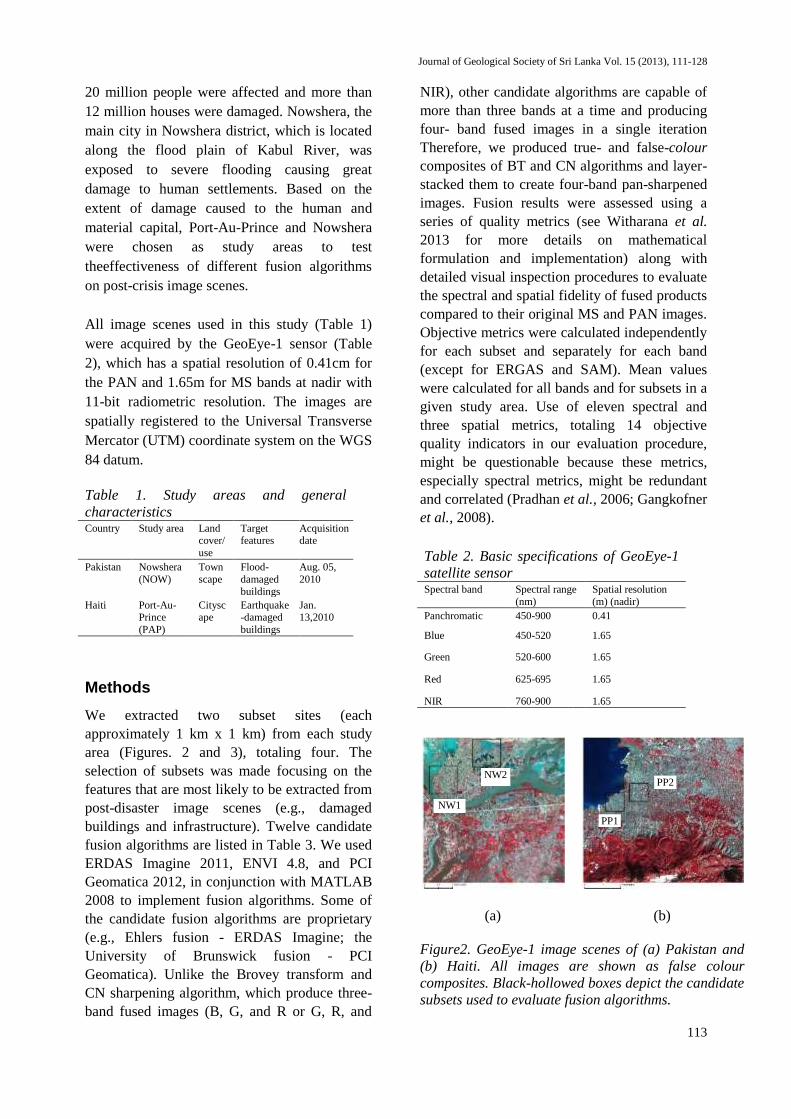
Journal of Geological Society of Sri Lanka Vol. 15 (2013), 111-128 111 TWELVE DATA FUSION ALGORITHMS FOR USE IN RAPID DAMAGE MAPPING WORKFLOWS: AN EVALUATION C. WITHARANA 1* and D.L. CIVCO 2 1 Center for Integrative Geosciences, University of Connecticut, Connecticut, USA 2 Department of Natural Resources and the Environment, University of Connecticut, Connecticut, USA *E-mail: [email protected]ABSTRACT Fused images form the basis for manual, semi-, and fully-automated classification steps in the disaster information retrieval chain. Many fusion algorithms have been developed and tested for different remote sensing applications; however, they are weakly assessed in the context of rapid mapping workflows. We examined how well different fusion algorithms would perform when applied to very high spatial resolution (VHSR) satellite images that encompass post-disaster scenes. The evaluation entailed twelve fusion algorithms: Brovey transform, colour normalization spectral sharpening (CN) algorithm, Ehlers fusion algorithm, Gram-Schmidt fusion algorithm, high-pass filter (HPF) fusion algorithm, local mean matching algorithm, local mean variance matching (LMVM) algorithm, modified intensity-hue-saturation (HIS) fusion algorithm, principal component analysis (PCA) fusion algorithm, subtractive resolution merge (SRM) fusion algorithm, University of New Brunswick (UNB) fusion algorithm, and the wavelet-PCA fusion algorithm. These algorithms were applied to GeoEye-1 satellite images taken over two geographical settings: the 2010 earthquake-damaged sites in Haiti and the 2010 flood-impacted sites in Pakistan. Fused images were assessed for spectral and spatial fidelity using sixteen quality indicators and visual inspection methods. Under each metric, fusion algorithms were ranked and best competitors were identified. Ehlers, WV-PCA, and HPF had the best scores for the majority of spectral quality indices. UNB and Gram-Schmidt algorithms had the best scores for spatial metrics. HPF emerged as the overall best performing fusion algorithm. Key Words:Remote Sensing, Geographical Information System, satellite images, Fusion INTRODUCTION Natural hazards occur and recur inflicting severe damages to human and material capital. Earth observation (EO) data play a pivotal role in the response phase of the disaster management cycle (Lang et al., 2010; Witharana, 2012; Witharana and Civco, 2012; Witharana et al., 2013). Modern satellite sensors (e.g., IKONOS, QuickBird, GeoEye-1, and WorldView-2) provide very high spatial resolution (VHSR) multi-spectral imagery at sub-metre level that can capture the fine details needed for disaster information, e.g. damaged city-block to individual house or an internally displaced persons (IDP) camp to an individual shelter (Lang et al., 2010; Vu et al., 2009). Due to shorter revisit times of these sensors, it is also possible to acquire near real-time imagery over impacted areas (Kim et al., 2011). VHSR satellite sensors typically record image data in a low resolution multispectral (MS) mode and high resolution panchromatic (PAN) mode. Disaster management remote sensing applications require high spatial and spectral resolution images. Fusing PAN and MS images with complementary characteristics can provide a better delineation of target objects (Wald, 2000; Ranchin et al., 2003). Pansharpening, also called resolution merge (Gangkofner et al., 2008) is a pixel-level fusion technique used to increase the spatial resolution of the multispectral image while preserving the
Transcript
Journal of Geological Society of Sri Lanka Vol. 15 (2013), 111-128
111
TWELVE DATA FUSION ALGORITHMS FOR USE IN RAPID DAMAGE MAPPING WORKFLOWS: AN EVALUATION
C. WITHARANA
1* and D.L. CIVCO
2
1 Center for Integrative Geosciences, University of Connecticut, Connecticut, USA
2Department of Natural Resources and the Environment, University of Connecticut, Connecticut, USA
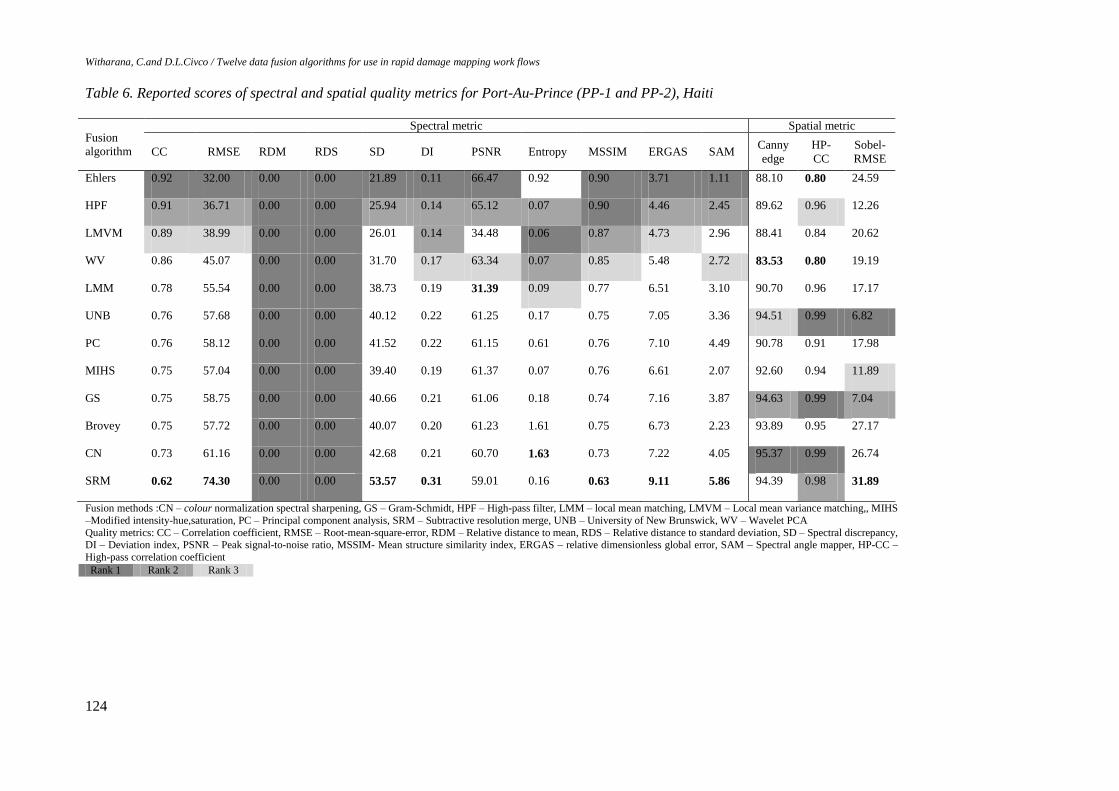
Fusion methods :CN – colour normalization spectral sharpening, GS – Gram-Schmidt, HPF – High-pass filter, LMM – local mean matching, LMVM – Local mean variance matching,, MIHS
–Modified intensity-hue,saturation, PC – Principal component analysis, SRM – Subtractive resolution merge, UNB – University of New Brunswick, WV – Wavelet PCA
Quality metrics: CC – Correlation coefficient, RMSE – Root-mean-square-error, RDM – Relative distance to mean, RDS – Relative distance to standard deviation, SD – Spectral discrepancy, DI – Deviation index, PSNR – Peak signal-to-noise ratio, MSSIM- Mean structure similarity index, ERGAS – relative dimensionless global error, SAM – Spectral angle mapper, HP-CC –
High-pass correlation coefficient
Rank 1 Rank 2 Rank 3
Journal of Geological Society of Sri Lanka Vol. 15 (2013), 111-128
125
Regarding the spatial improvement of fusion
results, the lowest scores for CEC and HP-CC
were reported by the Wavelet algorithm proving
its consistent failure. Similar to previous study
sites, the UNB algorithm exhibited promising
values for all the spatial indices. Interestingly,
Gram-Schmidt and MIHS also showed better
spatial improvement of their fusion results with
respect to all spatial indices. Despite CN
sharpening, Brovey, and SRM algorithms report
promising values for CEC and HP-CC, all three
algorithms exhibited poor RMSE values for
Sobel filtered images (>42).
Port-Au-Prince, Haiti
Table 6 summarizes the mean scores of the
objective quality indices reported for the two
subsets of Port-Au-Prince (PP-1, PP-2) in Haiti.
In terms of the preservation of spectral quality
relative to the original MS image, the Ehlers
fusion algorithm seemed to be the best candidate
whereas HPF and LMVM algorithms hold the
second and third ranks, respectively. The SRM
algorithm produced the worst values for the
majority of spectral metrics.
With respect to spatial improvement of fused
products, unexpectedly, the Ehlers algorithm
exhibited poor results, which recorded the
lowest value and the second-lowest value for
HP-CC and CEC, respectively. The wavelet
algorithm proved its continuous failure again by
yielding the worst scores for CEC and HP-CC.
Both UNB and Gram-Schmidt algorithms
exhibited promising values for all three spatial
indices. As seen in previous study sites, CN and
SRM algorithms showed high values for CEC
and HP-CC, however, failed to report
satisfactory values for Sobel-RMSE.
DISCUSSION
From the point of visual inspections, no single
algorithm was able to produce superior results
by simultaneously preserving spectral and
spatial properties of the original MS and PAN
images. Algorithms like HPF, Gram-Schmidt,
and UNB exhibited mediocre fusion results with
respect to colour similarity and spatial
improvement. Although the validity of visual
inspections has been challenged by many
investigators because of subjectivity and
interpreter dependency, visual inspections are
necessary but alone are not sufficient; our
contention is that they should always be
corroborated with objective quality indices.
Taking objective spectral quality evaluation
(Tables 6 and 7) into account it is important to
examine how spectrally-superior algorithms
(Ehlers fusion, HP filter, LMVM, and wavelet-
PCA algorithms) behave across eleven quality
metrics. With respect to two global indicators
(ERGAS and SAM) and other band-wise
metrics in our quality budget, the Ehlers fusion
and High-pass filter algorithms produced better-
quality results. Ehlers and his colleagues (Ehlers
and Klonus 2007; Ehlers et al. 2010; Ling et al.
2007) repeatedly claimed the spectral quality
preservation character of the Ehlers fusion
algorithm not only in single-sensor fusion but
also in multi-senor, and mutli-date
pansharpening applications. Our multi-
dimensional observations confirm the Ehlers
fusion’s ability to preserve spectral information
of the parent MS image during pansharpening.
However, it is interesting to examine the poor
performances of the Ehlers algorithm in the
town of Nowshera where it reported a low score
for the correlation coefficient. Similarly, the
high-pass filter method exhibited relatively
weak performances for the two test sites of the
civilian safety zone. We suspect that these
anomalies are associated with the heterogeneous
radiometric characteristic of bare soil (sandy
coast) and floodwater covering large portions of
the civilian safety zone and the town of
Nowshera, respectively. Overall, scores reported
for our spectral budget clearly demonstrated the
superiority of spatial-domain methods (i.e.,
Ehlers fusion and HPF algorithm) compared to
popular spectral substitution fusion techniques
such as Brovey transform, CN sharpening,
MIHS, and PC.
Regarding spatial quality assessment (Tables 6
and 7), despite the superior performances with
Witharana, C.and D.L.Civco / Twelve data fusion algorithms for use in rapid damage mapping work flows
126
respect to spectral similarity, Ehlers algorithm,
wavelet-PCA algorithm, LMVM algorithm, and
high-pass filter algorithm exhibited poor spatial
improvement. Among this subset, the wavelet-
PCA algorithm showed the worst scores
consistently for all spatial indices whereas the
HPF algorithm outperformed the Ehlers
algorithm and showed consistently better-quality
values for spatial indices. The CN sharpening
algorithm, Brovey transform algorithm, and
subtractive resolution merge algorithm achieved
notably better scores for spatial indices than for
spectral indices. These observations emphasize
the necessity of a combined approach (i.e.,
spectral and spatial fidelity) for benchmarking
fusion results because the best colour
preservation of an algorithm can be observed
even if no pan-sharpening is performed; on the
other hand, a fusion algorithm can achieve the
best spatial improvement while producing
results with worst colour preservation. The UNB
algorithm showed superior results consistently
for all spatial metrics across all study sites while
Gram-Schmidt produced mediocre spatial
improvement.
Like visual evaluation, objective assessment is
much-debated because there is neither a
universal index nor set of indices for quantifying
spectral and spatial fidelity fusion results. There
have been many metrics proposed and different
combinations of metrics have been used to
benchmark fusion algorithms. We intentionally
included eleven spectral and three spatial indices
to the objective-quality budget for examining
their strength, redundancy, and effect on ranking
of fusion techniques. Among spectral indices,
RDM and RDS demonstrated no discriminating
power among the fusion algorithms. However,
some workers (e.g., Kim et al., 2011; Vijayaraj
et al., 2006) used these metrics as strong
detectors for capturing spectral distortions.
Considerably high values can be reported for
RDM and RDS when the original MS image is
compared with the resampled fused image
instead of resampled and histogram-matched
fused image because some algorithms match
histograms of the original MS and the fused
image as the final step of the fusion workflow
(e.g., Ehlers fusion). But this step is not obvious
in most fusion techniques. We recommend
histogram matching after resampling of the
fused image as a standard practice in fusion
evaluation because it brings all fusion results to
a common datum. This is also valid for visual
inspections. Considering reported scores, in
general, CC, RMSE, SD, DI, and MSSIM were
consistently behaved. The peak signal-to-noise
ratio seemed to be a valuable discriminator
because of its broad range of values along with
its unique capability on capturing radiometric
distortions. For example, the LMVM algorithm
seemed to be one of the best candidates in terms
of metrics like CC, RMSE, SD, DI, and MSSIM
but the PSNR was able to detect LMVM
algorithm’s weak radiometric performance.
Similarly, SAM disqualified wavelet-PCA and
LMVM algorithms, despite their good scores,
reported for common metrics like such as CC,
RMSE, and DI. As a global indicator, ERGAS is
supposed to give an overall picture on the
quality of pansharpening. Our understanding is
that, even though fundamental statistical
measurements like CC and RMSE might be
valid detectors of fusion artifacts, it is necessary
to combine these spectral distortion parameters
with radiometric distortion detectors like PSNR
and SAM to achieve a comprehensive measure
of fusion quality. Entropy (or entropy
difference) produced inconsistent results
compared to other quality indicators so we
question its general dependability. For example,
the LMVM fusion algorithm outperforms Ehlers
fusion if the entropy difference is considered.
Therefore, we suggest that entropy should be
accompanied with several other quality
measures.
CONCLUSIONS
Disaster management is a time-critical process.
Prior identification of best tools for extracting
damage information from VHSR images is
decisive. Unlike other remote sensing
applications, in humanitarian emergencies,earth-
observation data ought to be processed within a
Journal of Geological Society of Sri Lanka Vol. 15 (2013), 111-128
127
short time frame. We applied twelve fusion
algorithms to very-high spatial resolution
GeoEye-1 images taken over two countries
representing post-disaster scenarios.
Benchmarking of fusion algorithms was
conducted visually and quantitatively, the latter
based on eleven spectral and three spatial
indices. With respect to subjective and objective
assessments, there is no fusion method that
exhibited superior performances simultaneously
for colour preservation and spatial
improvement. We recommend the University of
New Brunswick algorithm if manual
photointerpretation is involved whereas the
high-pass filter fusion is recommended if semi-
or fully-automated feature extraction is involved
for pan-sharpening on-going and post crisis
GeoEye-1 images. We emphasize the need of a
standard workflow and a set of objective metrics
for fusion evaluation. We propose deviation
index, mean structure similarity index, peak-
signal-to-noise-ratio, and spectral angle mapper
as the main spectral quality discriminators. In
our future research we expect to benchmark
fusion algorithms when applied to multi-sensor
and multi-date images covering on-going and
post-crisis scenes, further investigate the
stability of quality metrics.
ACKNOWLEDGEMENTS
Support for the VHSR image data was provided
by the ASPRS (American Society of
Photogrammetry and Remote Sensing) GeoEye
Award.
REFERENCES
Civco, D.L. and Witharana, C. (2012). Assessing the
spatial fidelity of resolution-enhanced imagery
using Fourier analysis: a proof-of-concept study,
Proceed. SPIE Remote Sensing Europe,
Edinburgh, United Kingdom.
Ehlers, M., Klonus, S., Johan Ãstrand, P.R. and
Rosso, P.(2010). Multi-sensor image fusion for
pansharpening in remote sensing. International
Journal of Image and Data Fusion, Vol.1(1), p.
25-45.
Gangkofner, U.G., Pradhan, P. S. and Holcomb, D.
W.(2008). Optimizing the High-Pass Filter
Addition Technique for Image
Fusion,Photogrammetric Engineering & Remote
Sensing, Vol. 74(9), p. 1107-1118.
Guo, Q., Chen, S., Leung, H. and Liu, S.(2010).
Covariance intersection based image fusion
technique with application to pansharpening in
remote sensing. Information Sciences,
Vol.180(18), p. 3434-3443.
Kim, M., Holt, J.B. and Madden, M., (2011).
Comparison of Global- and Local-scale
Pansharpening for Rapid Assessment of
Humanitarian Emergencies,Photogrammetric
Engineering & Remote Sensing, Vol. 77(1), p.
51-63.
Klonus, S. and Ehlers, M.(2007). Image Fusion
Using the Ehlers Spectral Characteristics
Preservation Algorithm,GIScience & Remote
Sensing, Vol. 44(2), p. 93-116.
Lang, S., Tiede, D., Holbling, D., Fureder, P. and
Zeil, P.(2010). Earth observation (EO)-based ex
post assessment of internally displaced person
(IDP) camp evolution and population dynamics
in Zam Zam, Darfur,International Journal of
Remote Sensing, Vol. 31(21),p. 5709-5731.
Nikolakopoulos, K.G. (2008). Comparison of nine
fusion techniques for very high resolution data.
Comparison of nine fusion techniques for very
high resolution data, Photogrammetric
Engineering & Remote Sensing,Vol. 74(5), p.
647-660.
Pradhan, P.S., King, R.L., Younan, N.H. and
Holcomb, D.W. (2006). Estimation of the
Number of Decomposition Levels for a Wavelet-
Based Multiresolution Multisensor Image
Fusion, IEEE Transactions on Geoscience and
Remote Sensing, Vol. 44(12), p. 3674-3686.
Ranchin, T., Aiazzi, B., Alparone, L., Baronti, S. and
Wald, L.(2003). Image fusion--the ARSIS
concept and some successful implementation
schemes,ISPRS Journal of Photogrammetry and
Remote Sensing, Vol. 58(1-2), p. 4-18.
Vijayaraj, V., Nicolas, H.Y. and Charles, G.O.H.,
(2006). Quantitative analysis of pansharpened
images,Optical Engineering, Vol. 45(4), 046202.
Vrabel, J.(1996). Multispectral Imagery Band
Sharpening Study,Photogrammetric Engineering
& Remote Sensing, Vol. 62(9),p.1075-1083.
Vu, T.T., Yamazaki, F. and Matsuoka, M.(2009).
Multi-scale solution for building extraction from
LiDAR and image data. International Journal of
Applied Earth Observation and Geoinformation,
Vol.11(4): p. 281-289.
Wald, L. and Ranchin, T.(1997). Fusion of satellite
images of different spatial resolutions: Assessing
the quality of resulting images,Photogrammetric
Engineering & Remote Sensing, Vol. 63(6), p.
691-699.
Witharana, C.(2012). Who Does What Where?
Advanced Earth Observation for Humanitarian
Crisis Management, Proceed. of the
6th
International Conference on Information and
Automation. Beijing, China.
Witharana, C.and D.L.Civco / Twelve data fusion algorithms for use in rapid damage mapping work flows


![Methods and algorithms for image fusion and super resolutionpublications.lib.chalmers.se/records/fulltext/92143.pdf · image fusion articles written by Petrovic [2] and Piella [3].](https://static.documents.pub/doc/80x56/5e8bd65ab26004424b34fc3b/methods-and-algorithms-for-image-fusion-and-super-re-image-fusion-articles-written.jpg)


