Twentieth century trends Twentieth century trends in dew point temperature in dew point temperature throughout the Upper throughout the Upper Midwest Midwest Jesse Jesse Wartman Wartman ntors: Daryl Herzmann and Dr. Eugene Ta ntors: Daryl Herzmann and Dr. Eugene Ta
Transcript
Twentieth century trends in dew Twentieth century trends in dew point temperature throughout the point temperature throughout the
Upper MidwestUpper Midwest
Jesse WartmanJesse Wartman
Mentors: Daryl Herzmann and Dr. Eugene TakleMentors: Daryl Herzmann and Dr. Eugene Takle
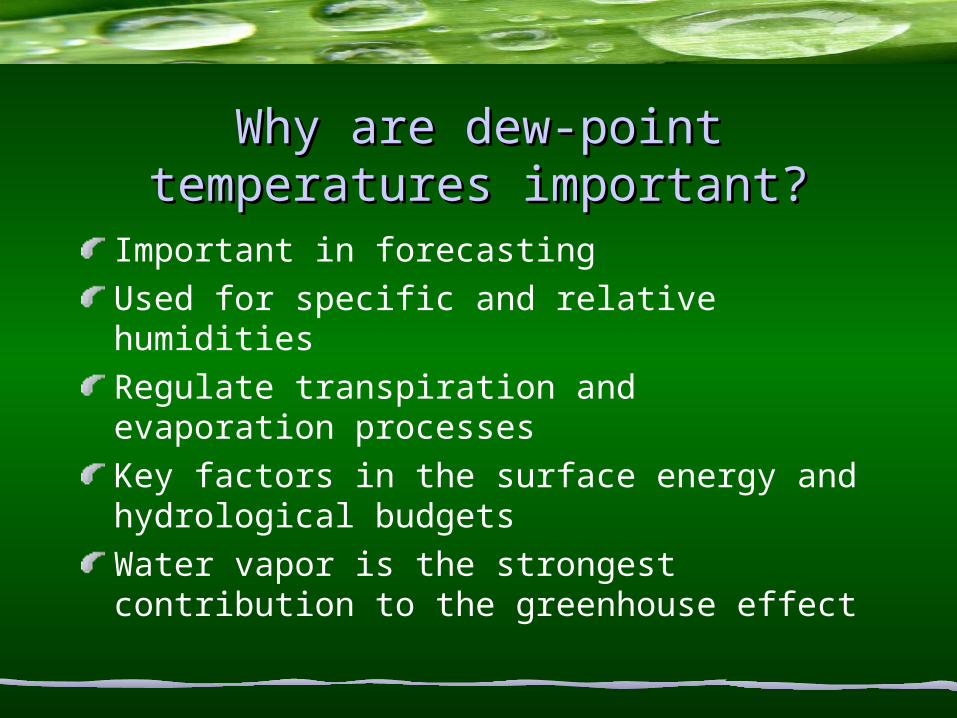
Why are dew-point Why are dew-point temperatures important?temperatures important?
Important in forecastingUsed for specific and relative humiditiesRegulate transpiration and evaporation processesKey factors in the surface energy and hydrological budgetsWater vapor is the strongest contribution to the greenhouse effect
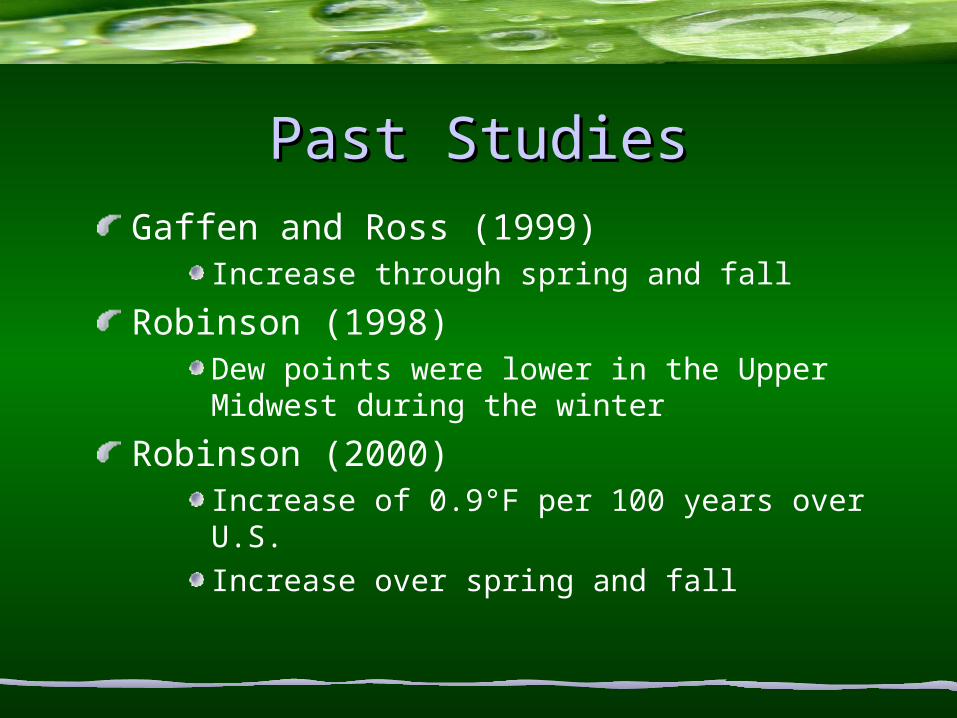
Past StudiesPast StudiesGaffen and Ross (1999)
Increase through spring and fall
Robinson (1998)Dew points were lower in the Upper Midwest during the winter
Robinson (2000)Increase of 0.9°F per 100 years over U.S.Increase over spring and fall
Possible ErrorsPossible ErrorsNon-uniform stations
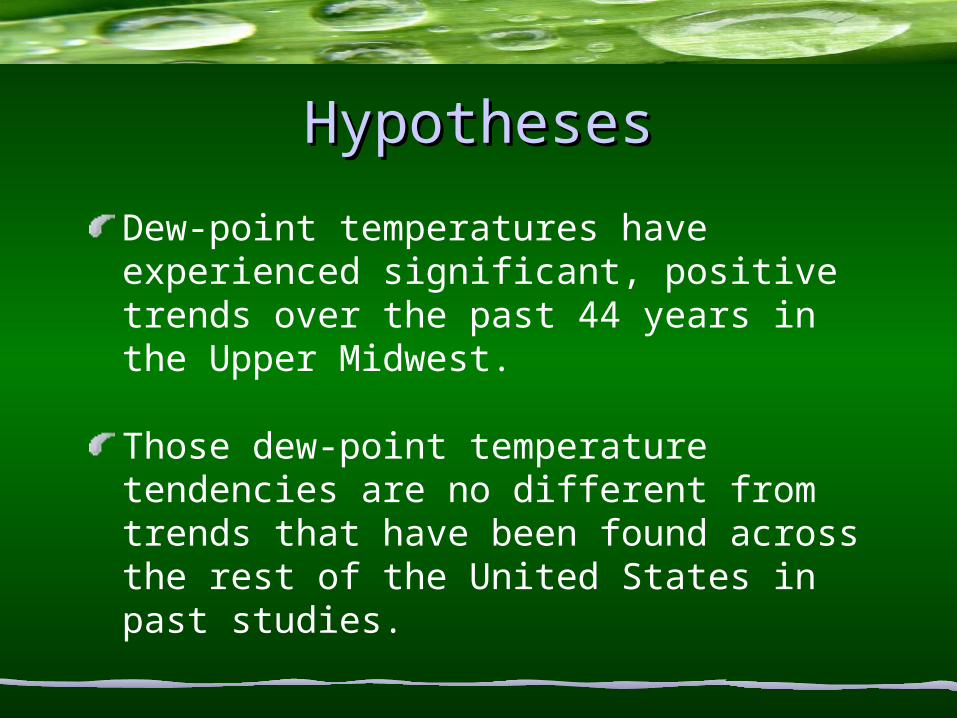
Dew-point temperatures have experienced significant, positive trends over the past 44 years in the Upper Midwest.
Those dew-point temperature tendencies are no different from trends that have been found across the rest of the United States in past studies.
Data and MethodsData and MethodsHourly obs through IEM from the NCDC1961-2005MonthlySeasonal
Winter - December, January, & FebruarySpring - March, April & MaySummer - June, July & AugustFall - September, October, & November
YearlyDecadal
Observation StationsObservation StationsLegend of Cities
St. Louis
Kansas City
Omaha
Des Moines
Sioux Falls
Minneapolis
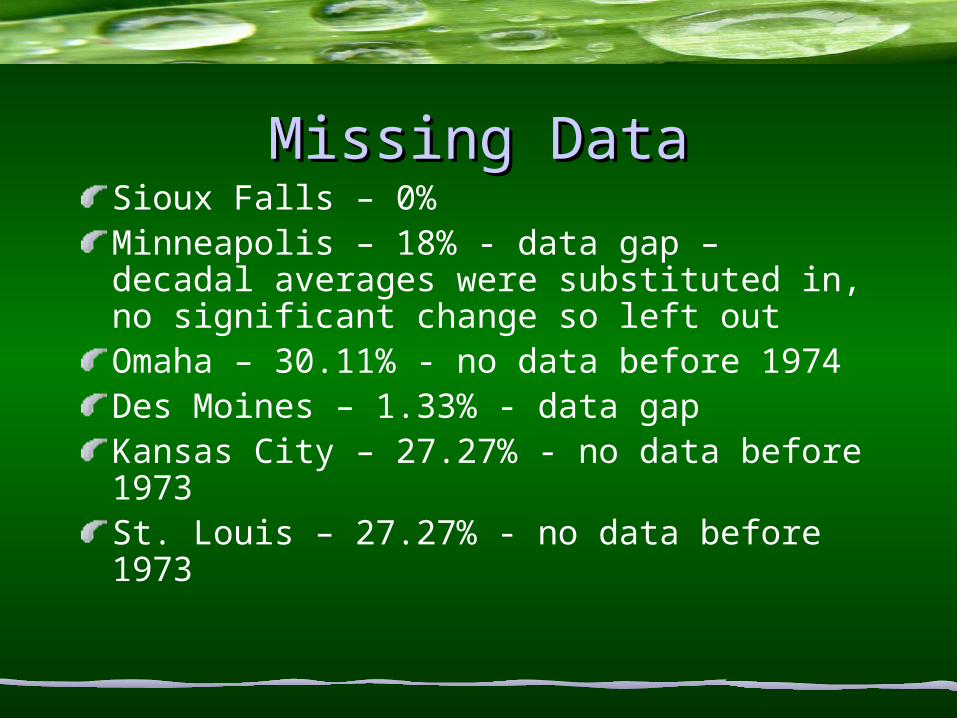
Missing DataMissing DataSioux Falls – 0%Minneapolis – 18% - data gap – decadal averages were substituted in, no significant change so left outOmaha – 30.11% - no data before 1974Des Moines – 1.33% - data gapKansas City – 27.27% - no data before 1973St. Louis – 27.27% - no data before 1973
SignificanceSignificance
Significant if P-value < 0.05Semi-significant if P-value < 0.1
P-Value – calculated in JMP, observed significance probability from t-ratios
T-ratio – tests hypothesis that each parameter is zero, ratio of the parameter estimate to its standard error
RESULTSRESULTS
Monthly Climatic TrendsSeasonal climatic trends
Yearly average climatic trendsDecadal climatic trendsTwenty-two year climatic
MPLS January Februrary March April May June July August September October Novemeber DecemberSlope 0.083 0.1489 0.0353 0.0439 0.00875 0.02995 0.0415 0.0595 0.051 -0.0156 0.011 0.201P-Value 0.0068 0.0932 0.5524 0.275 0.8698 0.401 0.173 0.0793 0.2325 0.764 0.853 0.0196
STL January Februrary March April May June July August September October Novemeber DecemberSlope 0.185 0.0865 -0.112 0.059 0.041 0.0227 0.0135 0.033 -0.035 0.037 -0.031 0.0084P-Value 0.0358 0.3335 0.1101 0.3046 0.601 0.6276 0.7246 0.462 0.4968 0.5824 0.6948 0.9309
DSM January Februrary March April May June July August September October Novemeber DecemberSlope 0.2199 0.139 0.07 0.053 0.048 0.035 0.07 0.09 0.0139 0.024 0.021 0.094
FSD January Februrary March April May June July August September October Novemeber DecemberSlope 0.27 0.155 0.0527 0.055 0.061 0.0369 0.086 0.127 0.075 0.0037 0.0265 0.141P-Value 0.0008 0.0272 0.23 0.0891 0.1862 0.306 0.0032 0.0001 0.024 0.9355 0.5542 0.0323
OMA January Februrary March April May June July August September October Novemeber DecemberSlope 0.2597 0.1477 0.0386 0.00191 0.03987 0.0729 0.0858 0.0867 0.0246 0.09 0.0714 0.1234P-Value 0.0155 0.1933 0.609 0.9798 0.603 0.152 0.0503 0.0534 0.666 0.1723 0.404 0.2682
MCI January Februrary March April May June July August September October Novemeber DecemberSlope 0.313 0.178 -0.0215 0.0887 0.0924 0.0828 0.12 0.109 0.0417 0.092 0.092 0.13917P-Value 0.0012 0.076 0.758 0.189 0.2 0.0726 0.0192 0.0087 0.4623 0.189 0.272 0.179
Seasonal Climatic TrendsSeasonal Climatic TrendsWinter Means
0
5
10
15
20
25
30
35
1961
1963
1965
1967
1969
1971
1973
1975
1977
1979
1981
1983
1985
1987
1989
1991
1993
1995
1997
1999
2001
2003
2005
Year
Td
(°F)
Seasonal Climatic TrendsSeasonal Climatic TrendsSpring Means
25
30
35
40
45
50
1961
1963
1965
1967
1969
1971
1973
1975
1977
1979
1981
1983
1985
1987
1989
1991
1993
1995
1997
1999
2001
2003
2005
Year
Td
(°F)
Seasonal Climatic TrendsSeasonal Climatic TrendsSummer Means
50
52
54
56
58
60
62
64
66
68
70
1961
1963
1965
1967
1969
1971
1973
1975
1977
1979
1981
1983
1985
1987
1989
1991
1993
1995
1997
1999
2001
2003
2005
Year
Td
(°F)
Seasonal Climatic TrendsSeasonal Climatic TrendsFall Means
25
30
35
40
45
50
55
1961
1963
1965
1967
1969
1971
1973
1975
1977
1979
1981
1983
1985
1987
1989
1991
1993
1995
1997
1999
2001
2003
2005
Year
Td
(°F)
Yearly Average Climatic TrendsYearly Average Climatic Trends
Concluding RemarksConcluding RemarksShift from negative trend to positive trendPositive overall trendHypotheses
Dew-point temperatures have experienced significant, positive trends over the past 44 years in the Upper Midwest. -> TRUEThose dew-point temperature tendencies are no different from trends that have been found across the rest of the United States in past studies. -> FALSE
7.54°F over 100 years in Upper Midwest0.9°F over 100 years in United States
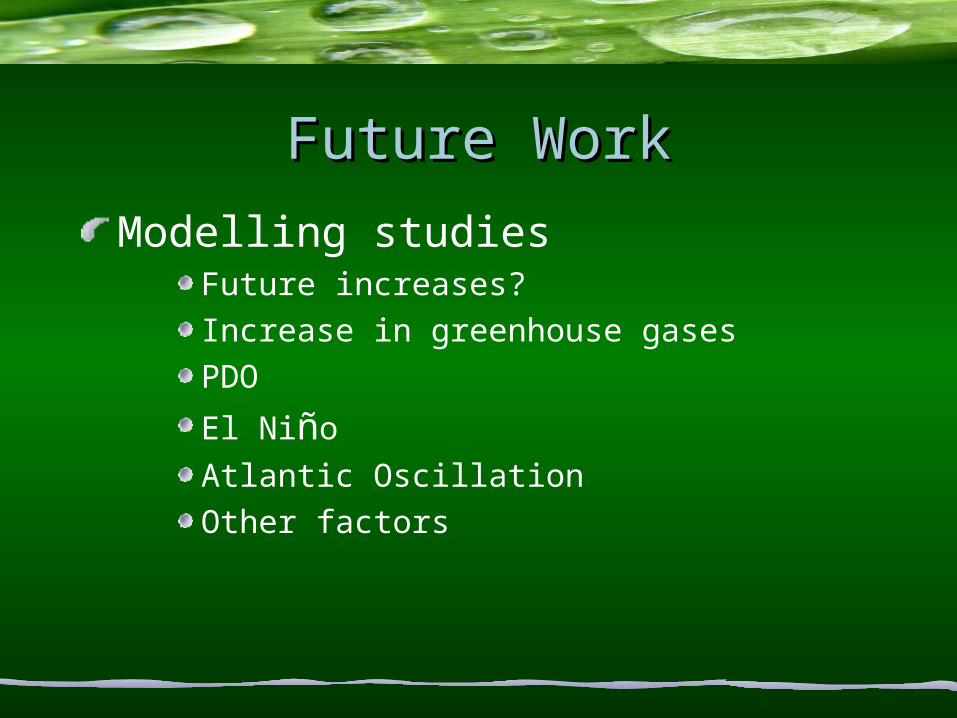
Future WorkFuture Work
Modelling studiesFuture increases?Increase in greenhouse gasesPDO