Twenty-five species of frogs in a liter 1 of water: eDNA survey for exploring 2 tropical frog diversity 3 4 Miklós Bálint 1,2 , Carsten Nowak 1,2 , Orsolya Márton 1,3 , Steffen U. Pauls 1,2 , Claudia 5 Wittwer 1 , Jose Luis Aramayo B. 4 , Arne Schulze 5 , Thierry Chambert 6 , Berardino Cocchiararo 1 , 6 Martin Jansen 1 7 8 1 Senckenberg Research Institute and Natural History Museum Frankfurt, 9 Senckenberganlage 25, 60325 Frankfurt, Germany 10 2 LOEWE Centre for Translational Biodiversity Genomics (LOEWE-TBG), 11 Senckenberganlage 25, 60325 Frankfurt, Germany 12 3 Institute for Soil Sciences and Agricultural Chemistry, Centre for Agricultural Research, 13 Hungarian Academy of Sciences, Herman Otto str. 15, H-1022 Budapest, Hungary 14 4 Museo Historia Natural Noel Kempff Mercado (Universidad Autónoma Gabriel Rene 15 Moreno), Av. Irala 565, Santa Cruz de la Sierra, Bolivia 16 5 Hessisches Landesmuseum Darmstadt (HLMD), Friedensplatz 1, 64283 Darmstadt, 17 Germany 18 6 Pennsylvania State University, Department of Ecosystem Science and Management, 19 University Park, PA 16802, USA 20 . CC-BY-ND 4.0 International license peer-reviewed) is the author/funder. It is made available under a The copyright holder for this preprint (which was not . http://dx.doi.org/10.1101/176065 doi: bioRxiv preprint first posted online Aug. 15, 2017;
Transcript
Twenty-five species of frogs in a liter 1
of water: eDNA survey for exploring 2
tropical frog diversity 3
4
Miklós Bálint1,2, Carsten Nowak1,2, Orsolya Márton1,3, Steffen U. Pauls1,2, Claudia 5
Wittwer1, Jose Luis Aramayo B.4, Arne Schulze5, Thierry Chambert6, Berardino Cocchiararo1, 6
Martin Jansen1 7
8
1Senckenberg Research Institute and Natural History Museum Frankfurt, 9
Senckenberganlage 25, 60325 Frankfurt, Germany 10
2LOEWE Centre for Translational Biodiversity Genomics (LOEWE-TBG), 11
Senckenberganlage 25, 60325 Frankfurt, Germany 12
3Institute for Soil Sciences and Agricultural Chemistry, Centre for Agricultural Research, 13
Hungarian Academy of Sciences, Herman Otto str. 15, H-1022 Budapest, Hungary 14
4Museo Historia Natural Noel Kempff Mercado (Universidad Autónoma Gabriel Rene 15
Moreno), Av. Irala 565, Santa Cruz de la Sierra, Bolivia 16
6Pennsylvania State University, Department of Ecosystem Science and Management, 19
University Park, PA 16802, USA 20
.CC-BY-ND 4.0 International licensepeer-reviewed) is the author/funder. It is made available under aThe copyright holder for this preprint (which was not. http://dx.doi.org/10.1101/176065doi: bioRxiv preprint first posted online Aug. 15, 2017;
Biodiversity is declining at unprecedented rates, with species extinctions being an 22
important component of this process. Currently it is almost impossible to evaluate this loss since 23
biodiversity data is lacking even for emblematic species. Recent advances in eDNA marker 24
gene studies promise to deliver the necessary data, but these approaches have almost never 25
been evaluated in the tropics. Here we evaluate whether 1) eDNA metabarcoding may reliably 26
generate frog faunistic data in species-rich tropical areas, 2) the ecological signal in eDNA data 27
is compatible with data from visual and audio encounter survey (VAES), and 3) eDNA data 28
represent a financially viable solution to biodiversity data acquisition. We applied eDNA 29
metabarcoding to investigate frog species occurrence in five ponds in the Chiquitano dry forest 30
region in Bolivia and compared our data with a simultaneous VAES. We find that taxon lists 31
generated with eDNA and VAES correspond closely, and most deviations are attributable to 32
different species’ life histories. The ecological signal in eDNA closely matches the signal from 33
VAES. We find that the cost efficiency of eDNA surveys is mostly influenced by the richness of 34
local fauna and the number of surveyed sites: VAES may be less costly in low-diversity regions, 35
but eDNA quickly becomes more cost-efficient in high-diversity regions, particularly with many 36
sites. The results underline that eDNA is suitable for large-scale biodiversity surveys in high-37
diversity areas if precautions in data generation and interpretation are taken and this projects 38
spatially extensive standardized biodiversity surveys in the close future. 39
Keywords 40
Amphibians, metabarcoding, tropical biodiversity, conservation, community ecology, cost 41
comparison 42
.CC-BY-ND 4.0 International licensepeer-reviewed) is the author/funder. It is made available under aThe copyright holder for this preprint (which was not. http://dx.doi.org/10.1101/176065doi: bioRxiv preprint first posted online Aug. 15, 2017;
Improvements on most biodiversity loss indicators lag behind the 20 “Aichi Biodiversity 44
Targets” (UNEP 2016) that aim to reduce the decline of biodiversity by 2020 (Tittensor et al. 45
2014). An important component of the biodiversity crisis is the extinction of species: based on 46
current trends in mammals, birds, reptiles and amphibians, it has been projected that the 47
biodiversity crisis may lead to the 6th Mass Extinction over the next three centuries if all 48
threatened species go extinct (Barnosky et al. 2011). Current rates of extinction may even be 49
much higher if one considers the extinction that likely occurred during the last decades-50
centuries, but went unnoticed because the now-extinct species had small ranges, were never 51
described or only described on the eve of their extinct (Pimm et al. 2014; Lees & Pimm 2015). It 52
is however difficult to assess which species are endangered and to what extent. First, most taxa 53
remain undescribed: in some highly diverse regions many species will likely go extinct before 54
they are discovered (Costello et al. 2013; Lees & Pimm 2015). Second, cryptic genetic diversity 55
is common within morphospecies (Pfenninger & Schwenk 2007; Pauls et al. 2013), and global 56
change may impact cryptic diversity more severely than morphospecies (Bálint et al. 2011). 57
Third, data on population-level trends is scarce, even for well-known species (Butchart et al. 58
2010). Better population-level biodiversity data is thus urgently needed to 1) understand 59
biodiversity patterns and extinction threats, 2) improve forecasting abilities about future 60
biodiversity, and 3) improve humanity’s responses to the challenges of biodiversity loss. This 61
data is crucial in times when conservation action is increasingly demanded by society (Tittensor 62
et al. 2014). 63
The importance of internationally coordinated, standardized biodiversity data collection is 64
long recognized both in science and in conservation (Henry et al. 2008). This is particularly true 65
for the most biodiverse areas. The tropics are generally underrepresented in ecological studies 66
(Clarke et al. 2017; Stroud & Feeley 2017). However, encounter-based data collection appears 67
.CC-BY-ND 4.0 International licensepeer-reviewed) is the author/funder. It is made available under aThe copyright holder for this preprint (which was not. http://dx.doi.org/10.1101/176065doi: bioRxiv preprint first posted online Aug. 15, 2017;
2014). eDNA-based metabarcoding may present one of several tools needed to globally 74
coordinate initiatives for ecosystem monitoring and sustainable management (Bush et al. 2017; 75
Schmeller et al. 2017). 76
In this study we evaluate whether eDNA metabarcoding is suitable for inventories of 77
frogs, a group with particular high species-diversity in tropical regions. Frogs and other 78
amphibians are particularly hard hit by the biodiversity crisis: more than one-third of the 79
approximately 7500 described species are endangered (Stuart et al. 2004; Bishop et al. 2012; 80
Whittaker et al. 2013). Frogs are also known for being a highly diverse, but incompletely 81
described taxon, especially in the tropics (Ferrão et al. 2016; Caminer et al. 2017). Many 82
“widespread” morphospecies harbor considerable cryptic genetic diversity and are better 83
considered complexes of closely related species with much smaller ranges (Fouquet et al. 2007; 84
Gehara et al. 2013, 2014; Ortega-Andrade et al. 2015). Efficient actions for amphibian 85
conservation (e.g. the prioritization of areas for conservation, or informing society and 86
stakeholders about conservation needs) are only possible with geographically fine-scale, 87
taxonomically well-resolved faunistic data, but our current understanding of present and future 88
amphibian biodiversity is often based on rare, spatially and temporally scattered observations of 89
phenotypically defined taxa. 90
First efforts have been done to test the suitability of eDNA for the survey of tropical frog 91
biodiversity (Lopes et al. 2016), but important practical aspects remain unaddressed. First, it is 92
.CC-BY-ND 4.0 International licensepeer-reviewed) is the author/funder. It is made available under aThe copyright holder for this preprint (which was not. http://dx.doi.org/10.1101/176065doi: bioRxiv preprint first posted online Aug. 15, 2017;
not clear which fraction of the local species pool is represented by amphibian eDNA in tropical 93
water bodies: existing comparisons of encounter-based surveys and eDNA either do not include 94
non-adult life stages, or they use already compiled fauna lists for the evaluation of eDNA 95
performance without consideration of life history traits or behavioral aspects at the moment of 96
sampling. This may confound biodiversity data collection (Petitot et al. 2014). Second, 97
ecological signal in aquatic eDNA data remains largely unevaluated: it is not clear whether it 98
reflects ecological conditions. Most studies to date only evaluate the correspondence between 99
encounter-based and metabarcoded taxon lists (Miya et al. 2015; Valentini et al. 2016), 100
although the ecological signal itself may be of higher importance for many applications (Ji et al. 101
2013; Elbrecht et al. 2017). Third, it is not clear whether, and under what conditions eDNA is 102
financially efficient since comparisons are lacking (Lopes et al. 2016), although these 103
comparisons are essential for deciding on data collection strategies. 104
Here we particularly address whether 1) detectability of tropical amphibians with eDNA 105
is linked to species’ life history, and 2) there is sufficient ecological signal in amphibian eDNA 106
data to allow inferences about biodiversity patterns. Finally, we present a framework for cost 107
comparisons between encounter- and eDNA-based biodiversity survey that may be adapted to 108
other systems beyond amphibians. We compare the results of long- and short-term encounter-109
based field surveys, and an eDNA survey of tropical amphibians in a high-diversity area (45 110
species of frogs on ca. 30 km2). This area is well characterized with respect to amphibians, 111
including both larvae and adults (Schulze et al. 2015), and cryptic intraspecific diversity (e.g. 112
Jansen et al. 2011, Jansen et al. 2016). The area is located the Chiquitano region of Bolivia, a 113
forest-savanna ecotone between Amazon, Cerrado and Gran Chaco in a transition zone among 114
humid and dry forests that are special in regard to their taxonomic and functional diversity 115
(Castro et al. 1999). The region contains the largest intact, old-growth block of seasonally dry 116
tropical forests in South America (Miles et al. 2006; Power et al. 2016). 117
.CC-BY-ND 4.0 International licensepeer-reviewed) is the author/funder. It is made available under aThe copyright holder for this preprint (which was not. http://dx.doi.org/10.1101/176065doi: bioRxiv preprint first posted online Aug. 15, 2017;
A detailed description of the Materials and methods is provided in the Supplementary 120
materials. 121
The study area is near the Biological Station “Centro de Investigaciones Ecológicas 122
Chiquitos” on the San Sebastián cattle ranch (S16.3622, W62.00225, 500 m a.s.l.), 24 km south 123
of the town of Concepción, Province of Ñuflo de Chávez, Santa Cruz Department, Bolivia. A 124
description of the area is given by Schulze et al. (2009). Intensive long-term assessments have 125
resulted in a list of 45 frog species in the area (e.g. Jansen 2009; Schulze et al. 2009, 2015; 126
Jansen et al. 2011). We selected five ponds for this study. eDNA samples were obtained in 127
three technical replicates from three sampling points on each pond (Fig. 1). All samples and 128
replicates were filtered with a two-step sequential filtering scheme: first, two glass fiber filters 129
(GFF) with a pore size of 2 μm (filter method A: preserved in CTAB; B: dried), and second, the 130
flow-through was filtered with a nylon filter with (pore size 0.2 μm, method C, dried). Combined 131
visual and audio encounter surveys (VAES, Zimmerman 1994), and a tadpole survey (TS, 132
Schulze et al. 2015) were conducted by experienced observers (MJ and AS). Frogs were 133
located at night (between 21:00 and 00:30 hours) during 0.5 - 1 hrs transect walks along the 134
ponds to detect and identify specimens in vegetation, water and on ground around ponds with 135
flashlights and headlamps, and by listening. Tadpoles were searched once daytime and once at 136
night in each pond and the riparian vegetation, and caught with dip nets. 137
eDNA samples were processed in Germany in a low-DNA laboratory. DNA was 138
extracted from GFF samples (A, B, see above) with a CTAB chloroform extraction method 139
according to Strand et al. (2014) and Wittwer et al. (2017). Dried nylon filters (C) were extracted 140
with DNeasy Blood & Tissue Kit (Qiagen, Hilden, Germany) following Thomsen et al. (2012). 141
.CC-BY-ND 4.0 International licensepeer-reviewed) is the author/funder. It is made available under aThe copyright holder for this preprint (which was not. http://dx.doi.org/10.1101/176065doi: bioRxiv preprint first posted online Aug. 15, 2017;
Samples were fully randomized before extraction to prevent batch effects (Bálint et al. 2017a). 142
The barcode amplification targeted mitochondrial 16S ribosomal RNA. We designed primers for 143
a 150 bp fragment with the reference database of local species (sequences from 159 144
specimens, Jansen et al. 2011; Schulze et al. 2015). The primers were tested on a subset of 12 145
species (Supplementary Table S3). PCRs were run on 96-well plates in 15-µl reaction volumes 146
with a touchdown protocol, with four PCR technical replicates per sample. We included four 147
negative PCR controls (ultra-sterile water), four extraction blanks, and two positive controls on 148
each plate. The amplification primers contained multiplexing indices. PCR products were 149
purified, pooled in equal volumes, and paired-end-sequenced (2 x 150 bp) on an Illumina 150
NextSeq 500 sequencer. 151
Bioinformatics were done with OBITools v1.2.0 (Boyer et al. 2016). We performed two 152
reference-based taxonomic assignments, first with a custom database of 16S sequences of 159 153
specimens from the regional amphibian fauna (16S_custom), and second with all 16S 154
sequences found in the EMBL (release 125, 16S_EMBL). Further filtering was done in R (R 155
Core Team 2017) with a script supplied on GitHub: https://github.com/MikiBalint/amphibian-156
eDNA. 157
We followed recommendations for the statistical analyses of marker gene community 158
data (Bálint et al. 2016). eDNA faunistic differences among the five ponds were visualized with a 159
latent variable model-based ordination in R (‘boral’, Hui et al. 2015), and tested with 160
multispecies generalized linear models (‘mvabund’, Wang et al. 2012). The surveyed ponds 161
were markedly different in size, vegetation, water depth, etc, thus we considered the pond 162
identity as a good predictor of community composition. We performed a model-based ordination 163
also for the VAES presence/absence data and then used a Procrustean superimposition (Peres-164
Neto & Jackson 2001) to evaluate how the VAES-based ordination of ponds matches the 165
ordination of centroids of eDNA samples. We compared the efficiency of filter preservation 166
.CC-BY-ND 4.0 International licensepeer-reviewed) is the author/funder. It is made available under aThe copyright holder for this preprint (which was not. http://dx.doi.org/10.1101/176065doi: bioRxiv preprint first posted online Aug. 15, 2017;
(CTAB or dried) on the successful detection of species with a site occupancy model (MacKenzie 167
et al. 2002; Bailey et al. 2014), implemented in the R package ‘unmarked’ (Fiske et al. 2011). 168
We used the single season false-positive occupancy model developed by Miller et al. (2011). 169
For cost comparisons, we considered a typical eDNA survey scenario: samples are 170
collected in the field and later processed in a dedicated laboratory. For the encounter-based 171
survey we considered a scenario with a similar separation of the fieldwork, and species 172
identification: species records (audio or visual) are collected by a field biologist, and later 173
identified by an expert in the office/laboratory. The parameters in our cost model are a good 174
approximation of the variables involved in the present study and involve a learning effect in the 175
efficiency of the taxonomic expert. The sampling and identification costs of VAES are 176
dependent both on the number of sampling sites, and the number of species since each species 177
needs to be recorded (Fig. 4). During the eDNA survey eDNA samples are collected by a field 178
biologist, analysed in a lab and sequenced by an external provider. The sampling and 179
identification costs of eDNA sampling costs of eDNA depend on the number of sites, but not on 180
the number of species (Fig. 4). We kept some cost factors constant: the costs for training the 181
frog taxonomic expert and the VAES observers, the costs for building up the eDNA 182
metabarcoding facilities (clean rooms and equipments to perform DNA manipulations, but not 183
the sequencing), and the databases necessary for the sequence assignment. We assume that 184
travel costs are the same for the two survey types, and that the time necessary to walk between 185
frog observations and eDNA sampling points is the same. All model parameters and 186
calculations are accessible on FigShare (Bálint et al. 2017b; 187
https://figshare.com/articles/_/5099842). 188
189
.CC-BY-ND 4.0 International licensepeer-reviewed) is the author/funder. It is made available under aThe copyright holder for this preprint (which was not. http://dx.doi.org/10.1101/176065doi: bioRxiv preprint first posted online Aug. 15, 2017;
The sequencing resulted in 12 742 273 read pairs (deposited in ENA as PRJEB22113), 191
of which 9 479 299 were identified as complete 16S amplicons. These reads were de-replicated 192
into 631 003 unique sequences variants. Only 22 706 of these variants were represented by at 193
least 10 reads and retained for further processing. The sequence cleanup resulted in 14 442 194
high quality sequence variants, 13 497 coming from the present experiment. Of these, 4 805 195
sequence variants were taxonomically assigned with the 16S_custom database, and 8 692 with 196
the 16S_EMBL database. The assigned sequence variants represented 8 011 631 sequences, 197
of which 561 sequence variants were kept for further analyses as they were recorded as ‘head’ 198
in at least one sample (6 965 866 reads). After the removal of potential contaminant reads 5 898 199
184 sequences were retained. The final sample - sequence variant abundance matrix contained 200
5 815 014 sequences. These belonged to several groups: frogs (2 158 534), fish (1 692 613), 201
insects (304 059), mammals (14 006), birds (967), and bacteria and other groups (1 063 156). 202
In the five ponds 31 frog species were detected in total with both methods. The VAES 203
and the eDNA metabarcoding detected 25 species each, and TS detected 4 species; 19 species 204
were detected by both eDNA survey and VAES (Fig. 2a; Supplementary Table S1). Six species 205
were detected only by eDNA, and six species were detected only by VAES. Several of the 206
species detected by VAES but not by eDNA had no aquatic life phase during the time of survey 207
(i.e. no larvae or adults in the water). Of the species that were present in the water (N=20), 208
eDNA detected 19 (Fig. 2b, Supplementary Table S1). With a single sampling eDNA detected 209
more than half of the 45 species known to be present in the area (Fig. 2c, Supplementary Table 210
S2). Of these 45 species only 35 were ever detected at the surveyed ponds, and eDNA 211
detected 23 of those (Fig. 2d, Supplementary Table S2). The eDNA results reported two 212
additional species that were not known during the time of the survey from the area (Fig. 2c,d). 213
We detected 11 species (of the twelve) from the equimolar DNA concentration positive controls, 214
.CC-BY-ND 4.0 International licensepeer-reviewed) is the author/funder. It is made available under aThe copyright holder for this preprint (which was not. http://dx.doi.org/10.1101/176065doi: bioRxiv preprint first posted online Aug. 15, 2017;
and 6 in the non-equimolar DNA concentration controls (Supplementary Fig. S2). Read 215
numbers in the equimolar PCR controls were highly variable, but strongly correlated among the 216
controls (R > 0.7 for each pair of positive controls, Supplementary Fig. S2A). The read numbers 217
in the not equimolar positive control were strongly linked to the DNA template concentrations of 218
the PCRs (Pearson correlation coefficient R = 0.97, Supplementary Fig. S2B). Only 219
Leptodactylus vastus was recovered in the field positive control (water from an aquarium with L. 220
vastus tadpoles). 221
Sample preservation / extraction method C (0.2 μm nylon filter, dried in the field, DNA 222
extracted with DNeasy Blood & Tissue Kit) appeared to perform better (p1=0.327, 95% C.I. = 223
[0.285; 0.372] than methods A (p1=0.278 [0.242; 0.317]) and B (p1=0.243 [0.209; 0.281], both 2 224
μm glass-fiber filters, A - preserved in CTAB and DNA extracted using CTAB protocol, and B - 225
dried in the field, DNA extracted using CTAB protocol, Supplementary Fig. S3). Method A had 226
larger detection probability than method B, but confidence intervals were largely overlapping. 227
The three methods were equivalent with respect to false positive probabilities (Supplementary 228
Fig. S3). 229
Regarding the ecological signal in the eDNA data, replicate samples of each pond 230
grouped relatively tightly on the latent variable model ordination (Fig. 3a). The pond identity was 231
a statistically significant predictor of frog communities in the five ponds (ANOVA, df = 6, dev = 232
534.99, p < 0.01). This is reflected in the 95% confidence intervals of the group centroids on the 233
ordination which clearly separates all ponds except T1 and T3 (Fig. 3a). The ordination of the 234
eDNA pond centroids closely corresponds with the ordination of observations from the five 235
ponds with VAES (Procrustes permutation test, R = 0.8, p = 0.03, Fig. 3b). 236
The cost model of VAES and eDNA showed that the starting costs (i.e. with few 237
sampling sites) for VAES are relatively low, but these costs rapidly increase until the taxonomic 238
.CC-BY-ND 4.0 International licensepeer-reviewed) is the author/funder. It is made available under aThe copyright holder for this preprint (which was not. http://dx.doi.org/10.1101/176065doi: bioRxiv preprint first posted online Aug. 15, 2017;
expert becomes familiar with the regional frog fauna (Fig. 4). The VAES price is dependent on 239
the species richness: first, the VAES observer needs to record each species on the field, and 240
then the taxonomic expert needs to listen to each recording (Fig. 4). eDNA metabarcoding has a 241
relatively high entry price since consumables and sequencing are costly, regardless of the 242
number of sites. eDNA survey prices are then a linear function of the number of sampling sites, 243
and an increase in the site numbers simply adds to sampling and consumable costs, but does 244
not influence neither the time spent in the laboratory, nor the sequencing costs (Fig. 4). 245
246
.CC-BY-ND 4.0 International licensepeer-reviewed) is the author/funder. It is made available under aThe copyright holder for this preprint (which was not. http://dx.doi.org/10.1101/176065doi: bioRxiv preprint first posted online Aug. 15, 2017;
The one-time eDNA survey detected 25 species in the studied ponds, including formerly 248
cryptic species that were only recently described by integrative taxonomy. This is on par with 249
the one-time VAES (Fig. 2a), which confirmed the presence of (i) almost all species that were in 250
contact with water during the survey time (Fig. 2b), (ii) all species that had tadpoles in the ponds 251
(Supplementary Table S1), (iii) more than half of all 45 species ever recorded from the area 252
(Fig. 2c), and (iv) about 65% of the 35 species ever recorded in the surveyed 5 ponds (Fig. 2d). 253
The eDNA dataset recorded clear differences among the frog communities in the surveyed 254
ponds, a result also in accordance with the VAES data (Fig. 3). The comparison of VAES and 255
eDNA cost models show that eDNA biodiversity surveys may be a cost-efficient alternative to 256
VAES in species-rich areas, but not necessarily in areas with low species numbers. 257
Recommendations and technical remarks are presented in the Supplementary Materials. 258
Sensitivity of eDNA in diverse tropical frog communities 259
The comparison of the three filtration-preservation approaches shows that filters can be 260
feasibly dried in the field and sent to a lab. We could not evaluate whether detection probability 261
differs between larger pore-size GFF and small pore-size nylon filters since DNA was extracted 262
with different methods from these. Currently only few comparative studies exist regarding the 263
preservation of eDNA filtrates on filters: Hinlo et al. (2017) showed that the simple refrigeration 264
of filters may be preferred to frozen storage. Here we show that filters can simply be dried in the 265
field: this simplifies transportation since no special precautions are needed, unlike for liquid 266
handling. 267
During the one-time surveys, six species were detected only with eDNA, but not with 268
VAES (Fig. 2a). Four of these species (Dermatonotus muelleri, Leptodactylus elenae, 269
Osteocephalus taurinus, Rhinella schneideri) are quite common in the area. The detection of 270
.CC-BY-ND 4.0 International licensepeer-reviewed) is the author/funder. It is made available under aThe copyright holder for this preprint (which was not. http://dx.doi.org/10.1101/176065doi: bioRxiv preprint first posted online Aug. 15, 2017;
these four species by eDNA but not by VAES may result from the low abundance of adults or 271
tadpoles in the ponds, or a lack in acoustic activity. In some cases eDNA detections are likely 272
based on tadpoles only. For example, eDNA detected L. syphax from pond T2, although the 273
species was only heard calling from a crevice of a rocky outcrop, its usual habitat (de Sá et al. 274
2014), approximately 30 m away from T2. The remaining two species detected only with eDNA 275
are not known to occur in the area, thus they are candidates for false assignments. Both of 276
these were assigned with sequence data from EMBL (L. latinasus: KM091595, L. laevis: 277
AY843696). Lysapsus laevis would be the first record of this genus in the study area, but the 278
identification of Lysapsus populations only using short 16S eDNA sequences is questionable, 279
especially when considering the unclear taxonomy of the group in Bolivia. Nevertheless, all of 280
the four known species of Lysapsus (L. boliviana, L. caraya, L. laevis, L. limellum) may occur at 281
the site (De la Riva et al. 2000; Lavilla et al. 2004; Reichle 2004a; b; Angulo 2008; Jansen et al. 282
2011; Frost 2016) since they can easily be overlooked due to their small size and rather 283
inconspicuous advertisement call. Leptodactylus latinasus is another species possibly occurring 284
in the area but was so far not recorded (de Sá et al. 2014) and we cannot exclude the possibility 285
that the corresponding sequence variant is actually an erroneous variant of one of the six local 286
Leptodactylus species. 287
The species from this study either have no sufficient distributional data for an IUCN 288
evaluation, or they are in the “least concern” category (Supplementary Table S1). Twelve of the 289
31 species are not assessed by IUCN, because (a) the species were described or removed 290
from synonymy only recently (Dendropsophus salli: Jungfer et al. 2010; Scinax madeirae: 291
Brusquetti et al. 2014; Dendropsophus arndti: Caminer et al. 2017), or (b) the assessment of 292
their taxonomic status is still pending (e.g. various lineages of candidate species sensu Jansen 293
et al. 2011). Nine species with uncertain taxonomic status were classified as distinct 294
genealogical lineages by Jansen et al. (2011). These may represent new species with 295
.CC-BY-ND 4.0 International licensepeer-reviewed) is the author/funder. It is made available under aThe copyright holder for this preprint (which was not. http://dx.doi.org/10.1101/176065doi: bioRxiv preprint first posted online Aug. 15, 2017;
considerably smaller distributions. Twelve further species lack information on actual distribution, 296
although only one species is classified as “data deficient” (Pithecopus azureus). Nineteen 297
species are classified as “least concern”. These classifications may become obsolete given 298
rapid changes in taxonomy and updates on distributions: cryptic species-level diversity seems to 299
be high in frogs of South America (Fouquet et al. 2007; Gehara et al. 2013). In summary, very 300
little is known about actual distributions of Neotropical frogs due to sparse sampling and 301
unreliable taxonomy. eDNA might help to complete distribution data of amphibians (including 302
cryptic lineages), and this data is essential for reliable IUCN assessments. 303
eDNA metabarcoding is strongly facilitated by dedicated sequence databases: we had a 304
database that contained all 45 species that were ever recorded in the area. This database was 305
essential for both initial primer development, and taxonomic assignments: indeed, both eDNA-306
recorded taxa that were not present on the complete local species list of the present study (Fig. 307
2, Supplementary Table S2) were identified in the EMBL-based assignment that followed the 308
assignment with the custom local 16S database. The importance of sequence assignment 309
databases is long recognized, with considerable efforts underway to establish them 310
(Ratnasingham & Hebert 2007; Coissac et al. 2016). 311
Six species were detected only with VAES, but not by eDNA (Fig. 2a, Supplementary 312
Table S1). None of these species are strictly bound to ponds in the life stages occurring during 313
our sampling: two hylids, Dendropsophus arndti and D. salli, usually call from plants on the pond 314
shores (Schulze et al. 2009) and have only sporadic contact with water. Leptodactylus fuscus 315
and Pseudopaludicola sp. also do not enter the water but usually call from nearby muddy 316
grounds or grasslands. We did not detect tadpoles of these species in the ponds: the tadpoles 317
of these species develop during the rainy season which triggers reproduction, but our sampling 318
slightly preceded the rainy season. Some of the other undetected species have terrestrial or 319
quasi-terrestrial life histories: L. fuscus deposits eggs within foam nests in underground burrows 320
.CC-BY-ND 4.0 International licensepeer-reviewed) is the author/funder. It is made available under aThe copyright holder for this preprint (which was not. http://dx.doi.org/10.1101/176065doi: bioRxiv preprint first posted online Aug. 15, 2017;
at some distance from ponds and these are washed into nearby water bodies by floods that 321
follow heavy rains (Heyer 1978; Lucas et al. 2008). If we consider the specific life histories, the 322
one-time eDNA survey only missed a single species (Sphaenorhynchus lacteus) that was found 323
calling from the water during the VAES (Fig. 2b, Supplementary Table S1). The hylid Hypsiboas 324
geographicus was likely missed as a result of PCR bias: we could never recover it from positive 325
controls when DNA from other species was also present (Supplementary Fig. S2), although 326
single-template PCR reactions worked. Nonetheless, H. geographicus was also not detected by 327
VAES, so it is possible that the species was not present during the survey. Regarding the whole 328
local species pool (45 species in 10 years), life history also explains why at least some species 329
(N=10) may not be detectable by eDNA: these species reproduce outside of water (e.g. 330
Leptodactylus mystacinus), or are forest dwellers (e.g. Leptodactylus cf. didymus, Fig. 2d, 331
Supplementary Table S2). In conclusion, with a single sampling eDNA detected about 65% of 332
the detectable species from the area (23 out of 35). 333
Phenology is long considered important in encounter-based surveys of vertebrates 334
(Wilson & Bart 1985; Møller 2010) and it was recently shown that life history influences insect 335
detections with eDNA metabarcoding in temperate freshwaters (Bista et al. 2017). Our sampling 336
was done at the beginning of the rainy season when only few species reproduced in the ponds. 337
Repeating the sampling at during the rainy season may have potentially increased species 338
detections by eDNA. The results show the importance of life history in the metabarcoding-based 339
survey of tropical frogs and emphasize that sampling at specific or even multiple timepoints may 340
be essential for more complete species pools also with eDNA (see Recommendations and 341
technical remarks in the Supplementary Materials). 342
Ecological signal 343
There was considerable variation in the species recorded with the spatial replicates of 344
the eDNA samples, and this underlines that eDNA sampling should be replicated for a good 345
.CC-BY-ND 4.0 International licensepeer-reviewed) is the author/funder. It is made available under aThe copyright holder for this preprint (which was not. http://dx.doi.org/10.1101/176065doi: bioRxiv preprint first posted online Aug. 15, 2017;
representation of community composition. These samples may be pooled before DNA extraction 346
to optimize costs if site-level variation is not of interest. We recorded similar ecological signal in 347
the two datasets (Fig 3). The eDNA data did not distinguish the communities from ponds T1 and 348
T3, and these communities also grouped closely in the VAES results. We randomized the 349
samples before DNA extraction (Bálint et al. 2017a) so the signal is likely of biological origin and 350
not a result of laboratory batch effects. Although the comparison of the ecological signal may be 351
confounded by the different sample sizes (with the eDNA ordination based on many spatial 352
replicates and the VAES ordination on a single observation event per pond), the 353
correspondence of the results is still striking. Similar results were found in insect (Ji et al. 2013; 354
Elbrecht et al. 2017) and plant communities (Niemeyer et al. 2017) where eDNA-based and 355
morphology-based identifications result in similar conclusions about community structure, 356
despite markedly different species lists. Our results provide further evidence that eDNA-based 357
biodiversity surveys are highly sensitive to differences among ecological communities. These 358
inferences are comparable to those derived with encounter-based observations and are 359
informative about processes that underlay community assembly. 360
Cost efficiency of biodiversity surveys with eDNA metabarcoding 361
Although central to deciding on a method for biodiversity surveys, cost comparisons are 362
not straightforward since they need to be based on expert knowledge both in VAES and eDNA. 363
Cost comparisons were performed for single species eDNA detection (Huver et al. 2015; Davy 364
et al. 2015; Smart et al. 2016), but we are not aware of frameworks suitable for eDNA 365
metabarcoding. Here the VAES cost estimation is informed by over a decade of field and 366
integrative taxonomic work with tropical frogs (Jansen et al. 2007, 2016; Schulze et al. 2009; 367
Brusquetti et al. 2014), and the eDNA part is informed by multiple years of eDNA biodiversity 368
surveys (Bálint et al. 2016, 2017a; Vörös et al. 2017). Such comparisons are urgently needed 369
.CC-BY-ND 4.0 International licensepeer-reviewed) is the author/funder. It is made available under aThe copyright holder for this preprint (which was not. http://dx.doi.org/10.1101/176065doi: bioRxiv preprint first posted online Aug. 15, 2017;
due to stakeholder demands in eDNA (governmental agencies, conservation NGOs, fisheries, 370
etc.). 371
We defined two species richness scenarios for the cost comparisons (Fig. 4) since 372
experience shows that the time and resources necessary for VAES depend on the local 373
biodiversity. VAES costs become high in regions with high frog richness since they are a 374
function of both the number of sites and the number of species. Biodiversity surveys with eDNA 375
are not necessarily cheaper in low-richness regions since entry costs for the eDNA work are 376
high: lab consumables and sequencing are costly. However, eDNA survey costs are not 377
dependent on the local biodiversity since metabarcoding can consider thousands of species 378
simultaneously in a sample (Taberlet et al. 2012b). Consequently, eDNA costs are function of 379
sample numbers, which influence the collection time spent on the field and consumables. eDNA 380
metabarcoding operations are easily scaled up in a sense that hundreds of samples can be 381
simultaneously processed (Ficetola et al. 2015). 382
Several aspects of our cost models are contentious. One issue is whether the relatively 383
untrained VAES observers, or taxonomic experts perform the fieldwork, since taxonomic experts 384
may identify many of the species immediately on the field. Currently, most surveys of high-385
diversity areas are directly done by experts interested in the local fauna, but we argue that this 386
will not work for continental - global biodiversity surveys simply because there are not enough 387
taxonomic experts (Buyck 1999; Haas & Häuser 2003). We also did not consider a scenario 388
when VAES surveys are performed with automated recording devices (ARDs), and sounds are 389
automatically identified by algorithms (see Recommendations and technical remarks in the 390
Supplementary Materials). The sound complexity in tropical environments currently prohibits the 391
use of automated sound identifications (Campos-Cerqueira & Aide 2016). It is also difficult to 392
compare fundamental infrastructure and training costs (i.e. the establishment of an eDNA labor 393
VS the training of taxonomic experts). Discussions about cost models are timely since they will 394
.CC-BY-ND 4.0 International licensepeer-reviewed) is the author/funder. It is made available under aThe copyright holder for this preprint (which was not. http://dx.doi.org/10.1101/176065doi: bioRxiv preprint first posted online Aug. 15, 2017;
play major roles in devising continental-global biodiversity surveys, much needed today to 395
monitor global biodiversity targets (Tittensor et al. 2014). 396
397
398
.CC-BY-ND 4.0 International licensepeer-reviewed) is the author/funder. It is made available under aThe copyright holder for this preprint (which was not. http://dx.doi.org/10.1101/176065doi: bioRxiv preprint first posted online Aug. 15, 2017;
eDNA seems to be suitable to standardized biodiversity surveys of frogs even in 400
species-rich areas, but it may be overly costly for smaller studies in low-richness regions. 401
Differences between eDNA and traditional surveys seem to result largely from different 402
observational biases, but a consideration of life histories promises to improve correspondence. 403
The eDNA data is certainly suitable to characterize not only community composition, but also 404
the ecological signals of factors that shape communities: this gives an unprecedented 405
opportunity to incorporate eDNA as a standard toolkit for community ecology and macroecology. 406
The quality of the ecological signal in eDNA-based biodiversity data foresees global biodiversity 407
surveys and monitoring that will support both biodiversity research, and informed decisions on 408
sustainable use of biological diversity. 409
410
411
.CC-BY-ND 4.0 International licensepeer-reviewed) is the author/funder. It is made available under aThe copyright holder for this preprint (which was not. http://dx.doi.org/10.1101/176065doi: bioRxiv preprint first posted online Aug. 15, 2017;
The authors thank Jenny Wertheimer for technical assistance during eDNA extraction, 413
José Ribeiro for a helpful discussion on passive acoustic monitoring, and Simon Vitecek for 414
helpfuls suggestions on the manuscript. MJ, AS and JLA thank the owners of Hacienda San 415
Sebastián (family Werding) for their invitation to conduct herpetological surveys on their 416
properties and for logistic support. MJ was supported by the Erika and Walter Datz-Stiftung, Bad 417
Homburg v. d. H., equipment was sponsored by Globetrotter, Frankfurt. This research presents 418
an outcome of the Centre for Translational Biodiversity Genomics (LOEWE-TBG) and was 419
supported by the research funding programme “LOEWE – Landes-Offensive zur Entwicklung 420
Wissenschaftlich-ökonomischer Exzellenz" of Hesse's Ministry of Higher Education, Research, 421
and the Arts. 422
423
.CC-BY-ND 4.0 International licensepeer-reviewed) is the author/funder. It is made available under aThe copyright holder for this preprint (which was not. http://dx.doi.org/10.1101/176065doi: bioRxiv preprint first posted online Aug. 15, 2017;
Brusquetti F, Jansen M, Barrio-Amorós et al. (2014) Taxonomic review of Scinax 448
.CC-BY-ND 4.0 International licensepeer-reviewed) is the author/funder. It is made available under aThe copyright holder for this preprint (which was not. http://dx.doi.org/10.1101/176065doi: bioRxiv preprint first posted online Aug. 15, 2017;
Butchart SHM, Walpole M, Collen B et al. (2010) Global biodiversity: indicators of recent 453
declines. Science, 328, 1164–1168. 454
Buyck B (1999) Taxonomists are an endangered species in Europe. Nature, 401, 321. 455
Caminer MA, Milá B, Jansen M et al. (2017) Systematics of the Dendropsophus leucophyllatus 456
species complex (Anura: Hylidae): Cryptic diversity and the description of two new species. 457
PloS one, 12, e0171785. 458
Campos-Cerqueira M, Aide TM (2016) Improving distribution data of threatened species by 459
combining acoustic monitoring and occupancy modelling. Methods in ecology and evolution 460
/ British Ecological Society, 7, 1340–1348. 461
Castro AAJF, A A J, Martins FR, Tamashiro JY, Shepherd GJ (1999) How rich is the flora of 462
Brazilian Cerrados? Annals of the Missouri Botanical Garden. Missouri Botanical Garden, 463
86, 192. 464
Clarke DA, York PH, Rasheed MA, Northfield TD (2017) Does biodiversity–ecosystem function 465
literature neglect tropical ecosystems? Trends in ecology & evolution, 32, 320–323. 466
Coissac E, Hollingsworth PM, Lavergne S, Taberlet P (2016) From barcodes to genomes: 467
extending the concept of DNA barcoding. Molecular ecology, 25, 1423–1428. 468
Costello MJ, May RM, Stork NE (2013) Can we name Earth’s species before they go extinct? 469
Science, 339, 413–416. 470
Cristescu ME (2014) From barcoding single individuals to metabarcoding biological 471
communities: towards an integrative approach to the study of global biodiversity. Trends in 472
ecology & evolution, 29, 566–571. 473
Davy CM, Kidd AG, Wilson CC (2015) Development and validation of environmental DNA 474
.CC-BY-ND 4.0 International licensepeer-reviewed) is the author/funder. It is made available under aThe copyright holder for this preprint (which was not. http://dx.doi.org/10.1101/176065doi: bioRxiv preprint first posted online Aug. 15, 2017;
(eDNA) markers for detection of freshwater turtles. PloS one, 10, e0130965. 475
De la Riva I, Köhler J, Lötters S, Reichle S (2000) Ten years of research on Bolivian 476
amphibians: updated checklist, distribution, taxonomic problems, literature and 477
iconography. Revista espanola de herpetologia, 14, 19–164. 478
de Sá RO, Grant T, Camargo A et al. (2014) Systematics of the neotropical genus 479
Leptodactylus Fitzinger, 1826 (Anura: Leptodactylidae): phylogeny, the relevance of non-480
molecular evidence, and species accounts. South american journal of herpetology / 481
Sociedade Brasileira de Herpetologia, 9, S1–S100. 482
Elbrecht V, Vamos EE, Meissner K, Aroviita J, Leese F (2017) Assessing strengths and 483
weaknesses of DNA metabarcoding-based macroinvertebrate identification for routine 484
stream monitoring. Methods in ecology and evolution / British Ecological Society. 485
Ferrão M, Colatreli O, de Fraga R et al. (2016) High species richness of Scinax treefrogs 486
(Hylidae) in a threatened Amazonian landscape revealed by an integrative approach. PloS 487
one, 11, e0165679. 488
Ficetola GF, Pansu J, Bonin A et al. (2015) Replication levels, false presences and the 489
estimation of the presence/absence from eDNA metabarcoding data. Molecular ecology 490
resources, 15, 543–556. 491
Fiske I, Chandler R, Others (2011) unmarked: An R package for fitting hierarchical models of 492
wildlife occurrence and abundance. Journal of statistical software, 43, 1–23. 493
Fouquet A, Gilles A, Vences M et al. (2007) Underestimation of species richness in neotropical 494
frogs revealed by mtDNA analyses. PloS one, 2, e1109. 495
Frost DR (2016) Amphibian Species of the World: an Online Reference. Version 6.0. 496
Gehara M, Canedo C, Haddad CFB, Vences M (2013) From widespread to microendemic: 497
molecular and acoustic analyses show that Ischnocnema guentheri (Amphibia: 498
Brachycephalidae) is endemic to Rio de Janeiro, Brazil. Conservation genetics , 14, 973–499
982. 500
.CC-BY-ND 4.0 International licensepeer-reviewed) is the author/funder. It is made available under aThe copyright holder for this preprint (which was not. http://dx.doi.org/10.1101/176065doi: bioRxiv preprint first posted online Aug. 15, 2017;
Jansen M, Plath M, Brusquetti F, Ryan MJ (2016) Asymmetric frequency shift in advertisement 526
.CC-BY-ND 4.0 International licensepeer-reviewed) is the author/funder. It is made available under aThe copyright holder for this preprint (which was not. http://dx.doi.org/10.1101/176065doi: bioRxiv preprint first posted online Aug. 15, 2017;
calls of sympatric frogs. Amphibia-reptilia: publication of the Societas Europaea 527
Herpetologica, 37, 137–152. 528
Ji Y, Ashton L, Pedley SM et al. (2013) Reliable, verifiable and efficient monitoring of 529
biodiversity via metabarcoding. Ecology letters, 16, 1245–1257. 530
Jungfer K-H, Reichle S, Piskurek O (2010) Description of a new cryptic southwestern 531
Amazonian species of leaf-gluing treefrog, genus Dendropsophus (Amphibia: Anura: 532
Hylidae). Salamandra, 46, 204–213. 533
Lavilla E, Reichle S, Lajmanovich R, Faivovich, Julian (2004) Lysapsus limellum. The IUCN Red 534
List of Threatened Species. 535
Lees AC, Pimm SL (2015) Species, extinct before we know them? Current biology: CB, 25, 536
R177–80. 537
Lopes CM, Sasso T, Valentini A et al. (2016) eDNA metabarcoding: a promising method for 538
anuran surveys in highly diverse tropical forests. Molecular ecology resources. 539
Lucas EM, Brasileiro CA, Oyamaguchi HM, Martins M (2008) The reproductive ecology of 540
Leptodactylus fuscus (Anura, Leptodactylidae): new data from natural temporary ponds in 541
the Brazilian Cerrado and a review throughout its distribution. Journal of natural history, 42, 542
2305–2320. 543
MacKenzie DI, Nichols JD, Lachman GB et al. (2002) Estimating site occupancy rates when 544
detection probabilities are less than one. Ecology, 83, 2248–2255. 545
Miles L, Newton AC, DeFries RS et al. (2006) A global overview of the conservation status of 546
tropical dry forests. Journal of biogeography, 33, 491–505. 547
Miller DA, Nichols JD, McClintock BT et al. (2011) Improving occupancy estimation when two 548
types of observational error occur: non-detection and species misidentification. Ecology, 92, 549
1422–1428. 550
Miya M, Sato Y, Fukunaga T et al. (2015) MiFish, a set of universal PCR primers for 551
metabarcoding environmental DNA from fishes: detection of more than 230 subtropical 552
.CC-BY-ND 4.0 International licensepeer-reviewed) is the author/funder. It is made available under aThe copyright holder for this preprint (which was not. http://dx.doi.org/10.1101/176065doi: bioRxiv preprint first posted online Aug. 15, 2017;
marine species. Royal Society open science, 2, 150088. 553
Møller AP (2010) When climate change affects where birds sing. Behavioral ecology: official 554
journal of the International Society for Behavioral Ecology, 22, 212–217. 555
Niemeyer B, Epp LS, Stoof-Leichsenring KR, Pestryakova LA, Herzschuh U (2017) A 556
comparison of sedimentary DNA and pollen from lake sediments in recording vegetation 557
composition at the Siberian treeline. Molecular ecology resources. 558
Ortega-Andrade HM, Rojas-Soto OR, Valencia JH et al. (2015) Insights from integrative 559
systematics reveal cryptic diversity in Pristimantis frogs (Anura: Craugastoridae) from the 560
Upper Amazon Basin. PloS one, 10, e0143392. 561
Pauls SU, Nowak C, Bálint M, Pfenninger M (2013) The impact of global climate change on 562
genetic diversity within populations and species. Molecular ecology, 22, 925–946. 563
Pedersen MW, Overballe-Petersen S, Ermini L et al. (2015) Ancient and modern environmental 564
DNA. Philosophical transactions of the Royal Society of London. Series B, Biological 565
sciences, 370, 20130383. 566
Peres-Neto PR, Jackson DA (2001) How well do multivariate data sets match? The advantages 567
of a pProcrustean superimposition approach over the Mantel test. Oecologia, 129, 169–568
178. 569
Petitot M, Manceau N, Geniez P, Besnard A (2014) Optimizing occupancy surveys by 570
maximizing detection probability: application to amphibian monitoring in the Mediterranean 571
region. Ecology and evolution, 4, 3538–3549. 572
Pfenninger M, Schwenk K (2007) Cryptic animal species are homogeneously distributed among 573
taxa and biogeographical regions. BMC evolutionary biology, 7, 121. 574
Pimm SL, Jenkins CN, Abell R et al. (2014) The biodiversity of species and their rates of 575
extinction, distribution, and protection. Science, 344, 1246752. 576
Power MJ, Whitney BS, Mayle FE et al. (2016) Fire, climate and vegetation linkages in the 577
Bolivian Chiquitano seasonally dry tropical forest. Philosophical transactions of the Royal 578
.CC-BY-ND 4.0 International licensepeer-reviewed) is the author/funder. It is made available under aThe copyright holder for this preprint (which was not. http://dx.doi.org/10.1101/176065doi: bioRxiv preprint first posted online Aug. 15, 2017;
Taberlet P, Coissac E, Hajibabaei M, Rieseberg LH (2012a) Environmental DNA. Molecular 601
ecology, 21, 1789–1793. 602
Taberlet P, Coissac E, Pompanon F, Brochmann C, Willerslev E (2012b) Towards next-603
generation biodiversity assessment using DNA metabarcoding. Molecular ecology, 21, 604
.CC-BY-ND 4.0 International licensepeer-reviewed) is the author/funder. It is made available under aThe copyright holder for this preprint (which was not. http://dx.doi.org/10.1101/176065doi: bioRxiv preprint first posted online Aug. 15, 2017;
.CC-BY-ND 4.0 International licensepeer-reviewed) is the author/funder. It is made available under aThe copyright holder for this preprint (which was not. http://dx.doi.org/10.1101/176065doi: bioRxiv preprint first posted online Aug. 15, 2017;
biodiversity. Standard methods for amphibians (eds Heyer WR, Donnelly MA, McDiarmid 631
RW, Hayek LC, Foster MS), pp. 99–108. Smithsonian Institution Press, Washington DC. 632
633
634
635
.CC-BY-ND 4.0 International licensepeer-reviewed) is the author/funder. It is made available under aThe copyright holder for this preprint (which was not. http://dx.doi.org/10.1101/176065doi: bioRxiv preprint first posted online Aug. 15, 2017;
Raw sequence data was deposited in ENA as PRJEB22113. Cost model parameters 638
and calculations, and input data for statistical analyses are accessible through FigShare (Bálint 639
et al. 2017b) (https://figshare.com/articles/_/5099842). R-based bioinformatic filtering and 640
statistical analyses are accessible through GitHub: https://github.com/MikiBalint/amphibian-641
eDNA. 642
643
.CC-BY-ND 4.0 International licensepeer-reviewed) is the author/funder. It is made available under aThe copyright holder for this preprint (which was not. http://dx.doi.org/10.1101/176065doi: bioRxiv preprint first posted online Aug. 15, 2017;
performed research; B.C., T.C., C.N., S.U.P. contributed reagents or analytic tools; M.B., M.J. 646
analysed data; M.B., T.C., M.J., O.M., C.N., S.U.P., wrote the manuscript. 647
648
649
650
.CC-BY-ND 4.0 International licensepeer-reviewed) is the author/funder. It is made available under aThe copyright holder for this preprint (which was not. http://dx.doi.org/10.1101/176065doi: bioRxiv preprint first posted online Aug. 15, 2017;
glass-fiber filter, 2 μm; nylon - nylon filter, 2 μm. Each sampling replicate (three per pond, 656
marked with small circles) were processed with each three filtration strategies. Replicated 657
samples of pond T5 were three times processed with each filtration strategy. 658
659
660
31
.CC-BY-ND 4.0 International licensepeer-reviewed) is the author/funder. It is made available under aThe copyright holder for this preprint (which was not. http://dx.doi.org/10.1101/176065doi: bioRxiv preprint first posted online Aug. 15, 2017;
Comparison of species lists generated by eDNA (blue, n = 25) and A) visual and audio 663
encounter surveys (VAES, yellow, n = 25), B) tadpole survey (TS) plus reduced VAES - only 664
species with high eDNA detectability in ponds (see text for details; grey, n=20), C) complete 665
local species pool (red, n = 45), and D) species pool of studied ponds based on long-term 666
monitoring (green, n = 35). 667
668
669
670
32
.CC-BY-ND 4.0 International licensepeer-reviewed) is the author/funder. It is made available under aThe copyright holder for this preprint (which was not. http://dx.doi.org/10.1101/176065doi: bioRxiv preprint first posted online Aug. 15, 2017;
Comparison of ecological signal between visual and audio encounter surveys (VAES) and 673
eDNA metabarcoding surveys. A - Latent variable model ordination of the pond samples 674
according to the read numbers of species. Water samples from each pond were taken at three 675
locations. For ponds T1-T4, three replicate samples at each location were filtered through two 676
GFF (A,B), and one nylon filter (C), resulting in nine samples per pond. For pond T5, each 677
filtration was replicated three times. Not all samples contained reads after the bioinformatic 678
quality filtering and these samples are not shown on the ordination (see e.g. T3 - red). The 679
ellipses represent 95% confidence intervals for the standard errors of the pond centroids 680
33
.CC-BY-ND 4.0 International licensepeer-reviewed) is the author/funder. It is made available under aThe copyright holder for this preprint (which was not. http://dx.doi.org/10.1101/176065doi: bioRxiv preprint first posted online Aug. 15, 2017;
(marked with +). B - Non-metric multidimensional scaling plot of the five ponds (Jaccard 681
distance), according to VAES species presence-absences. The arrows represent the Procrustes 682
rotation of the VAES pond ordination and they target the group centroids of the latent variable 683
model ordination. 684
.CC-BY-ND 4.0 International licensepeer-reviewed) is the author/funder. It is made available under aThe copyright holder for this preprint (which was not. http://dx.doi.org/10.1101/176065doi: bioRxiv preprint first posted online Aug. 15, 2017;
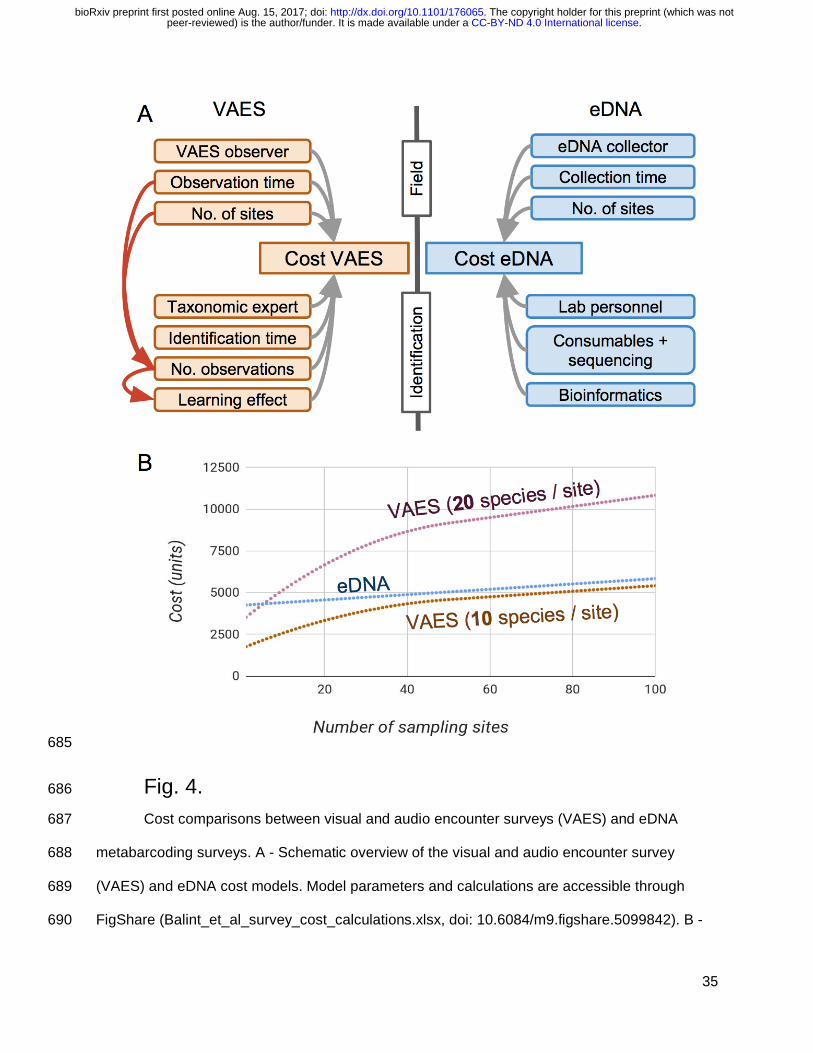
Cost comparisons between visual and audio encounter surveys (VAES) and eDNA 687
metabarcoding surveys. A - Schematic overview of the visual and audio encounter survey 688
(VAES) and eDNA cost models. Model parameters and calculations are accessible through 689
FigShare (Balint_et_al_survey_cost_calculations.xlsx, doi: 10.6084/m9.figshare.5099842). B - 690
35
.CC-BY-ND 4.0 International licensepeer-reviewed) is the author/funder. It is made available under aThe copyright holder for this preprint (which was not. http://dx.doi.org/10.1101/176065doi: bioRxiv preprint first posted online Aug. 15, 2017;
Cost comparisons of frog diversity surveys with eDNA, and two VAES scenarios (a low local 691
species richness scenario - 10 species per site, and a medium-high species richness scenario - 692
20 species per site). eDNA surveys have high initial costs: laboratory and sequencing costs are 693
considerable, regardless of the numbers of sites and species. A consequence is that eDNA 694
surveys are not sensitive to increases in species numbers. This is in contrast with the VAES, 695
where the costs are a direct function of species richness. 696
.CC-BY-ND 4.0 International licensepeer-reviewed) is the author/funder. It is made available under aThe copyright holder for this preprint (which was not. http://dx.doi.org/10.1101/176065doi: bioRxiv preprint first posted online Aug. 15, 2017;