44
Twenty Years of Observations Along the Gulf of Alaska’s Seward Line: Impact of Continued Warm Conditions Russ Hopcroft, Ken Coyle, Seth Danielson, Suzanne Strom

Twenty Years of Observations Along the Gulf of Alaska’s Seward Line:
Impact of Continued Warm Conditions
Russ Hopcroft, Ken Coyle, Seth Danielson,
Suzanne Strom

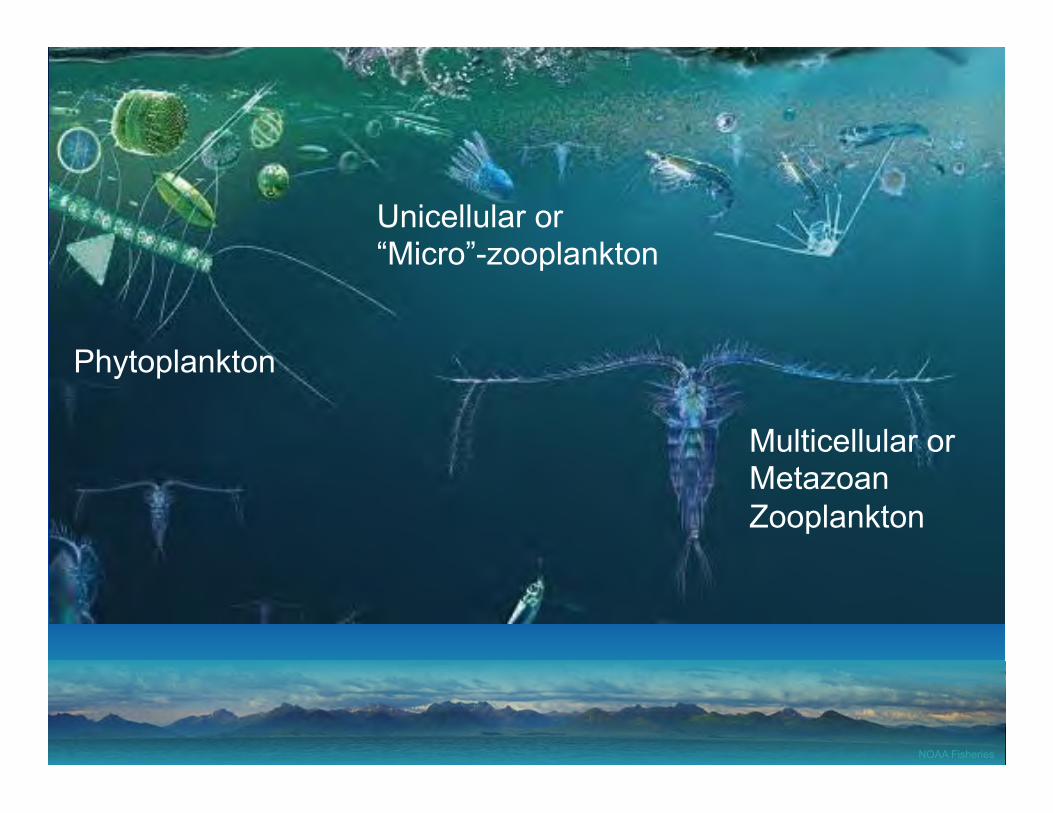
Plankton form the essential link between the sun and larger animals

No Plankton = no fish to harvest

NOAA Fisheries
Food Pyramid • Climate variability
alters marine groups through changes in ocean physics and chemistry that cascade through the food web
Climate Variability
• To understand AND predict a harvested species, we need routine observations of the complete food web

NOAA Fisheries
Late 1960’s
Early 1980’s
North Pacific 1977 Regime Shift
1970 1980 1990a
Ecos
yste
m st
ate
Climate: Why care?
Changes catches in a small mesh bottom trawl in Pavlof Bay, Alaska, through the regime shift of the mid-1970s.
NOAA Fisheries
Phytoplankton
Multicellular or Metazoan Zooplankton
Unicellular or “Micro”-zooplankton

The sub-arctic Gulf of Alaska

Seward Line • Physical data
over ~5 decades • Biological data
over 20 years • GLOBEC
1997-2004 > NPRB > Consortium 2010
• Sample early May & mid September
• 2011 expansion to eastern PWS

GAK1: Coastal Gulf of Alaska
Over 44 years: ! Overall temperature increase ! Salinity decrease at surface ! Salinity increase waters >200m
3
2
1
0

SL Observations • Physics (T, S, Optical properties) • Chemistry
– Macronutrients (nitrate, phosphate, silicate)
– Carbon (Ocean acidification) – Iron (Gulf of Alaska Project)
• Chlorophyll (+Primary production) • Phyto/Microzooplankon • Metazooplankton (3 mesh sizes) • Seabirds/Marine Mammal observer

Seward Line: May 0-100m Temperature 4 4.5 5 6.5 6 7 5.5

NOAA Fisheries
Temperature
Dep
th (m
)

NOAA Fisheries
April 1, 2003
May 16, 2003
• In spring, returning light favors algal growth, but mixing limits how much time they spend in good light
• Mixing can be stopped by the sun warming surface waters or fresher water floating on top of saltier water
• Primary production starts in PWS and on the inner shelf (weeks) earlier than the mid- and outer shelf due to different stratifying mechanisms
Mar Apr May Jun Jul Aug Sep Oct
Chlo
roph
yll a
(mg
m-3
)
0.0
0.5
1.0
1.5
2.0
2.5
Cross-shelf Average

The success of the zooplankton that dominate the spring is related to their unique adaptations to the
production cycles of the Gulf
Three Neocalanus copepods species dominate the ecosystem
during spring
Neocalanus

Would climate change lead to a year-round
dominance of small species (poor fish
food)????
Sometime in June/July, Neocalanus complete their feeding stages and begin descending to depth to sleep. Small multi-generation surface-dwelling species such as Pseudocalanus then dominate for the remainder of year

If you were a
fish, which
makes a better meal?

Neocalanus • Spawns Dec-Feb deep in
the ocean (queued by day length)
• Young grow, while swimming to surface in “anticipation” of spring bloom – great flexibility in hitting the timing of the spring bloom
• Abundance of Neocalanus in a given year has little to do that year’s temperature
• Length of time feeding at surface until going deep is determined largely by temperature and food, that together influence lipid accumulation
~July ~Dec
Sleep
500-1000 m depth
0-50 m depth

NOAA Fisheries
• In a warm year, spring bloom is earlier (and often smaller) – Neocalanus growth phase is completed earlier….
• In a cold year, bloom is later, larger and longer – Neocalanus success is greater, growth is completed later….
J F M A M J J A
Salmon Ocean Entry
Month
Bio
mas
s
Initial Paradigm
• Cold years have better & longer overlap of Neocalanus with juvenile salmon and other fishes

NOAA Fisheries
Seward Line temperature & Neocalanus
Mean Abundance (No m-3)
0
25
50
75
100
125
150
175
200
Stage
3.4
3.6
3.8
4.0
4.2
4.4
4.6
4.8
5.0

NOAA Fisheries
What does a warming ocean do to the Gulf of Alaska?

NOAA Fisheries
Recent warmings: The Blob

NOAA Fisheries
We just exited one of the top 3 El Nino’s of the last 65 years

0
May
2014 2015 2016
Sept
200
0
0 0 0 200 200 100 100 100
100
100
200
200
300
300
Dep
th (m
)
-3 3 -1 1

• High interannual variability in bloom timing & magnitude
• Shelf does not bloom simultaneously
NOAA Fisheries
• Normally as chloro increases, %large cells does too
May
2000 2005 2010 2015
Inte
grat
ed C
hlor
ophy
ll (m
g m
-2)
0
50
100
150
200
250
300Inner ShelfMiddle ShelfOuter/slope
Integrated Chlorophyll (mg m-2)0 100 200 300 400
Size
Fra
ctio
n >2
0µm
(%)
0
20
40
60
80
100
2001200320112013201420152016
Integrated Chlorophyll (mg m-2)0 100 200 300 400
Size
Fra
ctio
n >2
0µm
(%)
0
20
40
60
80
100
2001200320112013
• During “blob” years, increase is modest, but cells stay small
• Microzooplankton biomass is low during blob, mostly small
May
Seward Line Station2 4 6 8 10
Mic
rozo
op. b
iom
ass
(mgC
m-3
)
0
20
40
60
80201120132015

MODIS Aqua ocean color shows blob
resulted in reduced summer chlorophyll,
with 2016 being low in both spring & summer
(like 2003 El Niño)
NOAA Fisheries
April-May
2002 2004 2006 2008 2010 2012 2014 2016-8-6-4-202468
10
June-August
2002 2004 2006 2008 2010 2012 2014 2016
Chl
orop
hyll
Anom
oloy
-6-4-202468
2011 2012 2016

NOAA Fisheries
Neocalanus development is faster in warm years, but metabolic costs are higher AND food was limited in 2016
Mean Abundance (No m-3)
0
25
50
75
100
125
150
175
200
Stage
3.4
3.6
3.8
4.0
4.2
4.4
4.6
4.8
5.0

Typical fall lipids 2016 fall lipids
Low chlorophyll AND microzoop spring & summer 2016

NOAA Fisheries
2016/17
Female
Life
time
Fecu
ndity
(# e
ggs)
0
200
400
600
800
1000
1200
FirstSecondThirdForthFifth
2015/16
0
200
400
600
800
1000
1200
Total
Mean = 487
Mean = 258
2002/2003Li
fetim
e Fe
cund
ity (#
egg
s)
0
200
400
600
800
1000
1200
FirstSecondThirdForthFifth
2004/05
Female0
200
400
600
800
1000
1200
Mean = 521
Mean = 520

May September* Calanus pacificus
020406080
100
Paracalanus parva
0100200300400500
Mesocalanus tenuicornis
024
816
Clausocalanus spp.
2000 2005 2010 20150.000.020.04
0.200.40
Calanus pacificus
0.000.040.080.120.16
Paracalanus parva
Mea
n Ab
unda
nce
(No
m-3
)
0.000.020.040.060.08
Mesocalanus tenuicornis
0.00.51.01.52.0
Clausocalanus spp.
2000 2005 2010 20150.000.010.020.030.04
These species are lipid-poor & smaller than resident fauna

NOAA Fisheries
Caution: Multivariate Analysis • To explore pattern, we can determine how similar
the community in each of our samples is to every other sample (Bray-Curtis similarity)
• This method accounts for both abundance and contribution of each species and places the data into a multi-dimensional space (where # of dimensions = # species)
• We can then determine how “close” each sample is to every other sample, and start grouping them based on their similarity
• This is presented either as a tree of progressive joining, or by reducing to strongest 2-3 dimensions
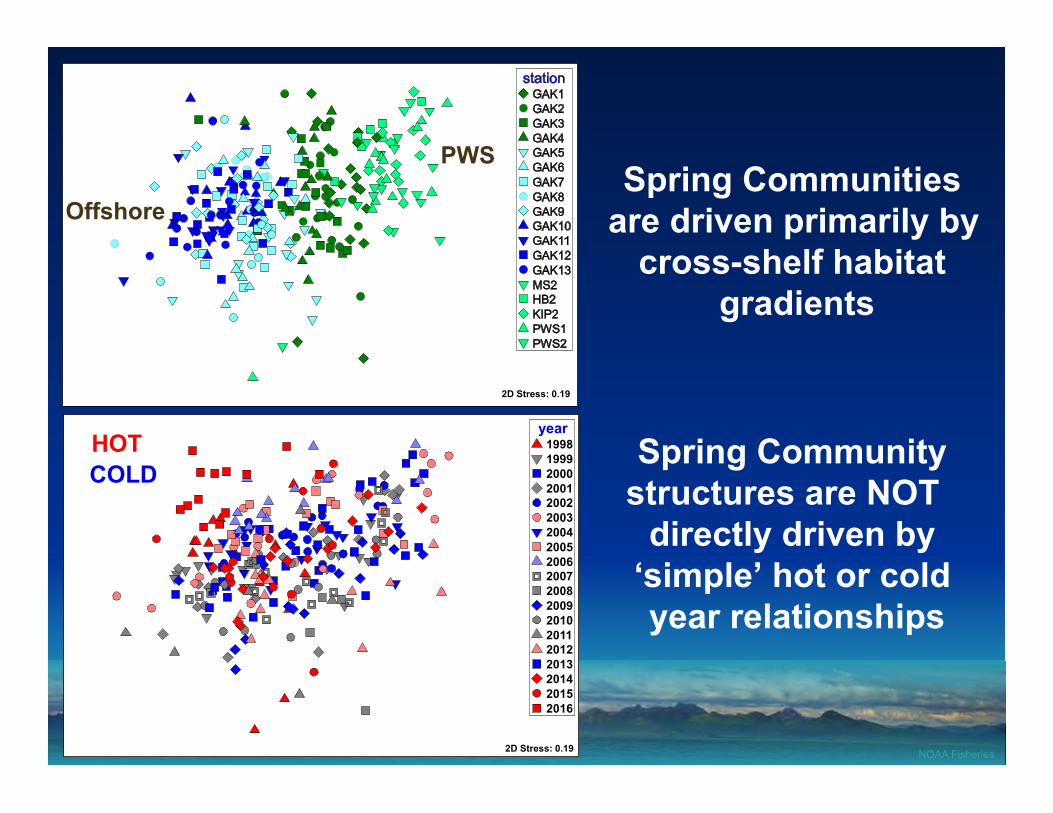
Spring Communities are driven primarily by
cross-shelf habitat gradients
2D Stress: 0.19
PWS
Offshore
NOAA Fisheries
year1998199920002001200220032004200520062007200820092010201120122013201420152016
2D Stress: 0.19
COLD HOT Spring Community
structures are NOT directly driven by
‘simple’ hot or cold year relationships

StationGAK1GAK2GAK3GAK4GAK5GAK6GAK7GAK8GAK9GAK10GAK11GAK12GAK13GAK14GAK15MS2KIP2PWS1PWS2HB22D Stress: 0.23
NOAA Fisheries
Fall Communities also show a strong cross-shelf gradient
PWS
Offshore
Year199719982000200220032004200520062007200820092010201120122013201420152016
2D Stress: 0.23
Older
Blob/El Nino
While Fall Community structures are NOT
directly driven by hot or cold, recent years are displaced suggesting
overall community shifts are underway

NOAA Fisheries
Recent Unusual Plankton Community Events
• Warm water copepods are increasing year-round over the past decade in PWS
• 2011 – Salp blooms • 2014-2016 – increase frequency/duration of PSP • 2016 – Doliolid blooms
– Pseudo-Thecosome pteropods – Heteropods (sea elephants) SE Alaska
• 2017 – Pyrosome blooms off Sitka

NOAA Fisheries
Summary • Recent warm year has disrupted spring bloom • Spring Neocalanus communities are resilient to
temperature variability and spring bloom timing • However, extreme high temperatures and low food
can impact reproductive output • Spring communities do not show systematic
temperature relationships (as yet) • Extreme temperature events in recent years are
manifested as a displacement in fall community structure, driven by smaller lipid-poor warm-water species
• These shifts will be amplified in future years

NOAA Fisheries
NGA LTER
The Future

NOAA Fisheries
Enhancements • Longer cruises (2.5-3 wks) – one UNOLS annually • Expanded domain • Process studies targetting productive “features” • Summer cruise (late June/July) • Mid-shelf heavily-instrumented mooring • Particle flux / Sedimentation • Jellyfish trawl • Modelling • Outreach

NOAA Fisheries
Seward Line
Website
• Contains: – time-series
results – individual
cruises – information on
key species – content still
growing

NOAA Fisheries
Although temperature drives rates of Neocalanus development, it does not explain their overall success on the
shelf, however…
Neocalanus anomaly (# m-3)-60 -40 -20 0 20 40 60 80
Pink
Sur
viva
l ano
mal
y (%
)
-4
-2
0
2
4
6
8
1998
1999
2000
2001
2002
2003
2004
2005
2006
2007
2008
2009
2010 2011
2012
r2=0.27

NOAA Fisheries
Another example: Sea butterflies
-4 -3 -2 -1 0 1 2 3 4 5 6
-10
-5
0
5
10
15
% Pink salm
on survival anom
aly PW
S pt
erop
od a
nom
aly

NOAA Fisheries
The blob is dead?

NOAA Fisheries
Preliminary Observations of the Impact of
Anomalous Ocean Conditions on the
Distribution of Marine fish in the Gulf of Alaska and
California Current Hollowed et al.
Maps of age 2+ (red) and age 1 (green) pollock density from the 2005 (top), 2013 (middle) and 2015 (bottom) acoustic surveys in the GOA.

NOAA Fisheries
Too hot for Pollack larvae in 2015?
Annette Dougherty, EcoFOCI Program

NOAA Fisheries
Age-0 pollock, late summer
M. Wilson, S. Porter, & W. Strasburger, Eco-FOCI


