20
Twin Cities Area Economic and Business Conditions Report ird Quarter 2014

Twin Cities AreaEconomic and Business Conditions ReportThird Quarter 2014

1
TABLE OF CONTENTS
Executive Summary ................................................................................1
Twin Cities Leading Economic Indicators Index ......................................2
Twin Cities Business Filings .....................................................................4
Twin Cities Labor Market Conditions ....................................................11
Twin Cities Bankruptcies .......................................................................16
Economic Indicators .............................................................................17
Sources ................................................................................................. 19
Executive Summary
Twin Cities business conditions are expected to remain solid over the next several months according to a variety of economic indicators. Despite a small decline in the Twin Cities Index of Leading Economic Indicators (LEI) in the third quarter, the LEI is well above its 2013 level. Improvements in single-family building permits and a decline in initial jobless claims have had a positive impact on this quarter’s LEI, while recent weakness in both new business formation and in a general measure of statewide business conditions has had a negative influence on the index. The Twin Cities LEI fell by 0.92 points in the third quarter but remains 6.1 percent higher than it was last year.
There were 9,223 new business filings with the Office of the Minnesota Secretary of State in the seven-county metro area in the third quarter of 2014—representing a 2.0 percent decline from one year ago. There were 1,394 new regional business incorporations in the third quarter, a 1.3 percent decrease over year ago levels. Over the past 12 months, new LLC filings in the seven-county metro area declined by 0.9 percent—falling to 5,517 in the third quarter of 2014. New assumed names totaled 1,938 in this year’s third quarter—a reduction of 4.2 percent from the third quarter of 2013. There were 374 new filings for non-profits in the Twin Cities in the third quarter of 2014, or 7.9 percent fewer filings than one year earlier.
Twin Cities employment increased by 1.8 percent over the year ending September 2014. The regional unemployment rate was 3.6 percent in September, an improvement on its 4.6 percent reading one year ago. Initial claims for unemployment insurance were well below year ago levels, falling by 24.5 percent to 7,212 in October. Job vacancies have increased in the Twin Cities. There are now 68.74 vacancies for every 100 unemployed in the seven-county metro. The labor force continues to expand in the Minneapolis-St. Paul area. Over the past year, the Twin Cities labor force increased by 12,461 to a total of 1,640,788 (which represents approximately 55 percent of the state’s work force).

2
Twin Cities Leading Economic Indicators Index
SCSU Twin Cities Index of Leading Economic Indicators (December 1999 = 100)
Components of SCSU Twin Cities Leading Economic Indicators IndexComponent of Index Contribution to LEI, 3rd quarter 2014 Contribution to LEI, 2nd quarter 2014
Minnesota Business Conditions Index -1.69 1.78Twin Cities initial claims for unemployment insurance 0.22 2.77
Twin Cities new filings of incorporation and LLCs -0.18 0.93
Mpls.-St. Paul MSA residential building permits 0.67 -0.29
Philadelphia Fed Minnesota leading indicators 0.06 0.19
TOTAL CHANGE -0.92 5.38
The SCSU Twin Cities Leading Economic Indicators (LEI) Index is designed to predict performance of the regional economy with a four-to-six month lead time. After rising in each of the first two quarters of this year, the LEI pulled back slightly in the third quarter—dropping by 0.92 points The LEI is now 6.1 percent higher than one year ago, suggesting continued solid future growth in the Twin Cities metro.
Year
Inde
x

3
Leading Economic Indicators Index
The Twin Cities LEI contains five factors—two reflecting state business conditions and three for local conditions. The Federal Reserve Bank of Philadelphia (which creates a leading economic indicator series for each of the 50 states) reported some volatility in Minnesota’s LEI during the first half of 2014, but was basically neutral this quarter. On the other hand, the Minnesota Business Conditions Index (constructed by Creighton University), another general indicator of statewide economic conditions, had a negative effect on this quarter’s LEI.
Two of the three local measures were positive in this year’s third quarter. Lower initial jobless claims and increased residential building permits had a favorable influence on the LEI in the third quarter. A recent decline in new Twin Cities’ filings for incorporation and LLC was a small drag on the leading index.
2014 2013 Percentage change
Minnesota Business Conditions IndexSeptember 66.3 57.0 16.3%
Twin Cities initial claims for unemployment insuranceSeptember 6,975 7,576 -7.9%
Twin Cities new filings of incorporation and LLCsThird Quarter 6,911 6,981 -1.0%
Twin Cities MSA single-family building permits, September 655 662 -1.1%
Index of Leading Economic IndicatorsPhiladelphia Federal Reserve, September 2.32 1.56 48.7%
Twin Cities Leading Economic Indicators IndexSeptember (December 1999 = 100) 91.6 86.3 6.1%
SCSU Twin CitiesLeading Economic Indicators Index

4
Twin Cities Business Filings
Total New Business Filings—Twin Cities Planning Area (12-month moving total)
Quarter III:2013
IV:2013
I:2014
II:2014
III:2014
2014 Quarter III: Percent change from prior year
Twin Cities TotalNew Business Filings 9,411 9,080 10,406 10,137 9,223 -2.0%
Total new business filings grew rapidly from 2000 to 2005, after which they declined for three years. The abrupt increase in new filings in mid-2008 is largely a result of increased new LLC filings. This outlier (resembling a shark fin in the graph below) is related to considerably higher filings in the construction industry due to legal and regulatory issues, and appears to be a one-time only transitory event seen in the data in all regions of Minnesota. Total business filings have generally trended upward since the second half of 2011. However, total business filings in the third quarter of 2014 declined by 2.0 percent from one year earlier.
Note: The graphs in this section show the 12-month moving total for the various new business filings in the Twin Cities registered with the Office of the Minnesota Secretary of State, thereby removing seasonal patterns in the data.
Year
Filin
gs

5
Business Filings
New business incorporations trended downward in the Twin Cities from 2004 to 2011, and have been relatively flat since that time. Filings for new business incorporations decreased 1.3 percent from one year earlier in the third quarter of 2014.
New Incorporations—Twin Cities Planning Area (12-month moving total)
Quarter III:2013
IV:2013
I:2014
II:2014
III:2014
2014 Quarter III: Percent change from prior year
Twin Cities New Business Incorporations 1,413 1,414 1,594 1,449 1,394 -1.3%
Year
Filin
gs

6
Business Filings
New Limited Liability Companies—Twin Cities Planning Area (12-month moving total)
Quarter III:2013
IV:2013
I:2014
II:2014
III:2014
2014 Quarter III: Percent change from prior year
Twin Cities New Limited Liability Companies 5,568 5,372 6,106 6,146 5,517 -0.9%
There has been a move in the Twin Cities (and the rest of the state) away from the traditional incorporation form of business organization toward LLCs. While new business incorporations remain an important indicator of new business formation in the Twin Cities, LLCs are increasingly useful in evaluating regional economic performance. As seen below, there is a considerable upward trend in LLCs in the Twin Cities which moderated in recent months. With the exception of the outlier period in 2008–2009, new LLC formation has shown a fairly steady rate of growth since 2000. New LLC filings, at a level of 5,517 in the third quarter of 2014, were 0.9 percent lower than one year earlier.
Year
Filin
gs

7
Business Filings
Assumed names, which include sole proprietors or organizations that do not have limited liability, continued their slide by falling 4.2 percent in the third quarter relative to the same period in 2013. This series has not recovered from its peak levels of 2006-2007.
New Assumed Names—Twin Cities Planning Area (12-month moving total)
Quarter III:2013
IV:2013
I:2014
II:2014
III:2014
2014 Quarter III: Percent change from prior year
Twin CitiesNew Assumed Names 2,024 1,919 2,270 2,145 1,938 -4.2%
Year
Filin
gs
8
Business Filings
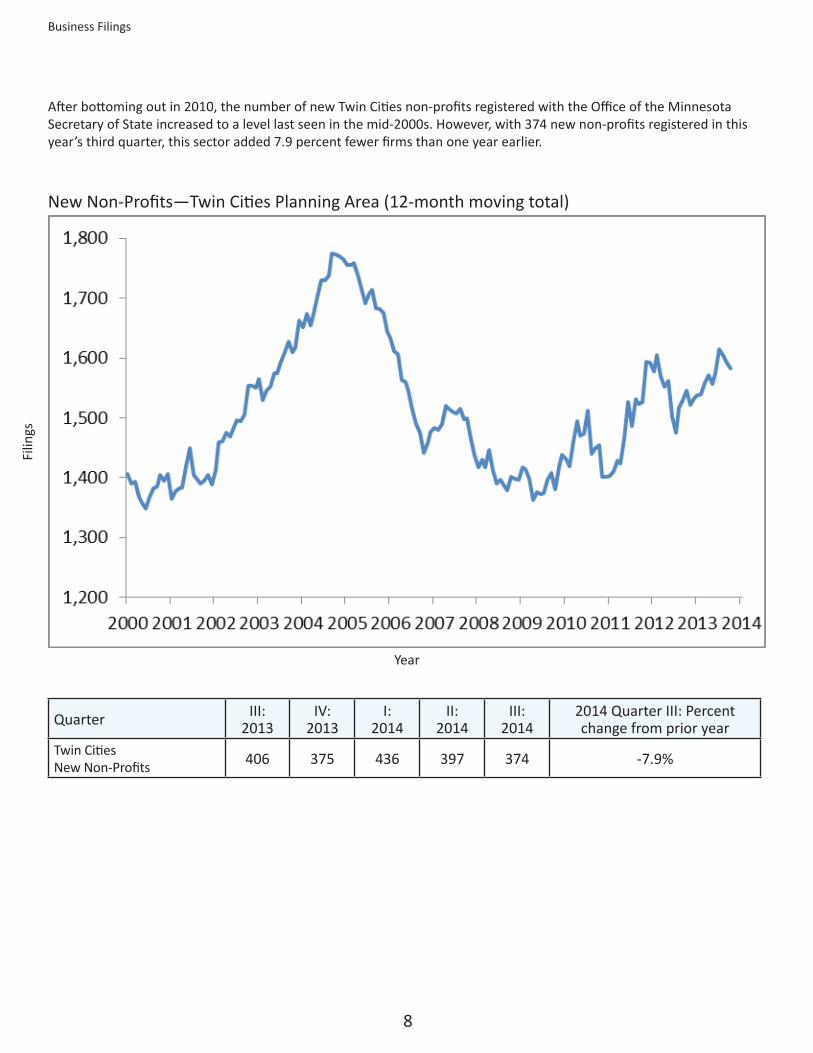
After bottoming out in 2010, the number of new Twin Cities non-profits registered with the Office of the Minnesota Secretary of State increased to a level last seen in the mid-2000s. However, with 374 new non-profits registered in this year’s third quarter, this sector added 7.9 percent fewer firms than one year earlier.
New Non-Profits—Twin Cities Planning Area (12-month moving total)
Quarter III:2013
IV:2013
I:2014
II:2014
III:2014
2014 Quarter III: Percent change from prior year
Twin CitiesNew Non-Profits 406 375 436 397 374 -7.9%
Year
Filin
gs

9
Business Filings
The two maps below attempt to highlight new business formation in the Twin Cities planning area in two periods: 2000–2004 (quarter 3) and 2010–2014 (quarter 3). This area consists of seven counties—Hennepin, Dakota, Carver, Ramsey, Washington, Anoka and Scott. Each dot in the map represents a newly formed business in the relevant time period. While the composition of the dots has certainly changed (for example, there are now more LLCs and fewer business incorporations), little seems to have changed in the general pattern of business formation in the Twin Cities planning area since the beginning of the 21st century. Most newly formed businesses are in the downtown areas of Minneapolis and St. Paul and other clusters of business filings tend to follow key roadways.
New Business Formation Between 2000 and 2004:III—Twin Cities Planning Area

10
Business Filings
New Business Formation Between 2010 and 2014:III—Twin Cities Planning Area

11
Labor Market Conditions
Twin Cities Labor Market Conditions
Employment of Twin Cities’ residents grew 1.8 percent over the past year. After relative stagnation through 2007 and a decline during the Great Recession, the area has experienced steady employment growth since the start of 2010.
Note: Seasonally adjusted labor market data are typically not available to evaluate regional economic performance. While there are seasonally adjusted labor market data for the Twin Cities metro area, these data include parts of Wisconsin. These seasonally adjusted data therefore do not accurately capture the Twin Cities planning area which is confined to seven counties. Some graphs of labor market indicators found in this section of the report are adjusted so as to remove seasonal patterns from the data. Tabular data are not seasonally adjusted. To request access to seasonally adjusted series, contact the SCSU School of Public Affairs Research Institute, [email protected].
Employment—Twin Cities Planning Area (12-month moving average)
Month September2013
April2014
May 2014
June2014
July2014
August2014
September2014
Employment (Not seasonally
adjusted)1,553,091 1,566,203 1,574,918 1,583,267 1,588,731 1,585,393 1,581,136
Year
Empl
oym
ent

12
Labor Market Conditions
The seasonally adjusted unemployment rate in the Twin Cities has declined continuously since the end of the Great Recession in 2009. The non-seasonally adjusted unemployment rate now stands at 3.6 percent, substantially lower than the 4.6 percent rate recorded one year ago.
Unemployment Rate, seasonally adjusted—Twin Cities Planning Area
Month September2013
April2014
May 2014
June2014
July2014
August2014
September2014
Unemployment Rate(Not seasonally adjusted) 4.6% 4.0% 4.0% 4.5% 4.3% 3.8% 3.6%
Year
Une
mpl
oym
ent R
ate

13
Labor Market Conditions
New claims for unemployment insurance were considerably lower than year ago levels in October 2014. The graph of the seasonally adjusted series suggests claims are now at levels last seen in 2005.
Total Initial Claims for Unemployment Insurance, seasonally adjusted—Twin Cities Planning Area
Period October2013
May 2014
June2014
July 2014
August 2014
September 2014
October 2014
Initial claims(Not seasonally adjusted) 9,547 7,799 8,107 7,838 6,277 6,975 7,212
Year
Clai
ms

14
Labor Market Conditions
The number of job vacancies is expanding throughout the state as worker shortages grow. In the Twin Cities planning area, the rate of job vacancies per 100 unemployed was 68.74 in the second quarter of 2014 (the most recently available data). This is the highest reading for this series in several years.
Job Vacancies per 100 Unemployed—Twin Cities Planning Area
Quarter 2011:IV 2012:II 2012:IV 2013:II 2013:IV 2014:II Job Vacancies per100 Unemployed 34.11 39.95 43.5 54.11 48.62 68.74
Year
Vaca
ncie
s

15
Labor Market Conditions
The size of the Twin Cities labor force continues to rise. Over the last 12 months, the labor force in the Twin Cities metropolitan area expanded by 0.8 percent to 1,640,788.
Labor Force—Twin Cities Planning Area (12-month moving average)
Year (September) 2009 2010 2011 2012 2013 2014Labor Force
(Not seasonally adjusted) 1,600,018 1,602,630 1,621,948 1,615,266 1,628,327 1,640,788
Year
Labo
r For
ce

16
Bankruptcies
This quarter’s report includes a measure of bankruptcies in the Twin Cities planning area. The 12-month moving total shown below illustrates the annual number of bankruptcies in the Twin Cities since 2004. After trending upward since 2007, the annual number of Twin Cities bankruptcies has steadily declined since mid-2010. The region is steadily returning to the level of bankruptcies that was last seen before the Great Recession. The precipitous drop in bankruptcies in late 2005 resulted from a law change (the Bankruptcy Abuse Prevention and Consumer Protection Act) that made it more difficult for households to declare bankruptcy. This pattern of bankruptcy filings is seen in each of Minnesota’a six planning areas.
Year (Second Quarter) 2009 2010 2011 2012 2013 2014Annual Bankruptcies(Not seasonally adjusted) 11,000 13,274 12,542 11,007 9,433 8,282
Total Annual Bankruptcies—Twin Cities Planning Area (12 month moving total)
Tota
l Ann
ual B
ankr
uptc
ies
Quarter
Twin Cities Bankruptcies

17
Economic Indicators
Twin Cities MSA Indicators
Period Covered Current Period Prior Year Annual Percent
ChangeLong Term Average
(since 1999 unless noted)
Employment September 2014 (m) 1,842,995 1,812,318 1.7% ↑ 0.5%Manufacturing Employment September 2014 (m) 191,068 182,912 4.5% ↑ -1.4%Average Weekly Work Hours Private Sector September 2014 (m) 34.4 34.9 -1.4% ↓ 33.9 (since 2008)
Average Earnings Per Hour Private Sector September 2014 (m) $26.64 $27.00 -1.3% ↓ 1.0% (since 2008)
Average Weekly Work Hours Manufacturing(Production Workers)
September 2014 (m) 42.6 40.9 4.2% ↑ 40.9 (since 2001)
Average Earnings Per Hour Manufacturing (Production Workers)
September 2014 (m) $20.80 $20.60 1.0% ↑ 1.9% (since 2001)
Unemployment Rate September 2014 (m) 3.6% 4.6% NA ↓ 4.6%
Labor Force September 2014 (m) 1,880,743 1,865,760 0.8% ↑ 0.5%MSP Residential Building Permit Valuation September 2014 (m) 307,270 275,121 11.7% ↑ 252,367
Minneapolis Cost-of-Living Index 1st Quarter 2014 107.6 108.8 -1.1% ↓ NASt. Paul Cost-of-Living Index 1st Quarter 2014 108.5 108.4 0.1% ↑ NA
The Minneapolis-St. Paul Metropolitan Statistical Area (an MSA is a grouping of counties and municipalities identified by the Census as having economic and demographic forces in common) includes 11 Minnesota counties: Anoka, Carver, Chisago, Dakota, Hennepin, Isanti, Ramsey, Scott, Sherburne, Washington and Wright. This MSA also includes the Wisconsin counties of Pierce and St. Croix. It is thus much larger than the seven-county Twin Cities planning area.
Still, activity outside of the area influences economic behavior within it, and vice versa. The larger Minneapolis-St. Paul MSA experienced favorable labor market conditions in the last 12 months. Overall employment increased 1.7 percent in the Twin Cities MSA and manufacturing employment surged by 4.5 percent over the same period. Both private sector average weekly hours and average hourly earnings declined. In the manufacturing sector, however, both average work hours and hourly earnings rose. The cost-of-living measure for Minneapolis declined in the second quarter while the cost-of-living in St. Paul was little changed compared to the same period in 2013. The Twin Cities MSA is approximately 8 percent more expensive to live in than in the average large city in the United States. The value of residential building permits increased by 11.7 percent relative to the same period one year ago.
(m) represents a monthly series
18
Economic Indicators
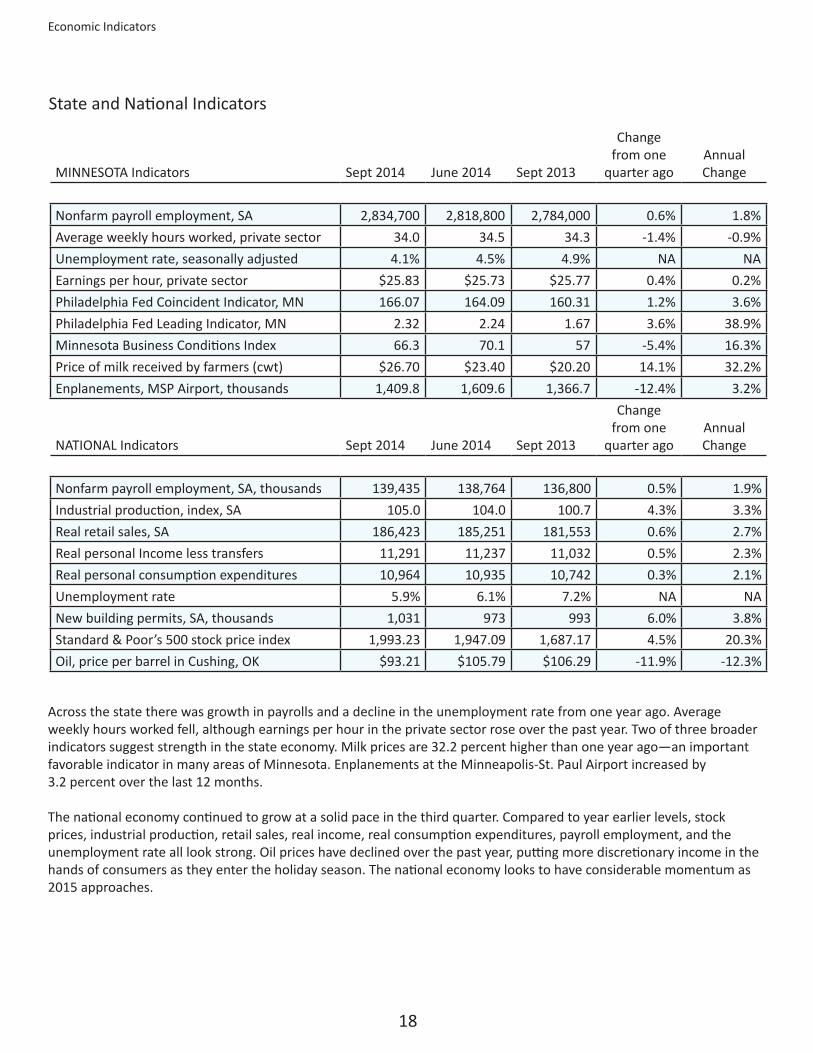
State and National Indicators
Across the state there was growth in payrolls and a decline in the unemployment rate from one year ago. Average weekly hours worked fell, although earnings per hour in the private sector rose over the past year. Two of three broader indicators suggest strength in the state economy. Milk prices are 32.2 percent higher than one year ago—an important favorable indicator in many areas of Minnesota. Enplanements at the Minneapolis-St. Paul Airport increased by 3.2 percent over the last 12 months.
The national economy continued to grow at a solid pace in the third quarter. Compared to year earlier levels, stock prices, industrial production, retail sales, real income, real consumption expenditures, payroll employment, and the unemployment rate all look strong. Oil prices have declined over the past year, putting more discretionary income in the hands of consumers as they enter the holiday season. The national economy looks to have considerable momentum as 2015 approaches.
MINNESOTA Indicators Sept 2014 June 2014 Sept 2013
Change from one
quarter agoAnnual Change
Nonfarm payroll employment, SA 2,834,700 2,818,800 2,784,000 0.6% 1.8%Average weekly hours worked, private sector 34.0 34.5 34.3 -1.4% -0.9%Unemployment rate, seasonally adjusted 4.1% 4.5% 4.9% NA NAEarnings per hour, private sector $25.83 $25.73 $25.77 0.4% 0.2%Philadelphia Fed Coincident Indicator, MN 166.07 164.09 160.31 1.2% 3.6%Philadelphia Fed Leading Indicator, MN 2.32 2.24 1.67 3.6% 38.9%Minnesota Business Conditions Index 66.3 70.1 57 -5.4% 16.3%Price of milk received by farmers (cwt) $26.70 $23.40 $20.20 14.1% 32.2%Enplanements, MSP Airport, thousands 1,409.8 1,609.6 1,366.7 -12.4% 3.2%
NATIONAL Indicators Sept 2014 June 2014 Sept 2013
Change from one
quarter agoAnnual Change
Nonfarm payroll employment, SA, thousands 139,435 138,764 136,800 0.5% 1.9%Industrial production, index, SA 105.0 104.0 100.7 4.3% 3.3%Real retail sales, SA 186,423 185,251 181,553 0.6% 2.7%Real personal Income less transfers 11,291 11,237 11,032 0.5% 2.3%Real personal consumption expenditures 10,964 10,935 10,742 0.3% 2.1%Unemployment rate 5.9% 6.1% 7.2% NA NANew building permits, SA, thousands 1,031 973 993 6.0% 3.8%Standard & Poor’s 500 stock price index 1,993.23 1,947.09 1,687.17 4.5% 20.3%Oil, price per barrel in Cushing, OK $93.21 $105.79 $106.29 -11.9% -12.3%

19
Economic Indicators
The Twin Cities Quarterly Economic and Business Conditions Report is a collaboration between the Office of the Minnesota Secretary of State and the School of Public Affairs Research Institute (SOPARI) of St. Cloud State University. All calculations and text are the result of work by SOPARI, which is solely responsible for errors and omissions herein.
This issue is part of a series for the six planning areas of Minnesota: Central, Northeast, Northwest, Southeast, Southwest, and Twin Cities. The Twin Cities Planning Area consists of seven counties: Anoka, Carver, Dakota, Hennepin, Ramsey, Scott and Washington.
Text authored by Professors King Banaian and Rich MacDonald of the Economics Department of St. Cloud State University. Research assistance provided by Katie Kotschevar. Yasemin Yucedag and Joe Kucan assisted with bankruptcy data. Professor David Wall of the SCSU Geography Department provided GIS assistance.
Sources
Council for Community and Economic Research: Cost-of-Living Index.
Creighton University Heider College of Business: Minnesota Business Conditions Index, Rural MainStreet Index.
Federal Reserve Bank of Philadelphia: Minnesota Coincident Indicator Index, Minnesota Leading Indicators Index.
Federal Reserve Board of Governors: Industrial Production.
Institute for Supply Management: Manufacturing Business Survey, Purchasing Managers Index.
Metropolitan Airports Commission: MSP Enplanements.
Minnesota Department of Employment and Economic Development (and U.S. Department of Labor Bureau of Labor Statistics):
Average Hourly Earnings, Average Weekly Work Hours, Employment, Initial Claims for Unemployment Insurance, Job Vacancies, Labor
Force, Manufacturing Employment, Unemployment Rate.
Office of the Minnesota Secretary of State: Assumed Names, Business Incorporations, Limited Liability Companies, Non-Profits.
Standard & Poor’s: Standard & Poor’s 500 Stock Price Index.
Thomson Reuters and University of Michigan: Index of Consumer Sentiment.
U.S. Bankruptcy Courts: Total Annual Bankruptcies
U.S. Census Bureau: Durable Goods Orders, Housing Permits, Residential Building Permits, Retail Sales.
U.S. Department of Agriculture: Milk Prices.
U.S. Department of Commerce Bureau of Economic Analysis: Real Personal Consumption, Real Personal Income, Real Wages and
Salaries.
U.S. Energy Information Administration: Oil Prices.


