20
Twitter Community Discovery & Analysis Using Topologies Andrew McClain Karen Aguar
| Date post: | 02-Jan-2016 |
| Category: |
Documents |
| Upload: | indira-lancaster |
| View: | 17 times |
| Download: | 1 times |
Twitter Community Discovery &
Analysis Using Topologies
Andrew McClainKaren Aguar

Outline• Introduction• Motivation• Project Description • Community Discovery
o Data Collection
• Analysis & Application• Results

Introduction• Many people use services like twitter to stay in
contact with groups in which they are members or to interact with other people with similar interests
• These groups are considered “communities”

Community?• A network or group of nodes with greater ties
internally than to the rest of the network
• There are various derivations of a community:o Some communities are tightly bound together o Others are loose associations of people

Motivation• To classify these communities & find real world
implications of their digital associations
• Project Description:Discovering communities & examining the properties of the graph to give us insight into
the community itself.
• Ex: Find the organizers of a hobby group by the twitter activity

Our ProjectOur project is composed of 2 main sections
1. Twitter community discovery
2. Analysis of the community graphs & its correlation to the real world community structure
Community Discovery
1. Collected data from a diverse number of individuals from known real-world communities
2. Generated graphs of the communities3. Partitioned graphs based on in/out degrees to
isolate the community
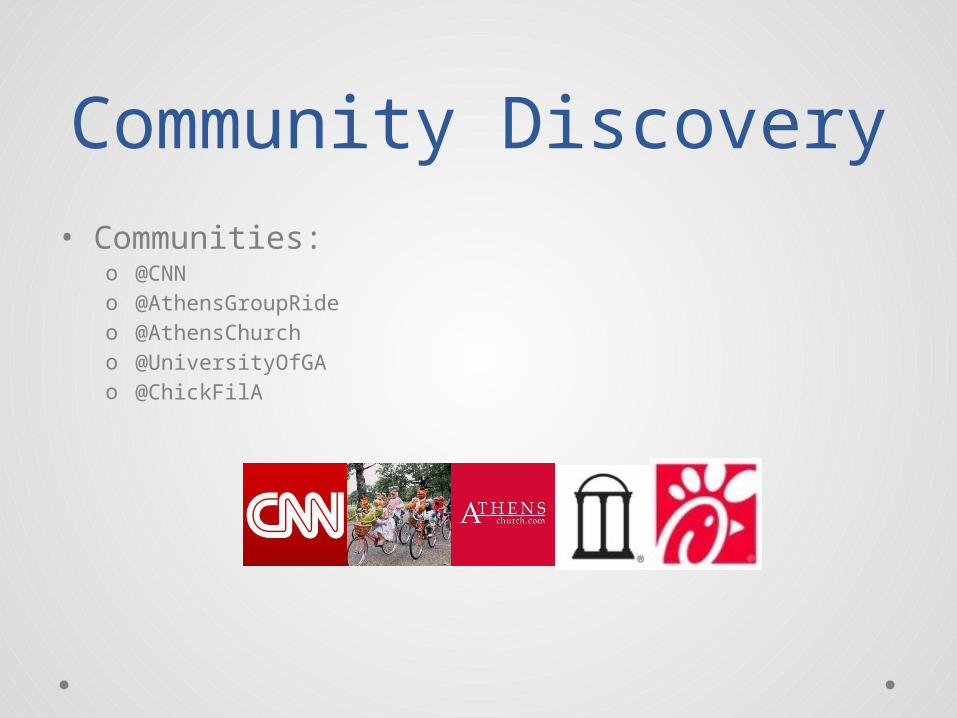
Community Discovery• Communities:
o @CNNo @AthensGroupRideo @AthensChurcho @UniversityOfGAo @ChickFilA

Data Collection
• Relationships Modeled:o Followed By/ Followingo Replies too Mentions
• Parameterso 1.5 Levelso Limit # of people included in network
• Most limited ~ 300
Analysis & Application
1. Manually reconstructed the hierarchy of the real-world known communities
2. Use Gephi to detect behavior patterns and structures in twitter communities1. Shape, interconnectivity, how the information flows through it
3. Analyzed the relationships in the graphs against known community structures

Analysis via Gephi
• Gephi -- open source graph visualization platform
• We used Gephi to isolate the community from the noisy background

Analysis via Gephi
• After isolating the communities, labels were sized based on in-degreeo The assumption is that the people
who are listened to are followed most in the community
• The spline on the right shows the scale of the labelso At this time, the analysis of
importance is done visually

ResultsWhat we found:• An interesting dichotomy between primarily
online & primarily offline communities• “Celebrity” Noise Effect
o Once a celebrity is introduced to a community, everyone follows them and they become a center individual in the community structure
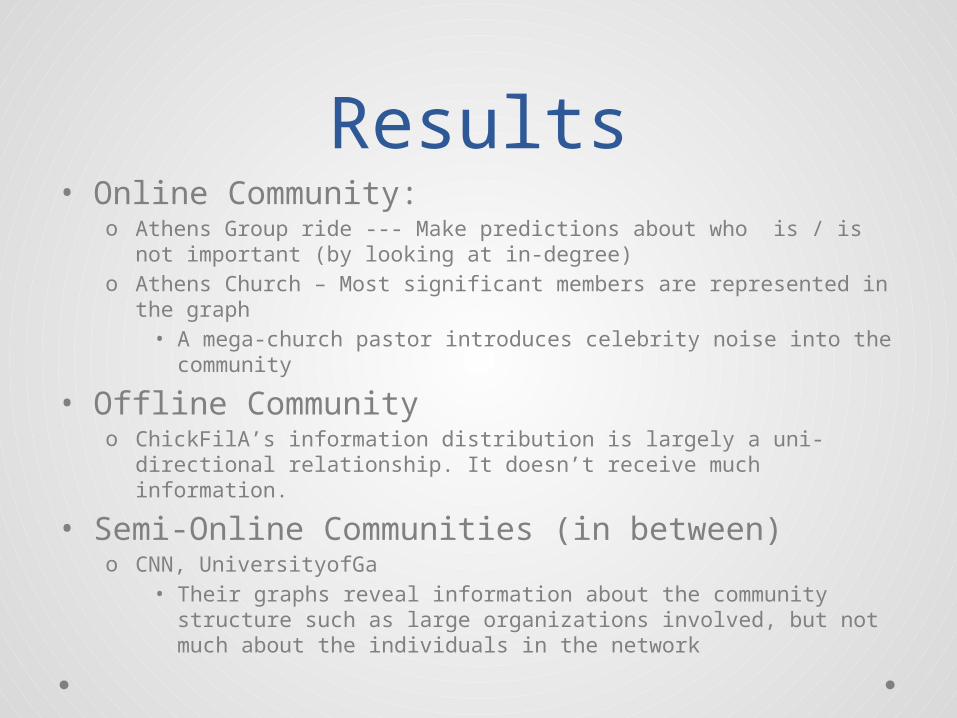
Results• Online Community:
o Athens Group ride --- Make predictions about who is / is not important (by looking at in-degree)
o Athens Church – Most significant members are represented in the graph• A mega-church pastor introduces celebrity noise into the
community
• Offline Communityo ChickFilA’s information distribution is largely a uni-directional
relationship. It doesn’t receive much information.
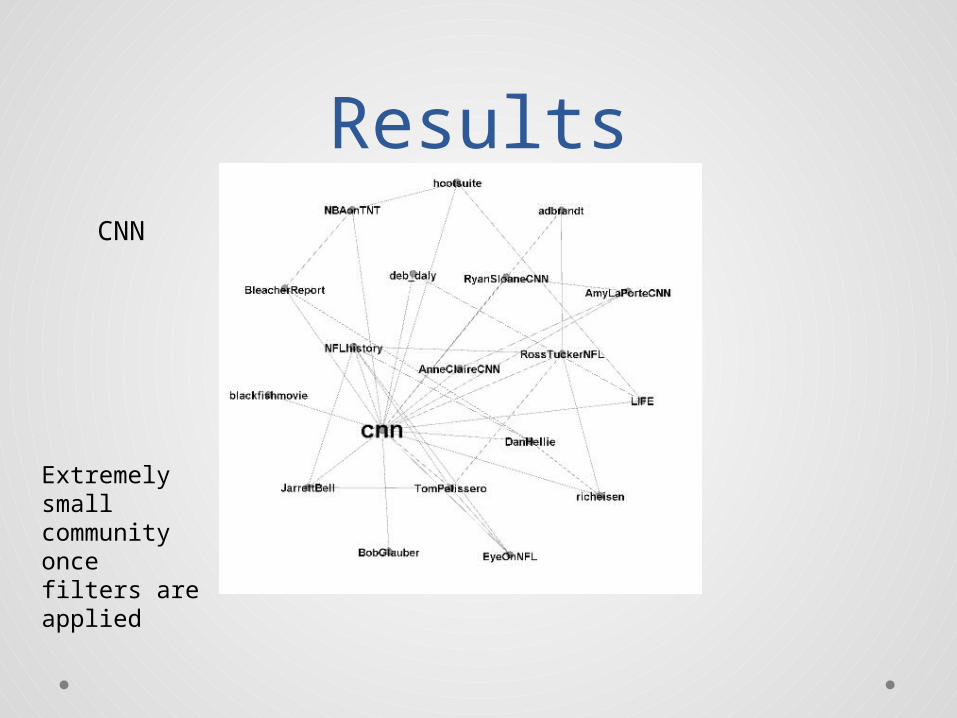
• Semi-Online Communities (in between)o CNN, UniversityofGa
• Their graphs reveal information about the community structure such as large organizations involved, but not much about the individuals in the network
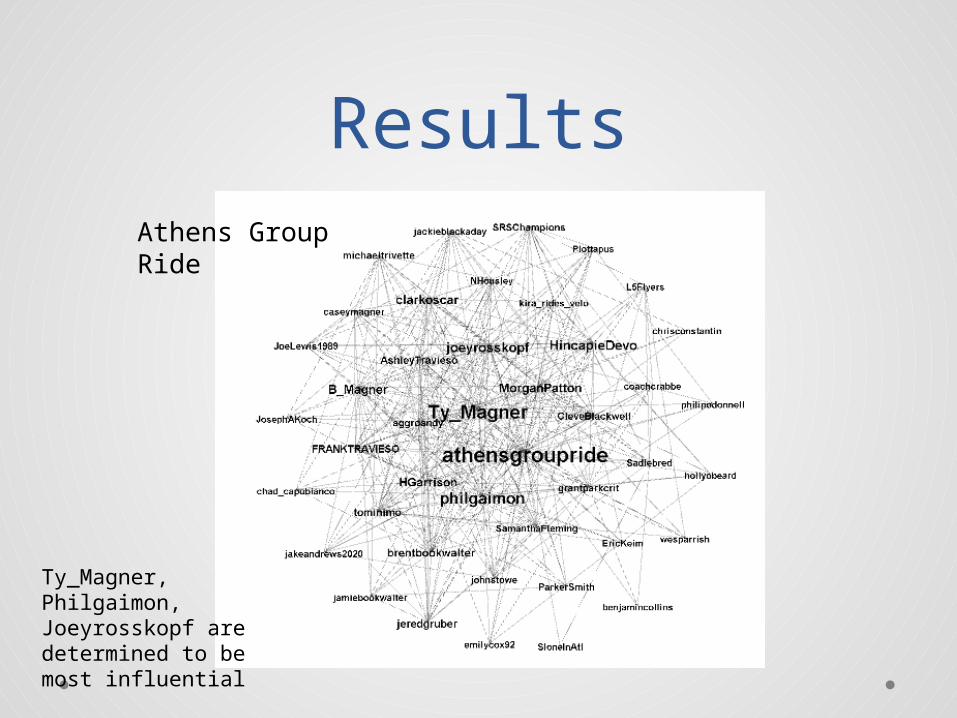
ResultsAthens Group Ride
Ty_Magner, Philgaimon, Joeyrosskopf are determined to be most influential
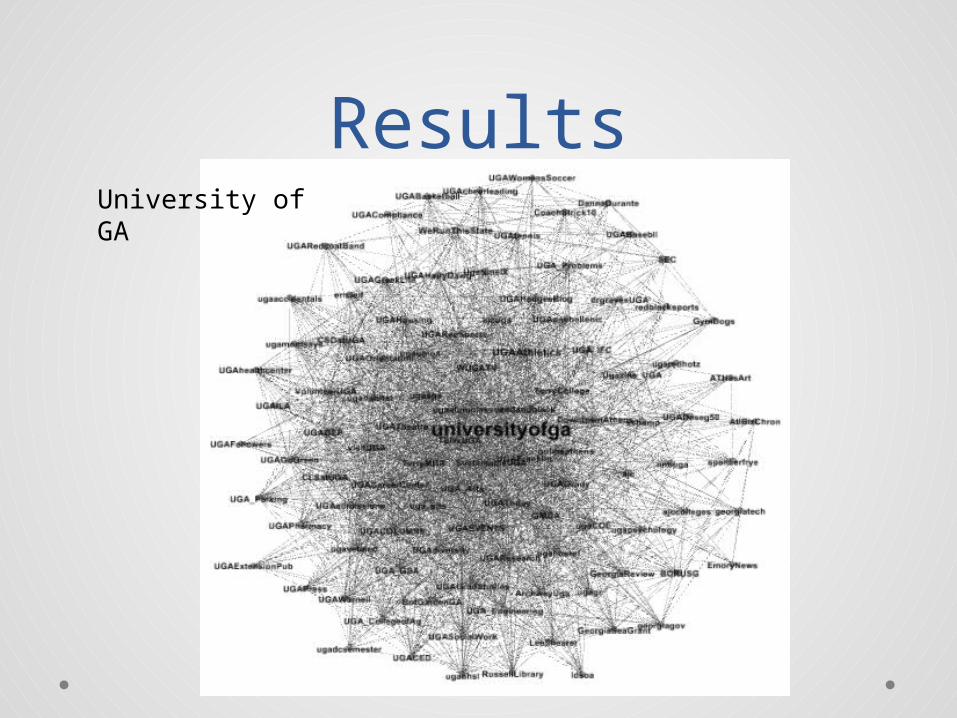
ResultsUniversity of GA

Results
Andy Stanley -celebrity effect
Athens Church

Results
Offline Community
Chick-Fil-A
Results
Extremely small community once filters are applied
CNN

Thank You!
• Questions?
References:Community Discovery in Social Networks: Applications, Methods and Emerging Trends
S. Parthasarathy, Y. Ruan, V. Satuluri [2011]
gephi.comnodexl.codeplex.comtwitter.com


