Twitter Sentiment Analysis: Predicting TV Show Renewal Introduction to Data Science: DSGA1001 Final Project: Fall 2015 Nora Barry (neb330) Laura Buchanan (lcb402) Alex Simonoff (ams889) Lizhen Tan (lt911)
Transcript
Twitter Sentiment Analysis:
Predicting TV Show Renewal
Introduction to Data Science: DSGA1001 Final Project: Fall 2015
Nora Barry (neb330) Laura Buchanan (lcb402) Alex Simonoff (ams889)
Lizhen Tan (lt911)
Introduction
Table of Contents
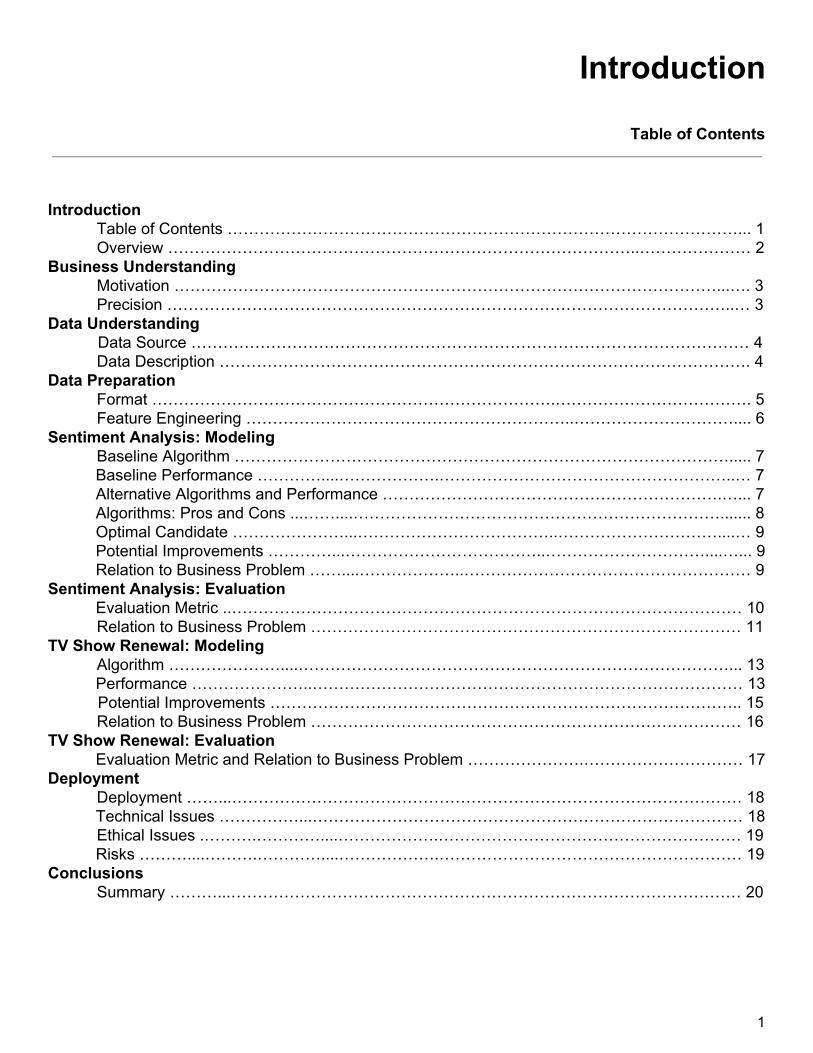
Introduction
Table of Contents ……………………………………………………………………………………... 1 Overview ……………………………………………………………………………..………………… 2
Business Understanding Motivation …………………………………………………………………………………………...…. 3 Precision ……………………………………………………………………………………………..… 3
Data Understanding Data Source …………………………………………………………………………………………… 4 Data Description ………………………………………………………………………………………. 4
Data Preparation Format ………………………………………………………………….………………………………. 5 Feature Engineering ……………………………………………………..………………………….... 6
Sentiment Analysis: Modeling Baseline Algorithm …………………………………………………………………………………..... 7 Baseline Performance …………....……………….………………………………………………..… 7 Alternative Algorithms and Performance ……………………………………………………….…... 7 Algorithms: Pros and Cons ...……....……………………………………………………………....... 8 Optimal Candidate …………………...………………………………..…………………………....… 9 Potential Improvements …………...………………………………..…………………………....…... 9 Relation to Business Problem ……....………………..……………………………………………… 9
Sentiment Analysis: Evaluation Evaluation Metric ..…………………………………………………………………………………… 10 Relation to Business Problem ……………………………………………………………………… 11
TV Show Renewal: Modeling Algorithm …………………....………………………………………………………………………... 13 Performance …………………..……………………………………………………………………… 13 Potential Improvements …………………………………………………………………………….. 15 Relation to Business Problem ……………………………………………………………………… 16
TV Show Renewal: Evaluation Evaluation Metric and Relation to Business Problem ………………….………………………… 17
In this project, we take a dataset of 1.6 million tweets published between April 17th, 2009 and
May 27th, 2009. In a previous analysis, each of these tweets have been given a polarity score corresponding to that tweet’s sentiment. In our project, we train several models to try to predict that sentiment through the tweet’s text content. After finding an optimal candidate model, the tweets mentioning television shows of interest are gathered. The results of the sentiment analysis on these TV show tweets are then fed through a new model. This model attempts to determine if positive twitter sentiment can predict whether or not a television show is renewed the following season.
2
Business Understanding
Motivation
Television shows can be expensive to produce. While reality shows may cost as little as
$100,000 per episode, each episode of a scripted show can cost a minimum of $2 million. Many 1
shows in North America are ordered for runs of 20 26 episodes per season, bringing a low estimate 2
for the cost of a season of a drama or comedy to $40 million each year. Every year hundreds of new scripted shows are created across network, cable, and online
television stations. Less than half of new (network) shows continue on to a second season. 3 4
Presumably, shows that are renewed can streamline costs as they they enter multiple seasons, as sets and costumes are reused, casting and hiring slows down, and relationships with loyal advertisers are solidified. Conversely, when shows aren’t bringing in enough revenue, they are cancelled to avoid further loss for the network. Knowing how many shows will be cancelled could help the network determine how many pilots should be picked up for the next year. Further, knowing the ratio of renewed to cancelled shows would help forecast budget constraints for the upcoming television season.
A major factor determining whether a show is renewed is the show’s viewership. Advertisers 5
typically look at this number as an estimate for how many people are viewing their commercials that air during TV breaks. As television shows are primarily funded through these advertisements, the longevity of a show depends less on critical reception of the show, and more on the shows ability to get people to watch the show on a weekly basis. Notably, with fast forwarding available when shows are recorded with DVR, and ad blockers skipping commercials during TV shows viewed on the web, advertisers are most interested in viewership that takes place during each episode’s broadcast on TV.
Our suspicion is that when people are enthusiastic enough to watch a show’s weekly TV broadcast, this sentiment will be reflected in posts on social media. We will investigate whether TV show renewal can be predicted by tweet sentiment. After performing sentiment analysis on a dataset of Twitter tweets, we will look at tweet frequency and sentiment for a given show in our predictive model. With this information, a TV network might begin preparing for the renewal or cancellation of a show earlier in the current TV season, or experiment with social engineering techniques to increase engagement with potential viewers via social media.
Precision
Ultimately, TV cancellations are business decisions made by the heads of television networks.
While they certainly look at viewership, and are likely concerned with opinions being expressed about their shows on social media, the final judgement will often be an intuitive decision, driven largely by the concerns of the advertisement agencies involved. Therefore, predicting TV show viewership with tweet sentiment will not be the definitive determining factor for the fate of a TV show. Rather, our data mining of tweets will offer the TV network directors additional information, allowing them to investigate trends that eventually lead to renewal or cancellation.
The dataset of Twitter tweets we use for our sentiment analysis model were obtained from
Sentiment140. Information about TV show renewal and viewership were collected from each show of 6
interest’s Wikipedia page.
Data Description
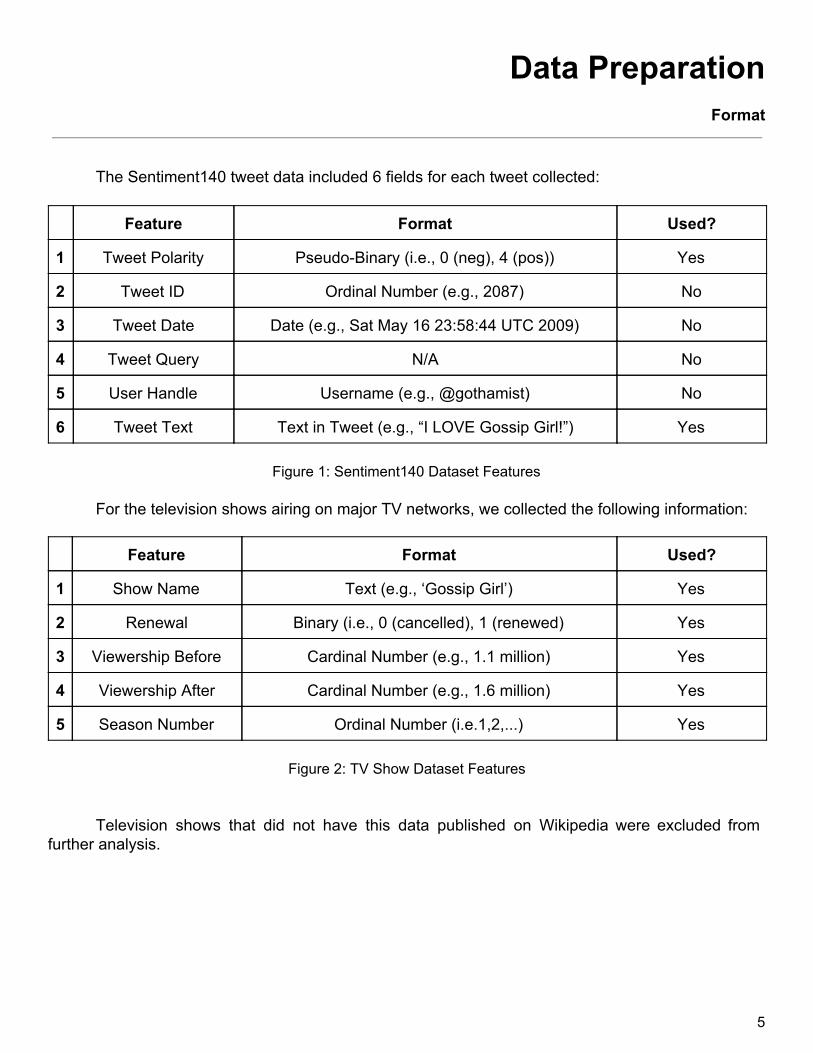
The Sentiment140 dataset is made up of 1.6 million englishlanguage tweets, all posted to
Twitter between April 17th, 2009 and May 27th, 2009. Each tweet is labeled with one of three polarity scores: 0 for negative, 4 for positive. These labels were produced using a combination of text analysis and sentiment of emoticons in the tweet on a larger dataset. Tweets with mismatched 7
emoticons (e.g., smiley face and sad face in same tweet) were removed, along with tweets with ambiguous sentiment. The published 1.6 million tweets were evenly distributed between positive and negative sentiment. It should be noted that the preprocessing and rejection criteria used by Sentiment140 leaves us with a very clean dataset, in that sentiment is far more explicit than one would expect in a random collection of tweets. We use this dataset to build our own sentiment model, using the sentiment labels from this previous study as our target.
For our TV show renewal prediction analysis, we looked at TV shows which had new episodes air between April 17th, 2009 and May 27th, 2009 on the major englishlanguage commercial networks in the United States (ABC, CBS, FOX, NBC, and The CW). Renewal, viewership, and season 8
number data were taken from Wikipedia for each of these ~175 TV shows. Viewership data is broken into two different fields: Viewership in 2009 (during the season occurring simultaneously with our twitter data) as well as viewership before 2009 (during the season directly before the season that our tweets are being logged). Not all shows had this information available, so only a subset of shows were used in our TV show renewal analysis.
3 Viewership Before Cardinal Number (e.g., 1.1 million) Yes
4 Viewership After Cardinal Number (e.g., 1.6 million) Yes
5 Season Number Ordinal Number (i.e.1,2,...) Yes
Figure 2: TV Show Dataset Features
Television shows that did not have this data published on Wikipedia were excluded from further analysis.
5
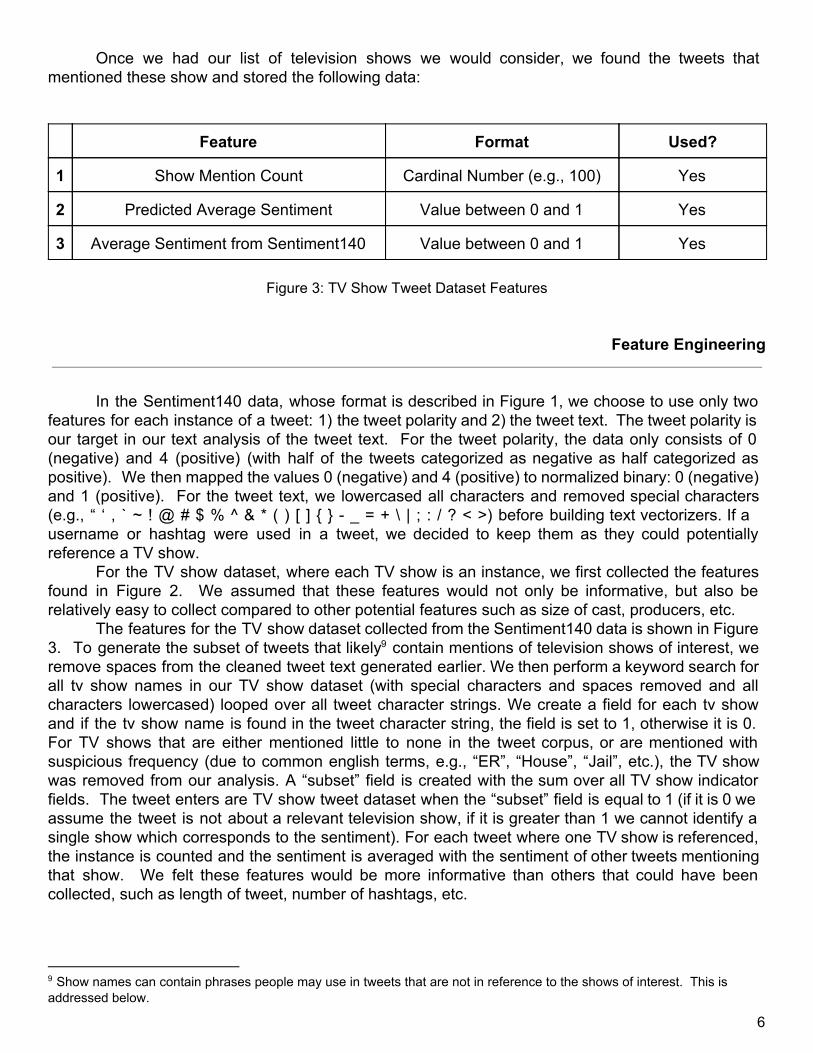
Once we had our list of television shows we would consider, we found the tweets that mentioned these show and stored the following data: Feature Format Used?
1 Show Mention Count Cardinal Number (e.g., 100) Yes
2 Predicted Average Sentiment Value between 0 and 1 Yes
3 Average Sentiment from Sentiment140 Value between 0 and 1 Yes
Figure 3: TV Show Tweet Dataset Features
Feature Engineering
In the Sentiment140 data, whose format is described in Figure 1, we choose to use only two features for each instance of a tweet: 1) the tweet polarity and 2) the tweet text. The tweet polarity is our target in our text analysis of the tweet text. For the tweet polarity, the data only consists of 0 (negative) and 4 (positive) (with half of the tweets categorized as negative as half categorized as positive). We then mapped the values 0 (negative) and 4 (positive) to normalized binary: 0 (negative) and 1 (positive). For the tweet text, we lowercased all characters and removed special characters (e.g., “ ‘ , ` ~ ! @ # $ % ^ & * ( ) [ ] _ = + \ | ; : / ? < >) before building text vectorizers. If a username or hashtag were used in a tweet, we decided to keep them as they could potentially reference a TV show.
For the TV show dataset, where each TV show is an instance, we first collected the features found in Figure 2. We assumed that these features would not only be informative, but also be relatively easy to collect compared to other potential features such as size of cast, producers, etc.
The features for the TV show dataset collected from the Sentiment140 data is shown in Figure 3. To generate the subset of tweets that likely contain mentions of television shows of interest, we 9
remove spaces from the cleaned tweet text generated earlier. We then perform a keyword search for all tv show names in our TV show dataset (with special characters and spaces removed and all characters lowercased) looped over all tweet character strings. We create a field for each tv show and if the tv show name is found in the tweet character string, the field is set to 1, otherwise it is 0. For TV shows that are either mentioned little to none in the tweet corpus, or are mentioned with suspicious frequency (due to common english terms, e.g., “ER”, “House”, “Jail”, etc.), the TV show was removed from our analysis. A “subset” field is created with the sum over all TV show indicator fields. The tweet enters are TV show tweet dataset when the “subset” field is equal to 1 (if it is 0 we assume the tweet is not about a relevant television show, if it is greater than 1 we cannot identify a single show which corresponds to the sentiment). For each tweet where one TV show is referenced, the instance is counted and the sentiment is averaged with the sentiment of other tweets mentioning that show. We felt these features would be more informative than others that could have been collected, such as length of tweet, number of hashtags, etc.
9 Show names can contain phrases people may use in tweets that are not in reference to the shows of interest. This is addressed below.
6
Sentiment Analysis: Modeling
Baseline Algorithm
To construct our baseline model for the sentiment analysis, we first randomly shuffled the
tweets and then split them into two groups: 80% were used at training data and 20% were used as test data. We decided to use logistic regression as our baseline model, as we wanted to build a model which could categorize a new tweet as having positive or negative sentiment. To maintain simplicity in our baseline model, we binary vectorized the tweets (as opposed to using TFIDF or word frequency(count)). The reason we chose this algorithm was because we anticipated Logistic Regression to be one of the simpler approaches and it would give us a quick but decently fit model which could give us an overall feel for our data.
Baseline Performance
Our baseline model (binary vectorized logistic regression) had a zerooneloss function of
0.209494 and an AUC of .867. Given that these results are better than random, we can conclude that our data and vectorization algorithm are reasonable and working as intended. While we were pleased with these results, we tested several different models and vectorization techniques in an attempt to improve on this baseline performance.
Alternative Algorithms and Performance
To determined if we could improve our model, we rebuilt our model using several different
methods. Since two algorithms were used in our baseline model, a vectorization algorithm and a model algorithm, comparisons were made when we changed either of these two algorithms. A simple binary vectorization, a word frequency (count) vectorization, and TFIDF vectorization (all using ngrams of 2) were tested for each model. The model algorithms we investigated were logistic regression, multinomial naive Bayes, and Bernoulli naive Bayes. Additionally, we tested an SVM model. Performance was measured using the zerooneloss function: 10
10 SVM details: word frequency vectorization, transformed with TFIDF transformer and trained with stochastic gradient descent classifier.
7
Figure 4: Alternative Model Performance.
Algorithms: Pros and Cons
Binary and word frequency (count) vectorizations are good when it comes to basic
tokenization, however they fail to penalize commonly used words or gain insight from important contextual words in the way TFIDF can. With TFIDF vectorization, we differentiate the importance of various words via weights before coefficients are assigned to the vectors so we may gain additional insight than we can using other algorithms.
The various model algorithms we tried (Logistic Regression, Naive Bayes, and SVM) each have their strengths and weaknesses. Logistic Regression is a traditional linear classification model which has an intuitive interpretation of betas as all our features are on the same scale. In our example, given our very large dataset, a logistic regression takes some time to run but not nearly as long as SVM. Naive Bayes (both Multinomial and Bernoulli) is a classification algorithm which is typically advantageous when you are working with smaller datasets. Naive Bayes models are known as such as they make the assumption that the feature probabilities are independent given the class 11
(in this situation classes are 0/1, or, negative/positive sentiment). Naive Bayes works best when classes are balanced as they are in our dataset. Additionally, Naive Bayes runs very quickly which is significant when looking at a large dataset such as ours. SVM (Support Vector Machine) is a classification model which aims to maximize the distance between data points in each class and the hyperplane. SVM took longest to run of all our algorithms and performed worst so we didn’t explore additional kernels. With that being said, SVMs are typically a highly accurate classification algorithm, so if we tried other hyperparameters, we may have increased performance.
The model we determined to best fit our sentiment data is the Logistic Regression model using
TFIDF. This performed best both according to zeroone loss as well as the AUC metric.
Potential Improvements
One improvement that we would try if we were to perform this analysis again is using a stemmer (from the ‘nltk’ package) to extract base words from our text. We are under the impression that the majority of tweets will depict sentiment best using adjectives as opposed to verbs (where stemming is required), however we still feel we could potentially fit the data better if we were to treat the same base words identically. For example, we would weight the words “terrible” and “terribly” equally in an ideal world. In our current model, “terrible” and “terribly” are weighted separately.
Relation to Business Problem
In terms of the business problem at hand, collecting twitter data and classifying sentiment using our model might shed some light on the public opinion of a current TV season. If we can successfully build a model to predict sentiment from a snippet of text, we can look into tweets (or any bits of text for that matter) to gauge the overall public reception of an episode or season. If the Twitter API is run a short time after an episode airs and we pull out all tweets about the show we are studying, we can get an approximate mean predicted sentiment for that episode. We can use that information week by week to get a sense of how the episode was received by viewers and see if there are noticeable trends over time (perhaps people enjoying the show more as the season progresses). In the future, we can use the model built in the “TV Show Renewal: Modelling” section of our analysis with twitter data for an entire TV season, rather than the limited time frame of our tweet data, to improve the prediction of renewal.
9
Sentiment Analysis: Evaluation
Evaluation Metric
Our goal for the sentiment analysis is to build a model which can give us an as accurate as
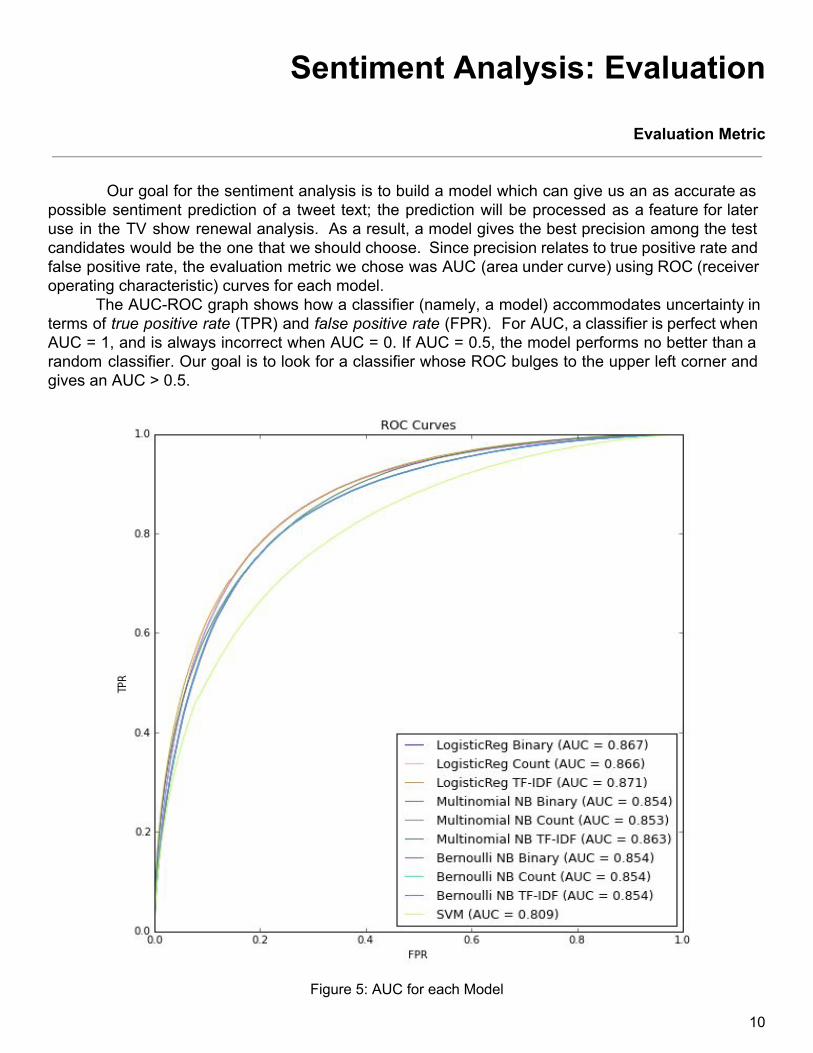
possible sentiment prediction of a tweet text; the prediction will be processed as a feature for later use in the TV show renewal analysis. As a result, a model gives the best precision among the test candidates would be the one that we should choose. Since precision relates to true positive rate and false positive rate, the evaluation metric we chose was AUC (area under curve) using ROC (receiver operating characteristic) curves for each model.
The AUCROC graph shows how a classifier (namely, a model) accommodates uncertainty in terms of true positive rate (TPR) and false positive rate (FPR). For AUC,a classifier is perfect when AUC = 1, and is always incorrect when AUC = 0. If AUC = 0.5, the model performs no better than a random classifier. Our goal is to look for a classifier whose ROC bulges to the upper left corner and gives an AUC > 0.5.
Figure 5: AUC for each Model
10
When we applied the models mentioned in “Alternative Algorithms and Performance,” we
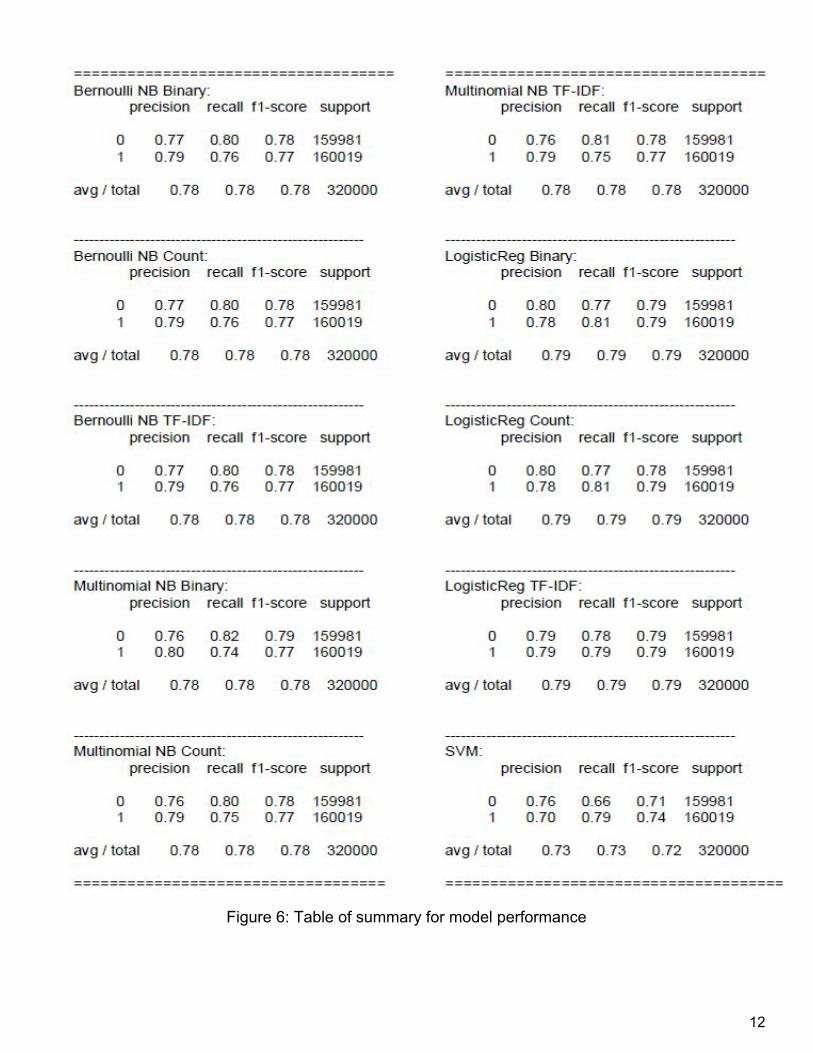
obtained similar ROC curves and AUC values for each option (Figure 5). All models generates an AUC > 0.8, which indicates they are not random classifiers and they are quite good at classifying a positive instance. From the graph, the best AUC (0.871) is achieved by the Logistic Regression with TFIDF as text features in the model. As mentioned above, we want a model which can give us the best precision. Figure 6 below, displays the performance of all the models tried. Logistic Regression models outperform the others in average precision. More support for choosing the Logistic Regression with TFIDF can be found from the zeroone loss values in Figure 4. A zeroone loss implies a correct decision when it is zero, and incorrect decision when it is one. From the table, the Logistic Regression with TFIDF again beats the other models with the lowest zeroone loss.
Relation to Business Problem
Our business problem is to see if the tweet sentiment towards a TV show predicts the decision of the show renewal. At this first stage of the sentiment analysis, if we can make sure our model performs well (i.e., gives the correct sentiment prediction of a show related tweet), we do not need to check the polarity of a tweet manually; rather, just apply the trained model to do the job for us. This can reduce the cost of manpower, and save a lot of time from reading tweet by tweet. However, if the model is to be deployed, several aspects need to be monitored. First of all, language evolves from time to time. Especially nowadays we will have more and more cyber speak, we need to update and retain our sentiment model by using more recent tweets in order for future show prediction. Secondly, our model has a precision of about 79%. If we use the sentiment model to generate a feature for TV show renewal model, it adds error to the secondstage model. The deployment of the sentiment model may not be a good decision when a more thorough sentiment analysis has been performed. However, it can still be used to give TV producers an insight of how viewers think of a show.
11
Figure 6: Table of summary for model performance
12
TV Show Renewal: Modeling
Algorithm
To determine the strength of our twitter sentiment prediction in forecasting a television show’s
future success, we built a logistic regression model. Before training the model, however, we had to obtain a dataset of not only our predicted sentiment of tvrelated tweets, but also standard showperformance metrics such as viewership and number of seasons to see how well our sentiment metric performs. The instances of this dataset were the 104 shows for which we had substantial tweets in the Sentiment140 data, and the features were viewership in 2009 (in millions), viewership before 2009 (in millions), number of seasons (by 2009), the mean of each show’s predicted tweet sentiments (0 to 1) from our sentiment analysis, the mean of each show’s true (labeled) tweet sentiments from Sentiment140, and finally the total number of tweets that mentioned each show. The target variable was 0 if the show was cancelled after its 2009 season and 1 if it was renewed. Figure 7 shows the header of our dataset. Using this setup, we were able to see how much (if at all) twitter sentiment is a predictor of show success. Further, we were able to see if our own predictions of twitter sentiment could be an accurate predictor of show renewal as well.
Figure 7: Header of Logistic Regression training data
Performance
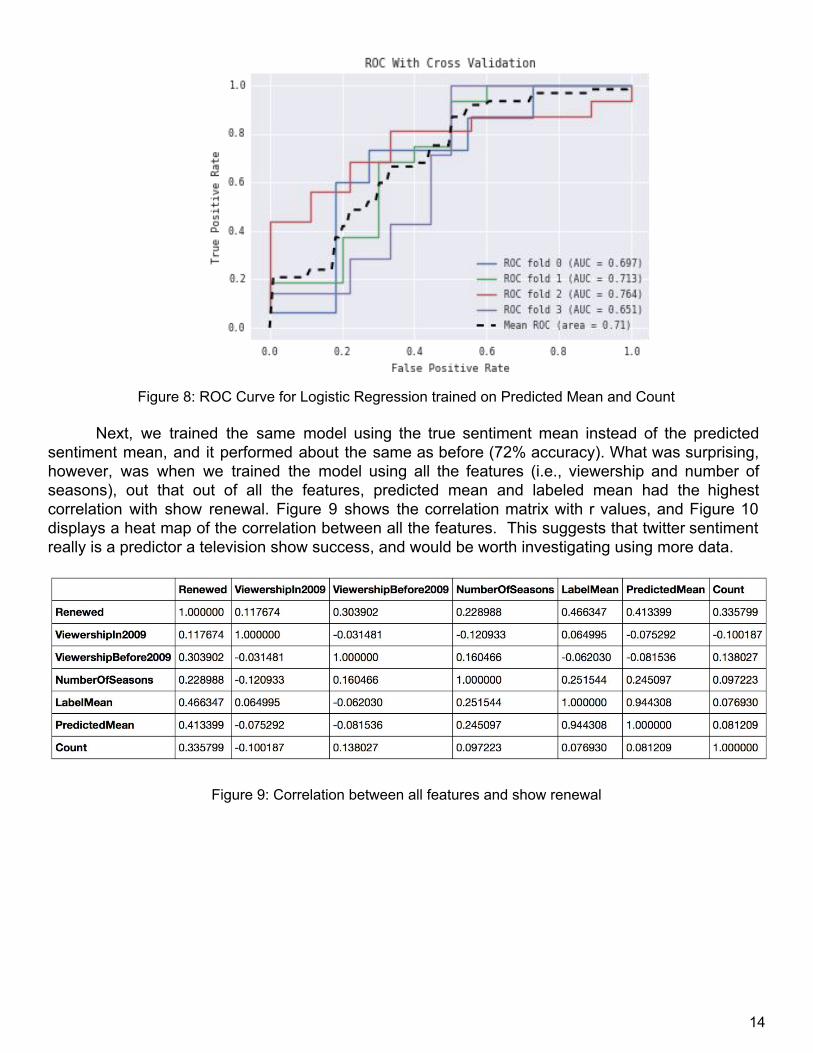
Due to the fact that we had a small corpus of shows and a decently large number of features, we performed 4 fold cross validation to determine the accuracy of our logistic regression model. We also used feature selection to decrease the complexity of our model since we had a small dataset. First, to see how accurate our sentiment predictions were in determining show success, we dropped all features except for the predicted mean of showrelated tweet sentiments and the total number of twitter mentions. In other words, we trained our model on only Predicted Mean and Count. For each fold in our cross validation, we plotted the ROC curve and calculated the AUC. We also plotted the mean AUC across all folds. Figure 8 shows the result. Our logistic regression model of predicted twitter sentiments was able to predict show renewal with a mean accuracy of 71%.
13
Figure 8: ROC Curve for Logistic Regression trained on Predicted Mean and Count
Next, we trained the same model using the true sentiment mean instead of the predicted
sentiment mean, and it performed about the same as before (72% accuracy). What was surprising, however, was when we trained the model using all the features (i.e., viewership and number of seasons), out that out of all the features, predicted mean and labeled mean had the highest correlation with show renewal. Figure 9 shows the correlation matrix with r values, and Figure 10 displays a heat map of the correlation between all the features. This suggests that twitter sentiment really is a predictor a television show success, and would be worth investigating using more data.
Figure 9: Correlation between all features and show renewal
14
Figure 10: Heat map of the correlation matrix in Figure 9
Potential Improvements
One of the main improvements we could make to this model is to train it on more data. With
our current setup, we likely have too many features and too few shows, and hence are at risk of overfitting the model. However, if we performed our sentiment analysis on a larger corpus of tweets, we could train our logistic regression model on more shows and get a higher accuracy level. If we were to have more data, another option would be to perform regularization to find the optimal feature weights, and also the optimal combination of features. As of now, it is a bit unclear if predicted mean and labeled mean are too closely correlated and hence creating a biased model. This is something we could investigate more if we had more data. Additionally, we could try more model algorithms, as we did with the sentiment analysis above.
15
Relation to Business Problem
Using our model, a television network could access another measure of TV show’s success.
For instance, if a network was introducing a new show, it could closely monitor the audience’s reaction and decide if it should be renewed in the next season. This would create a more efficient budgeting process, as the network could have an idea in advance of what shows they need to continue writing scripts for, paying actors for, and marketing for, in addition to financing pilots.
In addition, if a network wanted to see the viewers’ reactions to each individual episode in a given season, it could deploy our model and see the proportion of positive and negative tweets for that week. In this way, the network could see what plotlines, actors, or settings are agreeable to their fan base, thus increasing viewership. For example, in a week where there was a strong negative proportion of tweets about a show, the network may be able to explore what caused the negative reaction by parsing specific tweets that were labeled negative, and make an effort to disclude similar elements from future episodes.
Overall, our model would allow a network to be more efficient and allocate future money only to the shows that will earn them money in the upcoming season. In addition, it could potentially allow them to “save” shows that they believe have more potential by improving plotlines based on viewer feedback on Twitter.
16
TV Show Renewal: Evaluation
Evaluation Metric and Relation to Business Problem
Above, we showed the AUC over each fold in our data set, and took the mean AUC over all
folds. We did this primarily to see if twitter sentiment had any weight in predicting television show renewal, and the AUCROC curve is one of the best ways to visualize this when employing cross validation.
Once we found there was a positive correlation between our twitter sentiment predictions and show renewal, we did recognize that there are other metrics we could use to both improve upon the logistic regression model and validate its performance in terms of lift, expected profit and other businessrelated measures. However, in the interest of time (and the small amount of show data we had) we chose to continue using the AUCROC curve as our metric. As it turns out, the AUCROC curve does have considerably nice implications for our show renewal business problem. For example, when evaluating new series, the network may want to be more cautious and hence minimize false positives. A false positive would mean equate to likely renewing a show that should be canceled, or in other words, a show that will not bring in enough profit to justify its existence on the network. This could be costly to the network, as filming and marketing a television series is very expensive and time consuming. However, maximizing true positives in this framework could also save a network a lot of money by canceling a series before a season in which it will experience a loss in viewership. This could be extremely beneficial in terms of budgeting and planning for the future, as the network could start planning for a new series to take the place of shows likely to be cancelled in the next season.
17
Deployment
Deployment
Since the data we are using are static datasets and there are components of the models that
can be improved, we do not suggest deploying the models. However, here we discuss the situation if we do in fact deploy these models. Ideally, the models are built and trained for forecasting TV show renewal based on viewership and related features, plus the sentiment label for the show which is predicted by the text classification model on tweets. If we first obtain an accurate text classification model for the tweets, as we mentioned in “Sentiment Analysis: Evaluation,” this would provide a less expensive means to gather the sentiment label feature for the TV show renewal classification problem. With enough data and a relevant set of features, we can then train the TV show renewal classification model. By using the TV show renewal model, a predicted renewal label (either 0 = not to renew, or 1 = renew) for a show could be generated.
Technical Issues
1) Sentiment analysis (text classification):
Dataset is static: twitter is a means of social media, providing over half a billion tweets every day. If our model does not update with new data, it will be soon outdated and will not 12
generate a prediction on topics of interest. Language evolution: new forms of language, changes in language over time; old sayings and newly invented cyber speak lose or gain frequency Name entity: we extract TV shows from the tweets by search the name as a string with no special character in lowercase form. This can be a problem because a lot of TV show names are just a commonplace phrases.
2) TV show renewal:
Dataset is static: again, updated dataset needs to be used to retain a meaningful model. Using outdated data does not give any information for future prediction. Data gathering: there is not always data for viewership or related information for a TV show. Sometimes a show just started to air in the period of the obtained dataset; sometimes there is no opensourced record for the show; sometimes not too many people tweet about a TV show… all of these constrain the data volume and hinder a model from being welltrained.
If we only renew the ones with a striking Twitter presence, many shows may not have a
chance to be on air. Since the models are based on Twitter text data, the popularity of a show is highly driven by the tastes of the twitter users. If for a certain time, people who tweet about thrillers, horror series, and crimes express fondness toward those types of shows while giving negative feelings toward other types of shows, should the producers make only the interested types but not the others? Young children, who cannot Tweet, are inappropriate audiences for such shows.
Risks
We should note that Twitter is just one type of social media, and people who use it are younger
generations, it does not account for all age groups and does not provide a general database for the model. The renewal prediction based only on the popularity of a show on Twitter will be very biased. If the model is deployed, the predicted result may lead the producers to produce more TV shows which are favored by the younger generation and reduce production of other TV shows which are favored by other age groups. In the sense of expected profit, although producers gain more in renewing profitable shows, they may loss profit from other shows that are popular but do not have a Twitter presence. In addition, TV shows are one type of entertainment and they also part of a culture. If focusing on only popular types of shows which young people like, this may lead to reduction in diversity of TV shows.
19
Conclusions
Summary
In the planning phase of this project, we set our sights high, opting to build a text classification
model on a corpus of 1.6 million sentimentlabeled tweets, while also finding a way to use the model in the business world. We were able to break it down into three main steps: data preparation, modeling and evaluation. However, in order to be completely thorough, we built two models and hence completed the cycle twice.
In order to build a textsentiment classification model that could be implemented in a business setting, we knew it had as accurate as possible. Thus, we explored multiple options such as Naive Bayes, TF/IDF, Logistic Regression and SVM. In the end, we chose Logistic Regression with TF/IDF vectorization, as it performed the best on our validation set (0.871 AUC).
After finding the best model, we began to examine if it could help solve our business problem: forecasting television show success based on twitter sentiment. To do so, we ran our model on a smaller corpus containing only showrelated tweets. After, we calculated the mean of our model’s output for each show, which was a sequence of 0’s and 1’s based on the predicted polarity of each tweet, and used this information as a feature in our next logistic regression model.
Due to the fact that we had a small corpus of shows to train our second logistic regression model, it can not be determined exactly how accurate our twitter sentiment predictions are in forecasting future show success. However, through cross validation, the model achieved a mean AUC of 0.71. In addition, we found that across all features the predicted and labeled twitter sentiment had the highest correlation with show renewal. This could suggest that twitter sentiment is indeed a predictor of show success and the relationship should be explored more thoroughly in the future.