6 Two-Dimensional Multifractional Brownian Motion- Based Investigation of Heterogeneities from a Core Image Saïd Gaci and Naïma Zaourar University of Sciences and Technology Houari Boumediene, Algiers, Algeria 1. Introduction A core sample is a cylindrical section obtained by driving a hollow tube into the undisturbed medium and withdrawing it with its content. In practice, the sample is pushed more or less unbroken into the tube. Once removed from the tube in the laboratory, it is analyzed by different techniques and equipment depending on the desired type of data. The hole made for the core sample is called the "core hole". A variety of core samplers exist to sample different media under diverse conditions. For instance, sediments or rocks are sampled with a hollow steel tube called a core drill. A scientific coring has been used in the first time for sampling the ocean floor. Then, it is soon exploited to analyze lakes, ice, mud, soil and wood. Cores provide precious information about the evolution of climate, species and sedimentary composition during geologic history. In petroleum engineering, core analysis presents a way of measuring well conditions downhole by studying samples of reservoir rocks. It gives the most accurate estimations of porosity, permeability, fluid saturation and grain density. These measurements help to understand the conditions of the well and its potential productivity. In addition to the basic petrophysical properties estimated from the core, a special core analysis can be undertaken in order to determine permeability, wettability, capillary pressure, and electrical properties. Petrographic studies and sieve analysis can also be carried out in such analysis. In recent years, numerical analysis has been widely used for the investigation of images, since it yields results more objective and reliable than those obtained by conventional methods based on human observations. Fractal analysis has been introduced to examine images texture (Bourissou et al., 1994; Lévy-Véhel and Mignot, 1994; Liu and Li, 1997; Lévy- Véhél, 1995, 1997, 1998; Pesquet-Popescu and Lévy-Véhel, 2002; Malladi et al., 2003; Tahiri et al., 2005). In this study, we suggest to go beyond the conventional core analysis, and to perform a new approach to extract the maximum features from a core image using a fractal analysis. The conventional fractal model used previously in image processing, the two-dimensional fractional Brownian motion (2D- fBm), presents a constant Hölder function H, thus does not allow to explore the spatial evolution of the local regularity. To do so, we suggest to www.intechopen.com
Transcript
6
Two-Dimensional Multifractional Brownian Motion- Based Investigation of
Heterogeneities from a Core Image
Saïd Gaci and Naïma Zaourar University of Sciences and Technology Houari Boumediene, Algiers,
Algeria
1. Introduction
A core sample is a cylindrical section obtained by driving a hollow tube into the undisturbed medium and withdrawing it with its content. In practice, the sample is pushed more or less unbroken into the tube. Once removed from the tube in the laboratory, it is analyzed by different techniques and equipment depending on the desired type of data. The hole made for the core sample is called the "core hole". A variety of core samplers exist to sample different media under diverse conditions. For instance, sediments or rocks are sampled with a hollow steel tube called a core drill. A scientific coring has been used in the first time for sampling the ocean floor. Then, it is soon exploited to analyze lakes, ice, mud, soil and wood. Cores provide precious information about the evolution of climate, species and sedimentary composition during geologic history. In petroleum engineering, core analysis presents a way of measuring well conditions downhole by studying samples of reservoir rocks. It gives the most accurate estimations of porosity, permeability, fluid saturation and grain density. These measurements help to understand the conditions of the well and its potential productivity. In addition to the basic petrophysical properties estimated from the core, a special core analysis can be undertaken in order to determine permeability, wettability, capillary pressure, and electrical properties. Petrographic studies and sieve analysis can also be carried out in such analysis. In recent years, numerical analysis has been widely used for the investigation of images, since it yields results more objective and reliable than those obtained by conventional methods based on human observations. Fractal analysis has been introduced to examine images texture (Bourissou et al., 1994; Lévy-Véhel and Mignot, 1994; Liu and Li, 1997; Lévy-Véhél, 1995, 1997, 1998; Pesquet-Popescu and Lévy-Véhel, 2002; Malladi et al., 2003; Tahiri et al., 2005). In this study, we suggest to go beyond the conventional core analysis, and to perform a new approach to extract the maximum features from a core image using a fractal analysis. The conventional fractal model used previously in image processing, the two-dimensional fractional Brownian motion (2D- fBm), presents a constant Hölder function H, thus does not allow to explore the spatial evolution of the local regularity. To do so, we suggest to
www.intechopen.com
Advances in Data, Methods, Models and Their Applications in Geoscience
110
consider a generalized fractal model, the two–dimensional multifractional Brownian motion (2D-mBm), which presents a regularity varying in space. The mBm model, initially proposed by Peltier and Lévy-Véhél (1995), and Benassi et al.
(1997), is used in many disciplines: images processing (Bicego and Trudda, 2010), traffic
phenomena (Li et al., 2007), geophysics (Wanliss, 2005; Wanliss and Cersosimo, 2006;
Cersosimo and Wanliss, 2007; Gaci et al., 2010; Gaci and Zaourar, 2010, 2011). For the
estimation of the mBm processes’ local regularity, we propose three algorithms based on the
two-dimensional continuous wavelet transform (2D- CWT). The wavelet coefficients are
calculated by Fast Fourier Transform (FFT) using the Morlet wavelet and the Mexican hat
for the first and the second algorithms, respectively. However for the third algorithm, the
coefficients estimation is carried out using the multiple filter technique (2D MFT) that we
generalized to two dimensions (Gaci, 2011), from the one-dimensional case (1D MFT) (Li,
1997; Gaci et al., 2011).
This chapter is organized as follows. First, we give a brief theory on 2D-mBm model and the
wavelet-based estimators of the local regularity. The potential of the suggested algorithms is
then demonstrated on synthetic 2D-mBm paths. The results showed that the 2D MFT
algorithm yields the best Hölder exponent estimates. Next, the suggested regularity analysis
is extended to digitalized image data of a core extracted from an Algerian borehole. It is
shown that the data exhibit a fractal behavior. In addition, the derived regularity maps,
obtained with the 2D MFT algorithm, show a strong correlation with the core
heterogeneities.
2. (Multi)fractional Brownian motion
2.1 Fractional Brownian motion Fractional Brownian motion (fBm) is one of the most popular stochastic fractal models for
studying rough signals. It was introduced by Kolmogorov (1940) and studied by
Mandelbrot and Van Ness (1968).
A fBm, denoted by BH (t), is the zero-mean Gaussian process with stationary increments. It is
parameterized by a constant Hurst parameter H. The fBm is H-self affine, i.e.:
HH HB t B t , 0 (1)
Where means the equality of all its finite-dimensional probability distributions.
The bidimensional isotropic fractional Brownian motion, or Lévy Brownian fractional field,
with Hurst parameter H is a centered Gaussian field HB with an autocorrelation function
(Kamont, 1996):
2 22 H HHE B x B y x y x y
, with 0 1H (2)
where 2,x y R and . is the usual Euclidian norm.
For H=1/2, the fractional Brownian motion is reduced to a Wiener process.
The regularity of the 2D-fBm is measured by the pointwise Hölder exponent HB x
.
Indeed, it is shown that almost surely: HB x H . Therefore, the higher the H value, the
smoother the 2D-fBm paths.
www.intechopen.com
Two-Dimensional Multifractional Brownian Motion- Based Investigation of Heterogeneities from a Core Image
111
2.2 Multifractional Brownian motion Multifractional Brownian motion (mBm) was introduced by Peltier and Lévy-Véhél (1995),
and Benassi et al. (1997) by allowing H to vary over time. Even if no longer stationary nor
self-similar compared to the fBm, the mBm presents the advantage to be very flexible since
the function H(t) can model phenomena whose sample paths display a time changing
regularity.
For a continuous function 2:H x R R, the isotropic multifractional Brownian field
H xW is a centered Gaussian field with a covariance function
H x H y H x H yH x H y
H x H yE W x W y x y x y
(3)
Identically to the 2D-fBm, the local regularity of the 2D-mBm paths is measured by means of
the pointwise Hölder exponent. For a differentiable function H, the relation HB x H x
is demonstrated, almost surely, for all 2x R .
3. Regularity analysis using the wavelet transform
3.1 Two- dimensional continuous wavelet transform
The two-dimensional continuous wavelet transform (2D- CWT) of a signal ,s x y is given
by (Chui, 1992; Holschneider, 1995):
1
( , , ) ( , ) ,yx
x y
y bx bS a b b s x y g dx dy
a aa
(4)
where ,g x y is the analyzing wavelet, "a" is the scale parameter, "bx" and "by" are the
respective translations according to X-axis and Y-axis. The symbol "―" denotes the complex
conjugate.
Let ,s x y be a self-affine fractal surface. It satisfies then the relation:
( , ) . ( , )Hs x y s x y (5)
with the Hurst exponent H and a positive factor . If s is a stochastic process, the two sides
of the relation follow the same law.
Let us define the function 0 0, ( , )x ys x y in each point 0 0( , )x y by:
0 0, 0 0( , ) ( , ) ( , )x ys x y s x x y y s x y . This function also satisfies the self-affine property
described by (Mandelbrot, 1977, 1982; Feder, 1988; Vicsek 1989; Edgard, 1990) :
0 0 0 0, ,( , ) ( , )H
x y x ys x y s x y (6)
This property is reflected by the 2D-CWT provided that the analyzing wavelet decreases
swiftly enough to zero and has enough vanishing moments (Holschneider, 1995):
0 0
1( , )
20 0 0 0( , , ) ( , , )
H x y
x y x yS a x b y b S a x b y b , 0 (7)
www.intechopen.com
Advances in Data, Methods, Models and Their Applications in Geoscience
112
By taking the scale “a” inversely proportional to the wavenumber k: 1a k , the wavelet
coefficients will be expressed in (k, bx, by) plane.
The scalogram can be defined as the square of the amplitude spectrum:
2, , ( , , )P k x y S k x y . For large values of k, it can be expressed as:
( , ) ( , )( , , ) '( , ). x y x yP k x y P x y k k (8)
Where
, 2 , 1x y H x y (9)
is the local spectral exponent which is related to the local Hurst (or Hölder) exponent, ,H x y . The spectral exponent ,x y in each point ,x y is computed as the slope of the
scalogram versus the wavenumber in the log-log plan, the ,H x y value is then derived
using the equation (9).
3.2 Used analyzing wavelets The analyzing wavelets used in this application are the Morlet wavelet and the Mexican hat
(Fig. 1). This choice is motivated by their adequate properties for the regularity analysis.
- The Morlet wavelet:
2 2
0 0
1
2, .x yx yi x y
g x y e e
22
0 01
2ˆ ( , )x y
g e ; with 1 22 2
0 0 5x y (10)
- The Mexican hat:
2 2 22 2, 2x y
g x y x y e 2 2 22 2ˆ; , .g e
(11)
3.3 Wavelet-based estimators of the local regularity As explained earlier, the computation of the local Hölder exponents H(x,y) requires to
calculate the two-dimensional wavelet continuous transform. Here, we suggest three
algorithms for the implementation of the 2D- CWT, which are:
3.3.1 FFT-based algorithms These algorithms are based on the property that wavelet coefficients, expressed by the
equation (4), can be performed via the Fourier transform using the Morlet wavelet and the
Mexican hat:
1 ˆ ˆ( , , ) ( , ). ,x yS a b b FFT s a g a a (12)
These algorithms are accurate but slow, and the signal length must be a power of 2.
www.intechopen.com
Two-Dimensional Multifractional Brownian Motion- Based Investigation of Heterogeneities from a Core Image
113
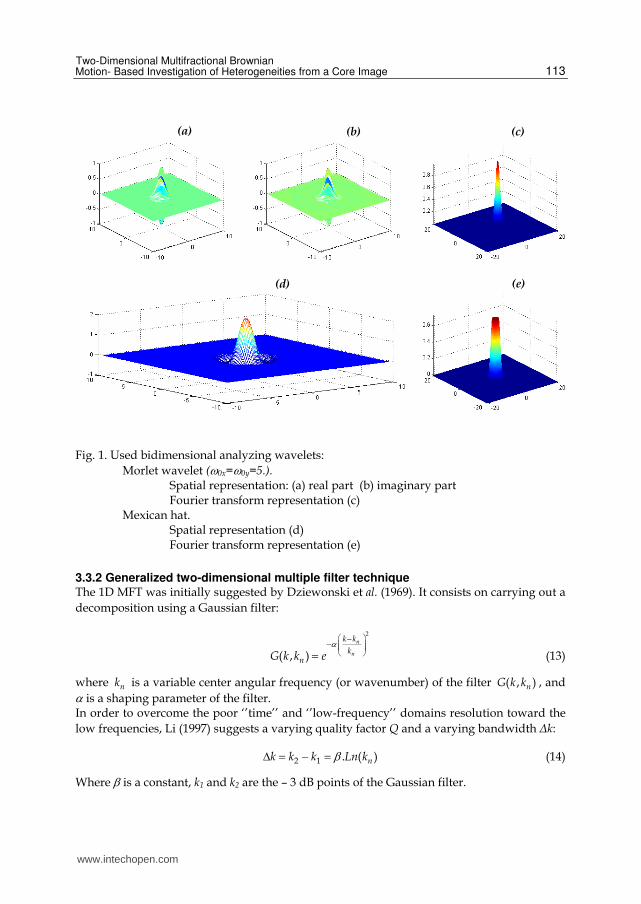
Fig. 1. Used bidimensional analyzing wavelets:
Morlet wavelet (0x=0y=5.). Spatial representation: (a) real part (b) imaginary part Fourier transform representation (c) Mexican hat. Spatial representation (d) Fourier transform representation (e)
3.3.2 Generalized two-dimensional multiple filter technique The 1D MFT was initially suggested by Dziewonski et al. (1969). It consists on carrying out a
decomposition using a Gaussian filter:
2
( , )
n
n
k k
knG k k e
(13)
where nk is a variable center angular frequency (or wavenumber) of the filter ( , )nG k k , and
is a shaping parameter of the filter. In order to overcome the poor ‘’time’’ and ‘’low-frequency’’ domains resolution toward the
low frequencies, Li (1997) suggests a varying quality factor Q and a varying bandwidth Δk:
2 1 . ( )nk k k Ln k (14)
Where is a constant, k1 and k2 are the – 3 dB points of the Gaussian filter.
(a) (b) (c)
(e) (d)
www.intechopen.com
Advances in Data, Methods, Models and Their Applications in Geoscience
114
Here, we propose to extend the 1D MFT enhanced by Li (1997) to 2 dimensions. The idea
consists on decomposing the two-dimensional signal using a Gaussian filter
( , , )n mG k defined as:
2 2
1 2( , , ) ( , ) ( , )
n n
n n
n m n m
k k
G k G k G k
e e
(15)
Where n and m are variable center angular frequencies (or wavenumbers) of the
respective filters 1( , )nG k and 2( , )mG k . The bandwidths 1k and 2k of both filters are
calculated as above (Eq. 14).
4. Application to simulated 2D-mBm paths
In this section, the suggested estimators of the local regularity are tested on synthetic 2D-
mBm paths whose lengths are 256 x 256, generated using the kriging method (Barrière,
2007). Three types of Hölder function H are chosen:
bilinear : 1 1 2 1 2, 0.8 0.6H x x x x
logistic : 2 1 22
0.4, 0.7
1 exp 20 0.5H x x
x
periodic : 3 1 2 1 2
3, 0.5 0.3sin 2 cos
2H x x x x
The regularity functions and the simulated 2D-mBm paths corresponding to the three
theoretical H functions are presented in Figure 2. The larger H value, the smoother the
modeled surface.
Using the three algorithms, we have estimated H maps. For the first wavelet-based
algorithm, we use the Morlet wavelet with 0x=0y=8.9443, while for 2D MFT, the selected
parameters for the two-dimensional Gaussian filters are:
- The shaping factor =40,
- The minimal central wavenumber of the filter ┦min=┥min=2.10-3 rad/m,
- The maximal central wavenumber of the filter ┦max=┥max =2.100.5 rad/m,
- The number of the central wavenumbers of the filter N=100,
- The sampling rate is selected as 0.1524m.
The H maps obtained by the three estimators, presented in Figure 3, show that the regularity
estimated by the first wavelet-based algorithm using the Morlet wavelet are better than that
calculated by the second algorithm with the Mexican hat. In addition, the suggested 2D MFT
provides the best estimations of the regularity maps with the least errors. For this reason, we
retain only this estimator in the following. It can be also remarked that all the used
algorithms yield large absolute values of the estimation error in the limits of the analyzed
2D-mBms.
www.intechopen.com
Two-Dimensional Multifractional Brownian Motion- Based Investigation of Heterogeneities from a Core Image
115
Fig. 2. A 3D-view representation and a XY-plan projection of the theoretical H function and the corresponding simulated 2D-mBm path, for the three types of H functions. Bilinear (top), logistic (middle) and periodic (bottom).
Fig. 3. (Continued)
H function Simulated 2D-mBm path
(a)
www.intechopen.com
Advances in Data, Methods, Models and Their Applications in Geoscience
116
Fig. 3. Regularity functions obtained by the three algorithms from the 2D-mBm paths, represented in Fig.2, simulated with three types of H function: (a) bilinear (b) logistic (c) periodic Line 1: theoretical H function; Lines 2 & 3: regularity functions estimated using FFT-based algorithms with, respectively, the Morlet wavelet and the Mexican hat; Line 4: regularity
function estimated using 2D MFT (=40). The columns from left to right represent: (1) the estimated H function , (2) the estimation error , calculated as the difference between the estimated H function and the theoretical H function.
www.intechopen.com
Two-Dimensional Multifractional Brownian Motion- Based Investigation of Heterogeneities from a Core Image
117
5. Application to digitalized core image data
Here, the local regularity analysis is performed on digitalized core image data. The analyzed core is extracted from a well drilled in an Algerian basin. It is chosen since it represents the main geological features of the studied region (Fig.4). The core presents medium to fine quartzitic sandstone, clay and quartz cemented cross stratifications underlined by mud films. The formation is affected by a main fracture F1 with a high angle dip (≈75°) filled with quartz. It is also noted the presence of another fracture F2 sub-parallel to F1 but less important.
Fig. 4. Core image.
The processing of the core image requires first its digitalization. The core image is digitalized and codified in gray levels with integer values ranged between 0 and 255. The obtained digitalized core image, illustrated by figure 5, corresponds to a matrix of 3642 x 996 with a sampling rate Δx=Δy=0.0121 cm. First, the fractal behavior of the digitalized core image data is inspected on five horizontal and five vertical profiles as shown in Figure 5.
Fig. 5. Positions of the horizontal and the vertical profiles on the digitalized core image. The horizontal profiles numbered from 1 to 5 (in blue) correspond to the respective positions y = 0.0120 m, 0.0361 m, 0.0603 m, 0.0845 m and 0.1087 m, while the vertical profiles numbered from 1 to 5 (in red) correspond to the respective positions x = 0.0241 m, 0.1208 m, 0.2175 m, 0.3142 m and 0.4109 m.
1 2 3 4 5
1
2
3
4
5
F1 F2 BreakMud films
www.intechopen.com
Advances in Data, Methods, Models and Their Applications in Geoscience
118
For each profile, the Fourier amplitude spectrum is computed and represented in a double
logarithmic scale. Then, we estimate the local Hölder function H(x) using an algorithm
based on the local growth of the increment process Sk,n(i) (Peltier and Lévy-Véhél, 1994,
1995; Muniandy et al., 2001; Li et al., 2008; Gaci et al., 2010):
,2 , 2
11
k nj i k i k
mS i X j X j
n , 1<k<n (16)
where n is the signal X length, k is a fixed window size, and m is the largest integer not
exceeding n/k.
The local Hölder function H(x) at point
1
ix
n (17)
is given by
,log 2
ˆlog 1
k nS iH i
n
(18)
The obtained results corresponding to the horizontal profiles and the vertical profiles are
respectively exposed in figures 6a and 6b.
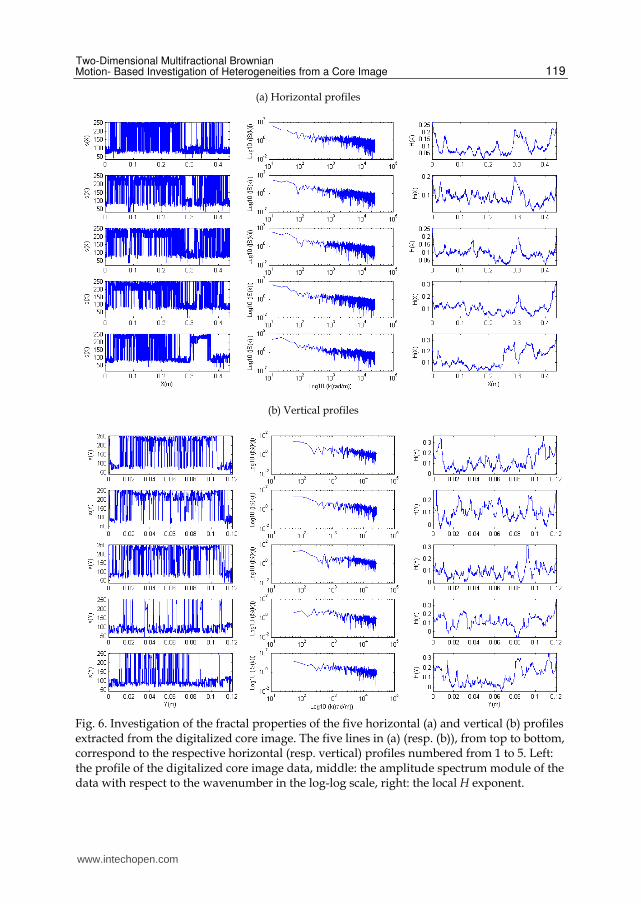
It can be noted that all the resulted amplitude spectra exhibit an algebraic decay; that
illustrates the fractal properties of the digitalized data. Besides, the analyzed profiles present
a varying regularity with the position according to X- and Y-axis. They can be then regarded
as paths of multifractional Brownian motions (mBms) (Peltier and Lévy-Véhel, 1995). The
variation of H exponent value is related to the local lithological changes of the core
composition.
The next step consists on establishing regularity maps from the digitalized data using the 2D
MFT algorithm. The implementation of the latter algorithm requires the ‘’reconditioning'' of
the data so that the matrix dimensions corresponding to the digitalized data are a power of
2. For the purpose of processing the digitalized data, and considering the limitations of the
available computer’s capacities, we have splited the obtained matrix (3642 x 996) into two
overlapping sub-matrixes whose size is 2048 x 1024. The sub-matrixes are padded by zeros
so that their dimensions following Y-axis, initially equal to 996, reach 1024.
The parameters selected for the 2D MFT are as follow:
- The minimal center wavenumbers of the filter : ┦min=┥min =2.10-1 rad/m;
- The maximal center wavenumbers of the filter:
┦max=┥max = 2/(2 Δx)≈ 25964 rad/m;
The other parameters ( and N) are similar to those used in the previous section.
The final regularity map is constructed from the H sub-maps related to the two sub-matrixes
(Fig. 7). The H values in the overlapping zone are calculated as the average of the H values
corresponding to the H values in the sub-maps.
www.intechopen.com
Two-Dimensional Multifractional Brownian Motion- Based Investigation of Heterogeneities from a Core Image
119
Fig. 6. Investigation of the fractal properties of the five horizontal (a) and vertical (b) profiles extracted from the digitalized core image. The five lines in (a) (resp. (b)), from top to bottom, correspond to the respective horizontal (resp. vertical) profiles numbered from 1 to 5. Left: the profile of the digitalized core image data, middle: the amplitude spectrum module of the data with respect to the wavenumber in the log-log scale, right: the local H exponent.
(b) Vertical profiles
(a) Horizontal profiles
www.intechopen.com
Advances in Data, Methods, Models and Their Applications in Geoscience
120
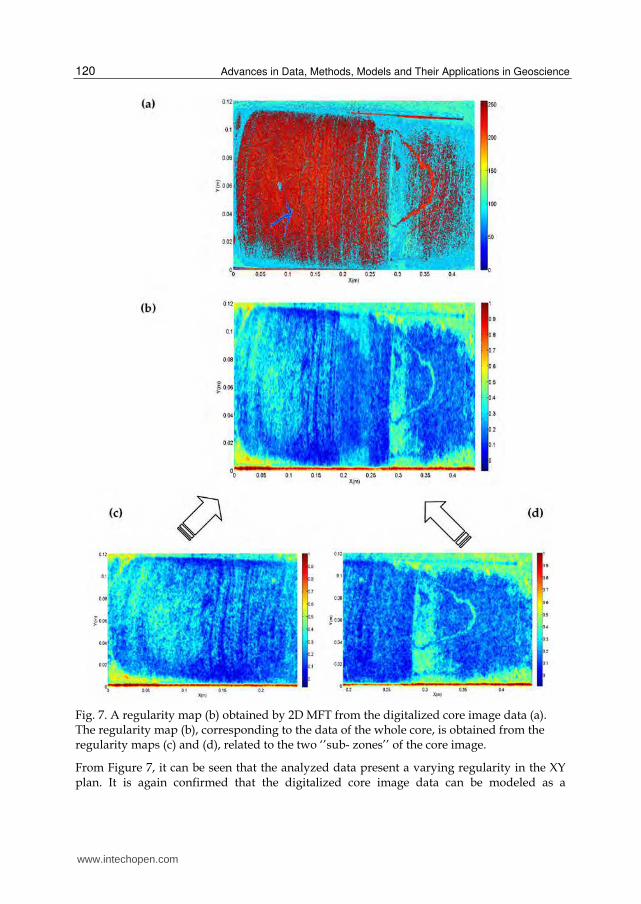
Fig. 7. A regularity map (b) obtained by 2D MFT from the digitalized core image data (a). The regularity map (b), corresponding to the data of the whole core, is obtained from the regularity maps (c) and (d), related to the two ‘’sub- zones’’ of the core image.
From Figure 7, it can be seen that the analyzed data present a varying regularity in the XY plan. It is again confirmed that the digitalized core image data can be modeled as a
www.intechopen.com
Two-Dimensional Multifractional Brownian Motion- Based Investigation of Heterogeneities from a Core Image
121
trajectory of a 2D-mBm. The obtained H maps highlight well the main fault F1, the break and the mud films. However, the minor fault F2 is locally noticeable. We note that these lithological changes are marked by local maxima of H values which are higher than those characterizing the surrounding medium. Now, we aim to establish a correspondence between the digitalized data values, which are
the gray levels values representing the geological facies, and the H value via a statistical
analysis. In order to avoid the abnormally high values of H due to the limits effects, we
consider the digitalized data corresponding to a central zone extracted from the core
image (X: 10.8671- 43.5047cm; Y: 0.9550- 10.2627 cm). Thereafter, six classes are
determined by fitting the results yielded by the application of the k-means method on the
selected data. The six classes of the gray levels resulted from this classification are: class
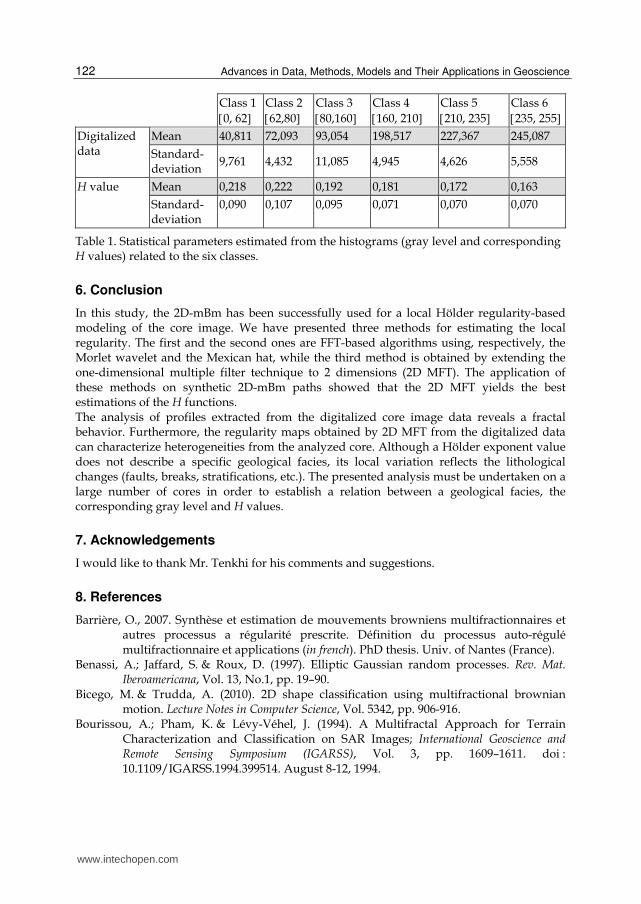
1 = 0, 62 , class 2 = 62,80 , class 3 = 80,160 , class 4 = 160, 210 , class 5 = 210, 235 and class 6 = 235, 255 . From figure 8, it can be seen that the histograms of H values calculated by 2D MFT follow a
normal distribution. For each class, the statistical parameters (mean and standard-deviation)
are estimated from the histograms of the gray level values, and the corresponding H values
(Table 1). It is worth noting that for the six classes, the statistical parameters of H values,
estimated from the histograms, present very close values. These results show that the
Hölder exponent value can not characterize a geological facies represented by the gray level,
whereas its local variation reflects local lithological changes as explained earlier.
Fig. 8. Histograms of the digitalized data values extracted from the core image, and the corresponding H values estimated by 2D MFT, for the six classes. The six columns from left to right correspond respectively to the classes 1 to 6.
www.intechopen.com
Advances in Data, Methods, Models and Their Applications in Geoscience
122
Class 1
0, 62 Class 2
62,80 Class 3
80,160 Class 4
160, 210 Class 5
210, 235 Class 6
235, 255 Digitalized data
Mean 40,811 72,093 93,054 198,517 227,367 245,087
Standard-deviation
9,761 4,432 11,085 4,945 4,626 5,558
H value
Mean 0,218 0,222 0,192 0,181 0,172 0,163
Standard-deviation
0,090 0,107 0,095 0,071 0,070 0,070
Table 1. Statistical parameters estimated from the histograms (gray level and corresponding H values) related to the six classes.
6. Conclusion
In this study, the 2D-mBm has been successfully used for a local Hölder regularity-based modeling of the core image. We have presented three methods for estimating the local regularity. The first and the second ones are FFT-based algorithms using, respectively, the Morlet wavelet and the Mexican hat, while the third method is obtained by extending the one-dimensional multiple filter technique to 2 dimensions (2D MFT). The application of these methods on synthetic 2D-mBm paths showed that the 2D MFT yields the best estimations of the H functions. The analysis of profiles extracted from the digitalized core image data reveals a fractal behavior. Furthermore, the regularity maps obtained by 2D MFT from the digitalized data can characterize heterogeneities from the analyzed core. Although a Hölder exponent value does not describe a specific geological facies, its local variation reflects the lithological changes (faults, breaks, stratifications, etc.). The presented analysis must be undertaken on a large number of cores in order to establish a relation between a geological facies, the corresponding gray level and H values.
7. Acknowledgements
I would like to thank Mr. Tenkhi for his comments and suggestions.
8. References
Barrière, O., 2007. Synthèse et estimation de mouvements browniens multifractionnaires et autres processus a régularité prescrite. Définition du processus auto-régulé multifractionnaire et applications (in french). PhD thesis. Univ. of Nantes (France).
Benassi, A.; Jaffard, S. & Roux, D. (1997). Elliptic Gaussian random processes. Rev. Mat. Iberoamericana, Vol. 13, No.1, pp. 19–90.
Bicego, M. & Trudda, A. (2010). 2D shape classification using multifractional brownian motion. Lecture Notes in Computer Science, Vol. 5342, pp. 906-916.
Bourissou, A.; Pham, K. & Lévy-Véhel, J. (1994). A Multifractal Approach for Terrain Characterization and Classification on SAR Images; International Geoscience and Remote Sensing Symposium (IGARSS), Vol. 3, pp. 1609–1611. doi : 10.1109/IGARSS.1994.399514. August 8-12, 1994.
www.intechopen.com
Two-Dimensional Multifractional Brownian Motion- Based Investigation of Heterogeneities from a Core Image
123
Cersosimo, D.O. & Wanliss, J.A. (2007). Initial studies of high latitude magnetic field data during different magnetospheric conditions. Earth Planets Space, Vol. 59, No.1, pp. 39-43.
Chui, C.K. (1992) An introduction to wavelets. Academic Press. Dziewonski, A.; Bloch, S. & Landisman, M. (1969) A technique for the analysis of transient
seismic signals: Bull. Seismol. Soc. Am., Vol. 59, pp. 427–444. Edgard, G.A. (1990) Measures, Topology anf Fractal Geometry. Springer Verlag, Berlin. Feder, J. (1988). Fractals, p. 283, Plenum (Ed.), New York. Gaci, S.; Zaourar, N.; Hamoudi, M. & Holschneider, M. (2010). Local regularity analysis of
strata heterogeneities from sonic logs. Nonlin. Processes Geophys., Vol. 17, pp. 455-466, http: www.nonlin-processes-geophys.net/17/455/2010/doi:10.5194/npg-17-455-2010
Gaci, S. & Zaourar, N. (2010). A new approach for the investigation of the local regularity of borehole wire-line logs. J. hydrocarb. mines environ. res., Vol. 1, No.1, pp. 6-13.
Gaci, S. (2011). Multifractional analysis of geophysical signals (in French). PhD thesis. Univ. of Sciences and Technology Houari Boumdiene (Algeria).
Gaci, S. & Zaourar, N. (2011). Heterogeneities characterization from velocity logs using multifractional Brownian motion. Arab J. Geosci. Vol. 4, No 3-4 pp, 535–541. doi: 10.1007/s12517-010-0167-5.
Gaci, S.; Zaourar, N.; Briqueu, L. & Holschneider, M. (2011). Regularity analysis applied to sonic logs data: a case study from KTB borehole site. Arab J Geosci. Vol. 4, No. 1-2, pp. 221-227. doi 10.1007/s12517-010-0129-y
Holschneider, M. (1995). Wavelets: an Analysis Tool. Clarendon. Oxford, England. Kamont, A., 1996. On the Fractional Anisotropic Wiener Fields. Journal of Probability and
Mathematical Statistics, Vol. 16, No.1, pp.85-98. Kolmogorov, A.N. (1940) Wienersche spiralen und einige andere interessante kurven im
hilbertschen raume. Doklady, Vol. 26, pp. 115–118. Lévy-Véhel, J. & Mignot, P. (1994). Multifractal segmentation of images; Fractals, Vol. 2, No.
3, pp. 371–378. Lévy-Véhel, J. (1995). Fractal approaches in signal processing, Fractals, Vol. 3, No. 4, pp. 755-
775. Symposium in Honor of Benoit Mandelbrot (Curaçao, 1995). Lévy-Véhel, J. (1997). Introduction to the multifractal analysis of images. Springer Verlag. Lévy-Véhel, J. (1998). Fractals Images Encoding and Analysis, Springer Verlag. Li, X-P (1997). Decomposition of vibroseis data by the multiple filter technique. Geophysics,
Vol. 62, No. 3, pp. 980–991. Li, M.; Lim, S.C.; Hu, B-J. & Feng, H. (2007). Towards describing multi-fractality of traffic
using local Hurst function. Lecture Notes in Computer Science, Vol. 4488, pp. 1012-1020.
Li, M.; Lim, S.C. & Zhao, W. (2008). Investigating multi-fractality of network traffic using local Hurst function, Advanced Studies in Theoretical Physics, Vol. 2, No. 10, pp. 479–490.
Liu, Y. & Li, Y. (1997). New approaches of multifractale image analysis; Proceedings of International Conference on information, communications and signal processing, Vol. 2, pp. 970–974.
www.intechopen.com
Advances in Data, Methods, Models and Their Applications in Geoscience
124
Malladi, R.K.; Kasilingam, D. & Costa, A.H. (2003). Speckle filtering of SAR images using Hölder regularity analysis of the sparse code; IEEE Int. Geosci. Remote Sens. Symp., Vol. 6, pp. 3998–4000.
Mandelbrot, B.B. & Van Ness, J.W. (1968). Fractional brownian motion, fractional noises and applications. Siam Review, Vol. 10, No. 4, pp. 422–437.
Mandelbrot, B.B. (1977). Fractals : Form, Chance and Dimensions. Freeman, San Francisco. Mandelbrot, B.B. (1982) The Fractal Geometry of Nature. Freeman, San Francisco. Muniandy, S.V.; Lim, S.C. & Murugan, R. (2001). Inhomogeneous scaling behaviors in
Malaysian foreign currency exchange rates, Physica A, Vol. 301, No. 1–4, pp. 407–428.
Peltier, R.F. & Lévy-Véhel, J. (1994). A New Method for Estimating the Parameter of Fractional Brownian motion, Technical report, INRIA RR 2396.
Peltier, R.F. & Lévy-Véhel, J. (1995). Multifractional Brownian Motion: Definition and preliminary results, Technical report, INRIA RR 2645.
Pesquet-Popescu, B. & Lévy-Véhel, J. (2002). Stochastic Fractal Models for Image Processing. IEEE Signal Processing Magazine. Vol. 19, No. 5, pp. 48-62.
Tahiri, A.M.; Farssi, S.M. & Touzani, A. (2005). Textures in images classification using a multifractal approach. IEEE SITIS, pp. 56-61.
Vicsek, T. (1989). Fractal Growth Phenomena. World Scientific, Singapour. Wanliss, J.A. (2005). Fractal properties of SYM-H during quiet and active times.
Journal of Geophysical Research, Vol. 110, No. A03202, pp 12. doi : 10.1029 /2004JA010544.
Wanliss, J.A. & Cersosimo, D.O. (2006). Scaling properties of high latitude magnetic field data during different magnetospheric conditions. Proceedings 8th International Conference Substorms, Banff, Canada, 325-329.
www.intechopen.com
Advances in Data, Methods, Models and Their Applications inGeoscienceEdited by Dr. DongMei Chen
ISBN 978-953-307-737-6Hard cover, 336 pagesPublisher InTechPublished online 22, December, 2011Published in print edition December, 2011
InTech ChinaUnit 405, Office Block, Hotel Equatorial Shanghai No.65, Yan An Road (West), Shanghai, 200040, China
Phone: +86-21-62489820 Fax: +86-21-62489821
With growing attention on global environmental and climate change, geoscience has experienced rapidchange and development in the last three decades. Many new data, methods and modeling techniques havebeen developed and applied in various aspects of geoscience. The chapters collected in this book present anexcellent profile of the current state of various data, analysis methods and modeling techniques, anddemonstrate their applications from hydrology, geology and paleogeomorphology, to geophysics,environmental and climate change. The wide range methods and techniques covered in the book includeinformation systems and technology, global position system (GPS), digital sediment core image analysis, fuzzyset theory for hydrology, spatial interpolation, spectral analysis of geophysical data, GIS-based hydrologicalmodels, high resolution geological models, 3D sedimentology, change detection from remote sensing, etc.Besides two comprehensive review articles, most chapters focus on in-depth studies of a particular method ortechnique.
How to referenceIn order to correctly reference this scholarly work, feel free to copy and paste the following:
Said Gaci and Naima Zaourar (2011). Two-Dimensional Multifractional Brownian Motion- Based Investigationof Heterogeneities from a Core Image, Advances in Data, Methods, Models and Their Applications inGeoscience, Dr. DongMei Chen (Ed.), ISBN: 978-953-307-737-6, InTech, Available from:http://www.intechopen.com/books/advances-in-data-methods-models-and-their-applications-in-geoscience/two-dimensional-multifractional-brownian-motion-based-investigation-of-heterogeneities-from-a-core-i


![[XLS]cdn.networkrail.co.uk · Web view32532 25382 13321 18494 15225 15223 15226 15229 15222 15224 83116 81110 81111 81112 81115 70323 43222 44999 43209 70358 43231 43205 51963 43210](https://static.documents.pub/doc/80x56/5b26f6007f8b9a63168b4acb/xlscdn-web-view32532-25382-13321-18494-15225-15223-15226-15229-15222-15224.jpg)


