TWO-DIMENSIONAL SEISMIC EVALUATION OF THE I&W BRINE CAVERN CARLSBAD, NEW MEXICO Topical Report RSI-2083 prepared for New Mexico Oil Conservation Division 1220 South St. Francis Drive Santa Fe, New Mexico 87505 November 2009
Transcript
TWO-DIMENSIONAL SEISMIC EVALUATION
OF THE I&W BRINE CAVERN
CARLSBAD, NEW MEXICO
Topical Report RSI-2083
prepared for
New Mexico Oil Conservation Division 1220 South St. Francis Drive
Santa Fe, New Mexico 87505
November 2009
TWO-DIMENSIONAL SEISMIC EVALUATION
OF THE I&W BRINE CAVERN
CARLSBAD, NEW MEXICO
Topical Report RSI-2083
by
William M. Goodman John M. Schneider
David J. Gnage David A. Henard
Leo L. Van Sambeek
RESPEC P.O. Box 725
Rapid City, South Dakota 57709
prepared for
New Mexico Oil Conservation Division 1220 South St. Francis Drive
Santa Fe, New Mexico 87505
November 2009
i
EXECUTIVE SUMMARY
RESPEC supervised a high-resolution P-wave (HRPW) two-dimensional (2D) seismic reflection survey of the I&W, Inc. (I&W) facility located in Carlsbad, New Mexico (the site). The purpose of the survey was to collect data that would assist in the delineation of a subsurface cavern developed in the Salado salt by solution mining for commercial brine production. The survey consisted of four 2D seismic reflection lines comprising a total length of 4,228 feet. The survey was conducted between August 17 and 19, 2009.
The site-specific stratigraphic column contains three key units, in descending order:
alluvium (171 feet), Rustler Formation (285 feet), and the uppermost salt (112 feet) in the Salado Formation. The survey was designed to focus on the depth interval encompassing the upper Salado salt and the Rustler Formation. This stratigraphic interval occurs in the depth range of 330 feet to 610 feet below surface.
FINDINGS
The seismic data led to an interpretation of a pear-shaped cavern outline in plan view whose diameter is narrower at the north end of the site and wider beneath the southern part of the site. The larger apparent diameter of the cavern at the southern end may be attributable to the uncontrolled hydrofracturing from Eugenie #2 to Eugenie #1 and the later single-well mining from Eugenie #1.
The northernmost cavern effects are interpreted to extend beneath the on-ramp to Route 62
and the east-bound lanes of Highway 285. However, subsidence rates measured during May–September 2009 are small in the vicinity of the highways. Reconciliation of the seismic data and the subsidence rates suggests that if the cavern did extend as far north as interpreted, then significant closure of the cavern has already occurred in the vicinity of the highways.
Conversely, relatively high subsidence rates were detected over the southern limits of the
cavern where its diameter is interpreted to be larger. The area of greatest subsidence rates might extend beneath the irrigation canal. In this area, both the cavern edge and cavern subsidence network are poorly constrained. Consequently, future characterization efforts should focus on definition of the southern edge of the cavern and the possible effects of subsidence on the irrigation canal.
ii
RECOMMENDATIONS
Based upon the findings from the seismic reflection survey, RESPEC offers the following recommendations.
1. Conduct a supplemental 2D seismic reflection survey to the south of the I&W site.
2. Drill and complete a series of observation wells into and surrounding the cavern footprint interpreted from the 2D seismic data. For safety, wells into the cavern will be drilled by slant drill methods. Wells drilled outside the cavern footprint will be vertical borings to confirm relative stability of the ground area. Vertical boreholes will include at least one with continuous sampling of overburden and bedrock coring to total depth and a full suite of open-hole geophysical logs.
3. From any observation wells completed into the cavern, develop and implement a cavern monitoring system to track fluid levels and cavern roof migration.
4. Continue surface subsidence and tilt monitoring.
5. Refine the interpretations of seismic data as additional site-specific subsurface information becomes available from continuing site characterization work.
6. Use surface, subsurface, and early-warning system data to allow better engineering calculations of cavern size and stability and to further develop mitigation plans.
7. Initiate a feasibility study of mitigation methods because the seismic survey interprets a large cavern span and open void, particularly on the southern end.
iii
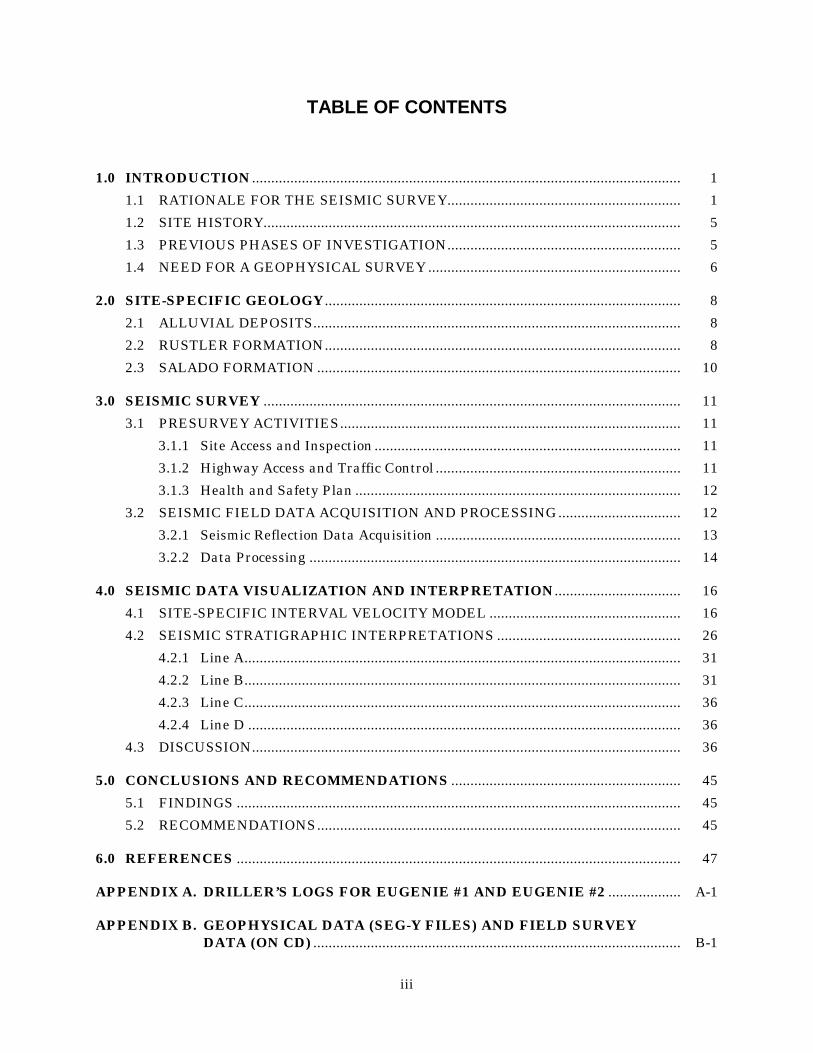
TABLE OF CONTENTS
1.0 INTRODUCTION ................................................................................................................ 1 1.1 RATIONALE FOR THE SEISMIC SURVEY............................................................. 1 1.2 SITE HISTORY............................................................................................................. 5 1.3 PREVIOUS PHASES OF INVESTIGATION............................................................. 5 1.4 NEED FOR A GEOPHYSICAL SURVEY .................................................................. 6
3.1.1 Site Access and Inspection ................................................................................ 11 3.1.2 Highway Access and Traffic Control ................................................................ 11 3.1.3 Health and Safety Plan ..................................................................................... 12
3.2 SEISMIC FIELD DATA ACQUISITION AND PROCESSING................................ 12 3.2.1 Seismic Reflection Data Acquisition ................................................................ 13 3.2.2 Data Processing ................................................................................................. 14
4.0 SEISMIC DATA VISUALIZATION AND INTERPRETATION................................. 16 4.1 SITE-SPECIFIC INTERVAL VELOCITY MODEL .................................................. 16 4.2 SEISMIC STRATIGRAPHIC INTERPRETATIONS ................................................ 26
4.2.1 Line A.................................................................................................................. 31 4.2.2 Line B.................................................................................................................. 31 4.2.3 Line C.................................................................................................................. 36 4.2.4 Line D ................................................................................................................. 36
APPENDIX A. DRILLER’S LOGS FOR EUGENIE #1 AND EUGENIE #2 ................... A-1
APPENDIX B. GEOPHYSICAL DATA (SEG-Y FILES) AND FIELD SURVEY DATA (ON CD) ................................................................................................ B-1
iv
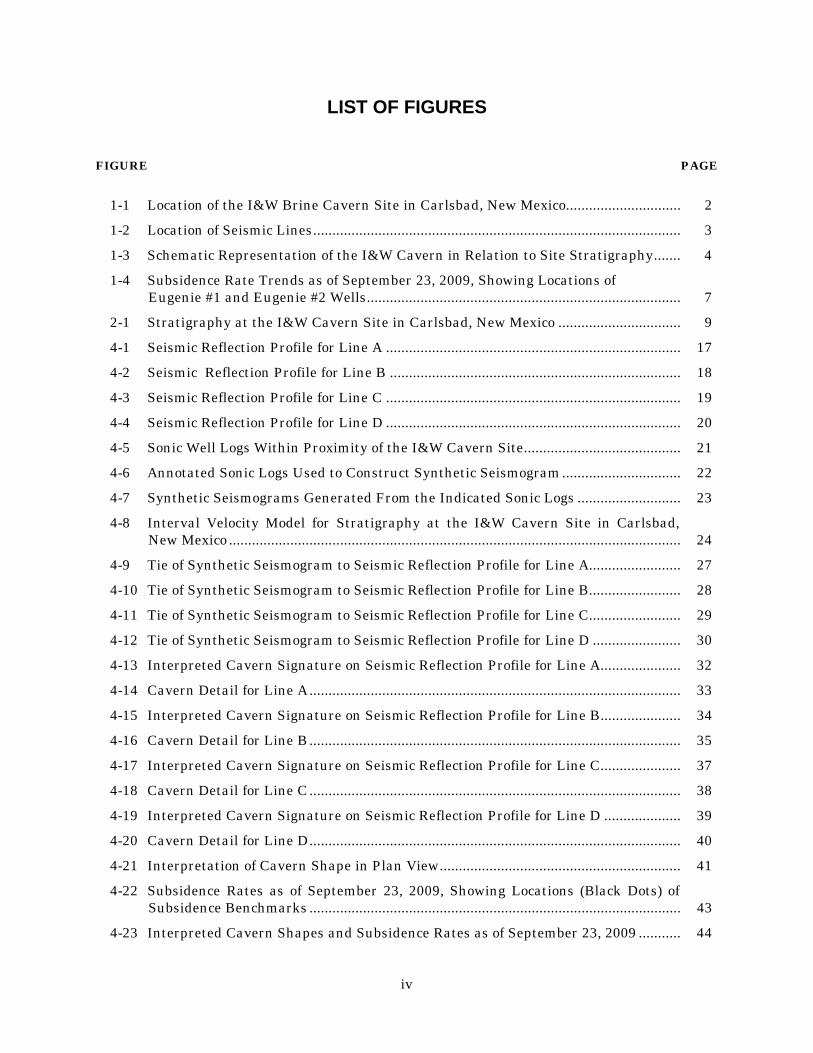
LIST OF FIGURES
FIGURE PAGE
1-1 Location of the I&W Brine Cavern Site in Carlsbad, New Mexico.............................. 2
1-2 Location of Seismic Lines................................................................................................ 3
1-3 Schematic Representation of the I&W Cavern in Relation to Site Stratigraphy....... 4
1-4 Subsidence Rate Trends as of September 23, 2009, Showing Locations of Eugenie #1 and Eugenie #2 Wells.................................................................................. 7
2-1 Stratigraphy at the I&W Cavern Site in Carlsbad, New Mexico ................................ 9
4-1 Seismic Reflection Profile for Line A ............................................................................. 17
4-2 Seismic Reflection Profile for Line B ............................................................................ 18
4-3 Seismic Reflection Profile for Line C ............................................................................. 19
4-4 Seismic Reflection Profile for Line D ............................................................................. 20
4-5 Sonic Well Logs Within Proximity of the I&W Cavern Site......................................... 21
4-6 Annotated Sonic Logs Used to Construct Synthetic Seismogram............................... 22
4-7 Synthetic Seismograms Generated From the Indicated Sonic Logs ........................... 23
4-8 Interval Velocity Model for Stratigraphy at the I&W Cavern Site in Carlsbad, New Mexico ...................................................................................................................... 24
4-9 Tie of Synthetic Seismogram to Seismic Reflection Profile for Line A........................ 27
4-10 Tie of Synthetic Seismogram to Seismic Reflection Profile for Line B........................ 28
4-11 Tie of Synthetic Seismogram to Seismic Reflection Profile for Line C........................ 29
4-12 Tie of Synthetic Seismogram to Seismic Reflection Profile for Line D ....................... 30
4-13 Interpreted Cavern Signature on Seismic Reflection Profile for Line A..................... 32
4-14 Cavern Detail for Line A................................................................................................. 33
4-15 Interpreted Cavern Signature on Seismic Reflection Profile for Line B..................... 34
4-16 Cavern Detail for Line B................................................................................................. 35
4-17 Interpreted Cavern Signature on Seismic Reflection Profile for Line C..................... 37
4-18 Cavern Detail for Line C................................................................................................. 38
4-19 Interpreted Cavern Signature on Seismic Reflection Profile for Line D .................... 39
4-20 Cavern Detail for Line D................................................................................................. 40
4-21 Interpretation of Cavern Shape in Plan View............................................................... 41
4-22 Subsidence Rates as of September 23, 2009, Showing Locations (Black Dots) of Subsidence Benchmarks ................................................................................................. 43
4-23 Interpreted Cavern Shapes and Subsidence Rates as of September 23, 2009 ........... 44
1
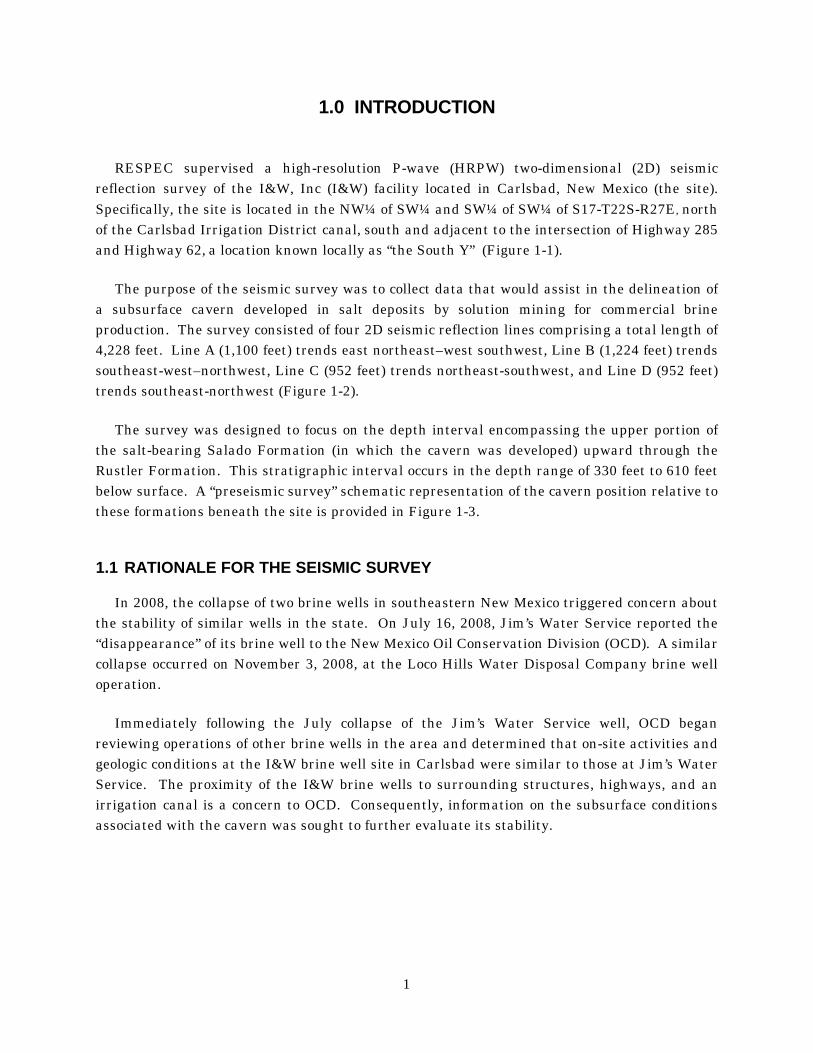
1.0 INTRODUCTION
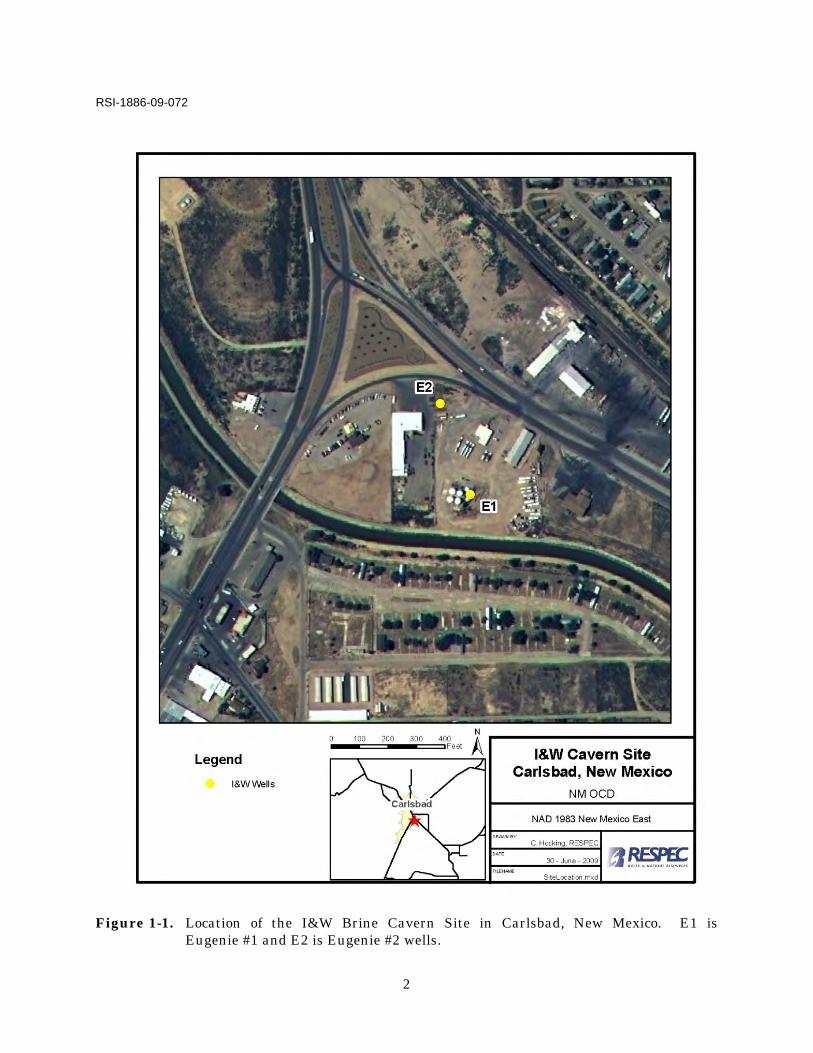
RESPEC supervised a high-resolution P-wave (HRPW) two-dimensional (2D) seismic reflection survey of the I&W, Inc (I&W) facility located in Carlsbad, New Mexico (the site). Specifically, the site is located in the NW¼ of SW¼ and SW¼ of SW¼ of S17-T22S-R27E, north of the Carlsbad Irrigation District canal, south and adjacent to the intersection of Highway 285 and Highway 62, a location known locally as “the South Y” (Figure 1-1).
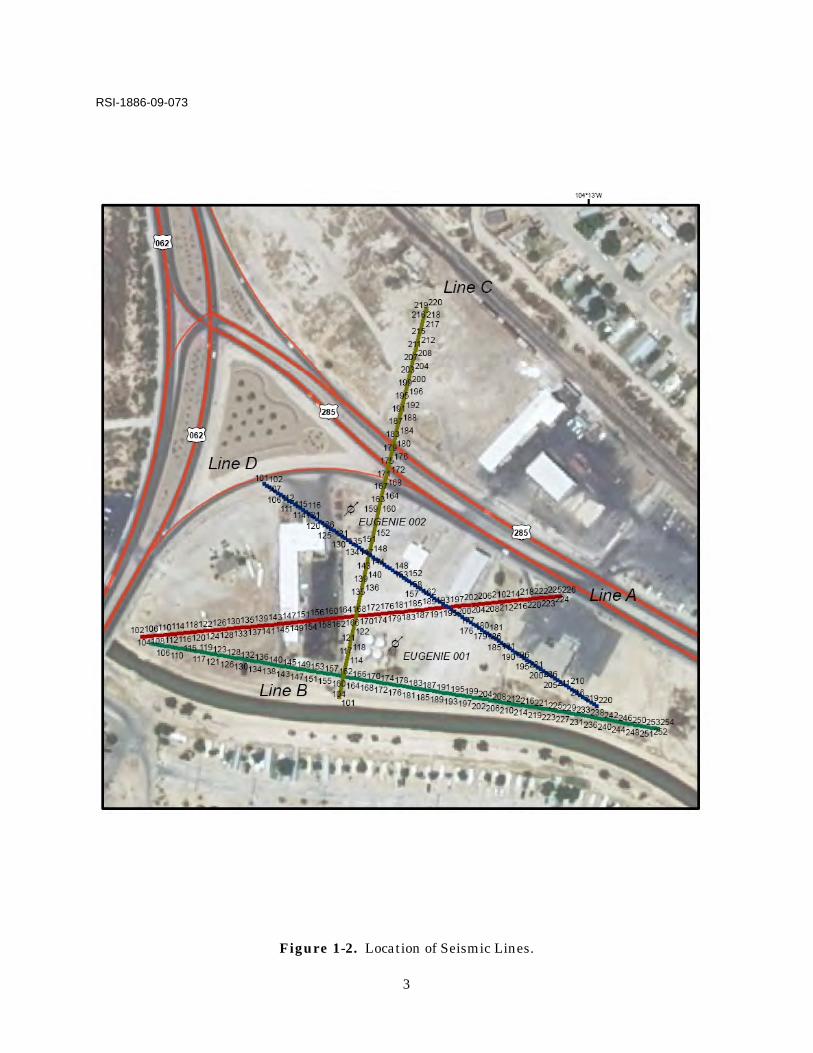
The purpose of the seismic survey was to collect data that would assist in the delineation of a subsurface cavern developed in salt deposits by solution mining for commercial brine production. The survey consisted of four 2D seismic reflection lines comprising a total length of 4,228 feet. Line A (1,100 feet) trends east northeast–west southwest, Line B (1,224 feet) trends southeast-west–northwest, Line C (952 feet) trends northeast-southwest, and Line D (952 feet) trends southeast-northwest (Figure 1-2).
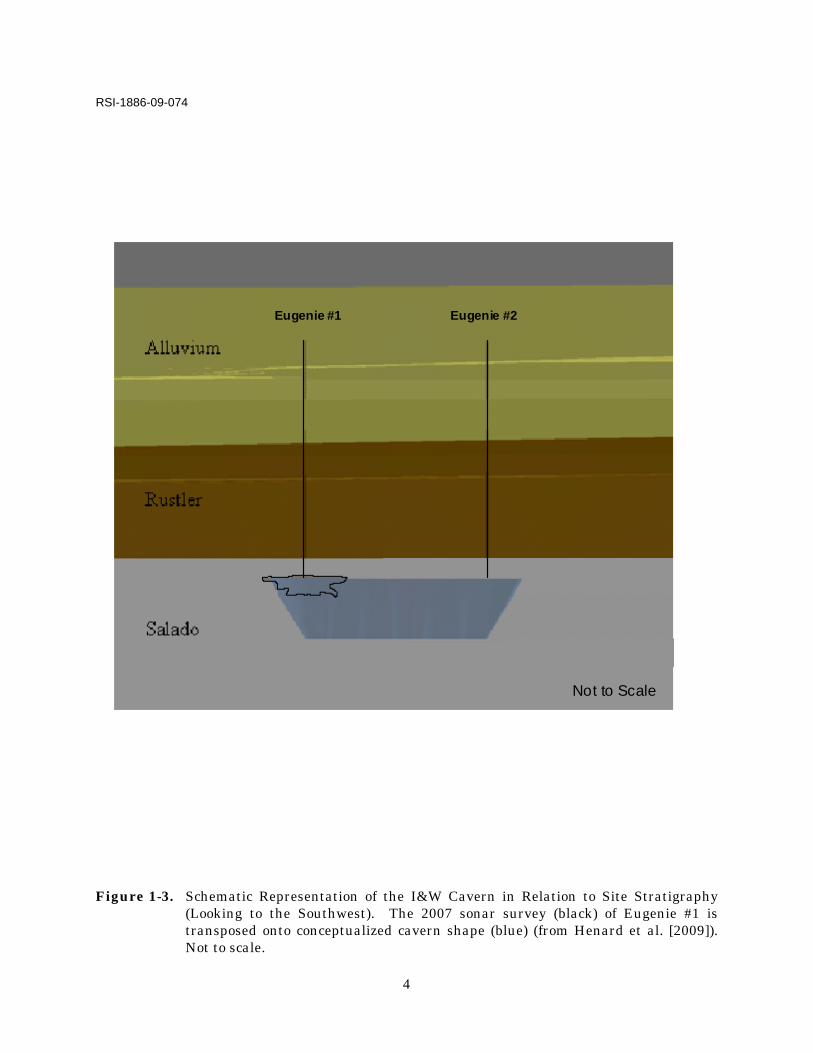
The survey was designed to focus on the depth interval encompassing the upper portion of the salt-bearing Salado Formation (in which the cavern was developed) upward through the Rustler Formation. This stratigraphic interval occurs in the depth range of 330 feet to 610 feet below surface. A “preseismic survey” schematic representation of the cavern position relative to these formations beneath the site is provided in Figure 1-3.
1.1 RATIONALE FOR THE SEISMIC SURVEY
In 2008, the collapse of two brine wells in southeastern New Mexico triggered concern about the stability of similar wells in the state. On July 16, 2008, Jim’s Water Service reported the “disappearance” of its brine well to the New Mexico Oil Conservation Division (OCD). A similar collapse occurred on November 3, 2008, at the Loco Hills Water Disposal Company brine well operation.
Immediately following the July collapse of the Jim’s Water Service well, OCD began reviewing operations of other brine wells in the area and determined that on-site activities and geologic conditions at the I&W brine well site in Carlsbad were similar to those at Jim’s Water Service. The proximity of the I&W brine wells to surrounding structures, highways, and an irrigation canal is a concern to OCD. Consequently, information on the subsurface conditions associated with the cavern was sought to further evaluate its stability.
2
RSI-1886-09-072
Figure 1-1. Location of the I&W Brine Cavern Site in Carlsbad, New Mexico. E1 is Eugenie #1 and E2 is Eugenie #2 wells.
3
RSI-1886-09-073
Figure 1-2. Location of Seismic Lines.
4
RSI-1886-09-074
Figure 1-3. Schematic Representation of the I&W Cavern in Relation to Site Stratigraphy (Looking to the Southwest). The 2007 sonar survey (black) of Eugenie #1 is transposed onto conceptualized cavern shape (blue) (from Henard et al. [2009]). Not to scale.
Eugenie #1 Eugenie #2
Not to Scale
Eugenie #1 Eugenie #2
Not to Scale
5
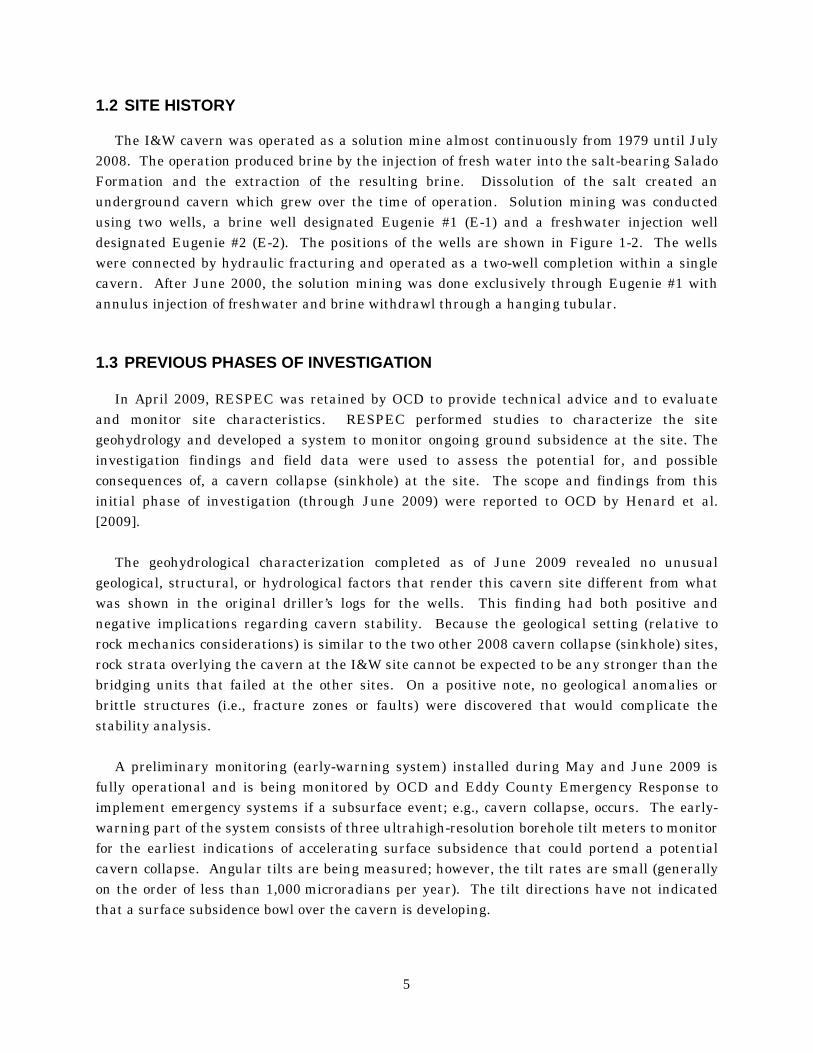
1.2 SITE HISTORY
The I&W cavern was operated as a solution mine almost continuously from 1979 until July 2008. The operation produced brine by the injection of fresh water into the salt-bearing Salado Formation and the extraction of the resulting brine. Dissolution of the salt created an underground cavern which grew over the time of operation. Solution mining was conducted using two wells, a brine well designated Eugenie #1 (E-1) and a freshwater injection well designated Eugenie #2 (E-2). The positions of the wells are shown in Figure 1-2. The wells were connected by hydraulic fracturing and operated as a two-well completion within a single cavern. After June 2000, the solution mining was done exclusively through Eugenie #1 with annulus injection of freshwater and brine withdrawl through a hanging tubular.
1.3 PREVIOUS PHASES OF INVESTIGATION
In April 2009, RESPEC was retained by OCD to provide technical advice and to evaluate and monitor site characteristics. RESPEC performed studies to characterize the site geohydrology and developed a system to monitor ongoing ground subsidence at the site. The investigation findings and field data were used to assess the potential for, and possible consequences of, a cavern collapse (sinkhole) at the site. The scope and findings from this initial phase of investigation (through June 2009) were reported to OCD by Henard et al. [2009].
The geohydrological characterization completed as of June 2009 revealed no unusual
geological, structural, or hydrological factors that render this cavern site different from what was shown in the original driller’s logs for the wells. This finding had both positive and negative implications regarding cavern stability. Because the geological setting (relative to rock mechanics considerations) is similar to the two other 2008 cavern collapse (sinkhole) sites, rock strata overlying the cavern at the I&W site cannot be expected to be any stronger than the bridging units that failed at the other sites. On a positive note, no geological anomalies or brittle structures (i.e., fracture zones or faults) were discovered that would complicate the stability analysis.
A preliminary monitoring (early-warning system) installed during May and June 2009 is
fully operational and is being monitored by OCD and Eddy County Emergency Response to implement emergency systems if a subsurface event; e.g., cavern collapse, occurs. The early-warning part of the system consists of three ultrahigh-resolution borehole tilt meters to monitor for the earliest indications of accelerating surface subsidence that could portend a potential cavern collapse. Angular tilts are being measured; however, the tilt rates are small (generally on the order of less than 1,000 microradians per year). The tilt directions have not indicated that a surface subsidence bowl over the cavern is developing.
6
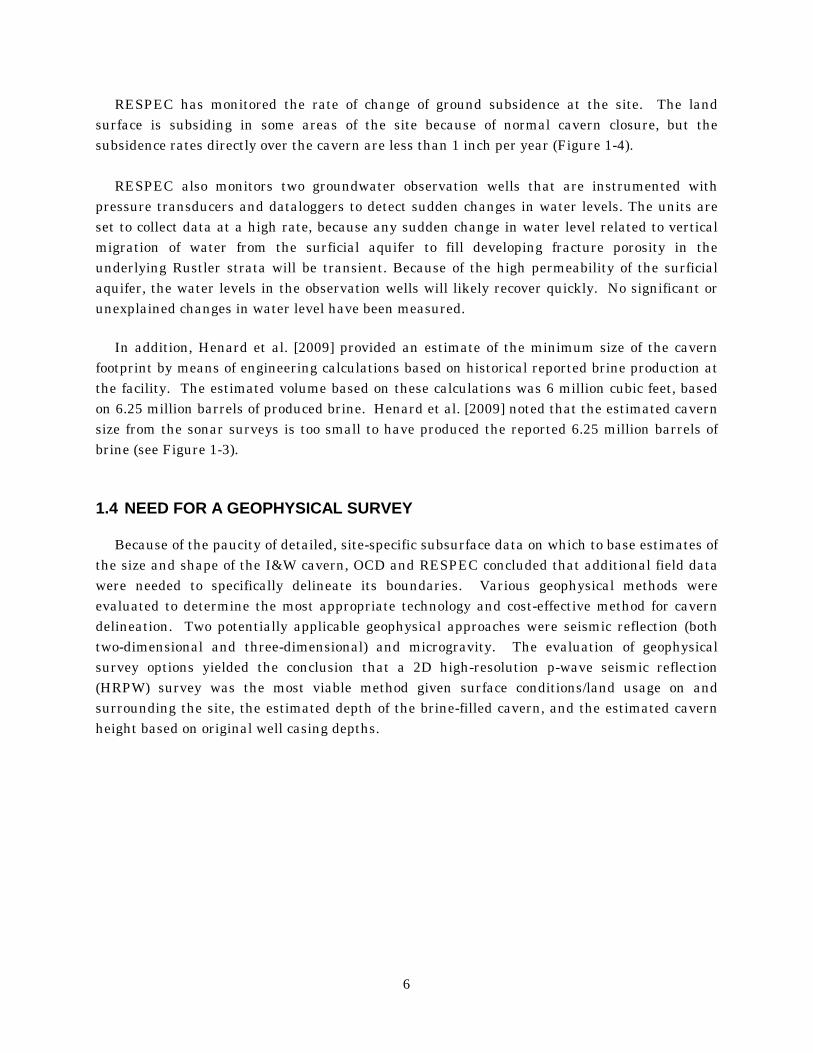
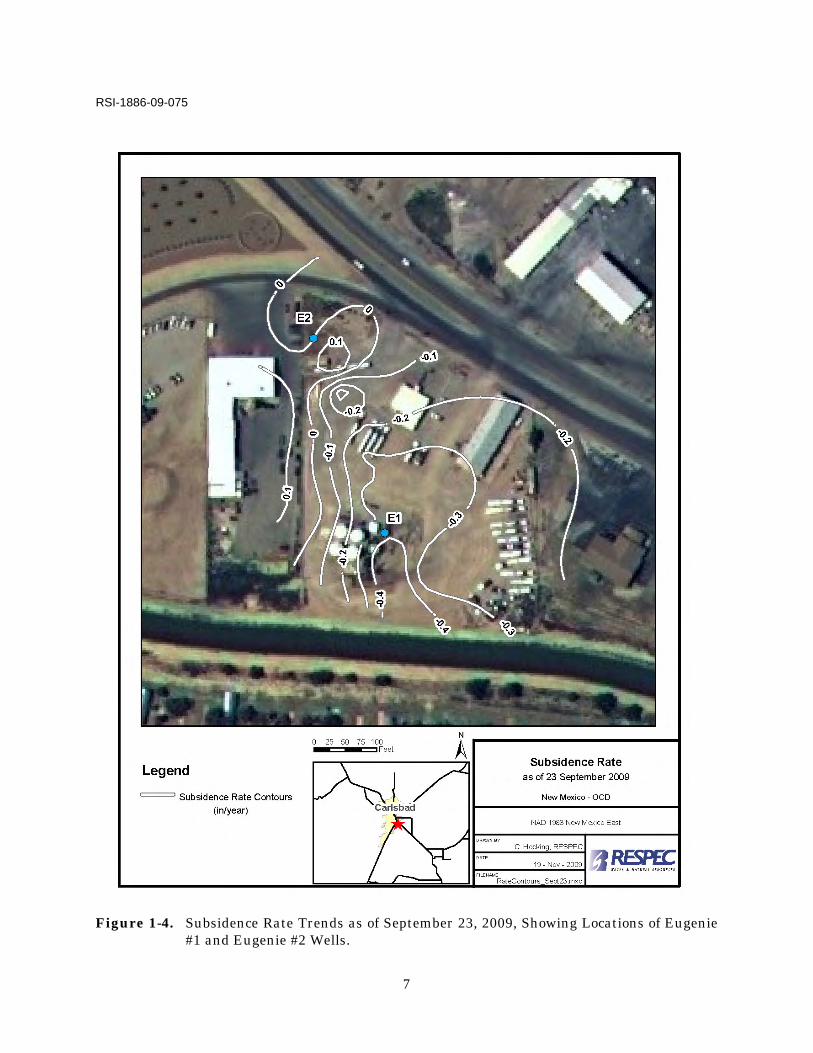
RESPEC has monitored the rate of change of ground subsidence at the site. The land surface is subsiding in some areas of the site because of normal cavern closure, but the subsidence rates directly over the cavern are less than 1 inch per year (Figure 1-4).
RESPEC also monitors two groundwater observation wells that are instrumented with
pressure transducers and dataloggers to detect sudden changes in water levels. The units are set to collect data at a high rate, because any sudden change in water level related to vertical migration of water from the surficial aquifer to fill developing fracture porosity in the underlying Rustler strata will be transient. Because of the high permeability of the surficial aquifer, the water levels in the observation wells will likely recover quickly. No significant or unexplained changes in water level have been measured.
In addition, Henard et al. [2009] provided an estimate of the minimum size of the cavern footprint by means of engineering calculations based on historical reported brine production at the facility. The estimated volume based on these calculations was 6 million cubic feet, based on 6.25 million barrels of produced brine. Henard et al. [2009] noted that the estimated cavern size from the sonar surveys is too small to have produced the reported 6.25 million barrels of brine (see Figure 1-3).
1.4 NEED FOR A GEOPHYSICAL SURVEY
Because of the paucity of detailed, site-specific subsurface data on which to base estimates of the size and shape of the I&W cavern, OCD and RESPEC concluded that additional field data were needed to specifically delineate its boundaries. Various geophysical methods were evaluated to determine the most appropriate technology and cost-effective method for cavern delineation. Two potentially applicable geophysical approaches were seismic reflection (both two-dimensional and three-dimensional) and microgravity. The evaluation of geophysical survey options yielded the conclusion that a 2D high-resolution p-wave seismic reflection (HRPW) survey was the most viable method given surface conditions/land usage on and surrounding the site, the estimated depth of the brine-filled cavern, and the estimated cavern height based on original well casing depths.
7
RSI-1886-09-075
Figure 1-4. Subsidence Rate Trends as of September 23, 2009, Showing Locations of Eugenie #1 and Eugenie #2 Wells.
8
2.0 SITE-SPECIFIC GEOLOGY
Figure 1-3 provided a simplified illustration of the geology and caverns at the I&W site. As illustrated, the site-specific geology includes three key units. In descending order, they are the near-surface alluvium, the Rustler Formation, and the Salado Formation.
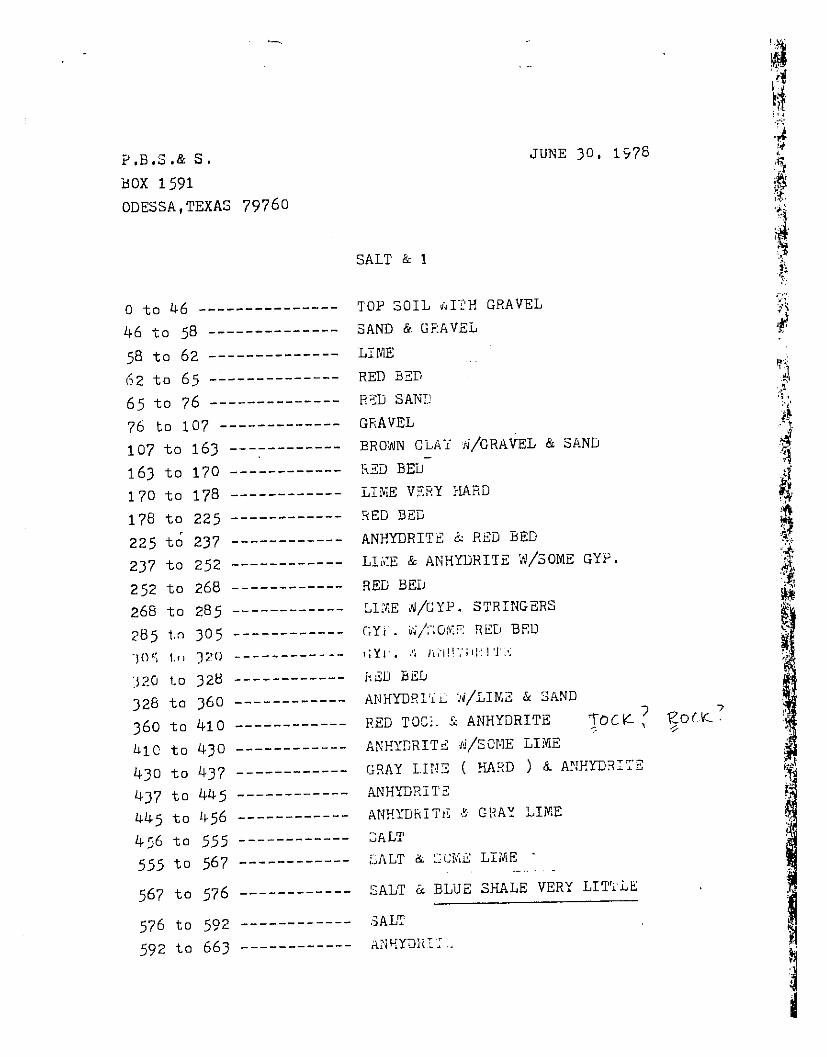
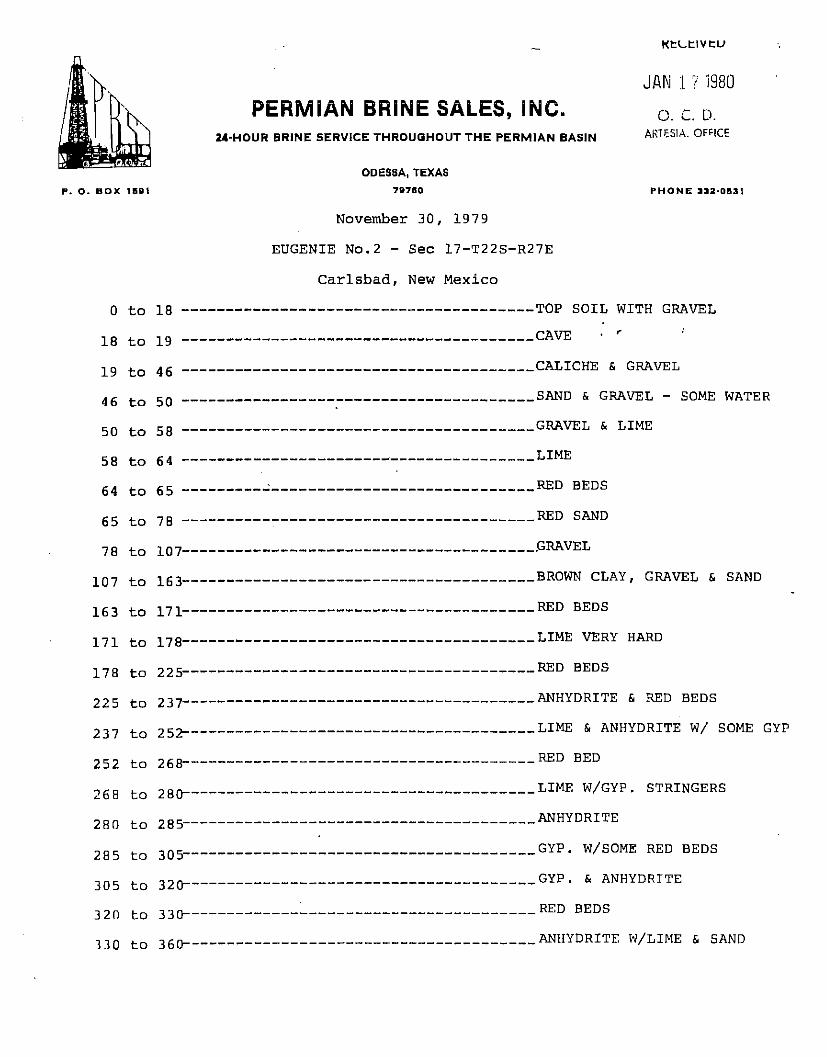
A detailed stratigraphic column for the site was developed based on the driller’s log for wells
Eugenie #1 and Eugenie #2 (Figure 2-1). The driller’s logs are provided in Appendix A. It should be noted that the reliability of these logs is unconfirmed; driller’s logs usually do not accurately describe the site stratigraphy and rock types. There are no known geophysical logs or core samples available for the on-site wells; therefore, the driller’s logs are the sole source of stratigraphic information for the site.
2.1 ALLUVIAL DEPOSITS
Alluvial deposits at the site are approximately 171 feet thick and consist of gravel, sand, and silt with beds of caliche and limestone conglomerate. These stratified sediments were deposited primarily by the Pecos River and its tributaries, but some wind-transported (aeolian) sediments may be intercalated.
The stratigraphic column of alluvium at the site (see Figure 2-1) is divisible into upper and
lower units of differing mineral composition and cementation. The upper 64 feet of the alluvium at the site are caliche and carbonate rich. The lower 107 feet are described as primarily sand and gravel. Given the calcareous nature of the upper interval, it may be denser than the lower sand- and gravel-dominated unit. This difference in cementation may be a consequence of vadose zone versus phreatic zone hydrological processes.
The depth to the water table in the on-site observation wells that are screened in the
alluvium was about 50 feet below ground surface (bgs) during May–June 2009. Hence, a significant portion of the upper “hard pan” (caliche- and carbonate-rich) unit occurs above the water table. Therefore, the vadoze zone carbonate content may be largely in the form of intragranular cement.
2.2 RUSTLER FORMATION
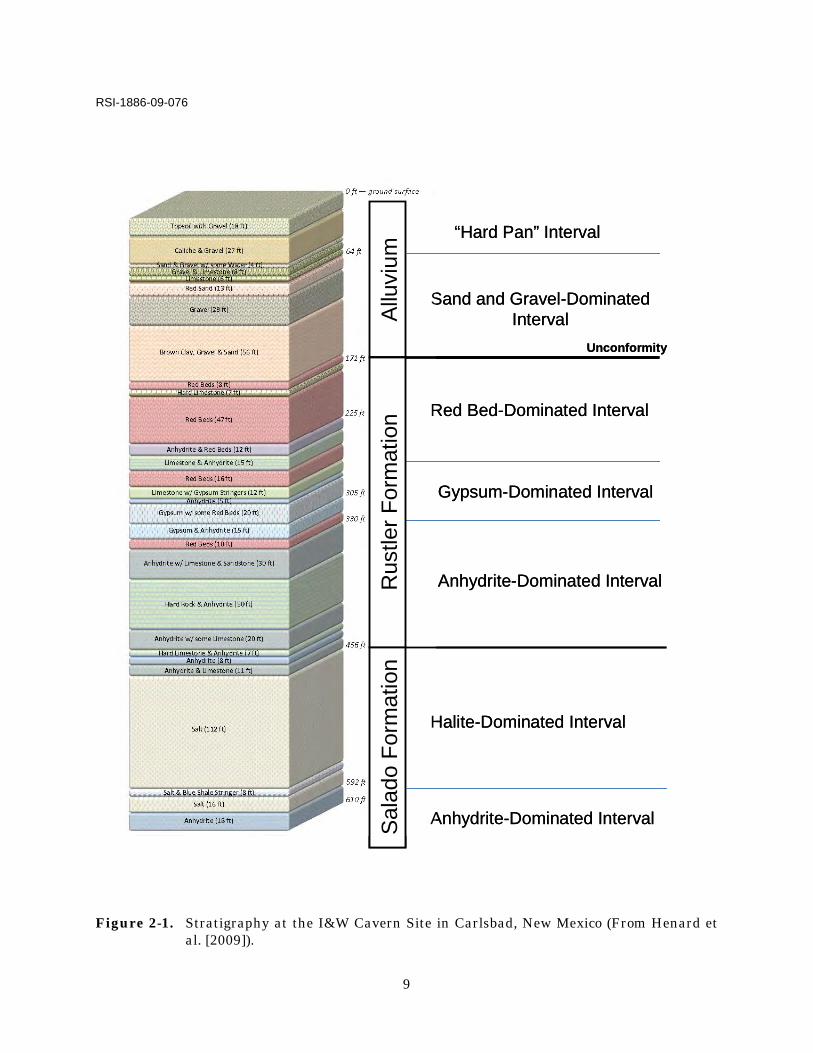
Because of pre-Quaternary erosion, only the lower half of the stratigraphically complete Rustler Formation is preserved beneath the site; the upper half of the Rustler Formation is missing at the unconformity beneath the surficial alluvial deposits (see Figure 2-1). The site-specific section of the Rustler Formation is approximately 285 feet thick and occurs at a depth from 171 to 456 feet bgs.
9
RSI-1886-09-076
Figure 2-1. Stratigraphy at the I&W Cavern Site in Carlsbad, New Mexico (From Henard et al. [2009]).
Allu
vium
Unconformity
Rus
tler
For
mat
ion
Sal
ado
For
mat
ion
Red Bed-Dominated Interval
Gypsum-Dominated Interval
Anhydrite-Dominated Interval
Halite-Dominated Interval
Anhydrite-Dominated Interval
Sand and Gravel-Dominated Interval
“Hard Pan” Interval
Allu
vium
Unconformity
Rus
tler
For
mat
ion
Sal
ado
For
mat
ion
Red Bed-Dominated Interval
Gypsum-Dominated Interval
Anhydrite-Dominated Interval
Halite-Dominated Interval
Anhydrite-Dominated Interval
Sand and Gravel-Dominated Interval
“Hard Pan” Interval
10
The site-specific section of the Rustler Formation is divisible into three intervals that are dominated by different lithologies. In descending order, these predominant lithologies are red beds, gypsum, and anhydrite (see Figure 2-1). The red bed-dominated interval is 105 feet thick; it occurs from the top of the bedrock at 171 feet down to 276 feet bgs. The red bed interval contains subordinate limestone and anhydrite intervals.
The gypsum-dominated interval is 54 feet thick; it occurs from 276 feet to 330 feet bgs. The
gypsum-dominated interval contains subordinate red bed and anhydrite intervals. The presence of gypsum, instead of exclusively anhydrite, in this interval suggests retrograde hydration of the sulfates by modern groundwater.
The anhydrite-dominated interval is 126 feet thick; it occurs from 330 feet to 456 feet and
directly overlies the uppermost salt bed of the Salado Formation. The anhydrite interval contains other stiff limestone and sandstone intervals.
2.3 SALADO FORMATION
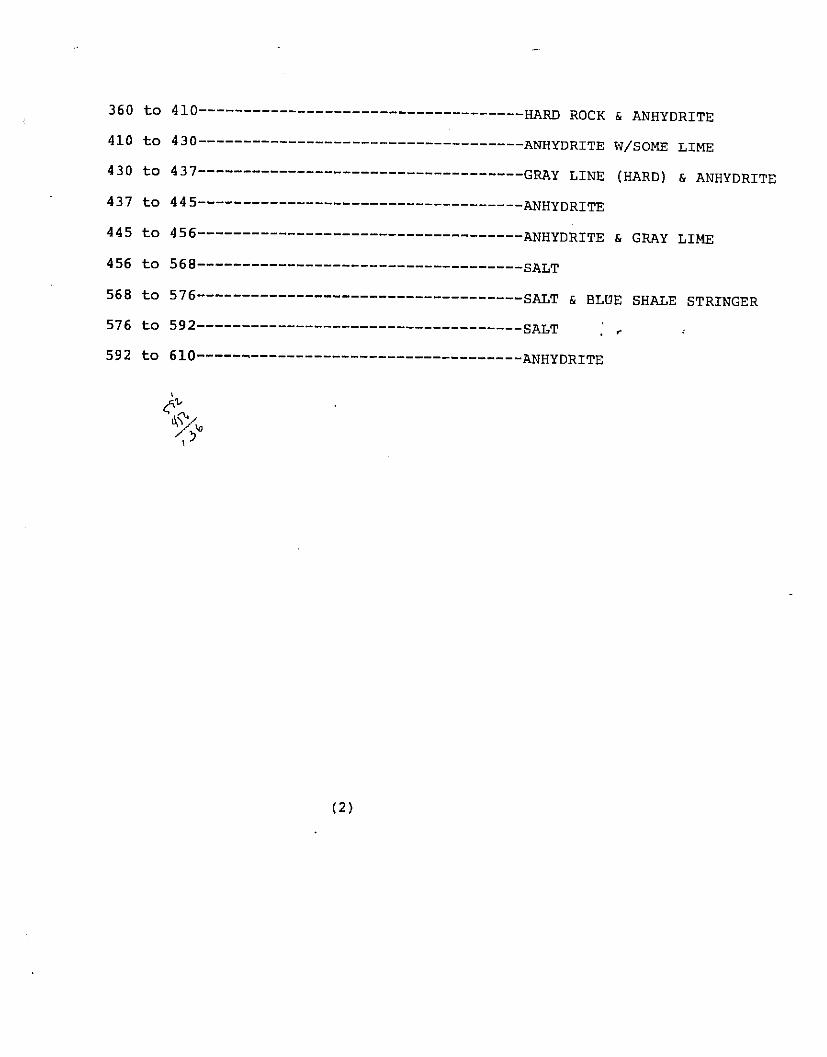
The top of the Salado Formation occurs at a depth of 456 feet bgs at the site. The driller’s log suggests that the upper 112 feet of the formation is a relatively pure salt interval. An 8-foot-thick bed of shaley salt, another 16 feet of pure salt, and an 18- to 71-foot-thick anhydrite bed occur in the Salado Formation beneath the zone of relatively pure salt. There is no site-specific stratigraphic information for the Salado sequence below the anhydrite bed. Based upon the drilling depths and the depths of the cemented casings in Wells Eugenie #1 and Eugenie #2, the cavern was intended to be developed in the uppermost salt interval of the Salado Formation, herein referred to as the target salt.
11
3.0 SEISMIC SURVEY
The 2D HRPW seismic reflection survey was conducted between August 17 and 19, 2009. Bay Geophysical of Traverse City, Michigan provided field data acquisition. Daniel Todd & Associates of Covington, Louisiana provided data processing services. Interpretation of the resultant data was provided by both Bay Geophysical and RESPEC with assistance from Hill Geophysical of Shreveport, Louisiana.
3.1 PRESURVEY ACTIVITIES
Before commencement of the 2D seismic survey, various activities were required to prepare the site for the study. Those preparations involved site access and inspection, highway access and traffic control, and development of a Health and Safety Plan.
3.1.1 Site Access and Inspection
In preparation for the 2D survey, Bay Geophysical determined the optimal locations of four lines, along which seismic data were to be collected. To provide sufficient coverage of the cavern (i.e., to maximize fold in the area of primary interest), the transect lines were extended beyond the boundaries of the I&W site. Therefore, RESPEC contacted the adjacent property owners to negotiate access to their properties as needed. Access was agreed to by all interested parties.
Following agreement on the layout of the survey lines, RESPEC and Bay Geophysical
conducted a site inspection to verify that there were no irresolvable obstructions to collection of data. A large pile of debris would interfere with the layout of Line B. Cleanup crews contracted by RESPEC hauled the debris to a landfill. Additionally, the brine well operator, I&W, removed truck wreckage and other scrap from the site.
Just before the seismic survey, RESPEC performed an informal survey of anticipated survey
line end points and a select number of proposed geophone positions. This survey was conducted using a Topcon GPT-9003A robotic total station, a backsite reflector, and a roving reflector. The field survey data are presented in Appendix B. These data were used to generate a plot of the proposed survey lines on the site plan in advance of the start of the seismic survey.
3.1.2 Highway Access and Traffic Control
The locations of Lines C and D had the potential to impact traffic flow on the access ramp from US Highway 62/180 northbound to US Highway 285 southbound. Therefore, RESPEC met with New Mexico Department of Transportation (NMDOT) District Engineers in Roswell and Carlsbad to discuss access and traffic control plans. NMDOT provided permission to
12
conduct survey activities along the access ramp from US Highway 62/180 to US Highway 285. In addition, NMDOT developed the traffic control plan and provided implementation of traffic control along the highway right-of-way.
The presurvey communication with NMDOT was crucial to the successful implementation of
the survey. During the 2D seismic work, OCD requested that Line C be extended northward, to more adequately define the northern extent of the cavern, across US Highway 62/180 to the US Highway 285 access ramp, continuing north across US Highway 285 north- and south-bound lanes and into land north of US Highway 285 (see Figure 1-2). NMDOT revised the traffic control plan allowing the closure of the north- and south-bound lanes and access ramp of US Highway 285, and rerouted all traffic to secondary roads during lane closures. The highway was reopened upon completion of the seismic data acquisition along Line C.
3.1.3 Health and Safety Plan
Before conducting the 2D HRPW seismic reflection survey, a site-specific Health and Safety Plan (HASP) was developed for implementation during the seismic reflection process. The plan provided measures and alerts to meet concerns of on-site workers. The HASP included the following:
• Designation of the Site Safety Officer
• Subjects for mandatory daily tailgate safety meetings and the Daily Personnel Site Safety Form
• Discussion of routine site hazards and procedures for minimizing risk
• Directions to the nearest emergency medical care and fire station
• Discussion of the special hazards posed by the brine cavern
• Emergency evacuation procedures
• Control to exclude access of any nonessential personnel to the site
• Other procedures and enforcement as deemed necessary by the Site Safety Officer,
The HASP was previously provided to the OCD as Appendix C of Henard et al. [2009].
3.2 SEISMIC FIELD DATA ACQUISITION AND PROCESSING
The 2D HRPW seismic reflection survey started on August 17, 2009, and was completed in 3 days. Bay Geophysical of Traverse City, Michigan, provided field data acquisition. Daniel Todd & Associates of Covington, Louisiana, provided data processing services.
13
3.2.1 Seismic Reflection Data Acquisition
The seismic source selected by Bay Geophysical was the EnviroVib II™ vibrator manufactured by Industrial Vehicles International (IVI). According to Bay Geophysical [2009], the EnviroVib II™ is a vibratory source capable of generating oscillatory harmonic waves ranging in frequency between 20–250 Hz and generates 10,000 pounds of force. However, both the frequency and applied force is site-dependent; the typical sweep signal frequency range is 12–250 Hz, as the controller software typically will report errors outside this range.
As acquisition contractor, Bay Geophysical recommended use of the EnviroVib II™ for the
following reasons:
• Ability to generate the high frequencies necessary to image shallow geologic horizons, as well as attenuate low frequencies, which are the main component of noise events, such as ground roll.
• Cost-effective data acquisition because of the ability to collect a large number of seismic records in a day.
• Lower sensitivity to ambient noise (i.e., traffic).
• Low environmental impact (no discernable noise, shock, or penetrations).
• Ability to image the target at the estimated depths.
A vibratory source functions by holding a plate on the ground and vibrating the plate through a user-defined range of frequencies. This is known as a “sweep.” The length of the sweep, peak force and frequency range can be changed during testing. Several tests were run to select or adjust the following parameters:
• Sweep starting and ending frequencies
• Sweep length
• Number of sweeps
• Output force.
Based upon initial field parameter testing of the Line A array, Bay Geophysical determined that collection of seismic data using 8-second sweeps with signal frequency ranging between 20 Hz and 200 Hz produced the optimal wiggle-trace clarity in the intended target depth range. The recording system selected by Bay was the ION ARAM system, capable of recording 1,200 channels with sampling rates of 1 millisecond (ms). The Oyo Geospace 40 Hz geophones were spaced every 8 feet along the seismic lines. The raw (unprocessed) field data collected by Bay Geophysical are preserved on a CD in Appendix B of this report.
14
3.2.2 Data Processing
The data processing was performed by Daniel Todd & Associates of Covington, Louisiana. Several iterations of processing were performed in an effort to improve the quality of seismic profiles for purposes of delineating the I&W cavern. The processed data are included on the CD provided in Appendix B of this report. Summaries of the prestack migration and postmigration processing sequences and processing parameters are presented below.
Prestack Migration
• SEG-Y read
• Geometry application
• Record quality control and trace edit
• Apply elevation and datum statics: 3,100 feet datum
• 7,000 feet per second correctional velocity
• True amplitude recovery
• Surface consistent scaling
• Surface consistent deconvolution
• Bandpass filter: 3-20-200-240
• Trace scaling: AGC
• Velocity analysis
• Normal moveout correction
• Mute
• Surface consistent statics
• Velocity analysis
• Residual statics
• Prestack Kirchhoff migration
• CDP stack
• Bandpass filter: 3-20-200-240.
Poststack Migration With Noise Reduction
• SEG-Y read
• Geometry application
15
• Record quality control and trace edit
• Apply elevation and datum statics: 3,100 feet datum,
• 7,000 feet per second correctional velocity
• True amplitude recovery
• Surface consistent scaling
• Surface consistent deconvolution
• Bandpass filter: 3-20-200-240
• Trace scaling: AGC
• Velocity analysis
• Normal moveout correction
• Mute
• Surface consistent statics
• Velocity analysis
• Residual statics
• CDP stack
• Noise reduction: fxdecon
• Migration
• Bandpass filter: 3-20-200-240
• Trace scaling: trace equalization.
16
4.0 SEISMIC DATA VISUALIZATION AND INTERPRETATION
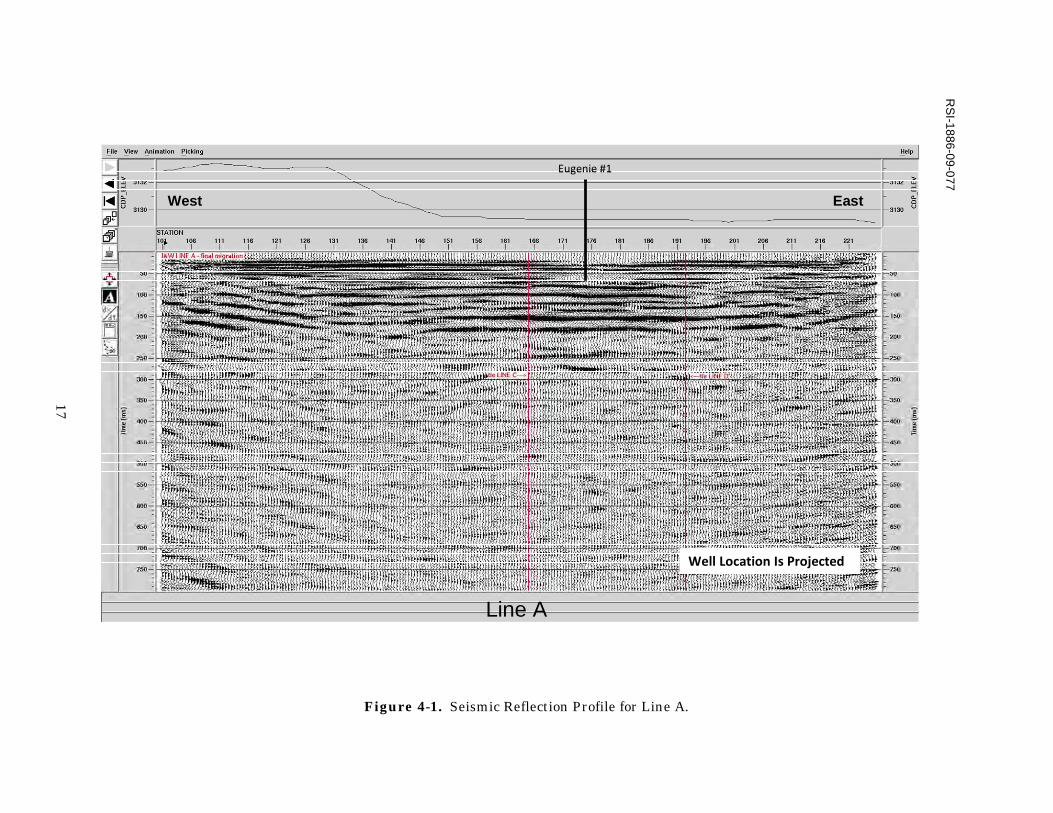
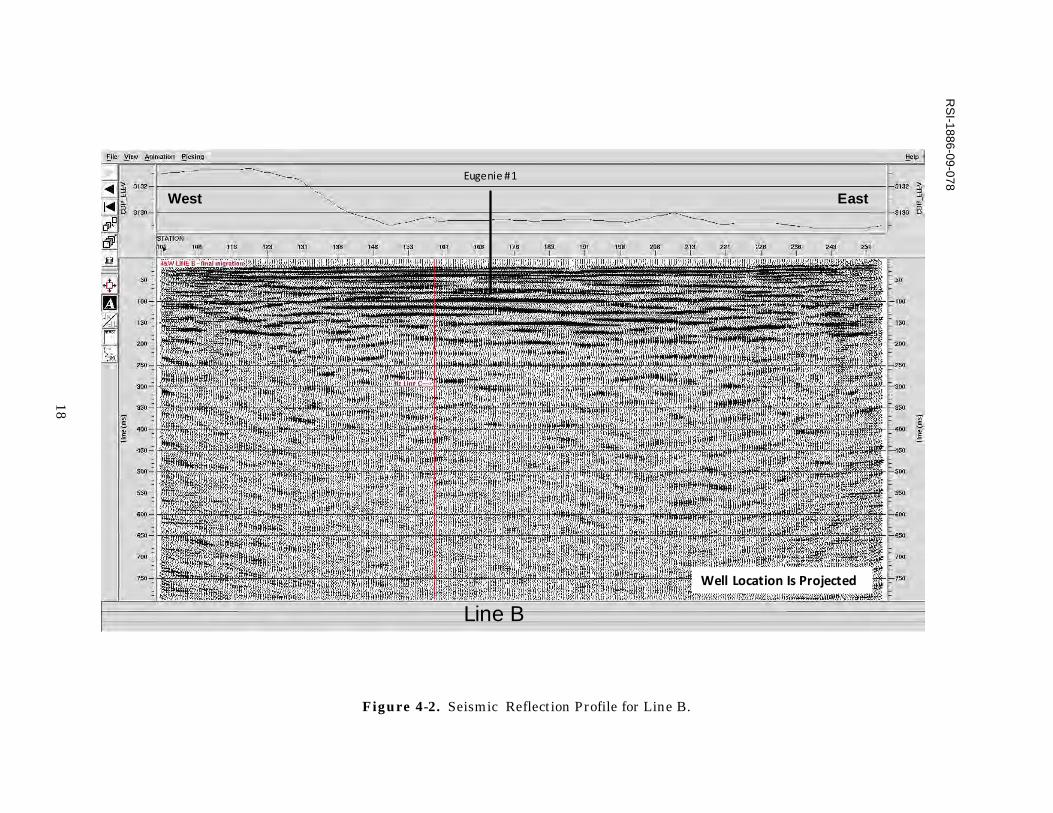
The locations of the 2D seismic reflection survey lines were shown in Figure 1-2. The seismic profiles generated for the survey lines are presented in Figures 4-1 through 4-4.
The displays of the seismic data included in this report are vertical profiles. Vertical profiles
are presented with distance along the x-axis and two-way travel time (TWT) on the y-axis (Figures 4-1 through 4-4). The x-axis is scaled according to shot point number. Line intersection points are also labeled.
4.1 SITE-SPECIFIC INTERVAL VELOCITY MODEL
TWT on the profiles in Figures 4-1 through 4-4 is recorded in milliseconds. The actual depth below ground surface (bgs) and which geologic units are actually covered within a certain TWT depth interval are typically determined by correlation of the profiles with a synthetic seismogram. Normally, velocity and density logs are imported into a software package that converts known interval velocity and density data whose depths are expressed in feet into a vertical column of simulated seismic reflectors whose equivalent depths are expressed in TWT (seconds or milliseconds). The synthetic seismogram, thus, becomes the “Rosetta Stone” that allows translation of TWT into depths and seismic data into geologic information.
Neither of the two on-site wells had downhole geophysical logging. Consequently, no sonic
or density logs are available for the site by which to generate a synthetic seismogram to tie the seismic data to the site-specific stratigraphy. The lack of a site-specific synthetic seismogram limits the degree of confidence in correlating site-specific geologic units to the seismic data. Consequently, RESPEC recommends that a geophysical logging suite, including sonic and density, be conducted on at least one future well drilled at the site. In addition, if open-hole sonic and density logging of the alluvium is not practical because of its unconsolidated nature, then a seismic refraction study, a down-hole check shot seismic survey, or some other means, is needed to measure the alluvium velocity.
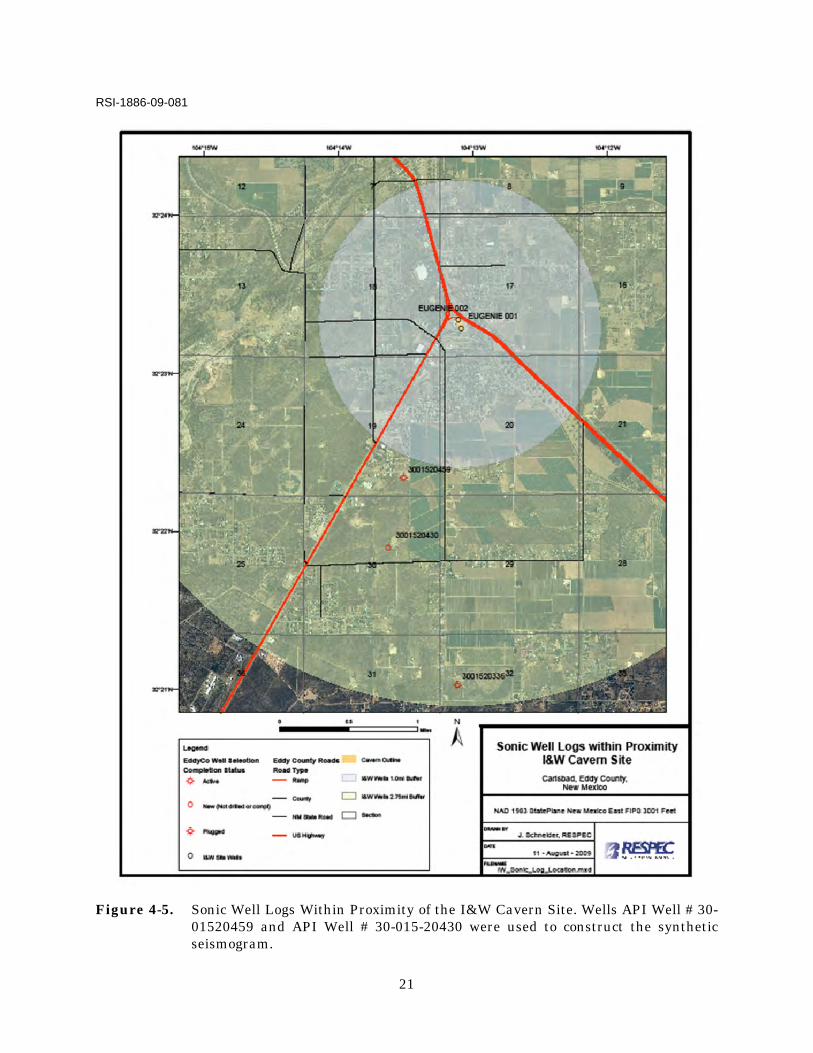
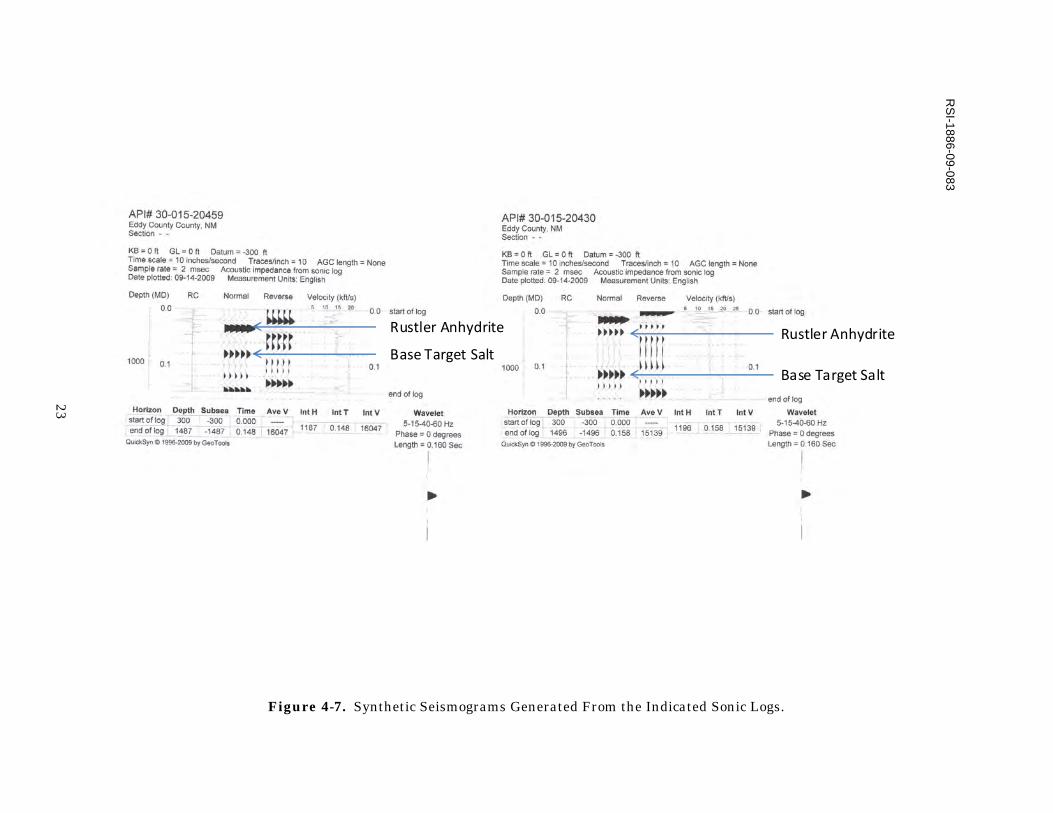
Because there were no site-specific sonic and density logs, sonic logs from two wells (API
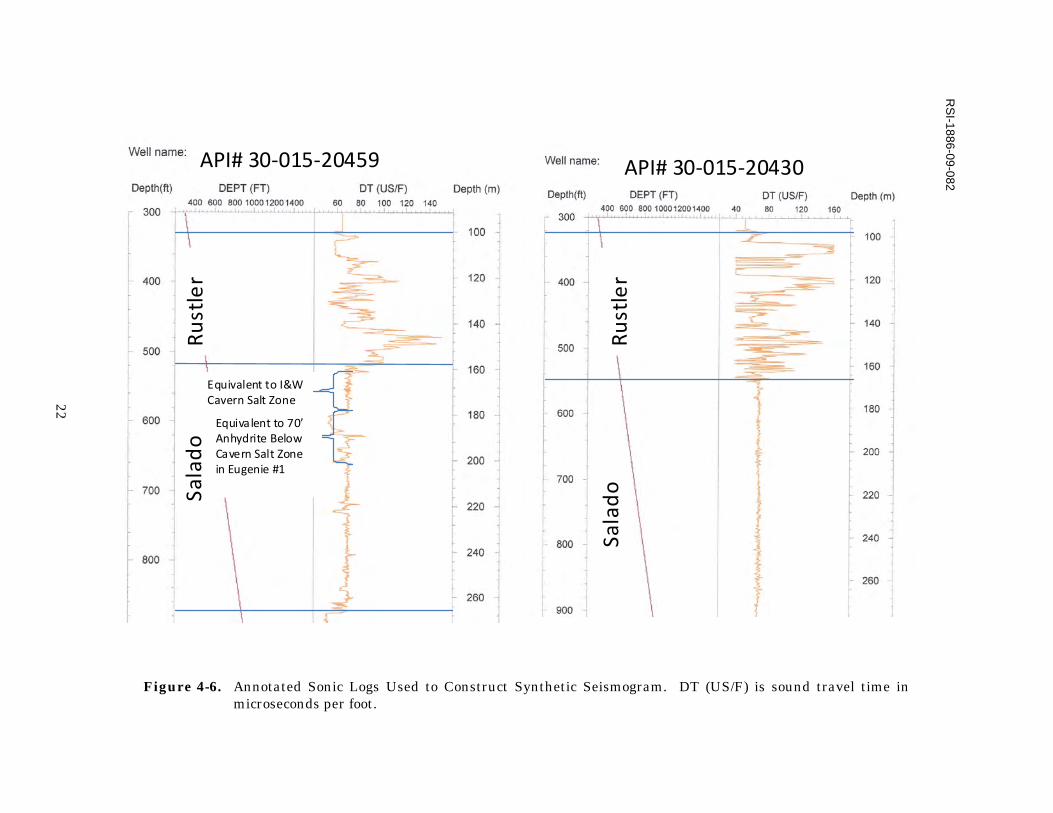
Well # 30-015-20430 and API Well # 30-015-20459) located about 2 miles south of the site were used to generate synthetic seismograms for this study (Figure 4-5). The annotated velocity logs are shown in Figure 4-6 and the synthetic seismograms generated from these logs, using Rockware Synseis software, are shown in Figure 4-7. Although these off-site wells are cased to a depth of 300 feet, the logs provide some information on the velocities for the Rustler and Salado Formations that were the focus of the investigation. Despite these limitations, these off-site logs were used to develop an interval velocity model for the on-site stratigraphic column (Figure 4-8) and to provide reasonable geologic interpretations of the seismic data.
Figure 4-1. Seismic Reflection Profile for Line A.
RS
I-1886-09-077
17
Eugenie #1
Well Location Is Projected
West East
Line A
Eugenie #1
Well Location Is Projected
West East
Line A
Figure 4-2. Seismic Reflection Profile for Line B.
RS
I-1886-09-078
18
Eugenie #1
Line B
Well Location Is Projected
West East
Eugenie #1
Line B
Well Location Is Projected
West East
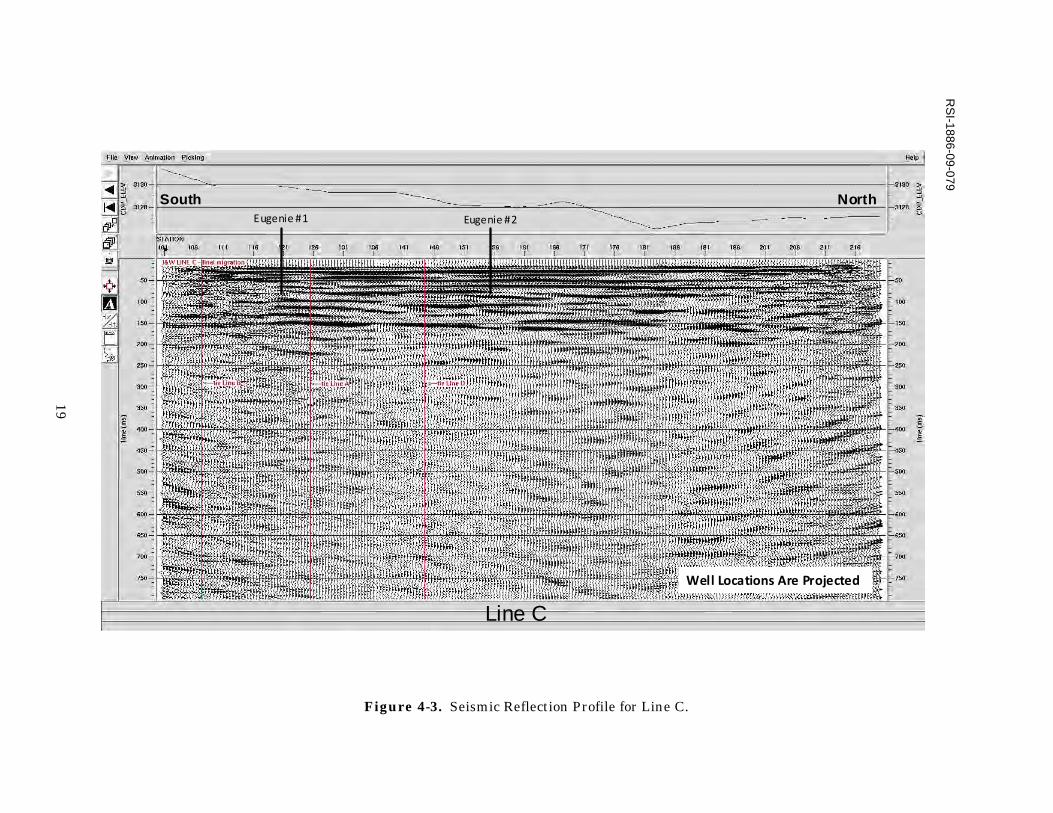
Figure 4-3. Seismic Reflection Profile for Line C.
RS
I-1886-09-079
19
Eugenie #1 Eugenie #2
NorthSouth
Line C
Well Locations Are Projected
Eugenie #1 Eugenie #2
NorthSouth
Line C
Well Locations Are Projected
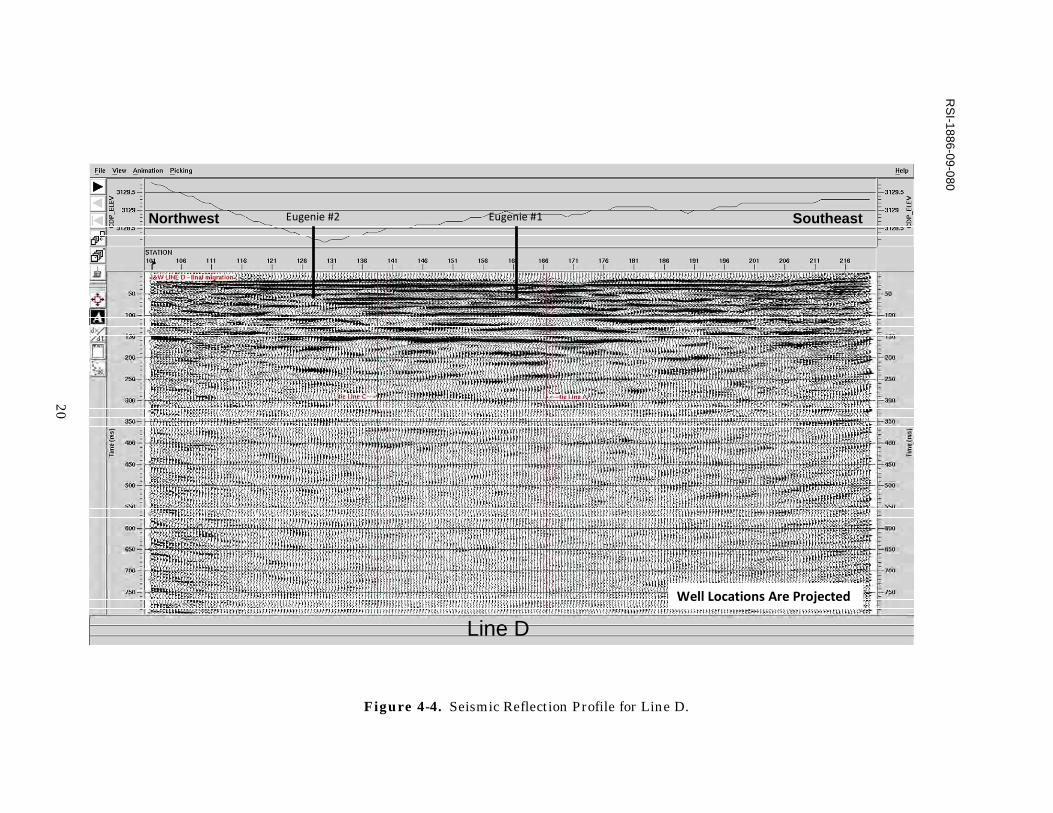
Figure 4-4. Seismic Reflection Profile for Line D.
RS
I-1886-09-080
20
Eugenie #1Eugenie #2
Well Locations Are Projected
Line D
Northwest SoutheastEugenie #1Eugenie #2
Well Locations Are Projected
Line D
Northwest Southeast
21
RSI-1886-09-081
Figure 4-5. Sonic Well Logs Within Proximity of the I&W Cavern Site. Wells API Well # 30-01520459 and API Well # 30-015-20430 were used to construct the synthetic seismogram.
Figure 4-6. Annotated Sonic Logs Used to Construct Synthetic Seismogram. DT (US/F) is sound travel time in microseconds per foot.
RS
I-1886-09-082
22
API# 30-015-20459 API# 30-015-20430Ru
stle
r
Rust
ler
Sala
do
Sala
do
Equivalent to I&W Cavern Salt Zone
Equivalent to 70’Anhydrite Below Cavern Salt Zone in Eugenie #1
API# 30-015-20459 API# 30-015-20430Ru
stle
r
Rust
ler
Sala
do
Sala
do
Equivalent to I&W Cavern Salt Zone
Equivalent to 70’Anhydrite Below Cavern Salt Zone in Eugenie #1
Figure 4-7. Synthetic Seismograms Generated From the Indicated Sonic Logs.
RS
I-1886-09-083
23
Rustler Anhydrite
Base Target SaltRustler Anhydrite
Base Target Salt
Rustler Anhydrite
Base Target SaltRustler Anhydrite
Base Target Salt
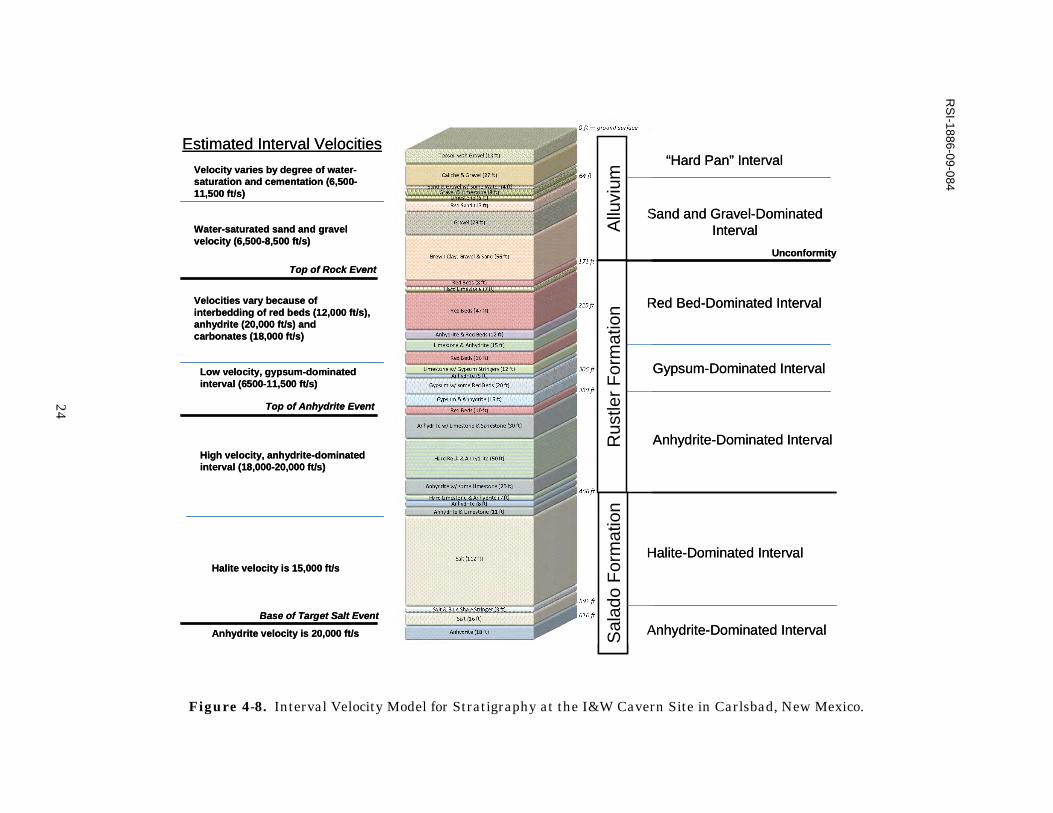
Figure 4-8. Interval Velocity Model for Stratigraphy at the I&W Cavern Site in Carlsbad, New Mexico.
RS
I-1886-09-084
24
Allu
vium
Unconformity
Velocity varies by degree of water-saturation and cementation (6,500-11,500 ft/s)
Velocities vary because of interbedding of red beds (12,000 ft/s), anhydrite (20,000 ft/s) and carbonates (18,000 ft/s)
High velocity, anhydrite-dominated interval (18,000-20,000 ft/s)
Rus
tler
For
mat
ion
Sal
ado
For
mat
ion
Red Bed-Dominated Interval
Gypsum-Dominated Interval
Anhydrite-Dominated Interval
Halite-Dominated Interval
Anhydrite-Dominated Interval
Halite velocity is 15,000 ft/s
Anhydrite velocity is 20,000 ft/s
Estimated Interval Velocities
Sand and Gravel-Dominated Interval
“Hard Pan” Interval
Water-saturated sand and gravel velocity (6,500-8,500 ft/s)
25
The interval velocity model is provided in the left-hand column of Figure 4-6. Estimated velocity ranges for each informal lithologic unit defined for this study are included along with interpretation of which key lithologic boundaries are likely to create a reflector on the seismic profiles. The later interpretations are based on presentation of the seismic data in normal polarity such that stratigraphic boundaries between lower velocity units above and higher velocity units below will be represented as reflectors on the profiles.
Estimated velocity ranges for key lithologies in the alluvium are based on the literature.
Estimated velocity ranges for the key lithologies in the Rustler and Salado Formations are also based on the literature but with data support from the sonic logs for at least the lower part of the Rustler Formation that is not cased off in the two off-site wells.
Of the three key geologic units of interest, the alluvium has the least amount of regional
characterization data on which to base interval velocity estimates. The upper 64 feet of the alluvium at the site are caliche and carbonate rich. The lower 107 feet are described as primarily sand and gravel. Given the calcareous nature of the upper interval, it may be denser than the lower sand- and gravel-dominated unit. The upper caliche and carbonate-cemented interval is, thus, interpreted to have a higher velocity than the lower sand and gravel interval within the alluvium. Estimates range from 6,500–11,500 feet per second for the upper “hard pan” interval to 6,500–8,500 feet per second for the lower sand and gravel interval.
The site-specific section of the Rustler Formation is divisible into three intervals that are
dominated by different lithologies. In descending order, these predominant lithologies are red beds, gypsum, and anhydrite. The formation, thus, appears to contain upper and lower high velocity layers separated by a middle, lower velocity interval.
The upper red bed-dominated interval is 105 feet thick; it occurs from the top of the bedrock
at 171 feet down to 276 feet bgs. The red bed interval contains subordinate limestone and anhydrite intervals. The seismic velocity of this interval, based on the predominance of red beds, is estimated to be about 12,000 feet per second.
The gypsum-dominated interval is 54 feet thick; it occurs from 276 feet to 330 feet bgs. The
gypsum-dominated interval contains subordinate red bed and anhydrite intervals. Because of the predominance of gypsum in this interval, seismic velocities are interpreted to be low. The estimated velocity range for this interval is 6,500 to 11,500 feet per second.
The anhydrite-dominated interval in the lower Rustler is 126 feet thick; it occurs from
330 feet to 456 feet and directly overlies the uppermost salt bed of the Salado Formation in which the on-site cavern has been developed. The anhydrite interval contains other stiff limestone and sandstone intervals. This interval likely exhibits seismic velocities as high as 18,000 to 20,000 feet per second.
26
The top of the Salado Formation occurs at a depth of 456 feet bgs at the site. The driller’s log suggests that the upper 112 feet of the formation is a relatively pure salt interval. The typical seismic velocity of salt is well documented to be 15,000 feet per second.
An 8-foot-thick bed of shaley salt, a 16-foot-thick cleaner salt bed, and an 18 to 71-foot-thick
anhydrite bed occur in the Salado Formation beneath the zone of relatively pure salt (i.e., the target salt). Anhydrite is among the highest velocity materials comprising evaporite rocks; its velocity is about 20,000 feet per second.
4.2 SEISMIC STRATIGRAPHIC INTERPRETATIONS
The style of presentation of seismic profiles can vary by purpose. The seismic data displayed in Figures 4-1 through 4-4 are “wiggle traces.” The data are presented as a series of closely spaced traces whose individual squiggles are darkened to form lines when a coherent interface between units of different acoustical impedance causes refraction of the seismic waves. In the profiles generated for this survey, the darkened lines, referred to as the reflectors or events, can be generally interpreted as the interfaces between upper units of lower bulk density and seismic velocity and lower units of higher bulk density and seismic velocity. Wiggle traces are particularly useful to tie the seismic data to synthetic seismograms.
Stratigraphic interpretations of the seismic reflection data are based on the tie of the
synthetic seismogram generated from the sonic log for API Well #3 0-015-20459 to the four wiggle trace profiles. Neither synthetic seismogram for the two off-site wells produces a perfect fit to the seismic data, but the synthetic seismogram generated for API Well # 30-015-20459 matches the seismic data better probably because of the similarity of the anhydrite to salt succession in the upper Salado Formation. According to records reviewed, the salt section exploited for brining at the I&W site is approximately 136 feet thick; whereas, in API Well # 30-015-20459, this salt zone is 260 feet. At the base of the exploited salt section in Eugenie #1, there is an anhydrite that was reported to be at least 58 feet thick. This anhydrite bed appears to occupy the same stratigraphic position as a massive, 525-foot-thick, anhydrite zone in the API Well # 30-015-20459. Therefore, although the salt of interest is thicker in API Well # 30-015-20459, the base of Rustler to the base of the target salt sequence is analogous to the sequence at the I&W site.
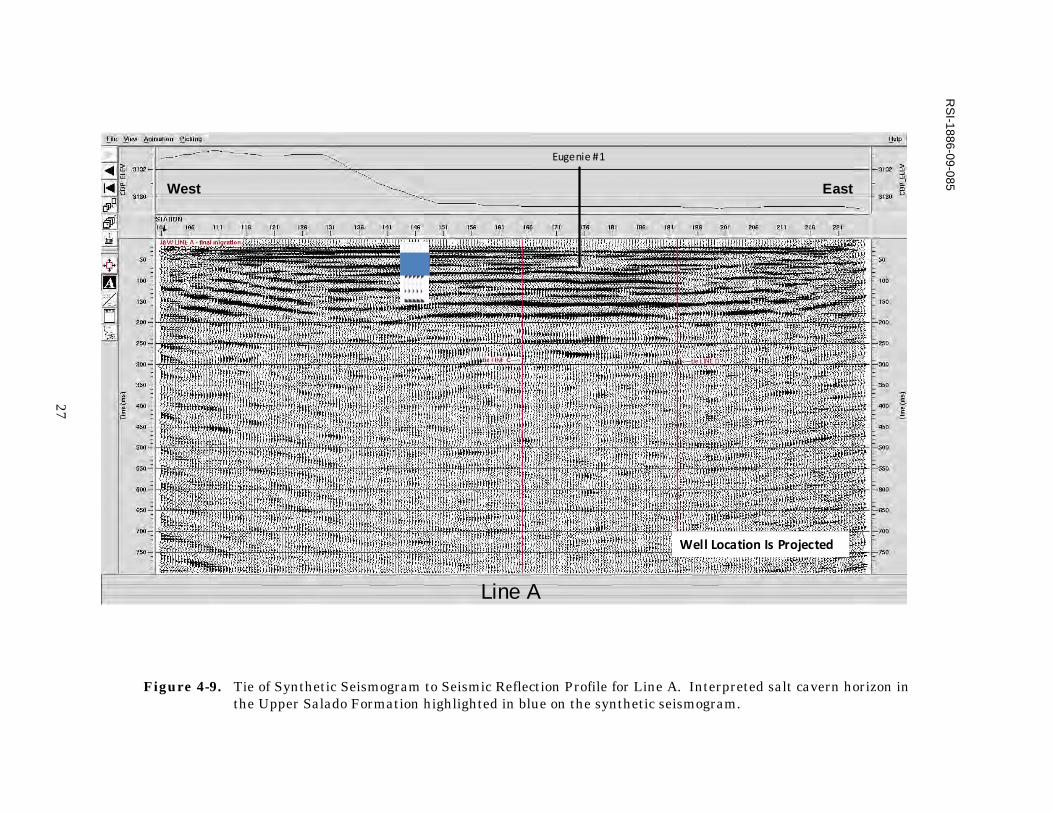
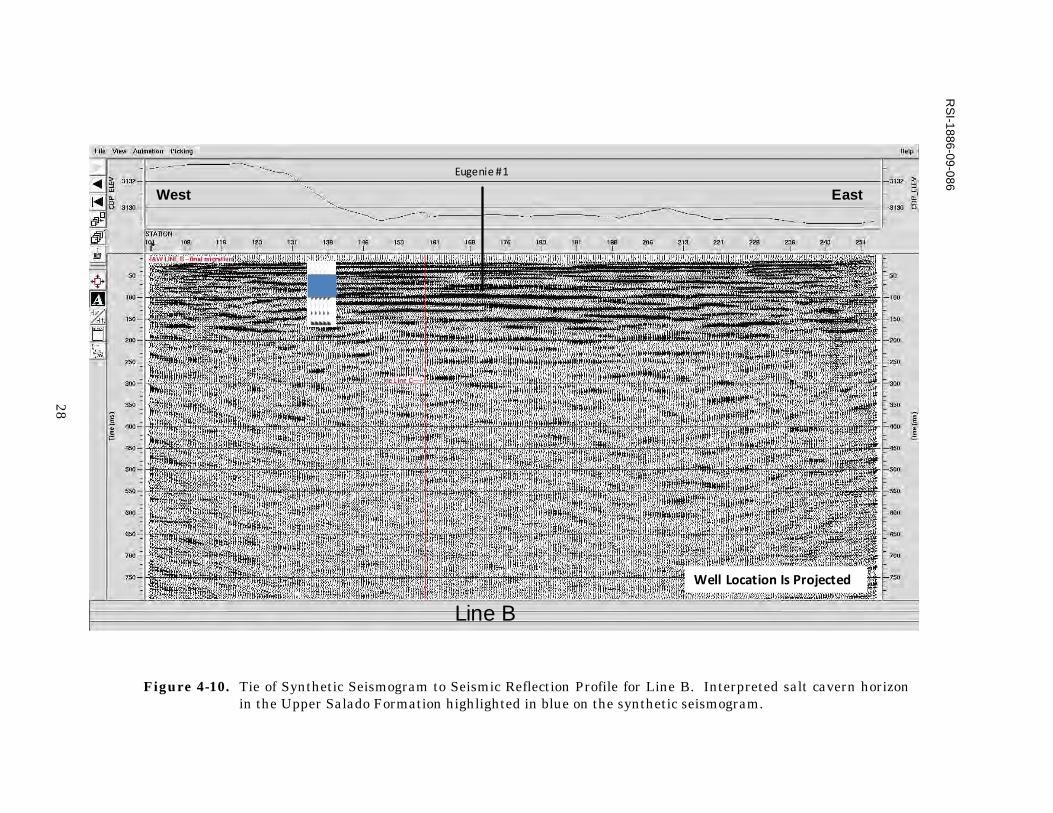
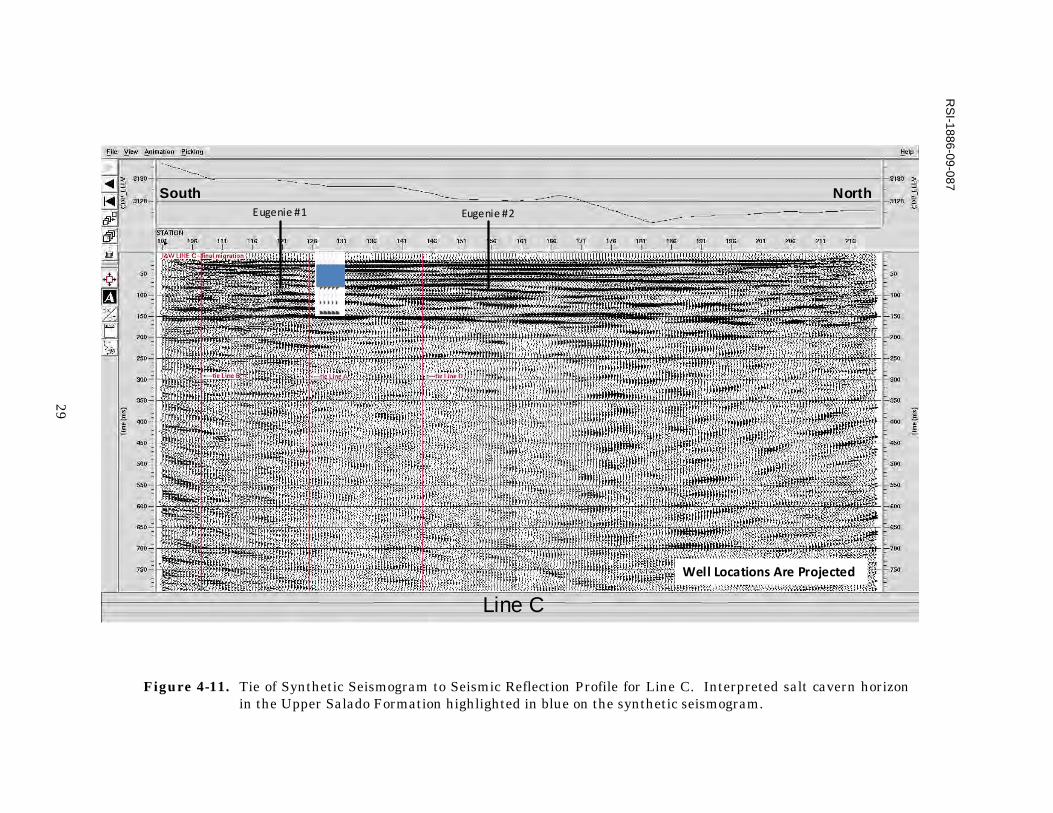
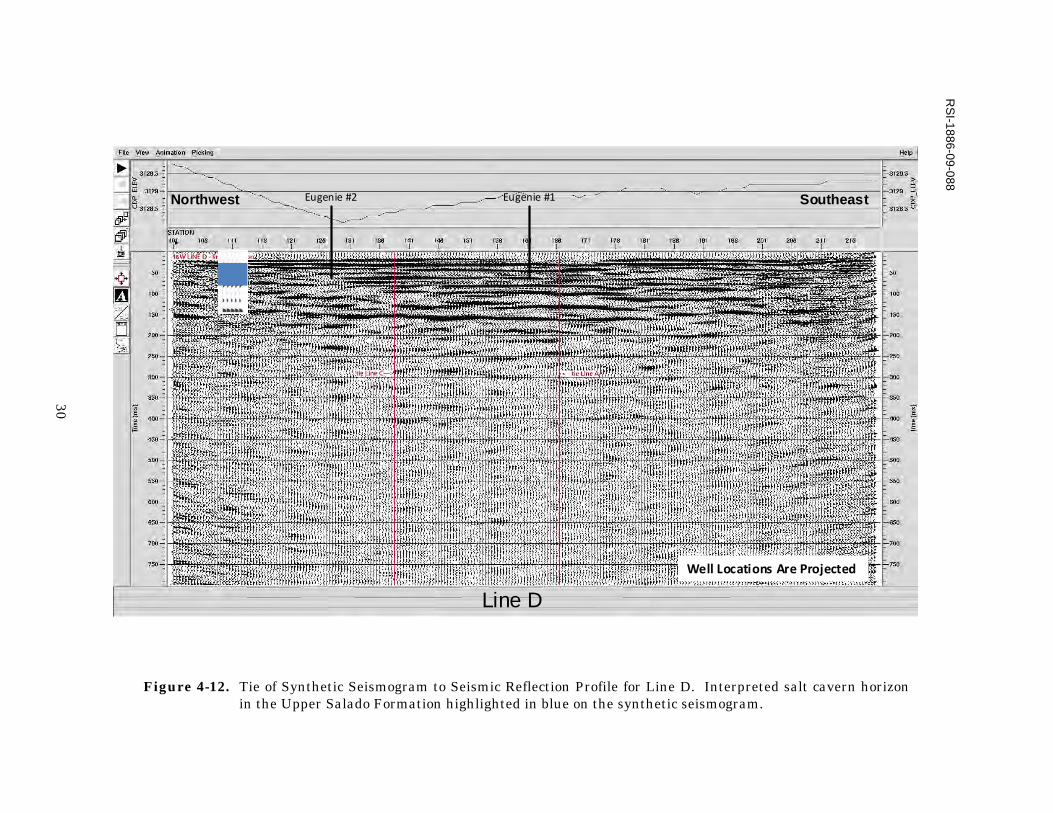
The tie of the synthetic seismogram to the Line 1-4 profiles is shown in Figures 4-9 through
4-12. This tie is not definitive; alternative ties can be considered. However, the correlations between the synthetic seismogram and the seismic profiles shown in these figures are the most reasonable based on stratigraphic and velocity data presently available from the site. Furthermore, the ties made in Figures 4-9 through 4-12 place detectable seismic anomalies that are likely related to the cavern within the target salt zone and overlying lower Rustler strata. Detailed discussion of the interpretations for each line is presented below.
Figure 4-9. Tie of Synthetic Seismogram to Seismic Reflection Profile for Line A. Interpreted salt cavern horizon in the Upper Salado Formation highlighted in blue on the synthetic seismogram.
RS
I-1886-09-085
27
Eugenie #1
Well Location Is Projected
West East
Line A
Eugenie #1
Well Location Is Projected
West East
Line A
Figure 4-10. Tie of Synthetic Seismogram to Seismic Reflection Profile for Line B. Interpreted salt cavern horizon in the Upper Salado Formation highlighted in blue on the synthetic seismogram.
RS
I-1886-09-086
28
Eugenie #1
Line B
Well Location Is Projected
West East
Eugenie #1
Line B
Well Location Is Projected
West East
Figure 4-11. Tie of Synthetic Seismogram to Seismic Reflection Profile for Line C. Interpreted salt cavern horizon in the Upper Salado Formation highlighted in blue on the synthetic seismogram.
RS
I-1886-09-087
29
Eugenie #1 Eugenie #2
NorthSouth
Line C
Well Locations Are Projected
Eugenie #1 Eugenie #2
NorthSouth
Line C
Well Locations Are Projected
Figure 4-12. Tie of Synthetic Seismogram to Seismic Reflection Profile for Line D. Interpreted salt cavern horizon in the Upper Salado Formation highlighted in blue on the synthetic seismogram.
RS
I-1886-09-088
30
Eugenie #1Eugenie #2
Well Locations Are Projected
Line D
Northwest SoutheastEugenie #1Eugenie #2
Well Locations Are Projected
Line D
Northwest Southeast
31
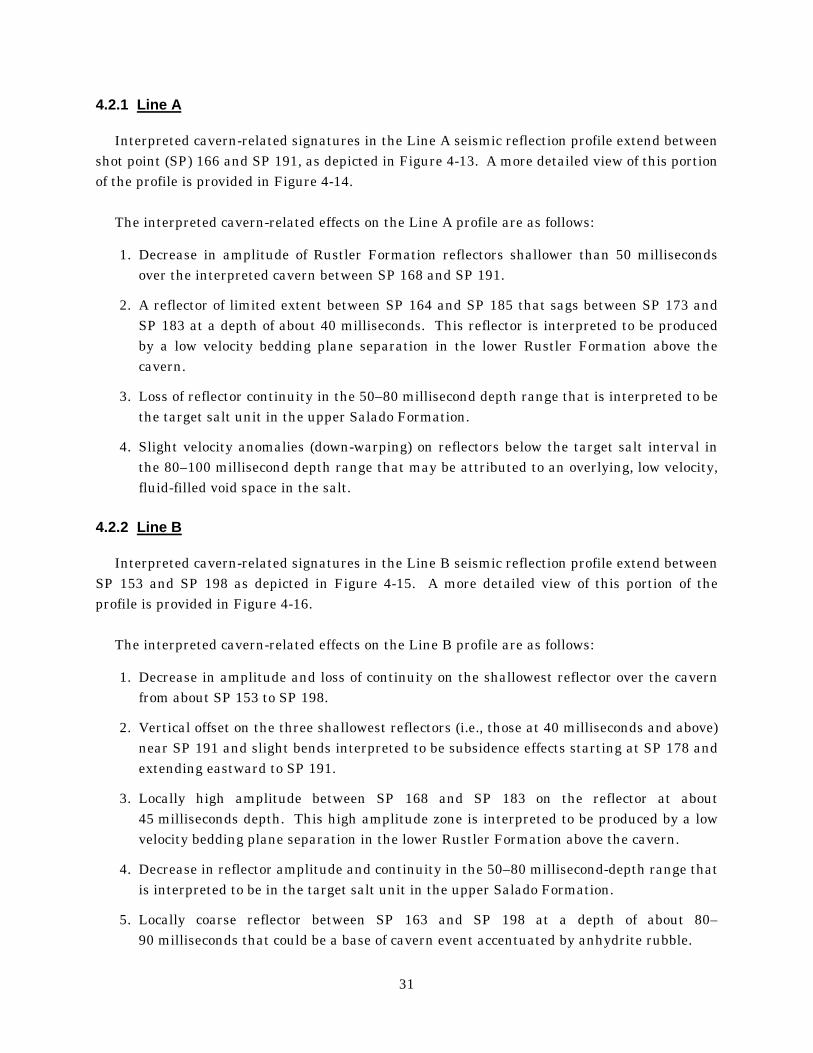
4.2.1 Line A
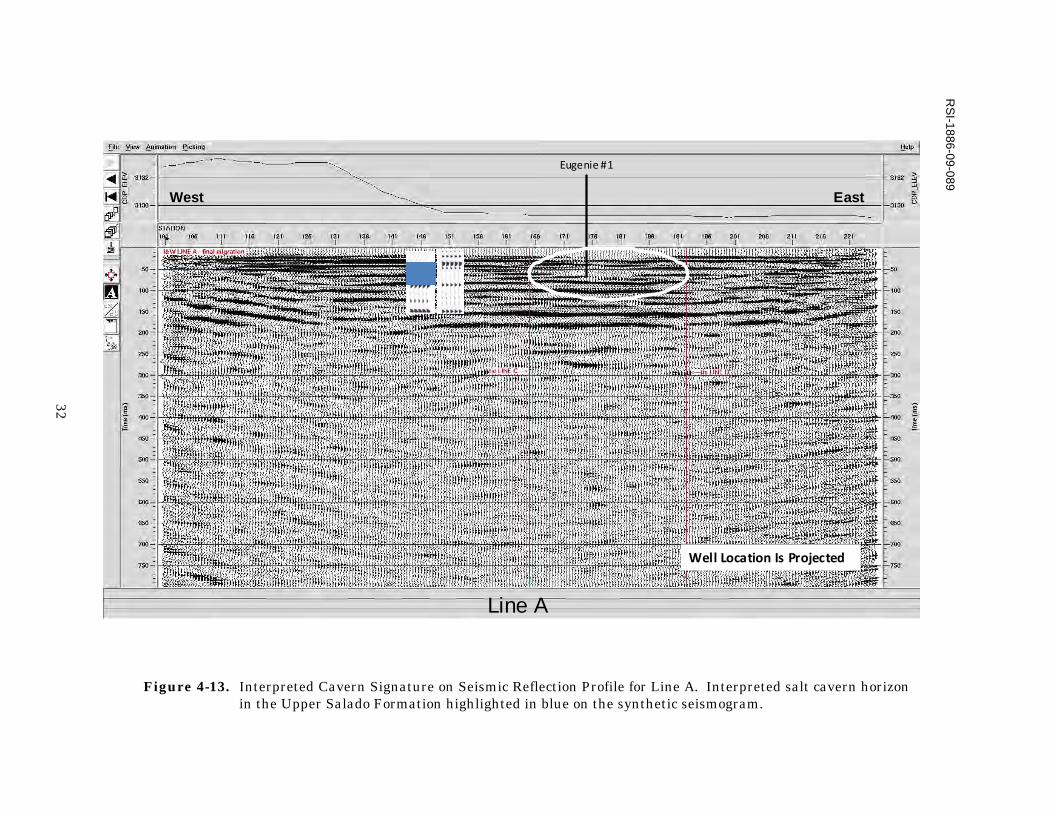
Interpreted cavern-related signatures in the Line A seismic reflection profile extend between shot point (SP) 166 and SP 191, as depicted in Figure 4-13. A more detailed view of this portion of the profile is provided in Figure 4-14.
The interpreted cavern-related effects on the Line A profile are as follows:
1. Decrease in amplitude of Rustler Formation reflectors shallower than 50 milliseconds over the interpreted cavern between SP 168 and SP 191.
2. A reflector of limited extent between SP 164 and SP 185 that sags between SP 173 and SP 183 at a depth of about 40 milliseconds. This reflector is interpreted to be produced by a low velocity bedding plane separation in the lower Rustler Formation above the cavern.
3. Loss of reflector continuity in the 50–80 millisecond depth range that is interpreted to be the target salt unit in the upper Salado Formation.
4. Slight velocity anomalies (down-warping) on reflectors below the target salt interval in the 80–100 millisecond depth range that may be attributed to an overlying, low velocity, fluid-filled void space in the salt.
4.2.2 Line B
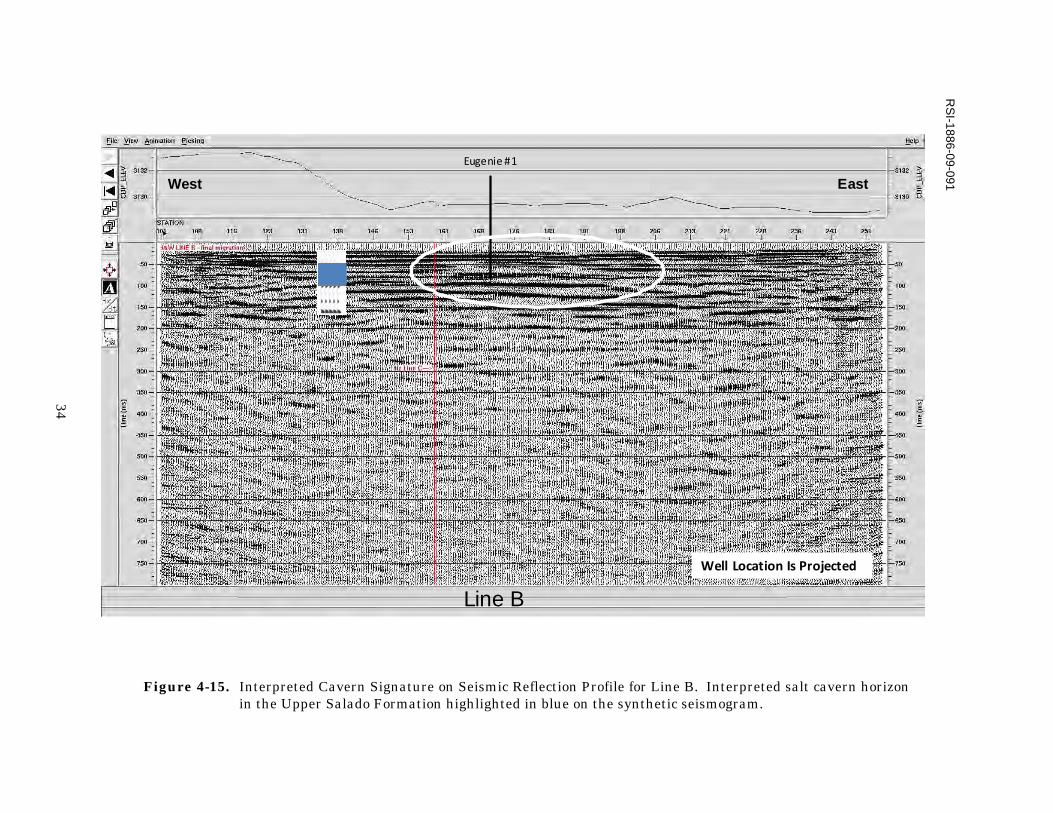
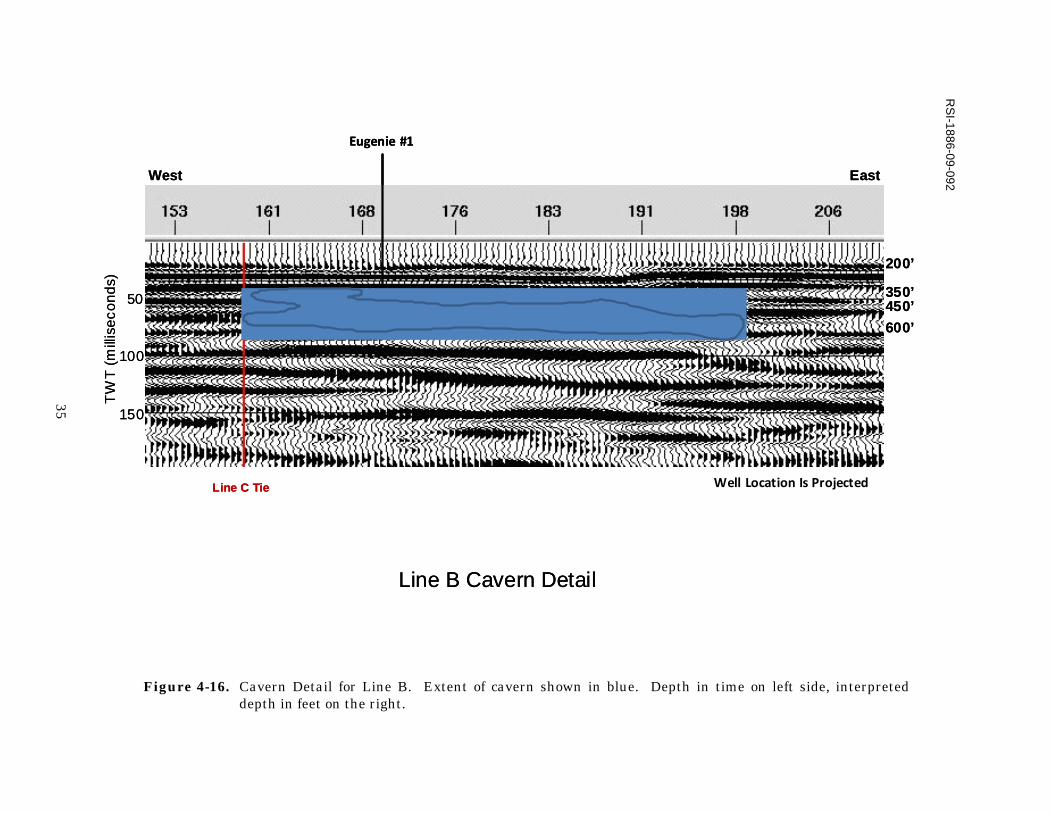
Interpreted cavern-related signatures in the Line B seismic reflection profile extend between SP 153 and SP 198 as depicted in Figure 4-15. A more detailed view of this portion of the profile is provided in Figure 4-16.
The interpreted cavern-related effects on the Line B profile are as follows:
1. Decrease in amplitude and loss of continuity on the shallowest reflector over the cavern from about SP 153 to SP 198.
2. Vertical offset on the three shallowest reflectors (i.e., those at 40 milliseconds and above) near SP 191 and slight bends interpreted to be subsidence effects starting at SP 178 and extending eastward to SP 191.
3. Locally high amplitude between SP 168 and SP 183 on the reflector at about 45 milliseconds depth. This high amplitude zone is interpreted to be produced by a low velocity bedding plane separation in the lower Rustler Formation above the cavern.
4. Decrease in reflector amplitude and continuity in the 50–80 millisecond-depth range that is interpreted to be in the target salt unit in the upper Salado Formation.
5. Locally coarse reflector between SP 163 and SP 198 at a depth of about 80–90 milliseconds that could be a base of cavern event accentuated by anhydrite rubble.
Figure 4-13. Interpreted Cavern Signature on Seismic Reflection Profile for Line A. Interpreted salt cavern horizon in the Upper Salado Formation highlighted in blue on the synthetic seismogram.
RS
I-1886-09-089
32
Eugenie #1
Well Location Is Projected
West East
Line A
Eugenie #1
Well Location Is Projected
West East
Line A
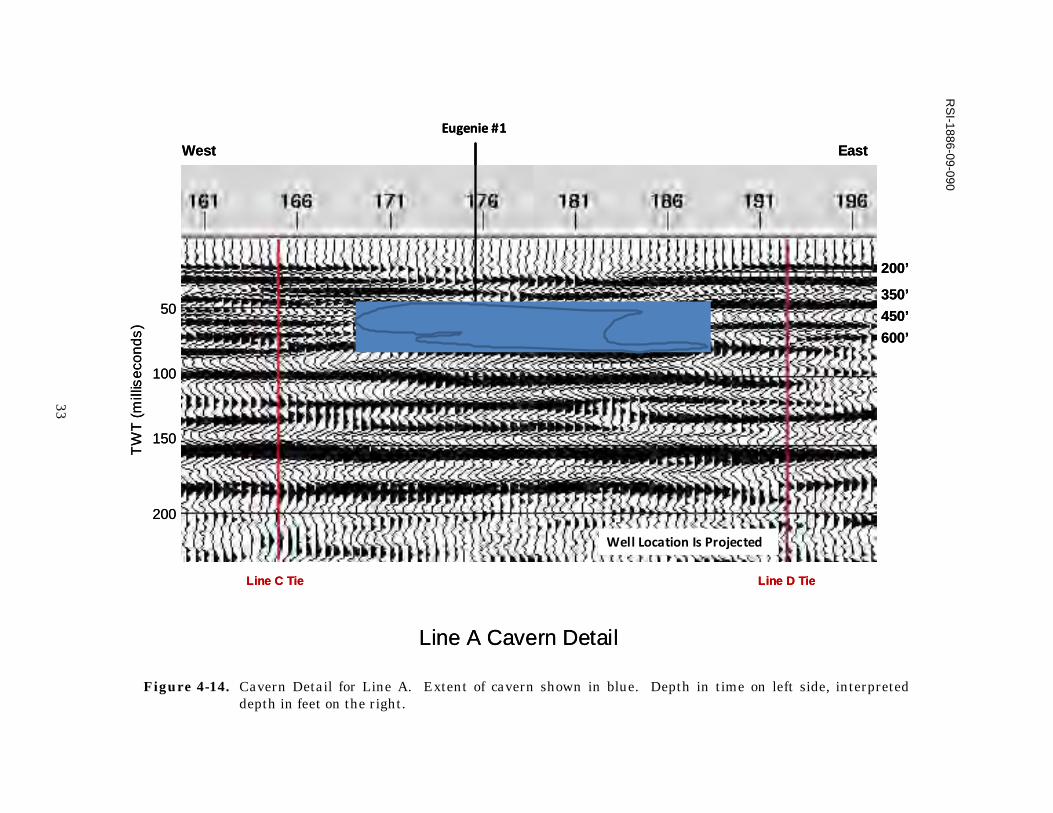
Figure 4-14. Cavern Detail for Line A. Extent of cavern shown in blue. Depth in time on left side, interpreted depth in feet on the right.
RS
I-1886-09-090
33
150
50
200
100
Eugenie #1
Line A Cavern Detail
West East
Line C Tie Line D Tie
Well Location Is Projected
600’
450’
200’
350’
TW
T (
mill
isec
onds
)
150
50
200
100
Eugenie #1
Line A Cavern Detail
West East
Line C Tie Line D Tie
Well Location Is Projected
600’
450’
200’
350’
TW
T (
mill
isec
onds
)
Figure 4-15. Interpreted Cavern Signature on Seismic Reflection Profile for Line B. Interpreted salt cavern horizon in the Upper Salado Formation highlighted in blue on the synthetic seismogram.
RS
I-1886-09-091
34
Eugenie #1
Line B
Well Location Is Projected
West East
Eugenie #1
Line B
Well Location Is Projected
West East
Figure 4-16. Cavern Detail for Line B. Extent of cavern shown in blue. Depth in time on left side, interpreted depth in feet on the right.
RS
I-1886-09-092
35
50
100
150
Line B Cavern Detail
Eugenie #1
Line C Tie
West East
Well Location Is Projected
600’
200’
350’450’
TW
T (
mill
ise
co
nd
s)
50
100
150
Line B Cavern Detail
Eugenie #1
Line C Tie
West East
Well Location Is Projected
600’
200’
350’450’
TW
T (
mill
ise
co
nd
s)
36
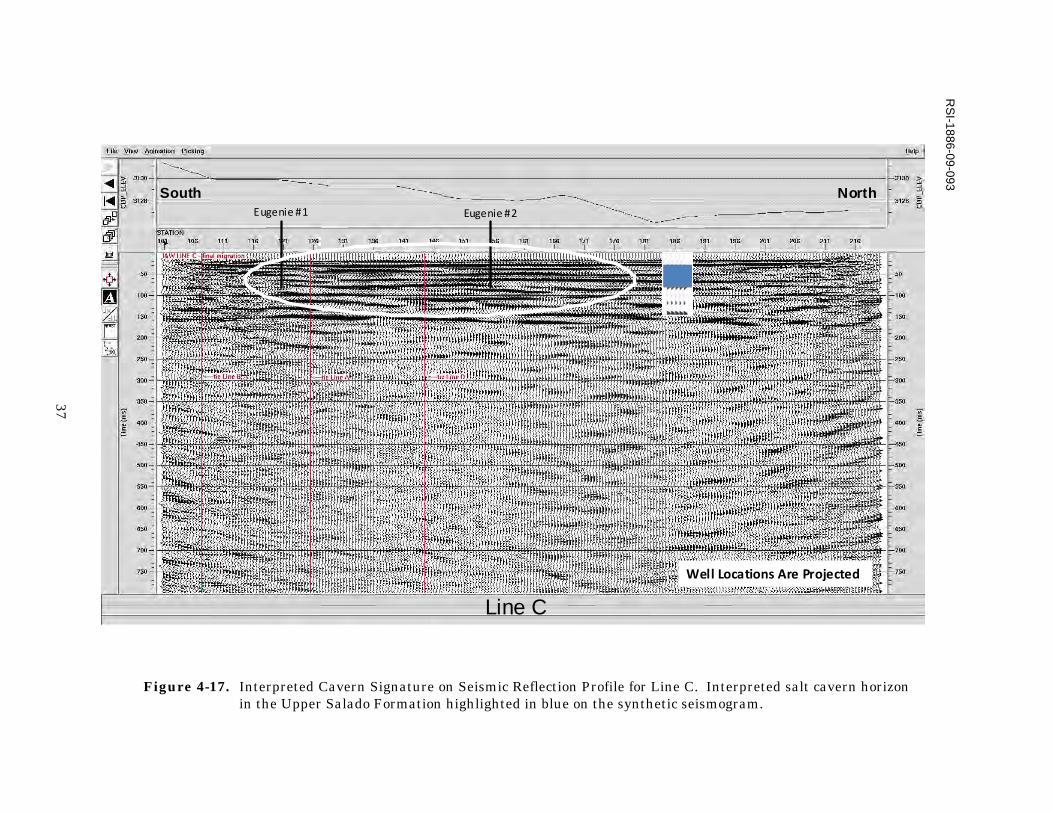
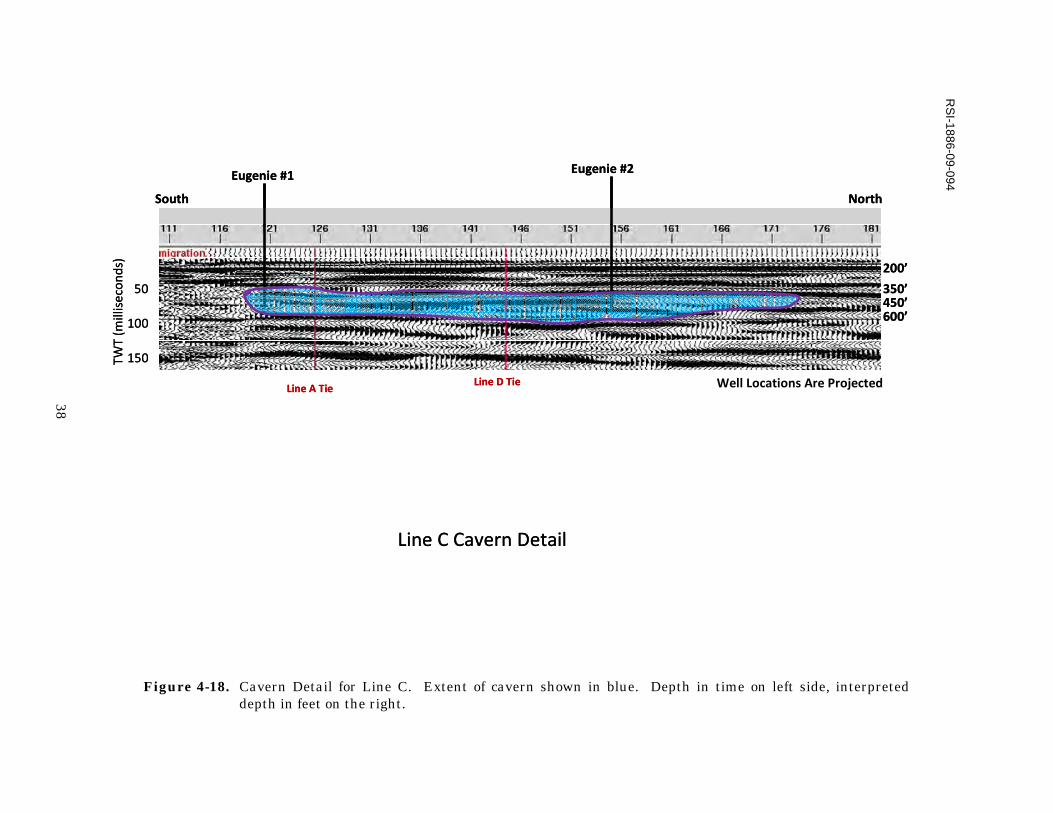
4.2.3 Line C
Interpreted cavern-related signatures in the Line C seismic reflection profile are subtle, but extend between SP 121 and SP 176, as depicted in Figure 4-17. A more detailed view of this portion of the profile is provided in Figure 4-18.
The interpreted cavern-related effects on the Line C profile are as follows:
1. Gentle undulation (interpreted to be subsidence effects) on the lower two of the three reflectors above 50 milliseconds between SP 126 and SP 147.
2. Localized decrease in amplitude on reflectors in the 40–50-millisecond depth range (lower Rustler and upper Salado) between SP 113 and SP 128 and between SP 141 and SP 152.
3. Undulatory reflectors with variable amplitude in the 60–100-millisecond depth range interpreted to be in the target salt section.
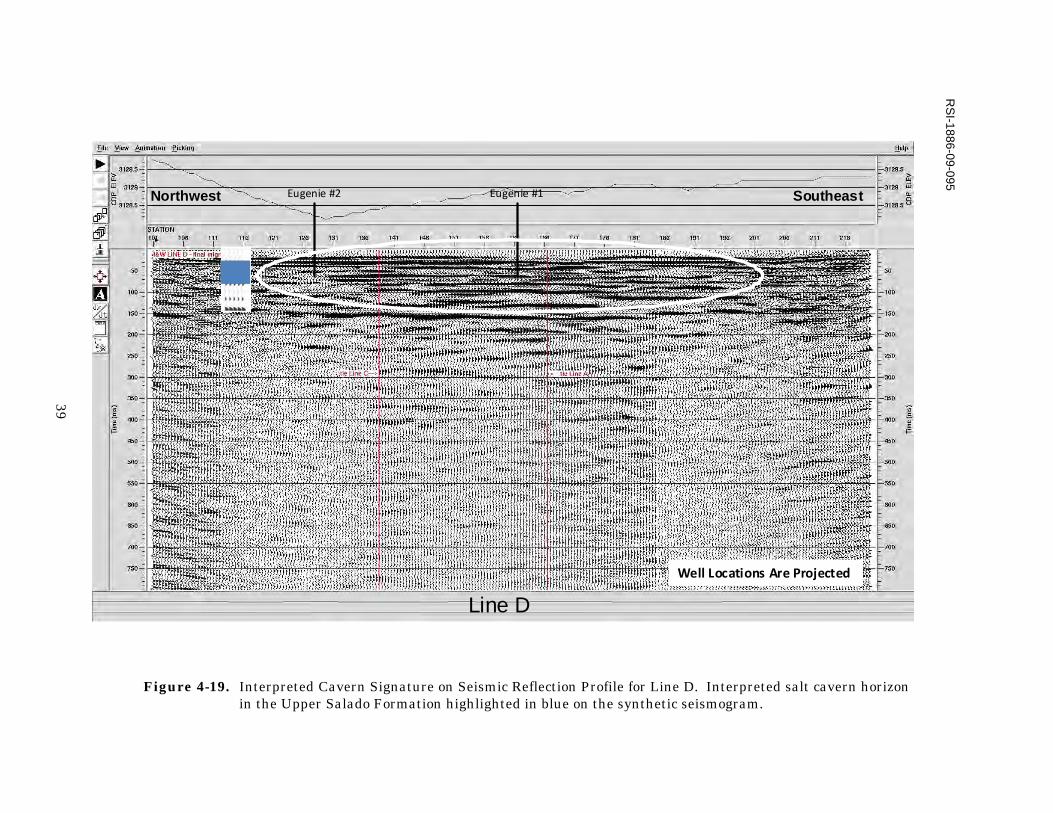
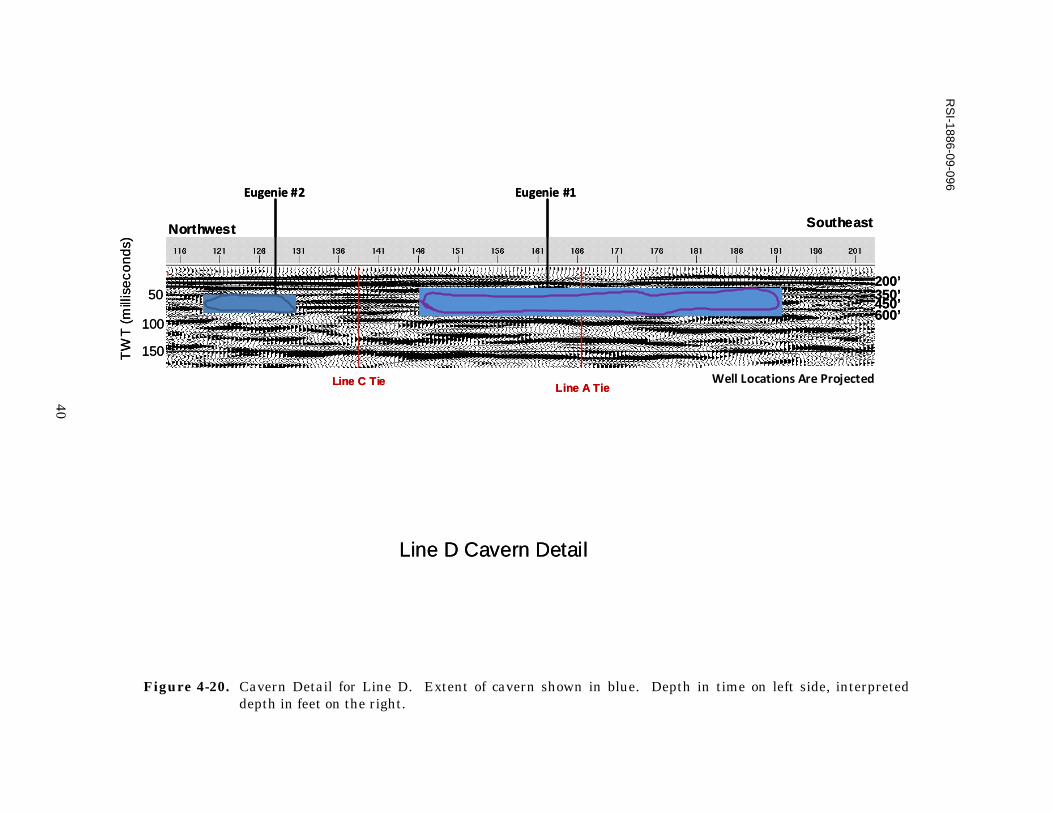
4.2.4 Line D
Interpreted cavern-related signatures in the Line D seismic reflection profile are subtle, but extend between SP 116 and SP 201 as depicted in Figure 4-19. A more detailed view of this portion of the profile is provided in Figure 4-20.
The interpreted cavern-related effects on the Line D profile are as follows:
1. Decrease in amplitude of Rustler Formation reflectors shallower than 50 milliseconds over the interpreted cavern between SP 153 and SP 176.
2. Discontinuous, variable amplitude and locally dipping reflectors in the 50–80-millisecond depth range (in the target salt section) between SP 119 and SP 131 and between SP 146 and SP 191.
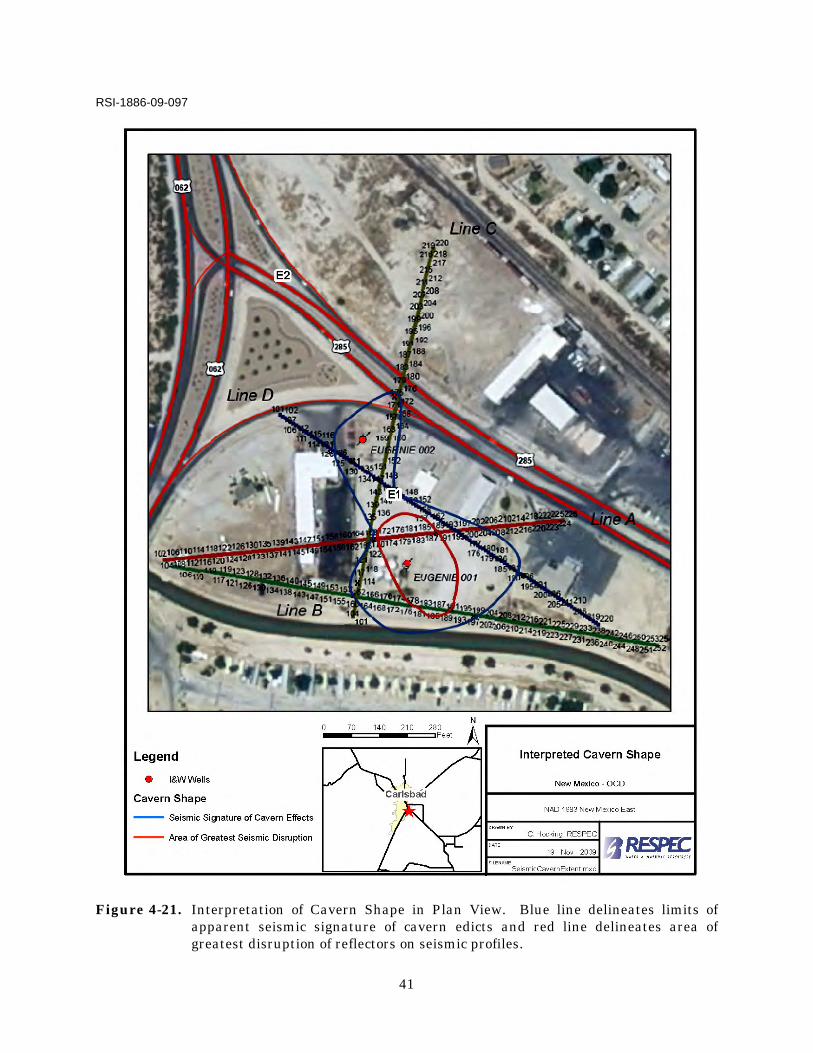
4.3 DISCUSSION
Interpretations of cavern effects on the profiles for Lines A–D are synthesized and presented in plan view in Figure 4-21. The outer blue line depicts the lateral boundary of cavern effects. The inner red line depicts the zone where cavern effects in the seismic data are greatest and suggest a larger degree of damage in the Rustler Formation strata bridging the cavern.
The seismic data led to an interpretation of a pear-shaped cavern outline in plan view whose diameter is narrower at the north end of the site and wider beneath the southern part of the site. The larger apparent diameter of the cavern at the southern end may be attributable to the uncontrolled hydrofracturing from Eugenie #2 to Eugenie #1 and the later single-well mining from Eugenie #1.
Figure 4-17. Interpreted Cavern Signature on Seismic Reflection Profile for Line C. Interpreted salt cavern horizon in the Upper Salado Formation highlighted in blue on the synthetic seismogram.
RS
I-1886-09-093
37
Eugenie #1 Eugenie #2
NorthSouth
Line C
Well Locations Are Projected
Eugenie #1 Eugenie #2
NorthSouth
Line C
Well Locations Are Projected
Figure 4-18. Cavern Detail for Line C. Extent of cavern shown in blue. Depth in time on left side, interpreted depth in feet on the right.
RS
I-1886-09-094
38
100
150
50
Line C Cavern Detail
Eugenie #1 Eugenie #2
South North
Line A TieLine D Tie Well Locations Are Projected
TWT
(mill
isec
onds
)
200’
600’
350’450’
100
150
50
Line C Cavern Detail
Eugenie #1 Eugenie #2
South North
Line A TieLine D Tie Well Locations Are Projected
TWT
(mill
isec
onds
)
200’
600’
350’450’
Figure 4-19. Interpreted Cavern Signature on Seismic Reflection Profile for Line D. Interpreted salt cavern horizon in the Upper Salado Formation highlighted in blue on the synthetic seismogram.
RS
I-1886-09-095
39
Eugenie #1Eugenie #2
Well Locations Are Projected
Line D
Northwest SoutheastEugenie #1Eugenie #2
Well Locations Are Projected
Line D
Northwest Southeast
Figure 4-20. Cavern Detail for Line D. Extent of cavern shown in blue. Depth in time on left side, interpreted depth in feet on the right.
RS
I-1886-09-096
40
50
100
150
Eugenie #2 Eugenie #1
Line D Cavern Detail
Line A TieLine C Tie
Northwest Southeast
Well Locations Are Projected
200’
600’450’350’
TW
T (
mill
ise
cond
s)
50
100
150
Eugenie #2 Eugenie #1
Line D Cavern Detail
Line A TieLine C Tie
Northwest Southeast
Well Locations Are Projected
200’
600’450’350’
TW
T (
mill
ise
cond
s)
41
RSI-1886-09-097
Figure 4-21. Interpretation of Cavern Shape in Plan View. Blue line delineates limits of apparent seismic signature of cavern edicts and red line delineates area of greatest disruption of reflectors on seismic profiles.
42
The proximity of cavern edges with the northern and southern portions of Line C may explain why cavern effects are subtle on that profile. That is, the southern portion of Line C is interpreted to closely coincide with the southwestern limit of the cavern, and the northern portion of the Line C is interpreted to parallel the northeastern edge of the cavern.
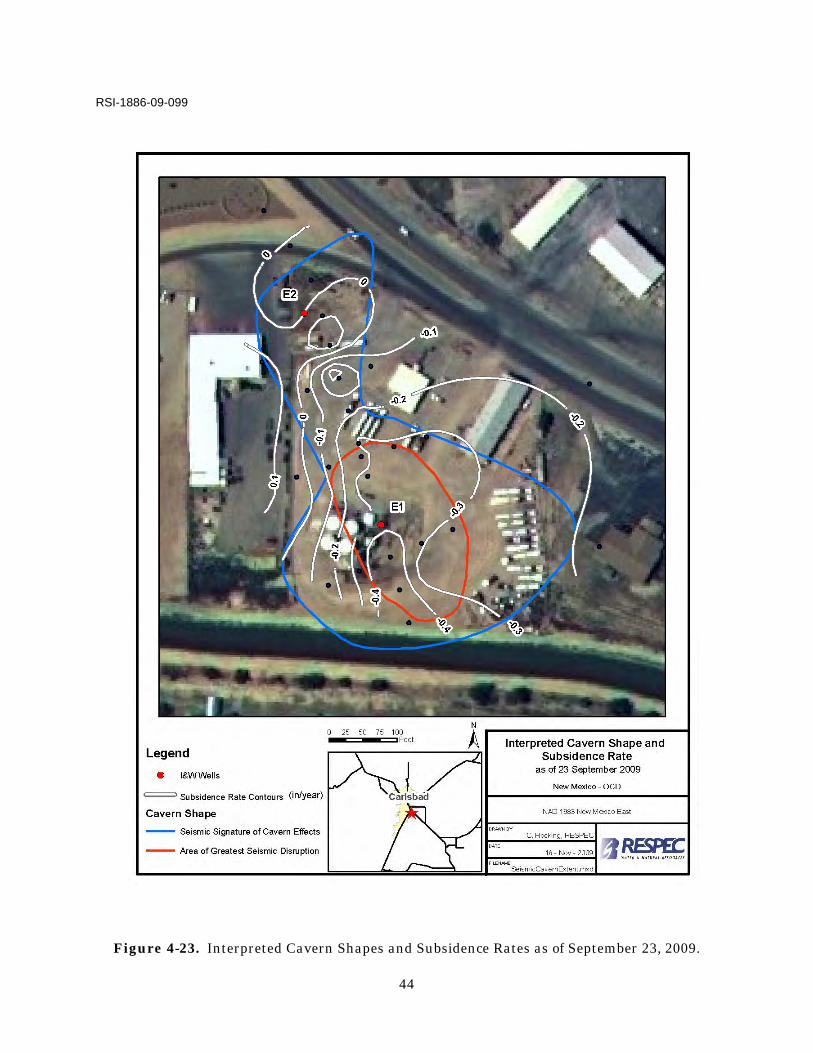
The northernmost extent of the cavern effects is interpreted to extend beneath the on-ramp
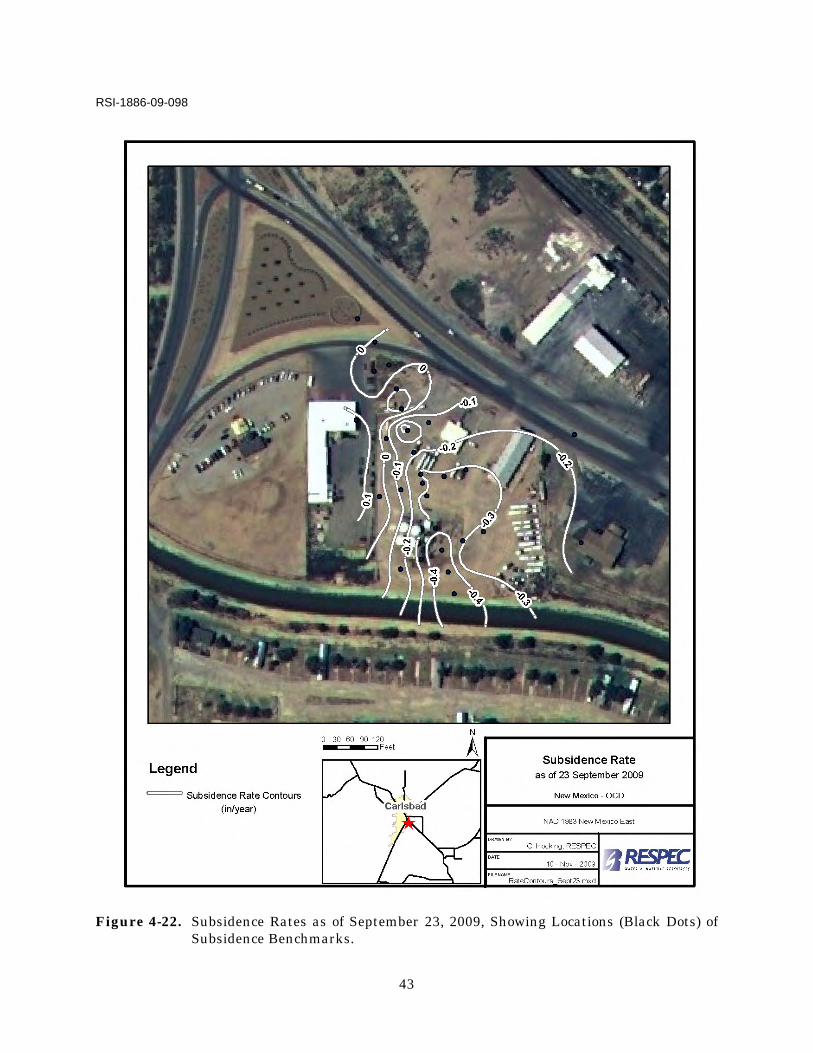
to Route 62 and the east-bound lanes of Highway 285. Subsidence rates measured during May–September 2009 are near zero in the vicinity of the highways (Figure 4-22). Reconciliation of the seismic data and the subsidence rates (Figure 4-23) suggests that if the cavern did extend as far north as interpreted from the seismic data, then significant closure of the cavern space must have already occurred to account for the near-zero subsidence rate in the vicinity of the highways.
Conversely, relatively high subsidence rates were detected over the southern limits of the
cavern where its diameter is interpreted to be larger. The area of greatest subsidence rates might extend beneath the irrigation canal. In this area, both the cavern edge and cavern subsidence network are poorly constrained. Consequently, future characterization efforts should focus on definition of the southern edge of the cavern and the possible effects of subsidence on the irrigation canal.
43
RSI-1886-09-098
Figure 4-22. Subsidence Rates as of September 23, 2009, Showing Locations (Black Dots) of Subsidence Benchmarks.
44
RSI-1886-09-099
Figure 4-23. Interpreted Cavern Shapes and Subsidence Rates as of September 23, 2009.
45
5.0 CONCLUSIONS AND RECOMMENDATIONS
RESPEC supervised an HRPW 2D seismic reflection survey of the I&W facility located in Carlsbad, New Mexico. The purpose of the survey was to collect data that would assist in the delineation of a subsurface cavern developed in the Salado salt by solution mining for commercial brine production. The survey consisted of four 2D seismic reflection lines comprising a total length of 4,228 feet. The survey was conducted between August 17 and 19, 2009.
The site-specific stratigraphic column contains three key units, in descending order:
alluvium (171 feet), Rustler Formation (285 feet), and the uppermost salt (112 feet) in the Salado Formation. The survey was designed to focus on the depth interval encompassing the upper Salado salt and the Rustler Formation. This stratigraphic interval occurs in the depth range of 330 feet to 610 feet below surface.
5.1 FINDINGS
The seismic data led to an interpretation of a pear-shaped cavern outline in plan view whose diameter is narrower at the north end of the site and wider beneath the southern part of the site. The larger apparent diameter of the cavern at the southern end may be attributable to the uncontrolled hydrofracturing from Eugenie #2 to Eugenie #1.
The northernmost cavern effects are interpreted to extend beneath the on-ramp to Route 62
and the east-bound lanes of Highway 285. However, subsidence rates measured during May–September 2009 are small in the vicinity of the highways. Reconciliation of the seismic data and the subsidence rates suggests that if the cavern did extend as far north as interpreted, then significant closure of the cavern has already occurred in the vicinity of the highways.
Conversely, relatively high subsidence rates were detected over the southern limits of the
cavern where its diameter is interpreted to be larger. The area of greatest subsidence rates might extend beneath the irrigation canal. In this area, the cavern edge is also poorly constrained. Consequently, further characterization efforts should focus on definition of the southern edge of the cavern and the possible effects of subsidence on the irrigation canal.
5.2 RECOMMENDATIONS
Based upon the findings from the seismic reflection survey, RESPEC offers the following recommendations.
46
1. Conduct a supplemental 2D seismic reflection survey to the south of the I&W site.
2. Drill and complete a series of observation wells into and surrounding the cavern footprint interpreted from the 2D seismic data. For safety, wells into the cavern will be drilled by slant drill methods. Wells drilled outside the cavern footprint will be vertical borings to confirm relative stability of the ground area. Vertical boreholes will include at least one with continuous sampling of overburden and bedrock coring to total depth and a full suite of open-hole geophysical logs.
3. From the observation wells completed into the cavern, develop and implement a cavern monitoring system to track fluid levels and cavern roof migration.
4. Continue surface subsidence and tilt monitoring.
5. Refine the interpretations of seismic data as additional site-specific subsurface information becomes available from continuing site characterization work.
6. Use surface, subsurface, and early-warning system data to allow better engineering calculations of cavern size and stability and to further develop mitigation plans.
7. Initiate a feasibility study for mitigation efforts.
47
6.0 REFERENCES
Bay Geophysical, 2009. Compressional Wave Reflection Seismic Survey, Brine Cavern Delineation, Carlsbad, New Mexico, prepared for RESPEC, Rapid City, SD.
Henard, D. A., L. L. Van Sambeek, M. G. Wallace, W. M. Goodman, C. M. Hocking, C. A. Barber, and E. L. Krantz, 2009. Geohydrological and Structural Analysis and Monitoring I&W Cavern, Carlsbad, New Mexico, RSI-2060, prepared by RESPEC, Rapid City, SD, for New Mexico Oil Conservation Division, Santa Fe, New Mexico.
A-1
APPENDIX A
DRILLER’S LOGS FOR EUGENIE #1 AND EUGENIE #2
B-1
APPENDIX B
GEOPHYSICAL DATA (SEG-Y FILES) AND FIELD SURVEY DATA