Component and System Level Modeling of a Two-Phase Cryogenic Propulsion System for Aerospace Applications J. LoRusso, B. Kalina, M. Van Benschoten, Roush Industries GT Users Conference November 9, 2015
Transcript
Component and System Level Modeling of
a Two-Phase Cryogenic Propulsion System
for Aerospace Applications
J. LoRusso, B. Kalina, M. Van Benschoten,
Roush Industries
GT Users Conference November 9, 2015
Agenda
Introduction to Integrated Vehicle Fluids (IVF) System
H2-O2 Fueled IC Engine
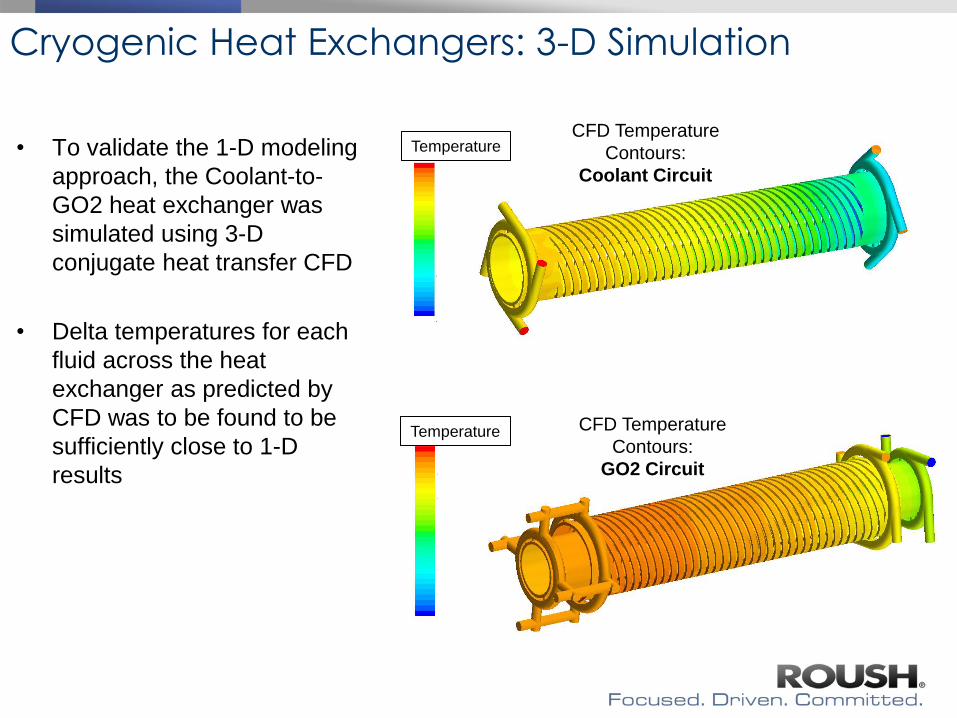
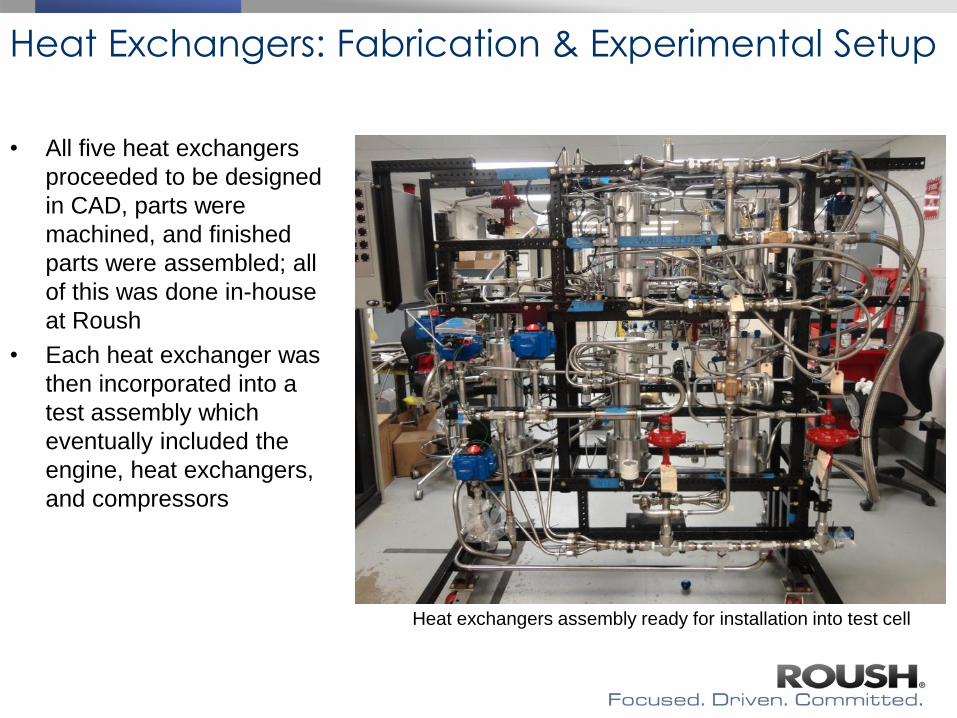
Cryogenic Propellant Heat Exchangers
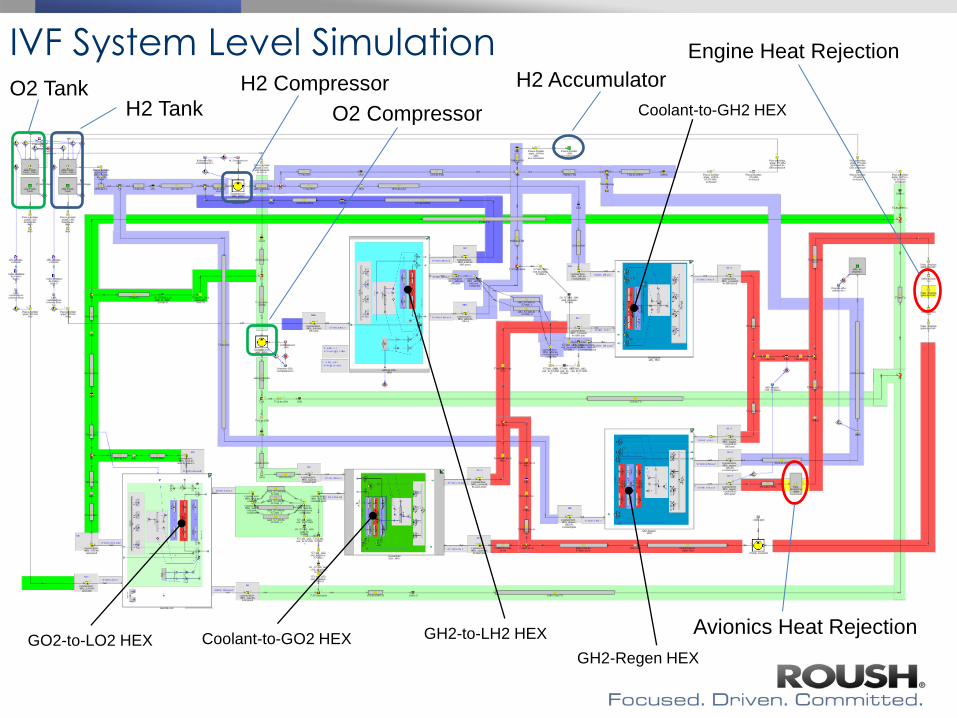
IVF System Level Simulation
Other ICE/IVF Elements
Integrated Vehicle Fluids (IVF)
System Overview
• IVF High Level Concept Description – IC engine generates mechanical power to drive starter-generator and propellant compressors
– Waste heat from IC Engine transferred to cold propellants extracted from the propulsion tanks
– Enthalpy added to the cold propellants is then transferred back to the tanks for tank pressurization
– The starter-generator transfers power to high density Lithium Ion batteries extending mission length
– Gimbaled thrusters fire directly from tank ullage gases, replacing the prior hydrazine fired thrusters
IVF Simplified System Schematic
Upper
stage
propellant
tanks
IVF Transformation
• IVF Transformation in the Launch Vehicle Upper Stage – The result is a reduced complexity upper stage with elimination of helium bottles used for tank
pressurization, hydrazine to fire the thrusters, and a portion of the batteries for electrical power
– The end result, reduced system mass, with extended mission length capability and increased
payload opportunities
(resultant lift-off mass benefit)
H2-O2 Fueled IC Engine
IC Engine (ICE) Combustion with H2/O2 Fuel • Limited published data existed on H2/O2 fueled IC engines
• Traditionally H2/Air IC engines operate at fuel-lean equivalence ratio
• In contrast, the IVF H2/O2 ICE operates fuel-rich
• Greater availability of waste H2 than O2 in the vehicle due to faster boil-off of H2
• Flame temperature and burn rate controlled to equivalent levels as gasoline-air
• Simulation results and experimental data confirmed this hypothesis
Definitions:
Mixture Ratio (MR ) =
O2/H2 mass flow rate
Fuel Air Equivalence Ratio =
Stoich MR / Actual MR
ICE Concept Prove-out & Design for Flight
Single
Cylinder ICE
1st Concept
Prove-out
Wankel ICE
2nd Concept
Prove-out
New I6 Flathead ICE
1st Pre-flight design for
cryogenic fluid system
IVF proof-of-concept
testing
Flathead architecture
simplified challenges with
lubrication at zero G
High S/V ratio increased
% of fuel energy lost to
the coolant, which was
important for IVF
To support the new I6 ICE design, numerous performance
and DOE studies were conducted using GT-Power:
• Engine displacement
• Intake & Exhaust Valve timing
• Injection timing relative to IVO
• Valve Size
• Intake manifold geometry
• H2 throttle & O2 injector geometry
• Cooling System design
GT-Power was converted to run on H2-O2
• 1st Experimentally measured burn rates used
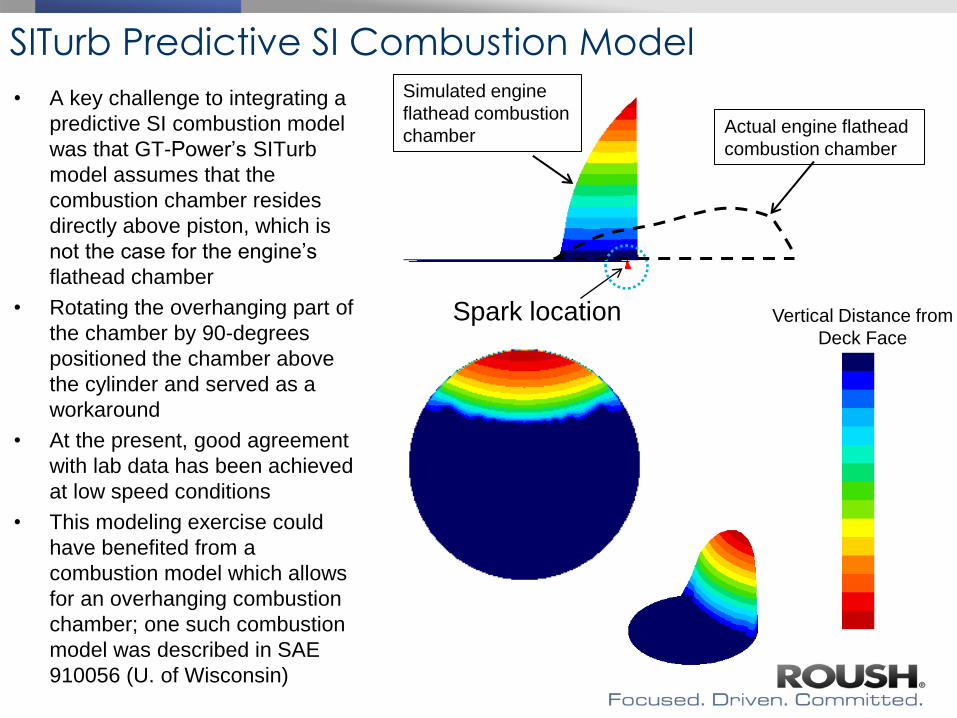
• SITurb was approximated for the flathead geometry
(spark plug is offset to bore)
ICE Design Analysis via GT-Power
Unique Environment
• Intake H2 working gas from upper stage
ullage tank, pressurized, ambient temps due
to heat exchange of coolant w/propellants.
• Exhaust environment, 0 psia vacuum
Metrics
• Traditional performance and fuel
consumption metrics
• Trapped vs. overall O2/H2 Mixture ratio
• Brake specific O2 consumption
Flathead chamber
plan view
• Since supply of waste H2 was more available than O2 in the vehicle, it was
important to minimize O2 consumption for a given power level
• Brake Specific Oxygen Consumption (BSOC) defined as follows: