20
Norwegian University of Science and Technology Two-phase flow in a down-hole shut-in valve by S. Edvardsen, C.A. Dorao, O.J. Nydal Department of Energy and Process Engineering
Norwegian University of Science and Technology
Two-phase flow in a down-hole shut-in valve by
S. Edvardsen, C.A. Dorao, O.J. Nydal
Department of Energy and Process Engineering
Norwegian University of Science and Technology 2
Research question:
• How accurate can the single phase/two-phase pressure drop in a complex geometry be quantified?
Objective:
• 3-dimensional CFD simulation for liquid pressure drop • Make 1-D model from CFD data • Simulate 2-phase flow with Least Squares Spectral
Element Method (LSSEM)
Norwegian University of Science and Technology 3
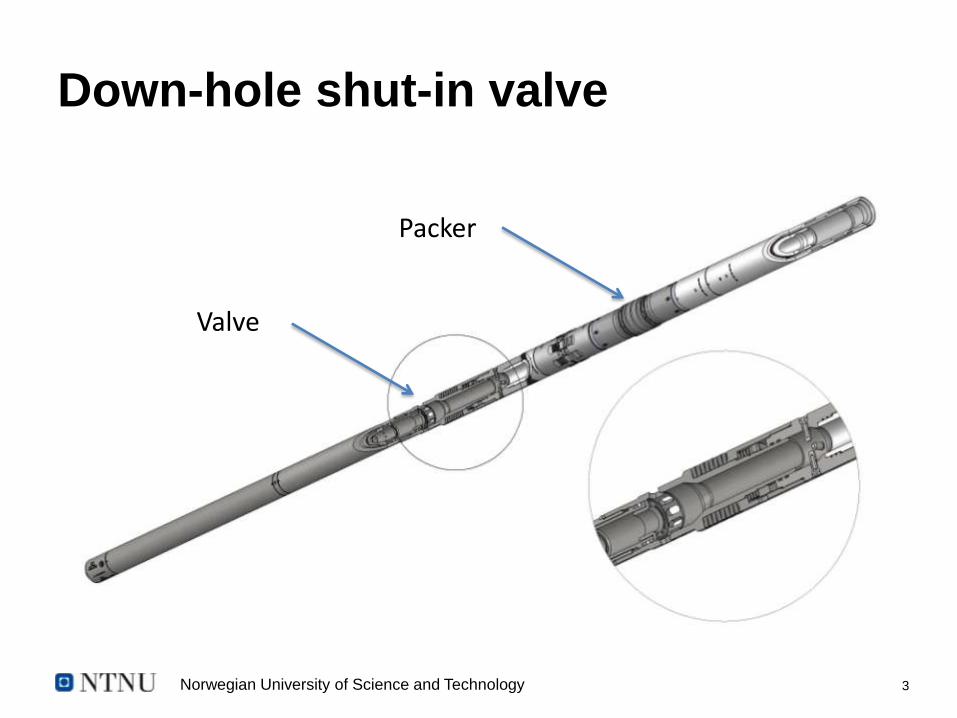
Down-hole shut-in valve
Valve
Packer

Norwegian University of Science and Technology 4
CFD-model
Norwegian University of Science and Technology 5
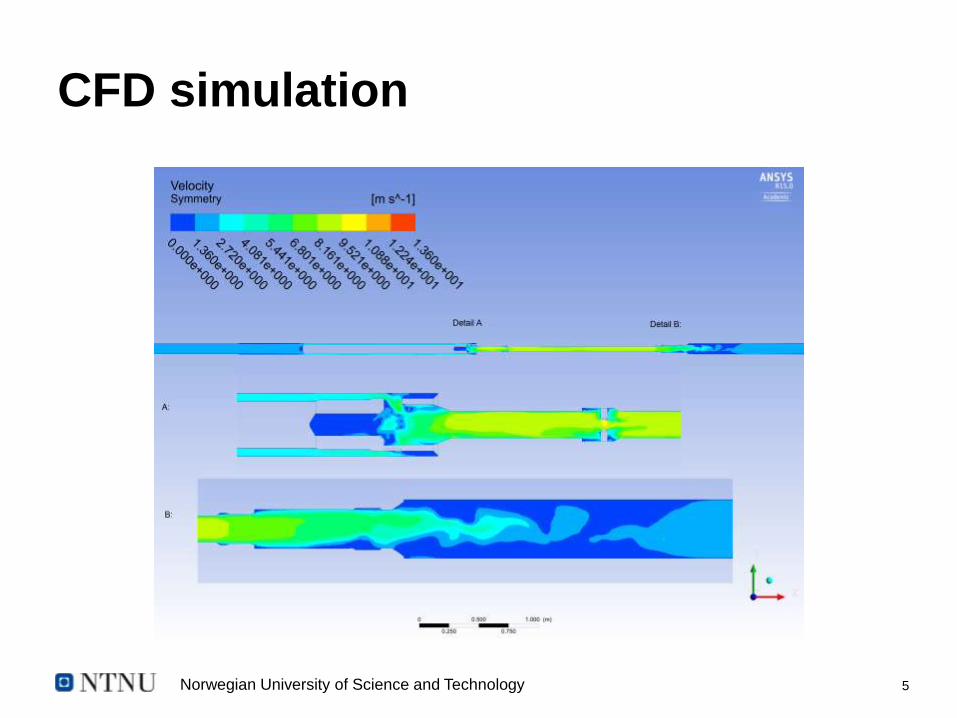
CFD simulation
Norwegian University of Science and Technology 6
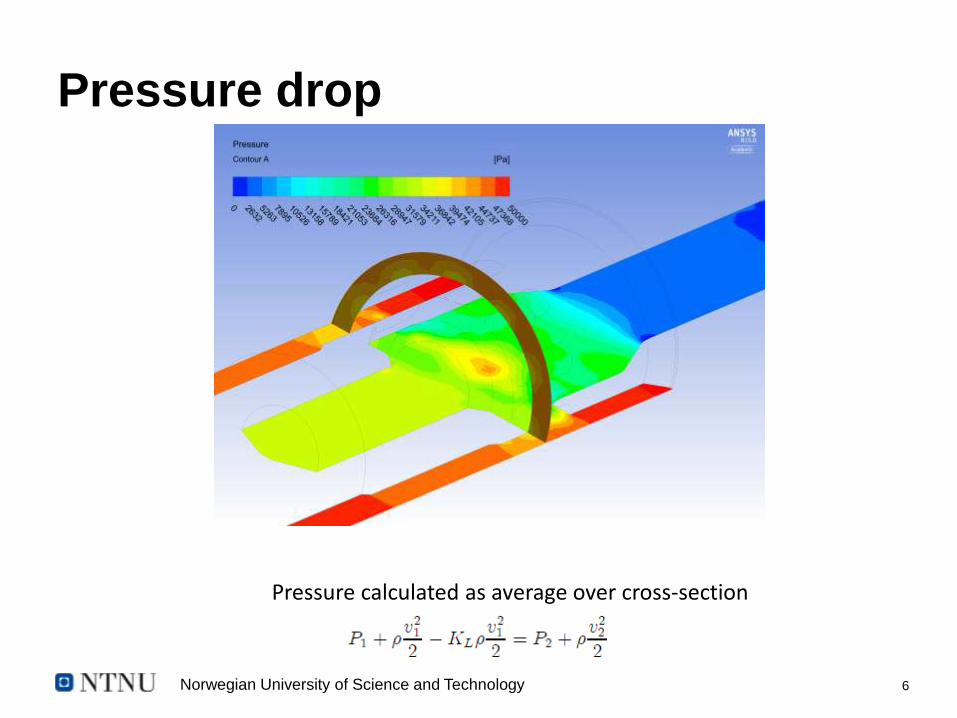
Pressure drop
Pressure calculated as average over cross-section
Norwegian University of Science and Technology 7
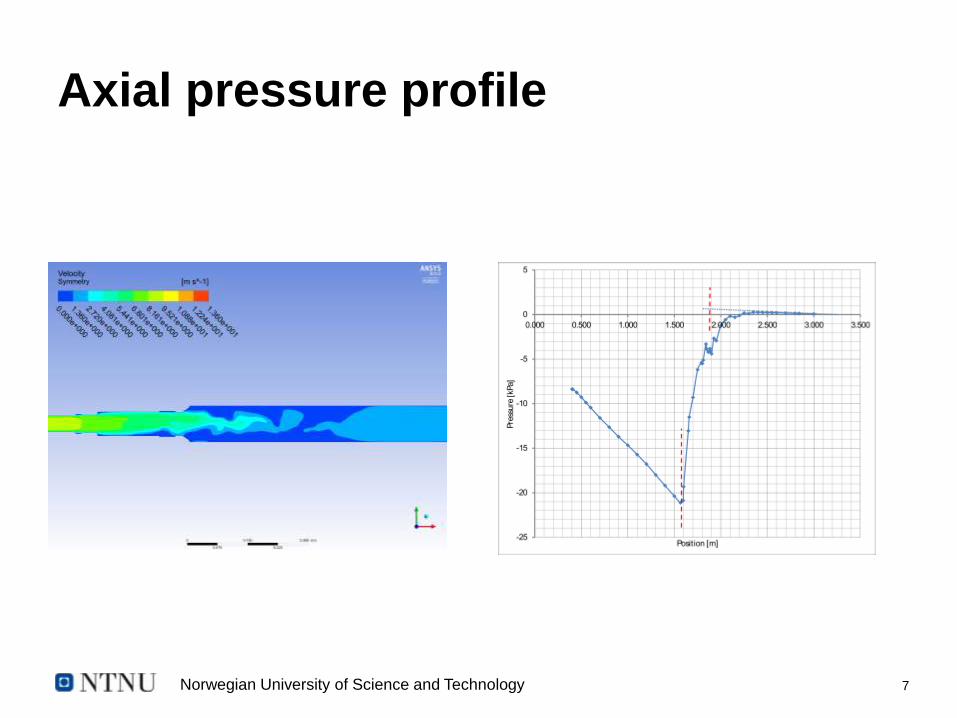
Axial pressure profile
Norwegian University of Science and Technology 8
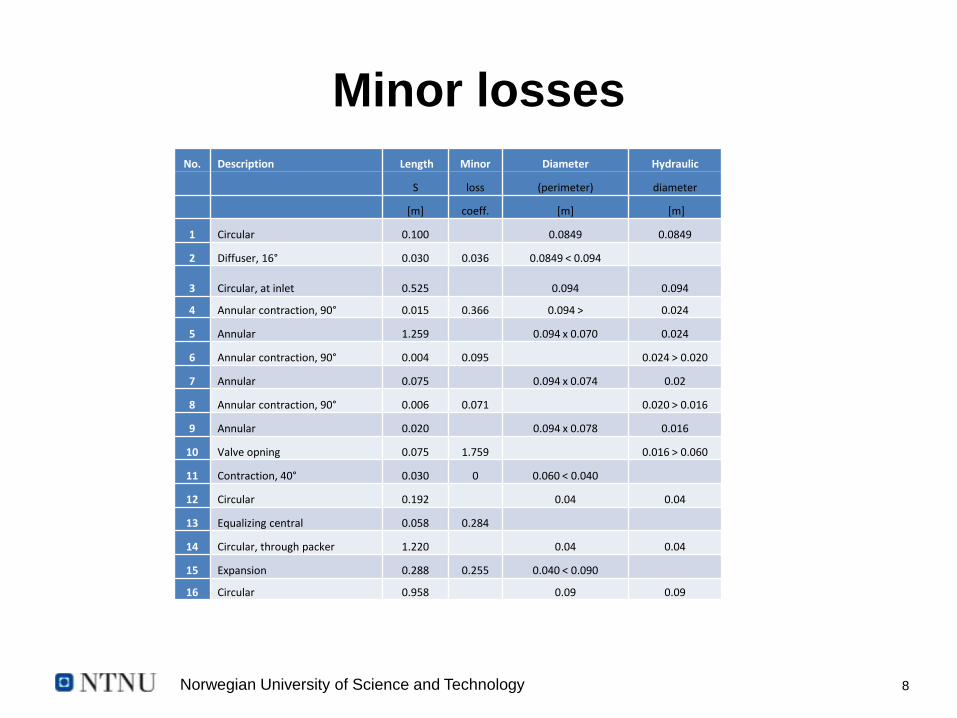
Minor losses
No. Description Length Minor Diameter Hydraulic
S loss (perimeter) diameter
[m] coeff. [m] [m]
1 Circular 0.100 0.0849 0.0849
2 Diffuser, 16° 0.030 0.036 0.0849 < 0.094
3 Circular, at inlet 0.525 0.094 0.094
4 Annular contraction, 90° 0.015 0.366 0.094 > 0.024
5 Annular 1.259 0.094 x 0.070 0.024
6 Annular contraction, 90° 0.004 0.095 0.024 > 0.020
7 Annular 0.075 0.094 x 0.074 0.02
8 Annular contraction, 90° 0.006 0.071 0.020 > 0.016
9 Annular 0.020 0.094 x 0.078 0.016
10 Valve opning 0.075 1.759 0.016 > 0.060
11 Contraction, 40° 0.030 0 0.060 < 0.040
12 Circular 0.192 0.04 0.04
13 Equalizing central 0.058 0.284
14 Circular, through packer 1.220 0.04 0.04
15 Expansion 0.288 0.255 0.040 < 0.090
16 Circular 0.958 0.09 0.09
Norwegian University of Science and Technology 9
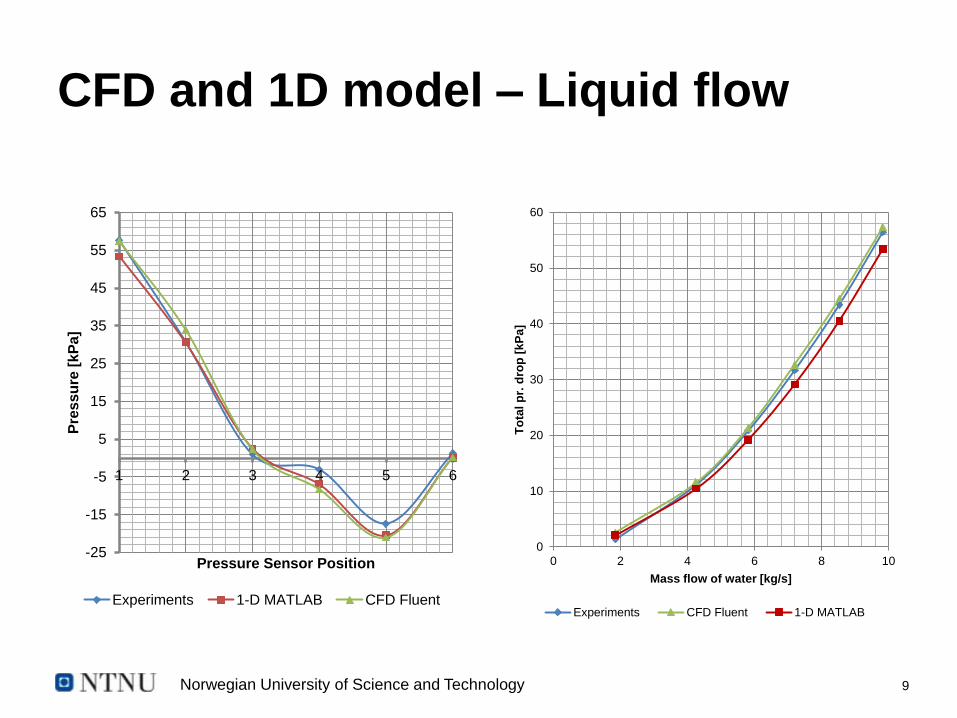
CFD and 1D model – Liquid flow
-25
-15
-5
5
15
25
35
45
55
65
1 2 3 4 5 6
Pre
ss
ure
[k
Pa
]
Pressure Sensor Position
Experiments 1-D MATLAB CFD Fluent
0
10
20
30
40
50
60
0 2 4 6 8 10
To
tal p
r. d
rop
[k
Pa
]
Mass flow of water [kg/s]
Experiments CFD Fluent 1-D MATLAB
Norwegian University of Science and Technology 10
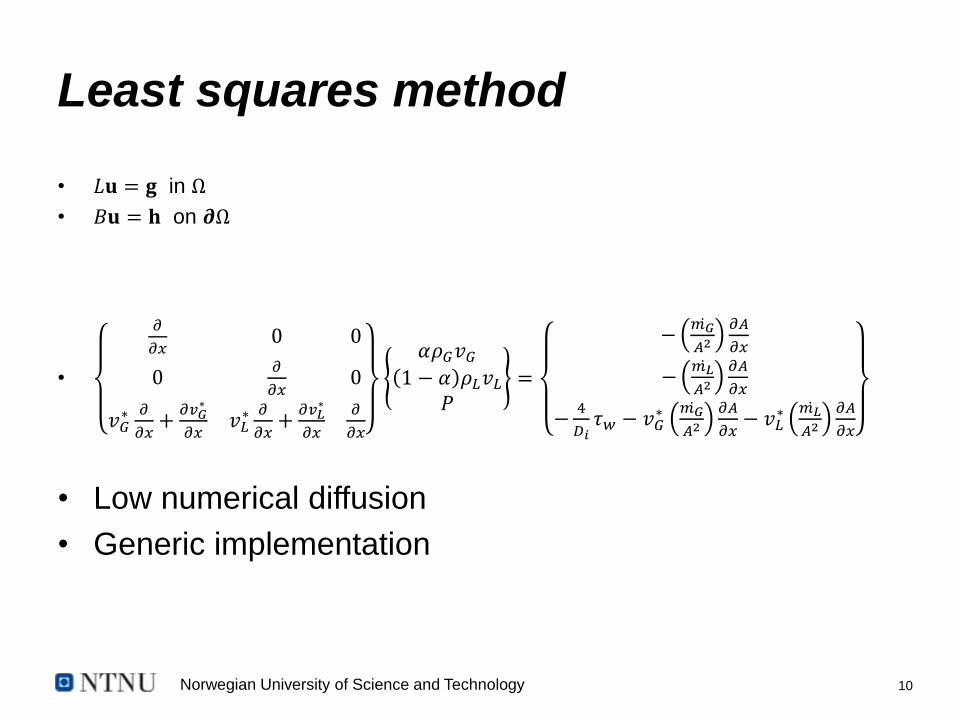
Least squares method
• 𝐿𝐮 = 𝐠 in Ω
• 𝐵𝐮 = 𝐡 on 𝝏Ω
•
𝜕
𝜕𝑥0 0
0𝜕
𝜕𝑥0
𝑣𝐺∗ 𝜕
𝜕𝑥+
𝜕𝑣𝐺∗
𝜕𝑥𝑣𝐿∗ 𝜕
𝜕𝑥+
𝜕𝑣𝐿∗
𝜕𝑥
𝜕
𝜕𝑥
𝛼𝜌𝐺𝑣𝐺1 − 𝛼 𝜌𝐿𝑣𝐿
𝑃=
−𝑚𝐺
𝐴2𝜕𝐴
𝜕𝑥
−𝑚𝐿
𝐴2𝜕𝐴
𝜕𝑥
−4
𝐷𝑖𝜏𝑤 − 𝑣𝐺
∗ 𝑚𝐺
𝐴2𝜕𝐴
𝜕𝑥− 𝑣𝐿
∗ 𝑚𝐿
𝐴2𝜕𝐴
𝜕𝑥
• Low numerical diffusion
• Generic implementation
Norwegian University of Science and Technology 11
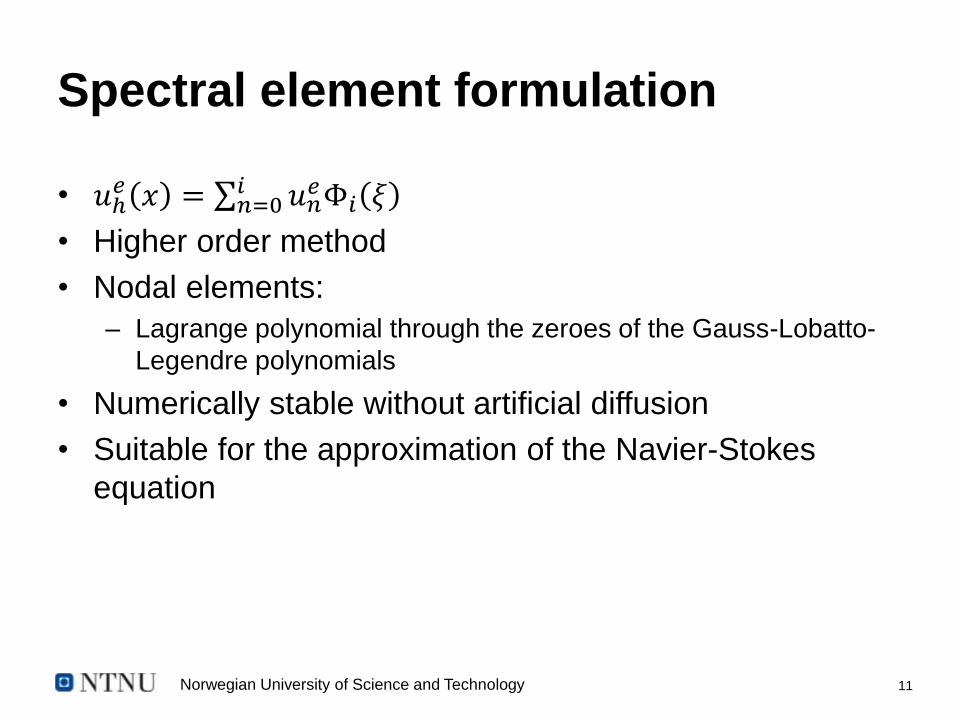
Spectral element formulation
• 𝑢ℎ𝑒 𝑥 = 𝑢𝑛
𝑒Φ𝑖 𝜉𝑖𝑛=0
• Higher order method
• Nodal elements:
– Lagrange polynomial through the zeroes of the Gauss-Lobatto-
Legendre polynomials
• Numerically stable without artificial diffusion
• Suitable for the approximation of the Navier-Stokes
equation
Norwegian University of Science and Technology 12
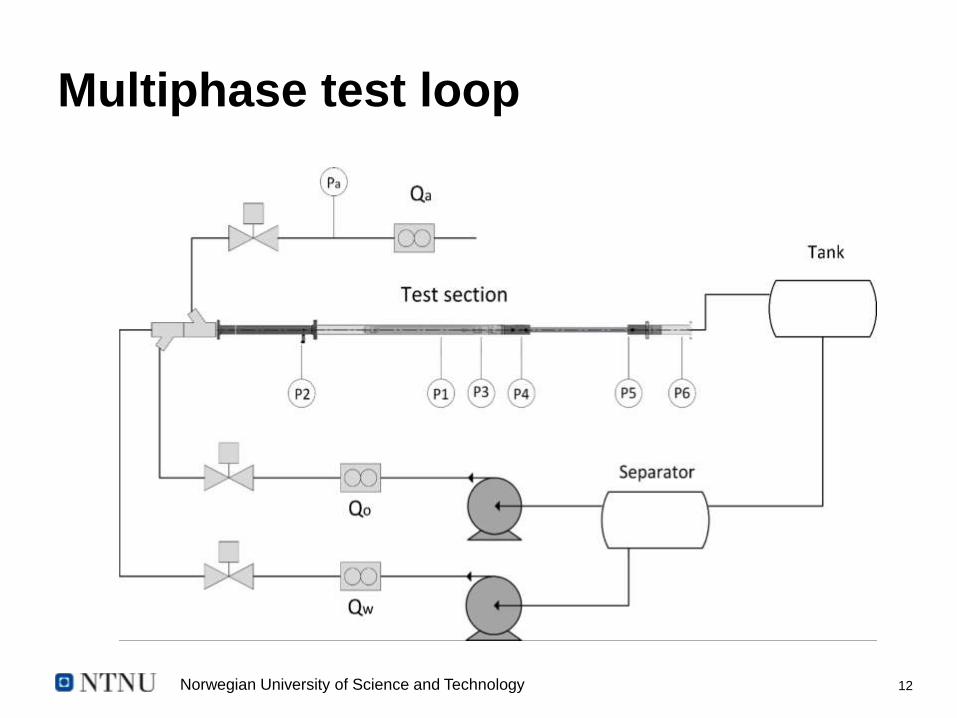
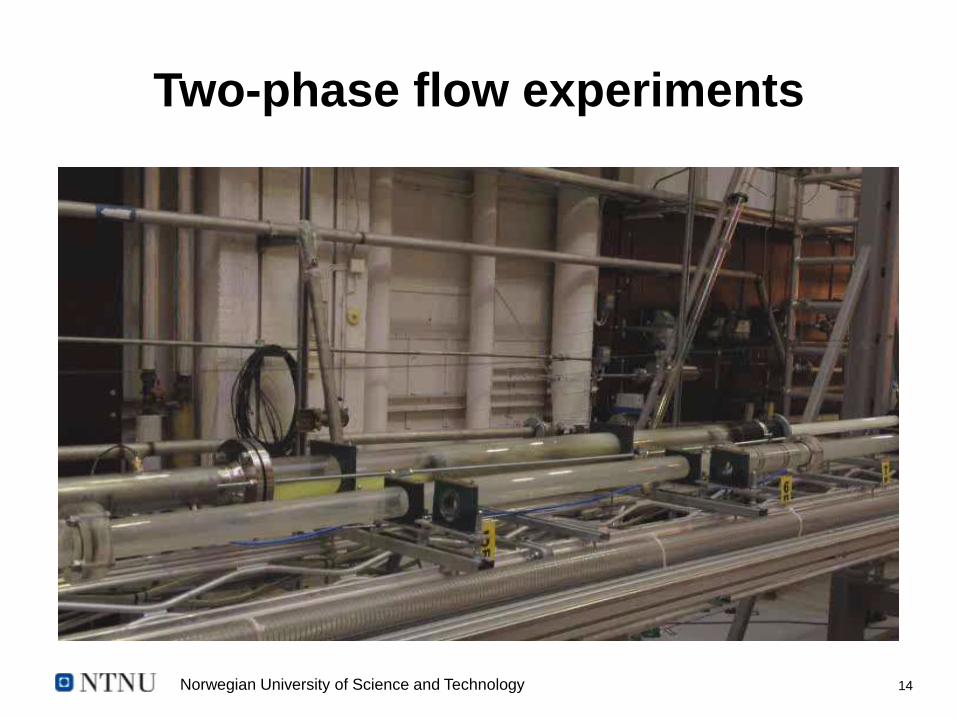
Multiphase test loop
Norwegian University of Science and Technology 13
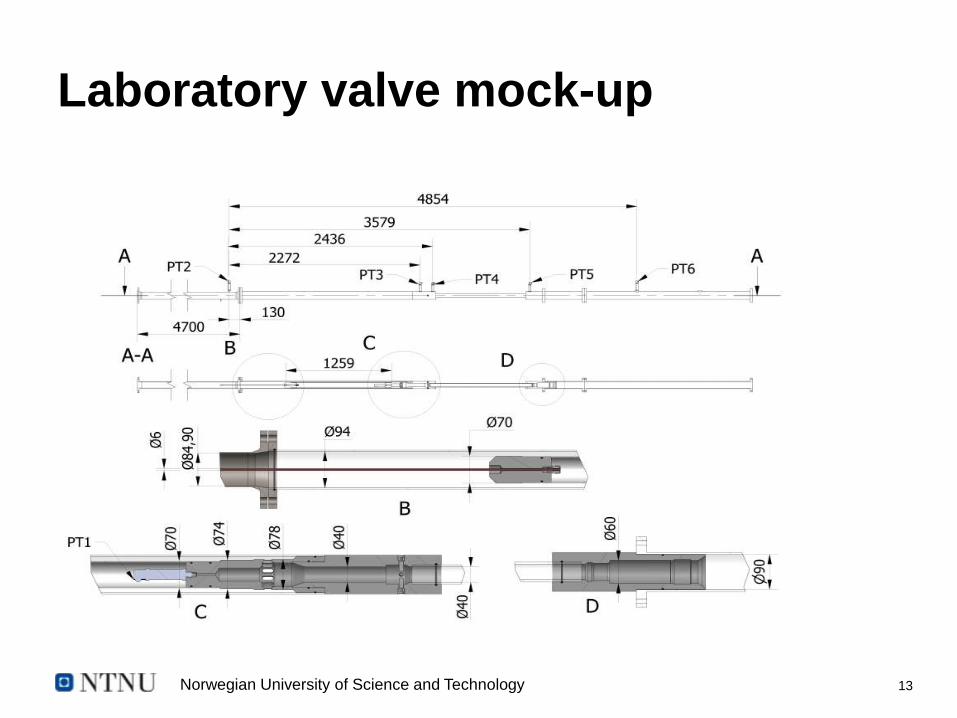
Laboratory valve mock-up
Norwegian University of Science and Technology 14
Two-phase flow experiments
Norwegian University of Science and Technology 15
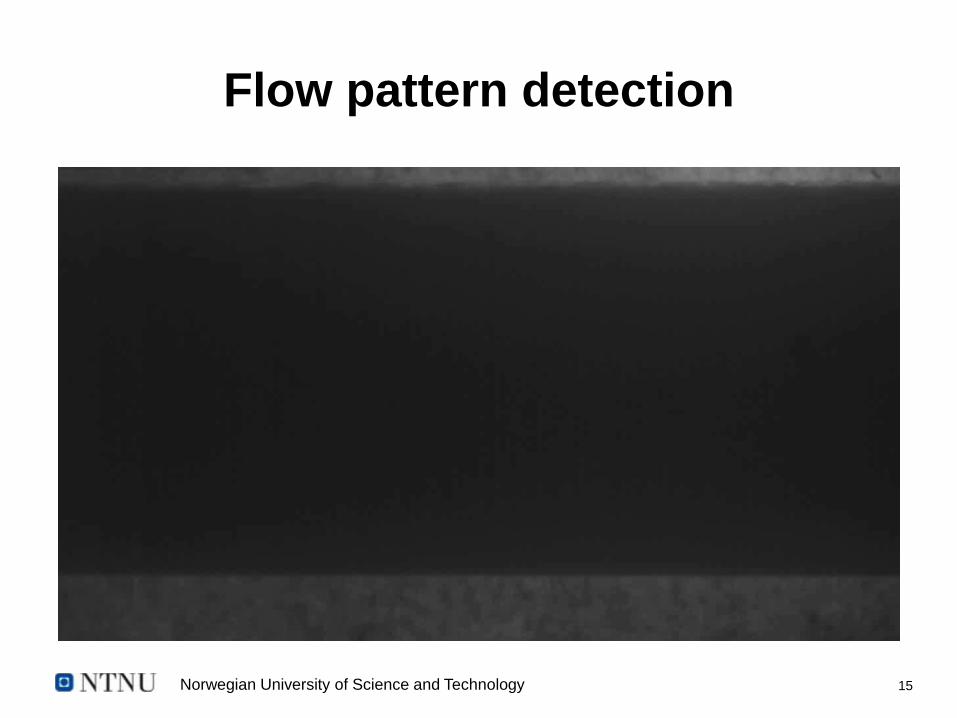
Flow pattern detection
Norwegian University of Science and Technology 16
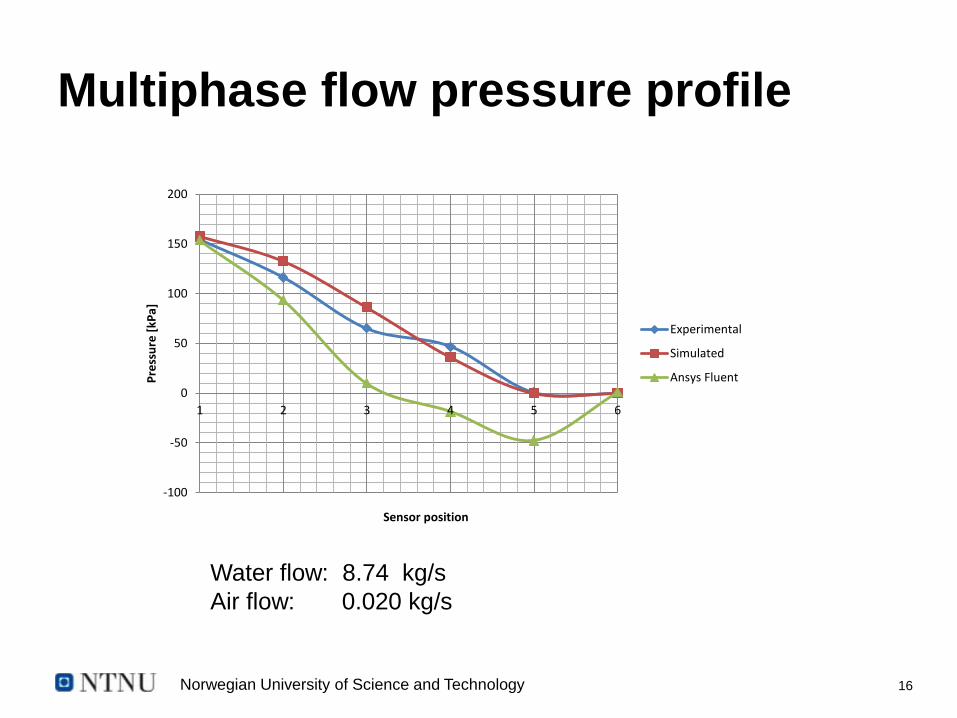
Multiphase flow pressure profile
-100
-50
0
50
100
150
200
1 2 3 4 5 6
Pre
ssu
re [
kPa]
Sensor position
Experimental
Simulated
Ansys Fluent
Water flow: 8.74 kg/s
Air flow: 0.020 kg/s
Norwegian University of Science and Technology 17
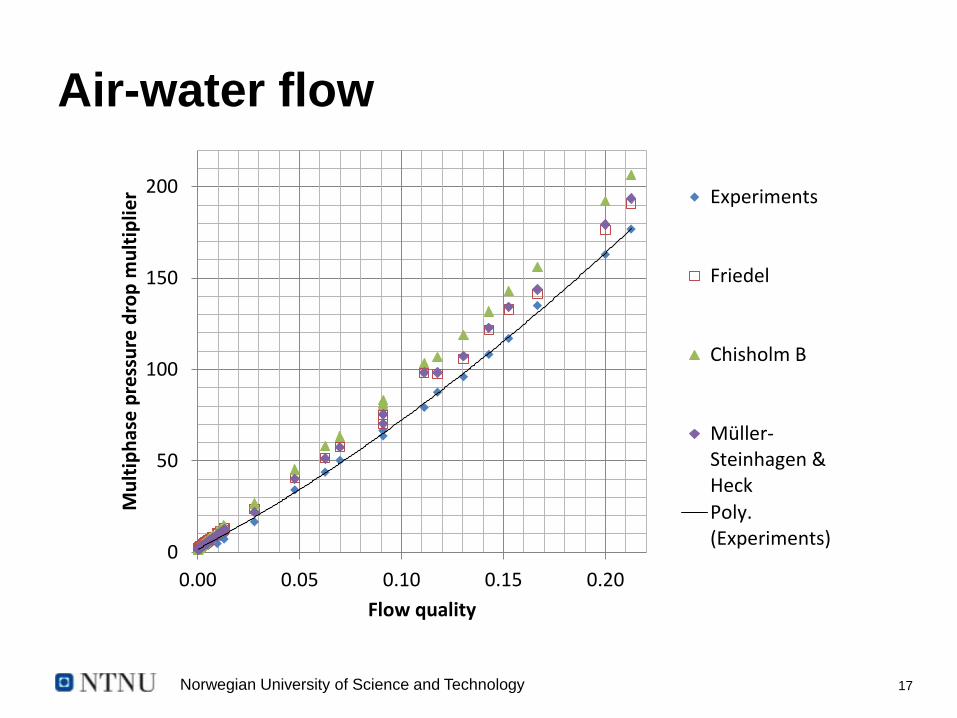
Air-water flow
0
50
100
150
200
0.00 0.05 0.10 0.15 0.20
Mu
ltip
has
e p
ress
ure
dro
p m
ult
iplie
r
Flow quality
Experiments
Friedel
Chisholm B
Müller-Steinhagen &Heck
Poly.(Experiments)
Norwegian University of Science and Technology 18
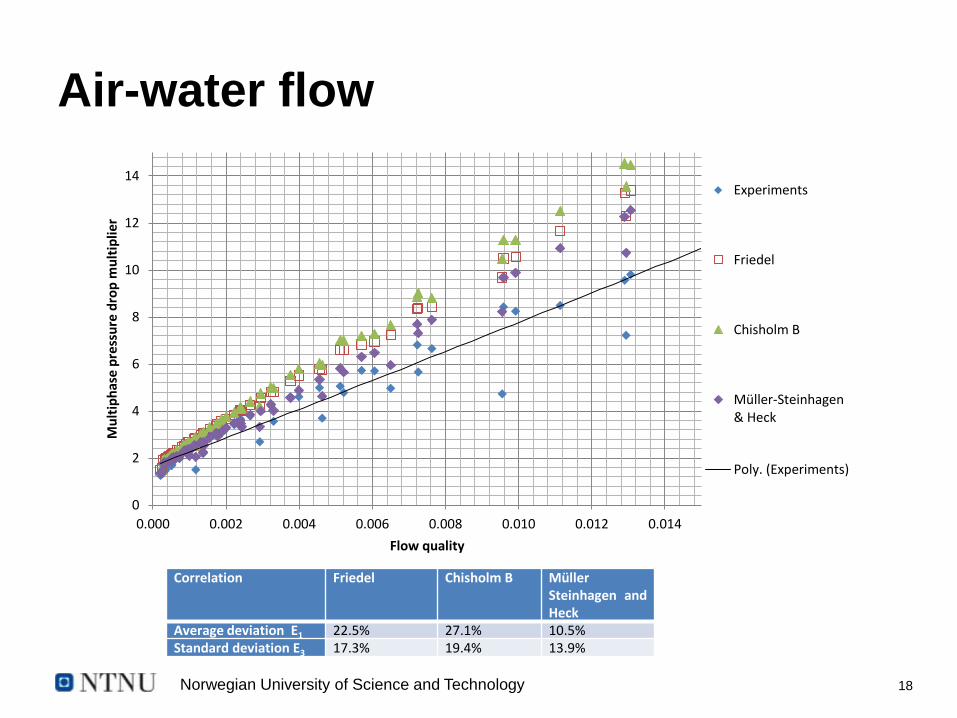
Air-water flow
0
2
4
6
8
10
12
14
0.000 0.002 0.004 0.006 0.008 0.010 0.012 0.014
Mu
ltip
has
e p
ress
ure
dro
p m
ult
iplie
r
Flow quality
Experiments
Friedel
Chisholm B
Müller-Steinhagen& Heck
Poly. (Experiments)
Correlation Friedel Chisholm B Müller Steinhagen and Heck
Average deviation E1 22.5% 27.1% 10.5%
Standard deviation E3 17.3% 19.4% 13.9%
Norwegian University of Science and Technology 19
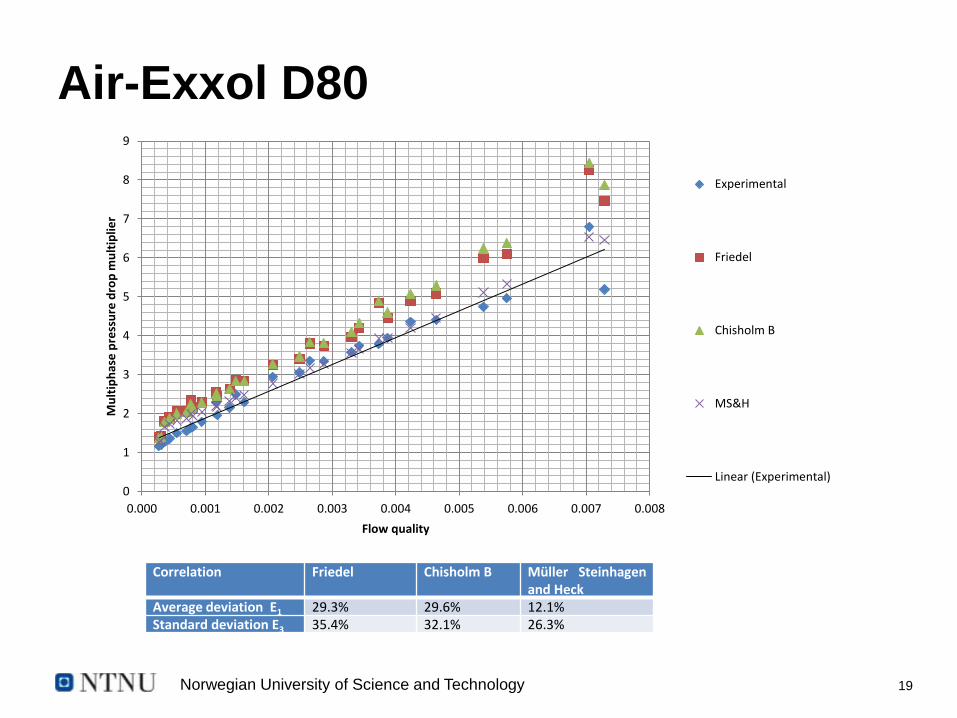
Air-Exxol D80
0
1
2
3
4
5
6
7
8
9
0.000 0.001 0.002 0.003 0.004 0.005 0.006 0.007 0.008
Mu
ltip
has
e p
ress
ure
dro
p m
ult
iplie
r
Flow quality
Experimental
Friedel
Chisholm B
MS&H
Linear (Experimental)
Correlation Friedel Chisholm B Müller Steinhagen and Heck
Average deviation E1 29.3% 29.6% 12.1%
Standard deviation E3 35.4% 32.1% 26.3%
Norwegian University of Science and Technology 20
Conclusions
• CFD simulation for single phase flow
• 1D Least Squares Spectral Element Model to be
developed from CFD simulation
• 1D LS-SEM method with Müller Steinhagen and Heck
correlation for two-phase flow
• Average deviation for pressure drop 10-12%


