Two-Port Transmission Line Technique for Dielectric Property Characterization of Polymer Electrolyte Membranes Zijie Lu, †,| Michael Lanagan, ‡ Evangelos Manias,* ,§ and Digby D. Macdonald* ,† Center for Electrochemical Science and Technology, Department of Materials Science and Engineering, Center for Dielectric Studies, Materials Research Lab, and Polymer Nanostructures Lab, Department of Materials Science and Engineering, Penn State UniVersity, UniVersity Park, PennsylVania 16802 ReceiVed: June 17, 2009; ReVised Manuscript ReceiVed: August 26, 2009 Performance improvements of perfluorosulfonic acid membranes, such as Nafion and Flemion, underline a need for dielectric characterization of these materials toward a quantitative understanding of the dynamics of water molecules and protons within the membranes. In this Article, a two-port transmission line technique for measuring the complex permittivity spectra of polymeric electrolytes in the microwave region is described, and the algorithms for permittivity determination are presented. The technique is experimentally validated with liquid water and polytertrafluoroethylene film, whose dielectric properties are well-known. Further, the permittivity spectra of dry and hydrated Flemion SH150 membranes are measured and compared to those of Nafion 117. Two water relaxation modes are observed in the microwave region (0.045-26 GHz) at 25 °C. The higher-frequency process observed is identified as the cooperative relaxation of bulk-like water, whose amount was found to increase linearly with water content in the polymer. The lower-frequency process, characterized by longer relaxation times in the range of 20-70 ps, is attributed to water molecules that are loosely bound to sulfonate groups. The loosely bound water amount was found to increase with hydration level at low water content and levels off at higher water contents. Flemion SH150, which has an equivalent weight of 909 g/equiv, displays higher dielectric strengths for both of these water modes as compared to Nafion 117 (equivalent weight of 1100 g/equiv), which probably reflects the effect of equivalent weight on the polymers’ hydrated structure, and in particular on the extended ionic cluster domains. 1. Introduction Perfluorosulfonic acid (PFSA) polymer electrolytes have attracted much attention over the past decade because of their applications in polymer electrolyte membrane fuel cells (PEM- FC), as well as in other electrochemical devices such as electrochemical sensors and water electrolyzers. 1-3 Especially, their application to PEMFC has led to extensive research of their structure-property relations. Nafion (a DuPont registered trademark polymer) has become the prototypical polymer electrolyte because it combines high proton conductivity with a high electrochemical stability and good thermomechanical properties. Nafion combines, in one molecule, a hydrophobic backbone and hydrophilic sulfonic-acid functionalized side groups, which promote a microphase separation between the polar (hydrophilic) and nonpolar (hydrophobic) constituents. 4,5 In its hydrated form, Nafion’s hydrophilic (nano)phases contain water and acidic groups and can become interconnected to provide pathways for the transport of dissociated protons; concurrently, the hydrophobic domains, consisting of the fluorocarbon backbone, provide good mechanical and thermal stability. The structure and morphology of Nafion have been reported in several comprehensive reviews. 6,7 PFSA membranes are essentially water-based electrolytes because they are only operational when sufficient amount of water is absorbed within the polymer and around the sulfonic- acid groups. This particular feature enables the use of dielectric relaxation spectroscopy (DRS), which monitors the cooperative motion of polar molecular assemblies, providing a powerful tool for the characterization of these materials. DRS probes the response of the total dipole moment of a system, M(t) ) ∑µ i (t), inside a time-dependent external electrical field; µ i represents the individual molecular dipole moments. The dielectric proper- ties of a material are described by the complex relative permittivity spectrum: with ε′(ω) denoting the relative permittivity, and ε′′(ω) the dielectric loss (or absorption), both being functions of frequency (ω ) 2πf); j ) -1 is the imaginary unit. The dielectric properties of polymer electrolytes are dictated by the molecular structure of the system and the physical state of water in these materials. 8-11 As such, dielectric spectra can provide insights into both the state of water and, indirectly, the hydrated structure of the polymer. Furthermore, the dielectric relaxation behavior provides correlations between the polymer environment and the cooperative solvent dynamics, which can unveil important insights on the water and proton transport in these membranes. 12-14 It is widely accepted that water confined in systems such as reverse micelles possesses different dynamics as compared to bulk/free water. As structural diffusion (i.e., the Grotthuss mechanism) of protons in bulk water requires coordinated formation and cleavage of hydrogen bonds of water molecules in the second hydration shell of the hydrated proton (Zundel * Corresponding author. D.D.M.: Tel., (814) 863-7772; fax, (814) 863- 4718; e-mail, [email protected]. E.M.: E-mail, [email protected]. † Center for Electrochemical Science and Technology. ‡ Center for Dielectric Studies. § Polymer Nanostructures Lab. | Current address: Department of Mechanical Engineering, Rochester Institute of Technology, Rochester, NY 14623. ε*(ω) ) ε′(ω) -jε″(ω) (1) J. Phys. Chem. B XXXX, xxx, 000 A 10.1021/jp9057115 CCC: $40.75 XXXX American Chemical Society 1 2 3 4 5 6 7 8 9 10 11 12 13 14 15 16 17 18 19 20 21 22 23 24 25 26 27 28 29 30 31 32 33 34 35 36 37 38 39 40 41 42 43 44 45 46 47 48 49 50 51 52 53 54 55 56 57 58 59 60 61 62 63 64 65 66 67 68 69 70 71 72 73 74 PAGE EST: 8.1
Transcript
Two-Port Transmission Line Technique for Dielectric Property Characterization of PolymerElectrolyte Membranes
Zijie Lu,†,| Michael Lanagan,‡ Evangelos Manias,*,§ and Digby D. Macdonald*,†
Center for Electrochemical Science and Technology, Department of Materials Science and Engineering, Centerfor Dielectric Studies, Materials Research Lab, and Polymer Nanostructures Lab, Department of MaterialsScience and Engineering, Penn State UniVersity, UniVersity Park, PennsylVania 16802
ReceiVed: June 17, 2009; ReVised Manuscript ReceiVed: August 26, 2009
Performance improvements of perfluorosulfonic acid membranes, such as Nafion and Flemion, underline aneed for dielectric characterization of these materials toward a quantitative understanding of the dynamics ofwater molecules and protons within the membranes. In this Article, a two-port transmission line techniquefor measuring the complex permittivity spectra of polymeric electrolytes in the microwave region is described,and the algorithms for permittivity determination are presented. The technique is experimentally validatedwith liquid water and polytertrafluoroethylene film, whose dielectric properties are well-known. Further, thepermittivity spectra of dry and hydrated Flemion SH150 membranes are measured and compared to those ofNafion 117. Two water relaxation modes are observed in the microwave region (0.045-26 GHz) at 25 °C.The higher-frequency process observed is identified as the cooperative relaxation of bulk-like water, whoseamount was found to increase linearly with water content in the polymer. The lower-frequency process,characterized by longer relaxation times in the range of 20-70 ps, is attributed to water molecules that areloosely bound to sulfonate groups. The loosely bound water amount was found to increase with hydrationlevel at low water content and levels off at higher water contents. Flemion SH150, which has an equivalentweight of 909 g/equiv, displays higher dielectric strengths for both of these water modes as compared toNafion 117 (equivalent weight of 1100 g/equiv), which probably reflects the effect of equivalent weight onthe polymers’ hydrated structure, and in particular on the extended ionic cluster domains.
1. Introduction
Perfluorosulfonic acid (PFSA) polymer electrolytes haveattracted much attention over the past decade because of theirapplications in polymer electrolyte membrane fuel cells (PEM-FC), as well as in other electrochemical devices such aselectrochemical sensors and water electrolyzers.1-3 Especially,their application to PEMFC has led to extensive research oftheir structure-property relations. Nafion (a DuPont registeredtrademark polymer) has become the prototypical polymerelectrolyte because it combines high proton conductivity witha high electrochemical stability and good thermomechanicalproperties. Nafion combines, in one molecule, a hydrophobicbackbone and hydrophilic sulfonic-acid functionalized sidegroups, which promote a microphase separation between thepolar (hydrophilic) and nonpolar (hydrophobic) constituents.4,5
In its hydrated form, Nafion’s hydrophilic (nano)phases containwater and acidic groups and can become interconnected toprovide pathways for the transport of dissociated protons;concurrently, the hydrophobic domains, consisting of thefluorocarbon backbone, provide good mechanical and thermalstability. The structure and morphology of Nafion have beenreported in several comprehensive reviews.6,7
PFSA membranes are essentially water-based electrolytesbecause they are only operational when sufficient amount of
water is absorbed within the polymer and around the sulfonic-acid groups. This particular feature enables the use of dielectricrelaxation spectroscopy (DRS), which monitors the cooperativemotion of polar molecular assemblies, providing a powerful toolfor the characterization of these materials. DRS probes theresponse of the total dipole moment of a system, M(t) ) ∑µi(t),inside a time-dependent external electrical field; µi representsthe individual molecular dipole moments. The dielectric proper-ties of a material are described by the complex relativepermittivity spectrum:
with ε′(ω) denoting the relative permittivity, and ε′′(ω) thedielectric loss (or absorption), both being functions of frequency(ω ) 2πf); j ) -1 is the imaginary unit. The dielectricproperties of polymer electrolytes are dictated by the molecularstructure of the system and the physical state of water in thesematerials.8-11 As such, dielectric spectra can provide insightsinto both the state of water and, indirectly, the hydrated structureof the polymer. Furthermore, the dielectric relaxation behaviorprovides correlations between the polymer environment and thecooperative solvent dynamics, which can unveil importantinsightson thewaterandproton transport in thesemembranes.12-14
It is widely accepted that water confined in systems such asreverse micelles possesses different dynamics as compared tobulk/free water. As structural diffusion (i.e., the Grotthussmechanism) of protons in bulk water requires coordinatedformation and cleavage of hydrogen bonds of water moleculesin the second hydration shell of the hydrated proton (Zundel
† Center for Electrochemical Science and Technology.‡ Center for Dielectric Studies.§ Polymer Nanostructures Lab.| Current address: Department of Mechanical Engineering, Rochester
Institute of Technology, Rochester, NY 14623.
ε*(ω) ) ε′(ω) -jε″(ω) (1)
J. Phys. Chem. B XXXX, xxx, 000 A
10.1021/jp9057115 CCC: $40.75 XXXX American Chemical Society
1
2
3
4
5
6
7
8
9
10
11
12
13
14
15
16
17
18
19
20
21
22
23
24
25
26
27
28
29
30
31
32
33
34
35
36
37
38
39
40
41
42
43
44
45
46
47
48
49
50
51
52
53
54
55
56
57
58
59
60
61
62
63
64
65
66
67
68
69
70
71
72
73
74
PAGE EST: 8.1
and Eigen ions15,16) and, thus, requires rotational relaxation,consequently, any constraint to the dynamics of the watermolecules will decrease the mobility of the protons.
However, despite their obvious importance, the availabledielectric data for PFSA polymer electrolytes are rather limited.Yeo and Eisenberg17 carried out the dynamic mechanical anddielectric studies of hydrated perfluorosulfonate polymers andobserved dielectric dispersions in the relaxation region, whichwere postulated to be related to the polar regions. Similarrelaxation process was also observed in K+-exchanged Nafion18,19
and in Nafion/(MxOy)n composite membrane.20 Mauritz andco-workers21,22 reported constant temperature dielectric relax-ation analyses of Nafion membranes imbibed with various ionsattempting to model long-range ion transport. These investiga-tions were limited to low frequencies (f < 10 MHz), and nospecific information about the water dynamics was observed.Starkweather and Chang23 observed water dielectric relaxationin the low-frequency range at low temperatures. However, foraqueous and water-based electrolytes at ambient temperature,the dielectric relaxation of water-containing regions is in themicrowave frequency region, and its measurement requiresspecial instrumentation. The high specific electric conductivity,σ, of these systems presents another challenge because only thetotal loss of the sample
is experimentally accessible; ε0 is the permittivity of the vacuum.Obviously, the ohmic loss, ησ′′, dominates the total dielectricloss below a minimum frequency, which is characteristic of eachsystem, and in the case of hydrated PFSA usually lies in theradio frequency (RF) and microwave frequency ranges, thuslimiting the spectral range accessible to experiments.11 There-fore, there is a clear need for accurate high-frequency (micro-wave) dielectric characterization techniques, capable of robustquantitative measurement of the dielectric properties of variouselectrolytes, including aqueous and polymeric materials.
Currently, there are several available microwave dielectricproperty measurement techniques. The open-ended coaxial probetechnique enables convenient and nondestructive measurementsof the dielectric properties of infinite half-space solids andliquids24-26 and has been extended to the measurements of finite-thickness layered materials.24,27 Paddison et al.28,29 used thetechnique to measure the dielectric properties of Nafion 117 inthe frequency range of 0.045-30 GHz. However, the employ-ment of a reflection geometry yielded very poor qualitypermittivity spectra, and, thus, no detailed information aboutdiscrete water relaxations could be obtained, beyond theexpected dependence of the dielectric constant and of the lossfactors on the water content.28,29 Moreover, improper contactbetween the probe aperture and the material surface can resultin significant errors in measuring its dielectric properties.Resonant cavity methods render accurate measurements, but theyare not broadband and are generally limited to low loss values(tan δ < 0.02). On the other hand, transmission line techniquesare relatively accurate in measuring the broadband dielectricproperties of intermediate and high loss dielectric materials. Ofthese, the two-port transmission line techniques30,31 are presentlywidely used. In general, these techniques make use of thereflected and/or transmitted waves by and through a dielectric-filled transmission line to analytically or numerically determinethe dielectric properties of the material. In addition, the two-port transmission line techniques are well suited for the dielectric
measurement of polymeric electrolytes. In this case, a preciselycut sample is placed in a section of transmission lines, and thecomplex scattering parameters are measured over a widefrequency range. The scattering equations relate the reflected/transmitted waves to the permittivity and permeability of thematerial. The dielectric properties of a material are thendetermined analytically or numerically from the relevant scat-tering parameters.
In our previous work, we have studied the dielectricrelaxation spectroscopy of Nafion 117 combining normalbroadband dielectric spectroscopy (for low frequencies) andtwo-port microwave transmission line method (for microwavefrequencies).11 In that work, we directly observed andidentified at least two water relaxation mechanisms in themicrowave frequency range within the hydrated membrane,in addition to a third, much slower, mode of the stronglybound water in the hydration shells around the acidicgroups.11 In this present work, the emphasis is on furtherdevelopment of this microwave frequency transmissiontechnique, including examining the scattering equations indetail, presenting a simplified iterative numerical method forobtaining the dielectric spectra, and validating the techniqueusing pure water and PTFE film whose dielectric propertiesare well-known. A second goal of this Article is tocomparatively investigate the dielectric relaxation behaviorof an additional PFSA membrane having different equivalentweight (EW) from Nafion-11x. It is believed that EW is animportant factor in determining the structure of the membraneand the dynamics of protons and water molecules within themembrane. For this purpose, the dielectric spectra of FlemionSH 150, which has a chemical structure similar to that ofNafion 117 but has a lower equivalent weight (EW ) 909g/equiv vs EW ) 1100 for Nafion-11x), were measured usingthe two-port transmission line technique and compared tothose of Nafion 117.
2. Theoretical Background
2.1. Theory. The main part of the experimental setup isshown in Figure 1a. In this setup, a dielectric sample is installedin a coaxial air-filled line with characteristic impedance Z0.Within the sample region, the line will assume a new charac-teristic impedance Z ) (µj*/ε*)Z0, where ε* and µ* are thecomplex relative permittivity and permeability of the sample.The reflection coefficient (Γ) at the interface between the air-filled line and dielectric-filled line when the material sample isinfinite in length is given by
The dielectric sample can be viewed as a two-port devicecharacterized by the scattering parameters, S11 and S21, whichrepresent the sum of reflected and transmitted waves, respec-tively. It is not necessary for the sample to completely fill thefull length of the coaxial line. The air-filled waveguide sections(regions I and III in Figure 1a) are included here, to take intoaccount the offset between the calibration plane and themeasurement plane. The network analyzer system calibrationand measurement are obtained at the reference planes indicatedin Figure 1.
The scattering parameters are found from an analysis of theelectric field at the sample interfaces.31 The fundamentalpropagation mode for waves in a coaxial system is the transverse
η′′(ω) ) ε′′(ω) + ησ′′ ) ε′′(ω) + σ
ωε0(2)
Γ )z-z0
z + z0)
√µ*/ε*-1
√µ*/ε* + 1(3)
B J. Phys. Chem. B, Vol. xxx, No. xx, XXXX Lu et al.
75
76
77
78
79
80
81
82
83
84
85
86
87
88
89
90
91
92
93
94
95
96
97
98
99
100
101
102
103
104
105
106
107
108
109
110
111
112
113
114
115
116
117
118
119
120
121
122
123
124
125
126
127
128
129
130
131
132
133
134
135
136
137
138
139
140
141
142
143
144
145
146
147
148
149
150
151
152
153
154
155
156
157
158
159
160
161
162
163
164
165
166
167
168
169
170
171
172
173
174
175
176
177
178
179
180
181
182
183
184
185
186
187
188
189
190
191
192
F1
electromagnetic wave (TEM). The spatial distribution of theelectric field in the regions I, II, and III, for an incident fieldnormalized to 1, can be written as:
where γ is the complex propagation constant given by
where ε0 and µ0 are the permittivity and magnetic permeabilityof vacuum, and ω is the angular frequency (ω ) 2πf). ε*ε0 andµ*µ0 are the absolute permittivity and magnetic permeabilityof the medium. In the air-filled regions I and III, γ reduces toγ0 ) jω(εj0µ0). The constants Ci are determined by appropri-ate matching of the tangential electric and magnetic fields atall boundaries:
The reflection (S11) and transmission scattering parameters (S21)are thus obtained by solving eqs 4-6 subject to the boundaryconditions (eqs 8-11). The explicit expressions are given by
where R1 and R2 are the reference plane transformations andare expressed by
It should be noted that the same relations have also been derivedthrough other procedures.32,33 In this Article, the dielectricspecimens are assumed to be nonmagnetic (µ* ) 1), and,therefore, the reflection coefficient at the interface between theair-filled transmission line and dielectric-filled line can besimplified as:
2.2. Solving for the Dielectric Properties. The S-parametersof the two-port transmission line setup are measured using anHP8510C vector network analyzer. Each S-parameter measure-ment is subsequently corrected for the reference plane trans-formation (eqs 12-15). The dielectric properties of the specimenare then calculated from these S-parameters.
Several algorithms, such as the well-known NWR procedure(Nicolson and Ross32 and Weir34) and an improved transmission/reflection technique,31 have been developed to obtain thepermittivity and permeability from scattering measurements. Inthese procedures, both the reflected and the transmitted S-parameters (S11 and S21) are combined, and multiple measure-ments are needed. However, for high dielectric loss material(such as Nafion or Flemion membranes), measurement of S21
allows for a higher accuracy than that of S11.35 Therefore, inthis work, the dielectric properties are determined by measuringthe frequency dependence of the transmission S-parameter S21.It should be noted that the analytical solution for the permittivityis difficult to obtain from eq 13, and numerical methods areused instead.
Figure 1. (a) Geometry of the measurement setup for the two-port transmission line technique. Port 1 and port 2 denote calibration reference planepositions. (b) The incidence (inc), reflected (refl), and transmitted (trans) electric field/voltage distributions in regions I, II, and III.
ΕI)exp(-γ0x) + C1 exp(γ0x) (4)
EII ) C2 exp(-γx)+ C3 exp(γx) (5)
ΕIII)C4 exp(-γ0x) (6)
γ ) R + j ) jω√ε*ε0µ*µ0 (7)
ΕI(x ) L1) ) ΕII(x ) L1) (8)
ΕII(x ) L1 + L) ) ΕIII(x ) L1 + L) (9)
1µ0
∂EI
∂x(x ) L1) )
1µ
∂EII
∂x(x ) L1) (10)
1µ
∂EII
∂x(x ) L1 + L) ) 1
µ0
∂EIII
∂x(x ) L1 + L) (11)
S11 ) R12[Γ(1 - exp(-2γL))
1 - Γ2 exp(-2γL)] (12)
S21 ) R1R2[exp(-γL)(1 - Γ2)
1 - Γ2 exp(-2γL)] (13)
R1 ) exp(-γ0L1) (14)
R2 ) exp(-γ0L2) (15)
Γ ) 1 - √ε*
1 + √ε*(16)
Two-Port Transmission Line Technique J. Phys. Chem. B, Vol. xxx, No. xx, XXXX C
193
194
195
196
197
198
199
200
201
202
203
204
205
206
207
208
209
210
211
212
213
214
215
216
217
218
219
220
221
222
223
224
225
226
227
228
229
230
231
232
233
234
S21 is usually a complex number and is expressed in termsof magnitude and phase, S21 ) |S21|ejφ. The phase φ is relatedto the permittivity (ε′(ω)) and the sample length (L) throughthe phase factor as
where λ0 is the wavelength in vacuum. The real part of thepermittivity is then calculated from eq 17. After determinationof ε′(ω), the imaginary part of the complex permittivity ε′′(ω)is iteratively obtained from the magnitude of S21. In thispredictor-corrector numerical procedure, an initial value forε′′(ω) is estimated, and the S21 magnitude is calculated. Theestimated ε′′(ω) is then changed to minimize the differencebetween calculated and measured S21. The data processing iscarried out with a self-built computer program.
The uncertainty of the two-port transmission line technique canbe divided into two parts. The first regards the accuracy of themeasured S-parameter, which is primarily dependent on the S21
magnitude and equipment precision.36 For our instrumentation andfor a typical S21 magnitude less than -30 dB, the error is betterthan 0.5%, but it increases rapidly with the S21 magnitude below-40 dB. For example, for S21 values below -50 dB, the measurederror is in excess of 5%. The second issue is the accuracy of thecalculated complex permittivity. To calculate the uncertainties inthe permittivity (∆ε′/ε′) and the dielectric loss (∆ε′′/ε′′), it isnecessary to calculate the partial derivative of the permittivity withrespect to the S-parameter, (∂ε*)/(∂S21). For static permittivity lessthan 100, which is the case of polymer electrolytes, typical errorsfor the complex permittivity are 2% for ε′ and 3% for ε. Othercontributions to the error arise from sample length measurements,air gaps around the sample, and waveguide mismatch. These errorterms are minimized by careful sample preparation and operation.Detailed uncertainty analysis of this technique can be found in ref35.
3. Technique Validation and Experimental Section
3.1. Validation of the Transmission Line Technique. Avector network analyzer HP8510C, with a broadband sweepgenerator synthesized signals from 45 MHz to 26 GHz, wasused to measure the complex transmission parameter S21. A 7mm coaxial line (10 cm long) was connected to HP8510Cthrough two standard transmission lines with impedance of 50Ω. Before measurement, the system was calibrated with an open,a short, and a known load (50 Ω). Calibration of S21 magnitudewas made by performing a simple through connection with airas the dielectric medium.
As a first evaluation of the two-port transmission linetechnique, the dielectric spectra of deionized water (Millipore,18.2 MΩ cm) were measured at 25 °C. Because of the highdielectric loss of water, several sample lengths, varying from10 to 1 cm, were used to obtain the optimal measurement forthe various frequencies across the dielectric spectrum. Theselection of the sample length was guided by the followingempirical equation, which was obtained by Stuchly and Ma-tuszewski37 and gave minimal experimental uncertainty:
where L/λ represents the normalized sample length. In themeasurements of liquid water, the coaxial line was fixed in a
vertical position, and L1 was set to 0. A thin layer of vacuumgrease, whose dielectric properties are close to that of air, wasplaced in the probe connector to prevent liquid leakage. Similarapproaches were also described in literature, where a dielectricplug was normally used to seal the liquid.38,39 The influence ofthe dielectric plug on the measurement was generally assumedto be negligible and was not taken into account in the theoreticalformulation of the problem.
The dielectric spectra of water at 25 °C are shown in Figure2. From this figure, ε′(ω) falls with increasing frequency, andε′′(ω) shows a peak at around 18 GHz. The spectra are bestfitted by a Debye relaxation model (R ) 0 and ) 1, see eq20). The static permittivity from the best fitting is 79.13, whichagrees within 1% with literature data.40,41 The correspondingrelaxation time is obtained to be 8.31 ps, which agrees within0.5% with literature data.40,42
To assess the validity of the transmission line technique forthe medium in film form, initial measurements were also madeon thin strips of polytertrafluoroethylene (PTFE) film (McMas-ter, 0.003” thick, electronic grade) at different sample lengths.The dielectric spectra are shown in Figure 3 for two lengths, 5and 1 cm. In contrast to liquid water, the PTFE sample lengthhas little, if any at all, influence on the dielectric spectra due toits low dielectric loss. The relative permittivity of Teflon isconstant at around 2.0 over the frequency range of 0.045-26GHz. This result agrees well with the dielectric constant of 2.055reported by Geyer and Krupka for Teflon at 9.93 GHz.41 Thedielectric loss of PTFE film is found to be very small (in theorder of 0.001) but exhibits scattering over the frequency range.The initial experiments on water and PTFE film indicate thatthe two-port transmission line technique is appropriate for thedielectric measurements of both aqueous and polymericelectrolytes.
3.2. Dielectric Spectra Measurements of Flemion SH150.In our previous work, we measured the dielectric spectra ofhydrated Nafion 117 with the two-port transmission line methodand identified at least two water relaxations in the frequencyrange of 0.1-26 GHz.11 To study the dielectric relaxationbehavior of the membranes having different equivalent weight(EW), we measure in this work the microwave dielectric spectraof another perfluorated sulfonic acid membrane, Flemion SH150,which has a lower equivalent weight (EW ) 909 g/equiv versusEW ) 1100 for Nafion 117). Table 1 lists the chemical structureand physical properties of Flemion SH150 and the corresponding
φ ) -L ) -2π√ε′(ω)λ0
L (17)
Lλ) 1
4|ε*(ω)|-1/2 (18)
Figure 2. Complex permittivity spectra of liquid water in the frequencyrange of 108 Hz to 26 GHz obtained by varying sample lengths. Thesolid lines are the best fitting using one Debye relaxation process.
D J. Phys. Chem. B, Vol. xxx, No. xx, XXXX Lu et al.
235
236
237
238
239
240
241
242
243
244
245
246
247
248
249
250
251
252
253
254
255
256
257
258
259
260
261
262
263
264
265
266
267
268
269
270
271
272
273
274
275
276
277
278
279
280
281
282
283
284
285
286
287
288
289
290
291
292
293
294
295
296
297
298
299
300
301
302
303
304
305
306
307
308
309
310
311
312
313
314
315
316
317
318
319
320
321
322
323
324
325
326
327
328
329
330
331
332
F2
F3
T1
values of Nafion 117. It is expected that EW is an importantfactor in determining the phase-separated structure of thehydrated membrane and thus the dynamics of protons and watermolecules within the membrane.
The Flemion membranes were treated by boiling in 3% H2O2,rinsing in boiling water, then boiling in 0.5 M H2SO4, and finallyrinsing in boiling water. The membranes were then hydrated inclosed jars where the relative humidity was controlled bydifferent salt solutions at 25 °C. Three RHs, 33%, 75% and100%, were used, and the corresponding water contents λ were4.5, 7.1, and 13.5, respectively (λ, denoting the number ofabsorbed water molecules per -SO3H site). The “dry” mem-brane was obtained by drying under vacuum at 120 °C for 12 h.The water content for the dry membrane is estimated as λ ≈ 1.The pretreated Flemion membranes were carefully wrappedaround the inner conductor of the coaxial line. After theinstallation of the sample, the coaxial line (containing thesample) was conditioned again in the same salt solution torestore the membrane water content. The coaxial line was thenquickly connected to the network analyzer HP8510C, and thetransmission S-parameter (S21) was collected over the entirefrequency range. The measurement usually lasted less than 5min, and no variation in membrane water content was found.Two sample lengths, 3 and 1 cm, are used to obtain the optimaldielectric spectra over the entire frequency range at 25 °C.
4. Results and Discussion
4.1. Data Analysis. For each measurement, the total loss ofthe sample, η′′(ω), together with the dielectric permittivity,ε′(ω), was numerically calculated from the measured S21
spectrum. According to eq 1, the true dielectric loss of theelectrolytes, ε′′(ω), can only be obtained from η′′(ω) after thecorrection for the conductivity contribution:
The dc conductivity, σ, is treated as an adjustable parameter inthe data analysis.
After subtraction of the conductivity contribution, the reduceddielectric spectra, ε*(ω) ) ε′(ω) - jε′′(ω), are fitted to asuperposition of multiple Havriliak-Negami equations11 orvariants thereof.44,45
where n is the number of separable dispersion steps, εsi and ε∞i
are the low- and high-frequency permittivity limits for the ithprocess from the lower frequency side, respectively, and ω )2πf is the angular frequency, τ is the dielectric relaxation time,and R and are shape parameters for the distribution ofrelaxation times. This general equation can be reduced to threewell-known models as limiting cases: the Debye equation (R) 0, ) 1), the Cole-Cole equation (0 e R < 1, ) 1),and the Davidson-Cole equation ( R ) 0, 0 < e 1). Therelative permittivity spectra, ε*(ω), are analyzed by simulta-neously fitting ε′(ω) and ε′′(ω) with a least-squares procedure,based on the Levenberg-Marquardt algorithm (for more details,see also ref 11). The program allows one to model ε*(ω) as thesum of multiple dispersion steps, where for each relaxationprocessabandshapedefinedbyDebye,Cole-Cole,Davidson-Cole,or Havriliak-Negami equation can be selected. For most ofthe samples, the best results, that is, the minimum variance, 2,of the fit and a consistent set of relaxation parameters as afunction of water content, were obtained with a sum of twoDebye relaxation processes (R ) 0, ) 1).
4.2. Microwave Dielectric Spectra of Flemion SH150.Figure 4 shows the dielectric spectra of the dry Flemionmembrane along with the results of the “dry” Nafion 117.11 Norelaxation process can be identified from the absorption spectrain the studied frequency range. Dry Flemion SH150 and dryNafion 117 have very similar values of permittivity and dielectricloss, which indicates that the chemical structure and theequivalent weight have little effect on the dielectric propertiesof dry PFSA membranes. The higher values of ε′ and ε′′ ofboth dry PFSA polymers as compared to those of PTFE (seeFigure 3) are due to the presence of sulfonic acid groups inthese membranes (whereas PTFE is largely apolar).
The dielectric spectra of the hydrated Flemion membranesare remarkably different from those of the dry samples. Figure5 shows the total loss η′′(ω) of Flemion samples with watercontents of λ ) 4.5, 7.1, and 13.5, equilibrated at RH of 33%,75%, and 100%, respectively. The contribution of the conduc-tivity due to the long-range motion of H+/H2O is clearly shownin the low-frequency range and follows an inverse frequency(f-1) dependence. The conductivity values of the hydrated
Figure 3. Complex permittivity spectra of Teflon in the frequencyrange of 108 Hz to 20 GHz obtained at two sample lengths of 5 and 1cm. The slight difference between two sample lengths is likely due tothe error in determination of the sample length.
TABLE 1: Chemical Structural, Equivalent Weight (EW),and Thickness for Nafion 117 and Flemion SH 150
membranestructural
parametersEW
(mequiv g-1)thickness
(µm)IEC
Nafion 117 x ) 6.5 1100 178 0.91y ) 1
m ) 1n ) 2
Flemion SH 150 m ) 0 909 160 1.01 n ) 1-5
ηk′′ ) σ
ωε0(19)
ε*(ω) ) ε∞ + ∑i)1
n ∆εi
[1 + (jωτi)1-Ri]i
with ∆εi ) εsi-
ε∞i,0 e Ri e 1, 0 e i e 1 (20)
Two-Port Transmission Line Technique J. Phys. Chem. B, Vol. xxx, No. xx, XXXX E
333
334
335
336
337
338
339
340
341
342
343
344
345
346
347
348
349
350
351
352
353
354
355
356
357
358
359
360
361
362
363
364
365
366
367
368
369
370
371
372
373
374
375
376
377
378
379
380
381
382
383
384
385
386
387
388
389
390
391
392
393
394
395
396
397
398
399
400
401
402
403
404
405
406
407
408
409
410
F4
F5
samples are obtained from data fitting and are listed in Table2. Flemion SH150 membranes show comparable conductivitiesto Nafion 117 membranes for similar water contents. It isdifficult to compare the fitted Flemion conductivities to literaturedata, due to the scarcity of the conductivity data of Flemionmembranes.
The contribution of the conductivity is subtracted from thetotal loss according to eq 2, and the true dielectric loss ε′′(ω) isobtained. At least two dielectric relaxations are clearly seen fromthe ε′′(ω) raw spectra. The dielectric spectra are then analyzedby the various relaxation models of eq 20. The best commonfit of the spectra ε′(ω) and ε′′(ω) is obtained by a superpositionof two Debye relaxations. Figure 6 shows the dielectric responseof the hydrated Flemion membranes at 25 °C with λ ) 4.5 and7.1, along with the fitted curves corresponding to two Debyerelaxations. The two relaxation processes are essentially identicalto the two relaxation modes observed in hydrated Nafion 117.11
The higher-frequency process coincides with the dynamics ofpure water (see Figure 2 and also ref 40), with the maximumfrequency at about 18 GHz, and is attributed to the dielectricrelaxation of the bulk-like water regions within the membrane.
This dielectric relaxation corresponds to the ordinary waterbehavior dominated by water-water hydrogen bonding,40 andwe attribute it to water domains located in regions where thelocal environment resembles bulk/liquid water. The lower-frequency process in Figure 6, having a longer relaxation timeranging from 20 to 70 ps, is attributed to water molecules looselybound to the sulfonic groups. This water relaxation is almostidentical in nature as observed before11 for Nafion 117, and theconclusions follow along the same lines as before.11 This lower-frequency process clearly corresponds to water molecules thatare neither unconstrained/bulk-like water, nor directly coordi-nated to sulfonates. The water molecules that are tightly boundto the sulfonic sites (also called hydration water) display arelaxation in the MHz range11 (with a corresponding relaxationtime of about 10-7 s) and thus cannot be captured in themicrowave range. Because of the broad distribution of environ-ments within the PFSA membrane, the loosely bound water canexist in many different local environments:11 (i) water in secondhydration shell surrounding the strongly bound water to thesulfonates, (ii) water in hydrophilic channels connecting thehydrated ionic clusters, or (iii) water at the interface betweenthe polymer and the bulk-like liquid water as well as waterconfined in the hydrophobic domains of the membrane (i.e.,hydrophobic hydration water). These environments are inher-ently heterogeneous in dynamics and geometries,46-53 andalthough a single Debye relaxation fits well the loosely boundwater dynamics, the data do not necessarily denote that theloosely bound water dynamics display a single-relaxation-time(monoexponential) mode; rather, the single Debye relaxationreflects a well-equilibrated hydrated structure of the polymer(more detailed discussion on this can be found in ref 11). Thedielectric parameters for the hydrated Flemion membranes aresummarized in Table 2.
The relative permittivity (ε′(ω)) and absorption (ε′′(ω))spectra for Flemion SH150 with λ ) 13.5, equilibrated at 100%RH, are shown in Figure 7. The spectra for λ ) 13.5 did notyield satisfactory fittings of the lower-frequency peak despitethe fact that the bulk-like water mode (higher-frequency peak)is fitted with good certainty. The same situation has also beenfound for Nafion 117 equilibrated at 100% RH (ref 11,Appendix). The noise of the permittivity data at the lowerfrequencies in the case of vapor saturated PFSA samples maybe due to the water condensation inside the coaxial line.
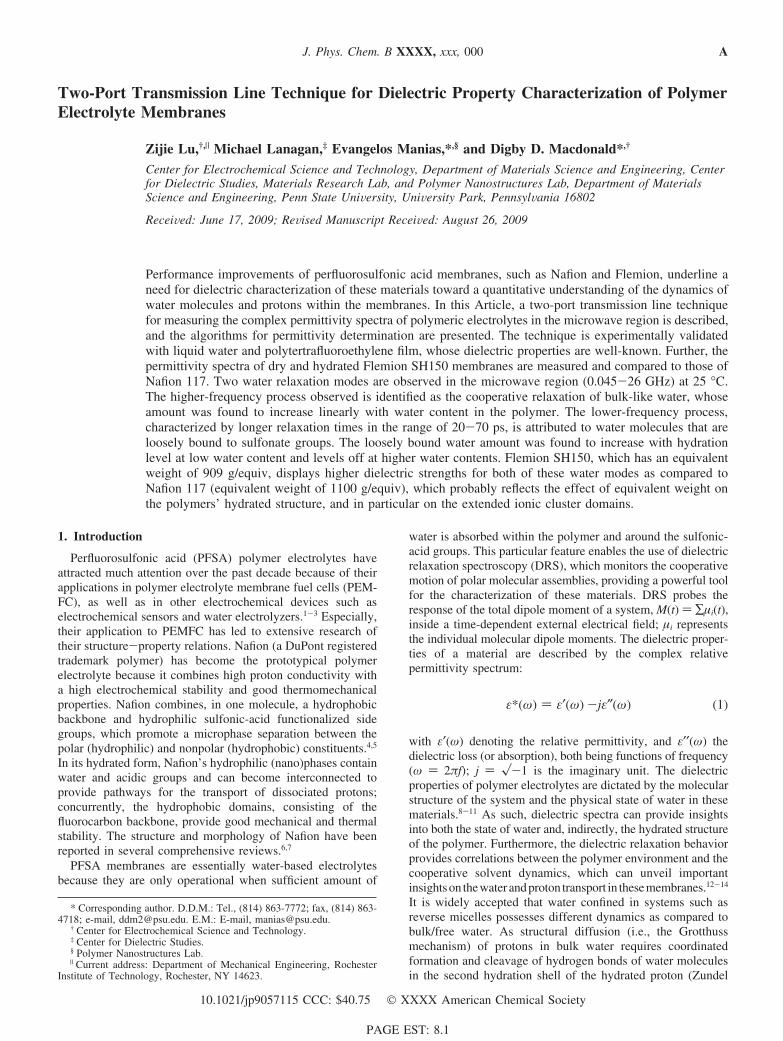
The dielectric strengths (or dielectric dispersions, ∆ε), whichcan be considered as a measure of the population of watermolecules that contribute to a specific relaxation, for the twoGHz water modes in Flemion SH150 at 25 °C, as derived fromthe data analysis, are shown in Figure 8. For comparison, thecorresponding values for Nafion 117 are also included in thisfigure. The bars for the loosely bound water at λ ) 13.5 forFlemion and λ ) 12 for Nafion samples are due to datascattering at low frequencies and indicate ranges of ∆ε that canyield equally good fits to the raw data/spectra. Similar behavioris found for Flemion SH150 and Nafion 117 with respect tothe variation of the dielectric strengths as a function of watercontent. The loosely bound water initially increases withincreased hydration and subsequently levels off at higher λ,while the bulk-like water is low at low water content and thenincreases almost linearly with λ. It can be reasonably assumedthat the bulk-like water will become dominant at the higherhydration levels. It is also clear from Figure 8 that Flemionshows higher dielectric strengths than Nafion for both the looselybound water and the bulk-like water, which is a naturallyexpected consequence of the difference in polymer structure
Figure 4. Relative permittivity, ε′(ω), and dielectric loss spectrum,ε′′(ω), of dry Flemion SH150 at 25 °C. The dielectric spectra for dryNafion 117 are also included.
Figure 5. Total loss η′′(ω) of Flemion samples with water contentsof λ ) 4.5, 7.1, and 13.5, pretreated at RH of 33%, 75%, and 100%,respectively. The linear portion of the fitted lines at low frequenciesshows the conductivity contribution. The detailed fittings at higherfrequencies are shown in the following figures.
F J. Phys. Chem. B, Vol. xxx, No. xx, XXXX Lu et al.
411
412
413
414
415
416
417
418
419
420
421
422
423
424
425
426
427
428
429
430
431
432
433
434
435
436
437
438
439
440
441
442
443
444
445
446
447
448
449
450
451
452
453
454
455
456
457
458
459
460
461
462
463
464
465
466
467
468
469
470
471
472
473
474
475
476
477
478
479
480
481
482
483
484
485
486
487
488
489
490
491
492
493
494
495
T2
F6
F7
F8
(cf., the difference in EW between the two polymers). Thedielectric responses of the PFSA membranes mainly result fromthe hydrated ionic cluster regions in the membrane, as demon-strated on the basis of the comparison among Figures 4, 6, and7 as well as from the literature.5,28,29,54 The structural parameters
that should have important effects on the dielectric propertiesof the membrane include the size and/or number of the ioniccluster regions, which are dependent on the membrane watercontent55,56 and the equivalent weight.13 The higher dielectricstrengths of Flemion SH150 (EW ) 909) are in agreement withthe expectation that at lower EW larger size and/or largernumber of hydrated ionic clusters can be formed (as comparedto a membrane with higher EW (i.e., Nafion with EW ) 1100)at the same hydration level). However, because Flemion SH150and Nafion 117 are synthesized by different manufacturers, nofurther analysis is possible on quantifying the effect ofequivalent weight without precise knowledge of the twopolymers’ microstructure.
5. Conclusions
In this work, a two-port transmission technique for measuringthe complex permittivity spectra of polymeric electrolytes inthe microwave region is described. An overview of thetheoretical background of the transmission line equations andan iterative approach for solving the scattering equations arealso presented. The ability of this technique to accuratelymeasure permittivity spectra is experimentally validated withliquid water and polytertrafluoroethylene films. In the case ofliquid water, multiple sample lengths are required to obtain the
TABLE 2: Dielectric Parameters Best Fitted by a Sum of Two Debye Relaxation Processes for Flemion SH150 Membraneswith Three Water Contentsa
system ∆εl.f. τl.f. (ps) ∆εh.f. τh.f. (ps) ε∞ σfit, S/m
a The results for liquid water and hydrated Nafion 117 membranes11 are also included for comparison. ∆ε represents dielectric strength, τrelaxation time, ε∞ high-frequency permittivity limit, and σ conductivity. The subscripts l.f. and h.f. represent lower-frequency andhigher-frequency relaxation processes, respectively.
Figure 6. Permittivity spectra versus frequency at 25 °C for FlemionSH150 with water content of λ ) 4.5 and 7.1: (a) relative permittivityε′(ω) and (b) dielectric loss ε′′(ω). The solid lines represent thecorresponding best fits by two Debye processes. The faster process(higher-frequency peak) corresponds to bulk-like water and the slowerprocess (lower-frequency peak) to loosely bound water.
Figure 7. Relative permittivity (ε′(ω)) and absorption (ε′′(ω)) spectrafor Flemion SH150 with λ ) 13.5 at 25 °C; this membrane wasequilibrated in saturated water vapor (relative humidity ) 100%). Thesolid lines are the fits by two Debye processes.
Two-Port Transmission Line Technique J. Phys. Chem. B, Vol. xxx, No. xx, XXXX G
496
497
498
499
500
501
502
503
504
505
506
507
508
509
510
511
512
513
514
515
516
517
518
519
520
521
522
523
optimal measurement of the complete dielectric spectra acrossthe experimental frequency range due to the high dielectriclosses, while for PTFE a single sample length is sufficient tocover the entire frequency range.
The dielectric relaxation spectra of dry and hydrated FlemionSH150 membrane, which has a chemical structure similar tothat of Nafion 117, but has a lower equivalent weight (EW )909 g/equiv vs Nafion’s EW ) 1100 g/equiv), are then measuredwith the same two-port transmission line technique over thefrequency range from 45 MHz to 26 GHz at 25 °C. Thepermittivity spectra are well-fitted by a superposition of twoDebye relaxation peaks. These relaxation processes are es-sentially identical to those observed in a hydrated Nafion 117membrane. The higher-frequency peak, with a relaxation timeof about 8 ps at 25 °C, shows the characteristic dynamics ofliquid water and is attributed to the cooperative relaxation offree/bulk-like water. The lower-frequency peak, characterizedby longer relaxation times of 20-70 ps, is attributed to watermolecules that are loosely bound to the membrane. The amountof the free/bulk-like water, quantified through the dielectricstrength of each corresponding relaxation mode, increaseslinearly with increasing water content, while the loosely boundwater increases with increased hydration and levels off at higherwater contents. Flemion SH150 displays higher dielectricstrengths for the two water modes and therefore higher dielectricconstant than Nafion 117, which probably reflects the effect ofthe equivalent weight on the polymer structure, particularly onthe phase-separated hydrated ionic cluster domains.
Acknowledgment. Z.L. acknowledges Mr. Steve Perini forhis help in the experimentation and Mr. Khalid Rajab for hisassistance in software. We gratefully acknowledge financialsupport for this work by International Fuel Cells Inc. throughsubcontract no. 3540OB via Contract No. DE-FCo4-02AL67608and by the U.S. Department of Energy via Contract No. DE-FG02-07ER46371 at Penn State University. E.M. additionallyacknowledges support from the National Science Foundation(NSF grant # DMR-0602877).
References and Notes
(1) Kreuer, K. D. In Handbook of Fuel Cells Fundamentals, Technologyand Applications; Vielstich, W., Lamm, A., Gasteiger, H. A., Eds.; JohnWiley & Sons: Chichester, UK, 2003; Vol. 3, Chapter 33.
(2) Mortimer, R. J.; Beech, A. Electrochim. Acta 2002, 47, 3383.(3) Michishita, H.; Matsumoto, H.; Ishihara, T. Electrochemistry 2008,
76, 288.(4) Hsu, W. Y.; Gierke, T. D. J. Membr. Sci. 1983, 13, 307.(5) Kreuer, K. D. J. Membr. Sci. 2001, 185, 29.(6) Mauritz, K. A.; Moore, R. B. Chem. ReV. 2004, 104, 4535.(7) Doyle, M.; Rajendran, G. In Handbook of Fuel Cells Fundamentals,
Technology and Applications; Vielstich, W., Lamm, A., Gasteiger, H. A.,Eds.; John Wiley & Sons: Chichester, UK, 2003; Vol. 3, Chapter 30.
(8) Paul, R.; Paddison, S. J. J. Phys. Chem. B 2004, 108, 13231.(9) Paul, R.; Paddison, S. J. J. Chem. Phys. 2005, 123, 224704.
(10) Paddison, S. J.; Paul, R.; Zawodzinski, T. A., Jr. J. Electrochem.Soc. 2000, 147, 617.
(11) Lu, Z.; Polizos, G.; Macdonald, D. D.; Manias, E. J. Electrochem.Soc. 2008, 155, B163.
(12) Paddison, S. J. Annu. ReV. Mater. Res. 2003, 33, 289.(13) Saito, M.; Arimura, N.; Hayamizu, K.; Okada, T. J. Phys. Chem.
B 2004, 108, 16064.(14) Paddison, S. J.; Paul, R. Phys. Chem. Chem. Phys. 2002, 4, 1158.(15) Kreuer, K. D.; Paddison, S. J.; Spohr, E.; Schuster, M. Chem. ReV.
2004, 104, 4637.(16) Kornyshev, A. A.; Kuznetsov, A. M.; Spohr, E.; Ulstrup, J. J. Phys.
Chem. B 2003, 107, 3351.(17) Yeo, S. C.; Eisenberg, A. J. Appl. Polym. Sci. 1977, 21, 875.(18) Tsonos, C.; Apekis, L.; Pissis, P. J. Mater. Sci. 2000, 35, 5957.(19) Tsonos, C.; Apekis, L.; Pissis, P. J. Mater. Sci. 1998, 33, 2221.(20) Di Noto, V.; Lavina, S.; Negro, E.; Vittadello, M.; Conti, F.; Piga,
M.; Pace, G. J. Power Sources 2009, 187, 57.(21) Mauritz, K. A. Macromolecules 1989, 22, 4483.(22) Deng, Z. D.; Mauritz, K. A. Macromolecules 1992, 25, 2739.(23) Starkweather, H. W.; Chang, J. J. Macromolecules 1982, 15, 752.(24) Baker-Jarvis, J.; Janezic, M. D.; Geyer, R. G. IEEE Trans. Instrum.
Meas. 1994, 43, 711.(25) Wei, Y.; Sridhar, S. IEEE Trans. MicrowaVe Theory Tech. 1991,
39, 526.(26) Wei, Y.; Sridhar, S. J. Chem. Phys. 1990, 92, 923.(27) Misra, D. K. MicrowaVe Opt. Technol. Lett. 1996, 11, 183.(28) Paddison, S. J.; Reagor, D. W.; Zawodzinski, T. A., Jr. J.
Electroanal. Chem. 1998, 459, 91.(29) Paddison, S. J.; Bender, G.; Kreuer, K. D.; Nicoloso, N.; Zawodz-
inski, T. A. J. New Mater. Electrochem. Syst. 2000, 3, 291.(30) Jenkins, S.; Hodgetts, T. E.; Clarke, R. N.; Preece, A. W. Meas.
Sci. Technol. 1990, 1, 691.(31) Baker-Jarvis, J.; Vanzura, E. J.; Kissick, W. A. IEEE Trans.
MicrowaVe Theory Techn. 1990, 38, 1096.(32) Nicolson, A. M.; Ross, G. F. IEEE Trans. Instrum. Meas. 1968,
IM-17–395.(33) Kerns, D. M.; Beatty, R. W. Basic Theory of WaVeguide Junctions
and Introductory MicrowaVe Network Analysis; Pergamon Press: New York,1967.
(34) Weir, W. B. Proc. IEEE 1970, 62, 33.(35) Lanagan, M. T. Ph.D. Dissertation, The Pennsylvania State
University, 1987.(36) Hewlett-Packard, Technical Data, 16, 1984.(37) Stuchly, S. S.; Matuszewski, M. IEEE Trans. Instrum. Meas. 1978,
IM-27–285.(38) Somlo, P. I. IEEE Trans. Instrum. Meas. 1993, 42, 213.(39) Qaddoumi, N.; Ganchev, S.; Zoughi, R. Res. Nondestruct. EVal.
1996, 8, 177.(40) Kaatze, U. J. Chem. Eng. Data 1989, 34, 371.(41) Ellison, W. J.; Lamkaouchi, K.; Moreau, J. M. J. Mol. Liq. 1996,
Lett. 1990, 165, 369.(43) Geyer, R. G.; Krupka, J. IEEE Trans Instrum. Meas. 1995, 44,
329.(44) Havriliak, S.; Negami, S. Polymer 1967, 8, 161.(45) Kremer, F.; Schonhals, A. Broadband Dielectric Spectroscopy;
Springer: New York, 2002.(46) Manias, E.; Kuppa, V. Eur. Phys. J. E 2002, 8, 193.(47) Kuppa, V.; Foley, T. M. D.; Manias, E. Eur. Phys. J. E 2005, 12,
159.(48) Manias, E.; Kuppa, V.; Yang, D. K.; Zax, D. B. Colloids Surf., A
2001, 187, 509.(49) Manias, E.; Hadziioannou, G.; ten Brinke, G. J. Chem. Phys. 1994,
101, 1721.(50) Manias, E.; Subbotin, A.; Hadziioannou, G.; ten Brinke, G. Mol.
Phys. 1995, 85, 1017.
Figure 8. Dielectric strengths and the corresponding uncertainties forthe two water modes (bulk-like and loosely bound water) observed atmicrowave frequencies in the hydrated Flemion SH150 samples at 25°C. For comparison, the corresponding values for Nafion 11711 are alsoincluded. The bars for the loosely bound water at λ ) 13.5 for Flemionand λ ) 12 for Nafion samples are due to data scattering at lowfrequencies.
H J. Phys. Chem. B, Vol. xxx, No. xx, XXXX Lu et al.