University of Massachuses Amherst ScholarWorks@UMass Amherst Environmental & Water Resources Engineering Masters Projects Civil and Environmental Engineering 9-2010 Two-Stage Filtration to Control Manganse and DBPS at the Lantern Hill Water Treatment Plant Minh Pham Follow this and additional works at: hps://scholarworks.umass.edu/cee_ewre Part of the Environmental Engineering Commons is Article is brought to you for free and open access by the Civil and Environmental Engineering at ScholarWorks@UMass Amherst. It has been accepted for inclusion in Environmental & Water Resources Engineering Masters Projects by an authorized administrator of ScholarWorks@UMass Amherst. For more information, please contact [email protected]. Pham, Minh, "Two-Stage Filtration to Control Manganse and DBPS at the Lantern Hill Water Treatment Plant" (2010). Environmental & Water Resources Engineering Masters Projects. 51. hps://doi.org/10.7275/YGAR-V161
Transcript
University of Massachusetts AmherstScholarWorks@UMass AmherstEnvironmental & Water Resources EngineeringMasters Projects Civil and Environmental Engineering
9-2010
Two-Stage Filtration to Control Manganse andDBPS at the Lantern Hill Water Treatment PlantMinh Pham
Follow this and additional works at: https://scholarworks.umass.edu/cee_ewre
Part of the Environmental Engineering Commons
This Article is brought to you for free and open access by the Civil and Environmental Engineering at ScholarWorks@UMass Amherst. It has beenaccepted for inclusion in Environmental & Water Resources Engineering Masters Projects by an authorized administrator of ScholarWorks@UMassAmherst. For more information, please contact [email protected].
Pham, Minh, "Two-Stage Filtration to Control Manganse and DBPS at the Lantern Hill Water Treatment Plant" (2010). Environmental& Water Resources Engineering Masters Projects. 51.https://doi.org/10.7275/YGAR-V161
TWO-STAGE FILTRATION TO CONTROL MANGANESE AND DBPS
AT THE LANTERN HILL WATER TREATMENT PLANT
A Master’s Project Presented
By
MINH PHAM
Submitted to the Department of Civil and Environmental Engineering of the University of Massachusetts in partial fulfillment of the requirements for the degree of
2.3 LANTERN HILL DRINKING WATER TREATMENT PLANT ............................ 32 2.3.1 Water Quality................................................................................................. 32 2.3.2 Treatment Process Description....................................................................... 33 2.3.3 Summaries of Previous Research .................................................................... 34
3.1 THE LANTERN HILL PILOT-SYSTEM............................................................... 36 3.1.1 Pilot-Scale System Description:...................................................................... 36 3.1.2 Pilot System Operation and Maintenance ....................................................... 37
3.2 EXPERIMENTAL METHODS ..................................................................................... 40 3.2.1 Fractionation Procedure for Iron, Manganese and TOC ................................ 40 3.2.2 Measurement of Manganese Oxide Coatings on Filter Media Surface ............ 41
CHAPTER 4: FIELD EXPERIMENT RESULTS ................................................ 52
4.1 PHASE I: OPTIMIZATION OF THE FIRST-STAGE DUAL-MEDIA FILTER ...................... 52 4.1.1 Without pre-filter chlorine:............................................................................. 53 4.1.2 With pre-filter chlorine: ................................................................................. 57
4.2 PHASE II: SECOND-STAGE CONTACTOR .................................................................. 64 4.2.1 Impact of NOM removal on DBP production .................................................. 64 4.2.2 Impact of HLR on manganese removal ........................................................... 69
CHAPTER 5: MODEL DEVELOPMENT AND RESULTS ................................ 71
5.1 MODELING BACKGROUND .............................................................................. 71 5.1.1 Initial Model Efforts ....................................................................................... 71 5.1.2 Recent Model Efforts ...................................................................................... 75
5.2 MODEL DEVELOPMENTS: ................................................................................ 78 5.2.1 Modifications from Zuravnsky Model ............................................................. 78 5.2.2 UM-model Values: ......................................................................................... 84
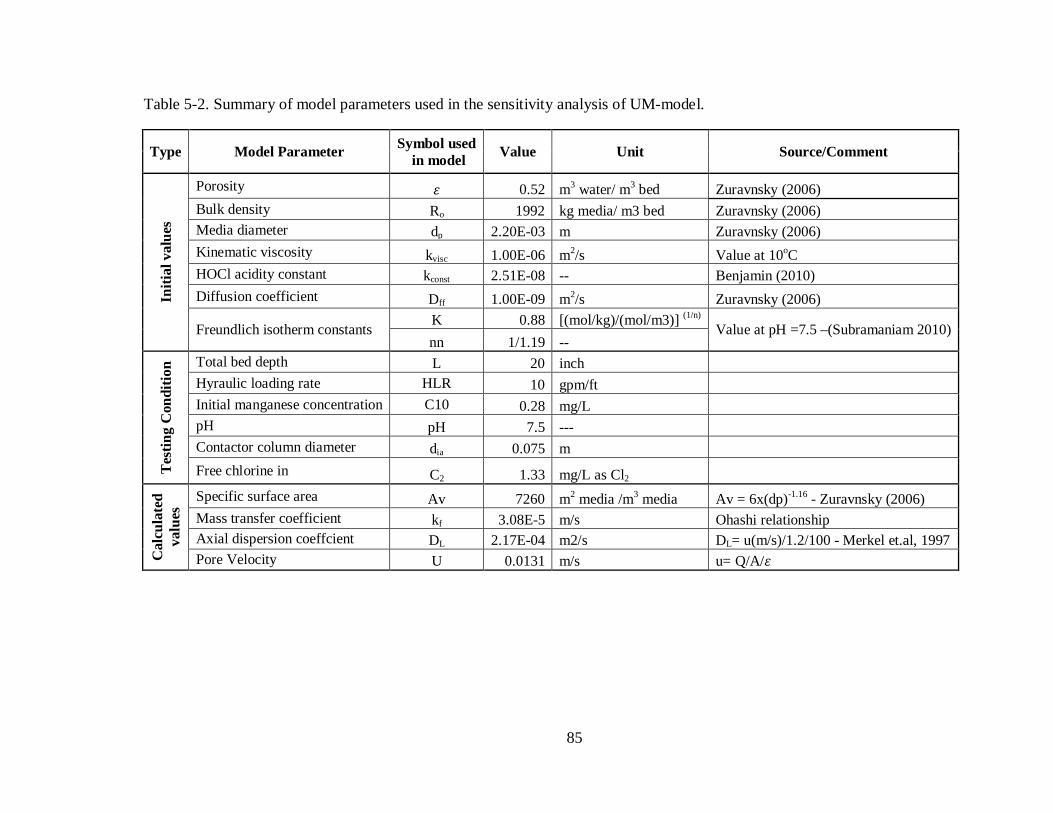
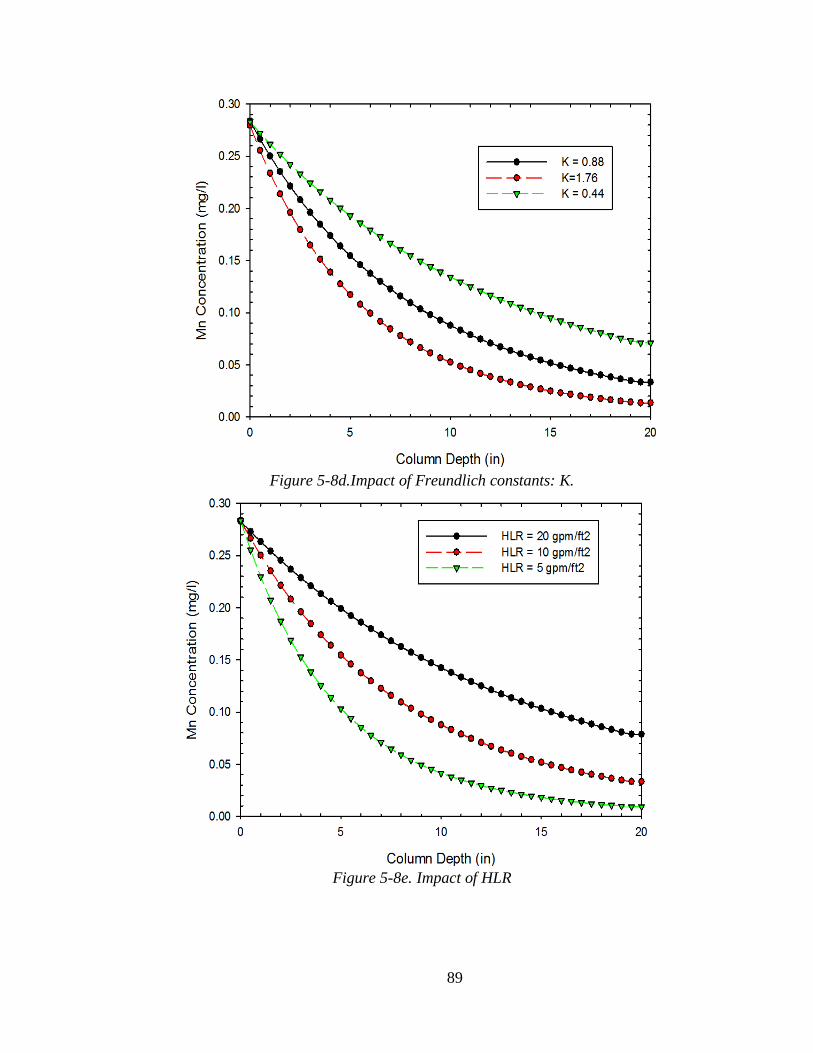
5.3 SENSITIVITY ANALYSIS USING THE UM-MODEL: ................................................... 86
5.4 MODEL RESULTS FOR THE LHWTP SECOND-STAGE PILOT SYSTEM........ 91
5.5 RECOMMENDATIONS FOR THE SECOND-STAGE CONTACTOR DESIGN AT THE LHWTP ........................................................................................................................ 94
CHAPTER 6: SUMMARY, CONCLUSIONS AND RECOMMENDATIONS .... 98
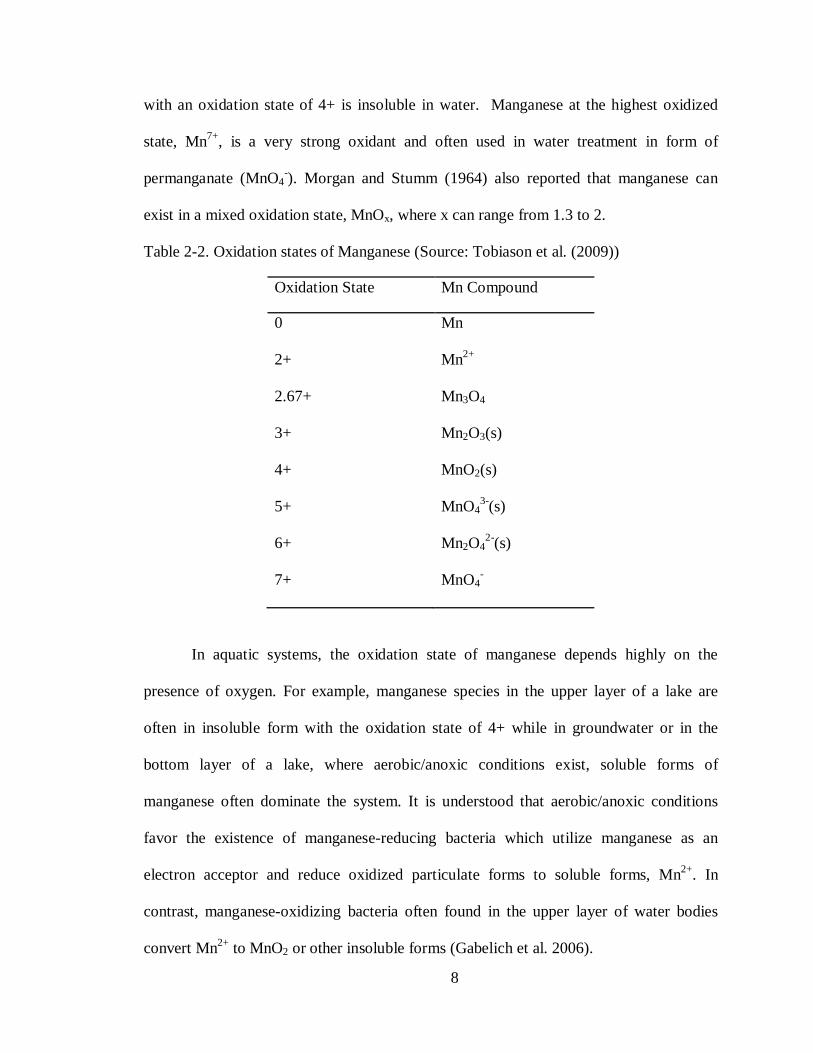
Since being noticed back in the 1950s, manganese adsorption by OCM has been
one of the most effective and dependable manganese control technologies in drinking
water treatment. When combined with pre-filter oxidation and coagulation, this method
can effectively decrease manganese concentrations to levels of 0.01 mg/L or less.
2.1.5.2.1 Oxidation/Adsorption Mechanism:
Adsorption and surface oxidation of manganese is observed at water facilities
where free-chlorine is added into the manganese-containing filter influent. Under this
condition, manganese deposits or coatings develop onto media surfaces via a two-step
process. First, dissolved manganese is absorbed to existing manganese-oxide deposited
on media surfaces. Then, adsorbed manganese is oxidized by free chlorine and converted
to a solid form (MnOx(s)), and becomes new adsorptive sites. Merkle et al. (1997) named
14
this phenomenon the natural greensand effect (NGE)1
Mn2+ + SITE + HOCl => MnOx (s) + SITE
and proposed a simplified model
describing this process based on the work of Coffey et al. (1993):
2
Since developing a considerable amount of manganese coatings on filter media
may take from weeks to months, Knocke (1990) proposed a procedure to facilitate this
process. The procedure includes soaking filter media in a 100mg/L potassium
permanganate solution for 24 hours with 100 mg/L of chlorine at a pH above 6.
2.1.5.2.2 Process Design Considerations
Type of media
Manganese greensand is a well-known for use in manganese removal, having
been used since the 1950s in the United States. Manganese greensand is made from
glauconite, an iron, potassium, alumino-silicate material of marine origin. This media,
found along the eastern coast of the United States, was first used as natural zeolite to treat
hard water, due to its relatively high ion exchange capacity of approximately 3000 grains
(of hardness)/cu.ft. To provide adsorption capacity, glauconite is synthetically coated
with a thin layer of manganese dioxide. After being coated, the media has a distinct green
color, hence the name greensand (Kohl & Medlar 2006). Hungerford & Terry, Inc of
Clayton, NJ is one of leading distributors of manganese greensand for the Inversand
Company. They further perfected this technology with the development of the Ferrosand
1 For simplicity, in report, the term “natural greensand effect (NGE)” was used to imply the manganese removal process by adsorption and surface oxidation 2 Due to the lack of detailed knowledge, “SITE” and MnOx , representing the adsorptive site structure and oxidation
product of dissolved Mn2+, respectively, are used.
15
Continuous Regeneration Process which was later patented in 2004 (McPeak and
Aronovitch, 2004).
A new manganese greensand product developed by the Inversand Company is
GreenSandPlus claimed to be a much stronger and more durable media than traditional
manganese greensand. The advancement of this new media stems from its silica-based
material rather than glauconite which can be crushed under high working pressure. In
addition, a stronger base material allows this new product to withstand higher working
temperature (over 70oF) and be able to treat water with low dissolved solids and total
hardness levels. These working conditions may soften the glauconite-based traditional
manganese greensand, reducing the filter running time and eventually causing filter bed
failure. GreenSandPlus has an effective size of 0.30 to 0.35 mm, a uniformity coefficient
of less than 1.6 and recommended flow rate in ranges of 2-12 gpm/ft2. Higher service
flow rate is achievable when concentrations of influent manganese are very low.
As a filter media, pyrolucite can also been used to remove soluble manganese
from water by the NGE. Pyrolucite is a mineral consisting essentially of manganese
dioxide and often found in the United States, Australia, Brazil and South Africa (Kohl &
Medlar 2006). An advantage of using pyrolucite in treating manganese is that since it is
essentially manganese dioxide, there is no need to develop a manganese oxide deposit or
worries about the coating levels as can be trouble-causing matters when utilizing this
technique. LayneOXTM , the commercial name of pyrolucite media developed by Layne
Christensen Company, is claimed to maintain effective manganese removal under a high
flow rate of 10-12 gpm/ft2, hence substantially reducing the filter footprint compared to
using traditional manganese greensand. (Layne Christensen Company website)
16
Influent pH
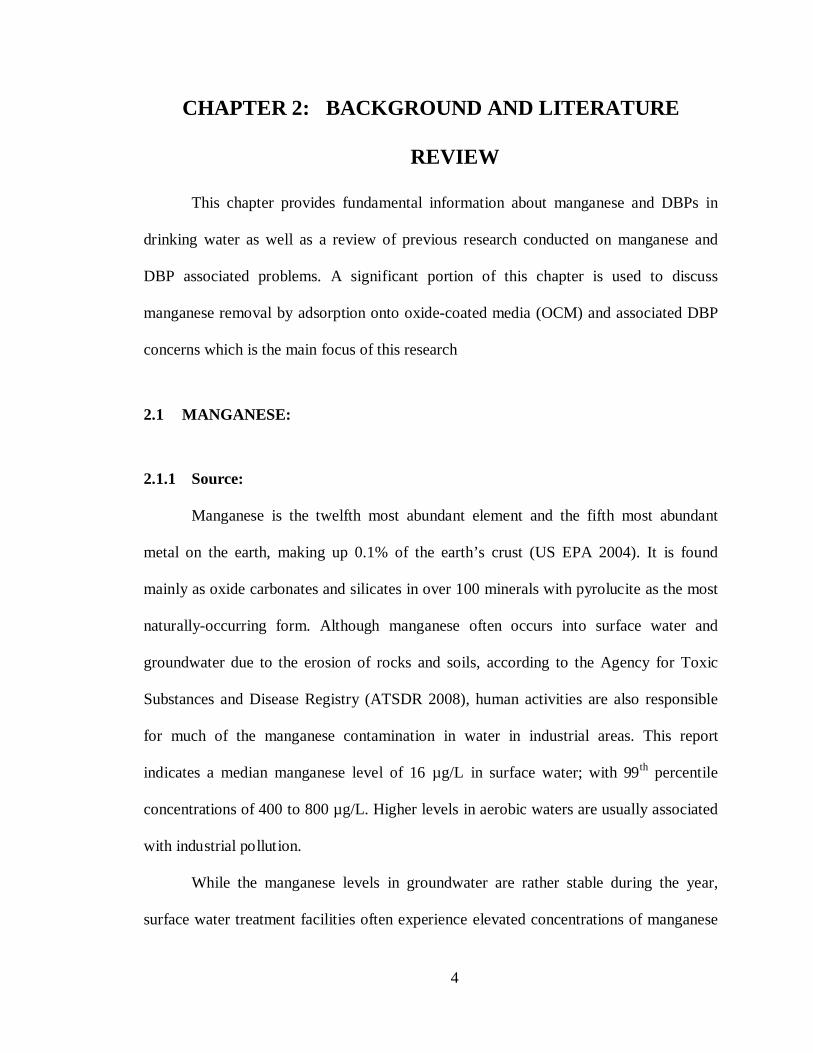
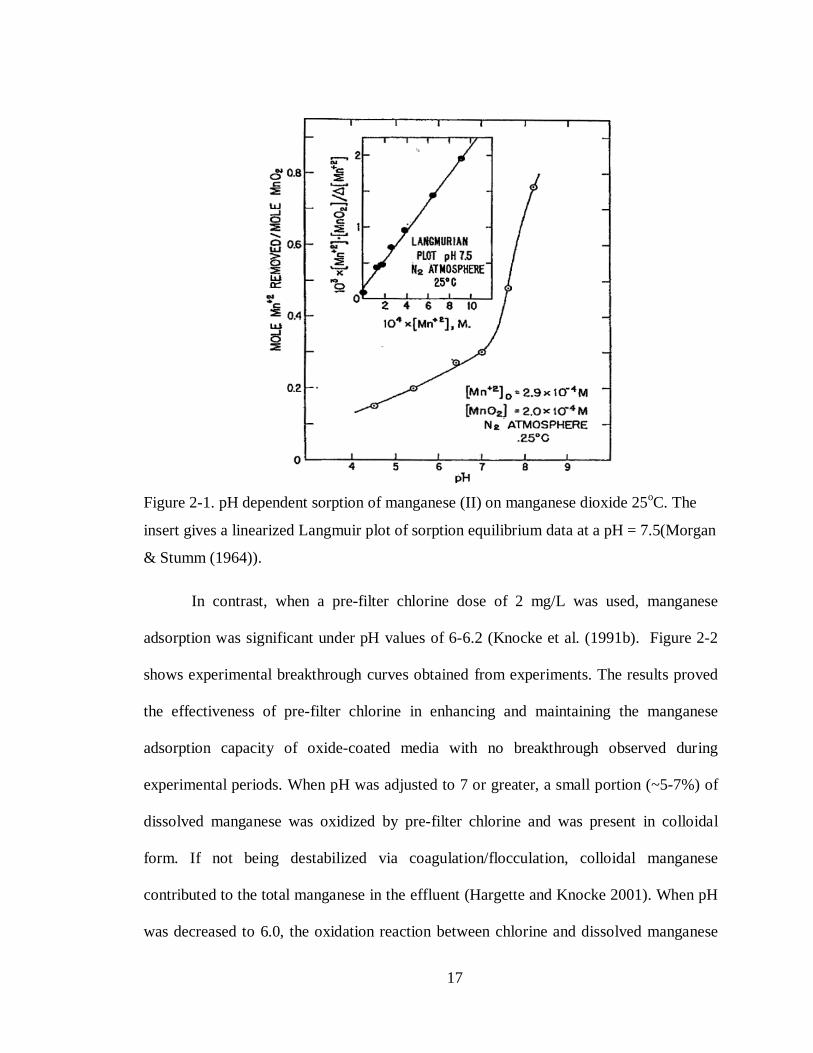
Without the presence of an oxidant, Morgan and Stumm (1964) evaluated the
dependence of Mn2+ adsorption on pH (see Figure 2-1). Adsorption capacities of greater
than 0.5 mole Mn2+ removed/mole MnO2 were achievable under alkaline conditions and
the adsorption process was rapid, happening within the first few minutes of contact. The
process was described as ion exchange whereas dissolved manganese (Mn2+) replaced H+
and other surface cations. For that reason, as solution pH increased from 2.8 ±0.3 (zero
point of charge) leading to a decrease of competing H+ concentration, the adsorptive
capacity of the oxide-coated media increased accordingly. In another effort, Knocke et al.
(1988) conducted a number of experiments in which different operational conditions
were tested by varying influent pH, oxidant types and dosing. The results, consistent with
Morgan & Stumm (1964), showed that without a pre-filter oxidant and under alkaline
conditions (pH >7) removal of Mn2+ was very effective compared to acidic conditions
(pH <7). When influent pH decreased from 8 to 6, the author estimated an 80% decrease
in adsorptive capacity of the manganese-coated media. Therefore, if alum or iron
coagulation is utilized to enhance NOM removal and an acidic influent is desired, the
effectiveness of the manganese adsorption process can be inhibited. The effect of pH on
Mn2+ uptake by OCM was confirmed by Tobiason et al. (2008)
17
Figure 2-1. pH dependent sorption of manganese (II) on manganese dioxide 25oC. The
insert gives a linearized Langmuir plot of sorption equilibrium data at a pH = 7.5(Morgan
& Stumm (1964)).
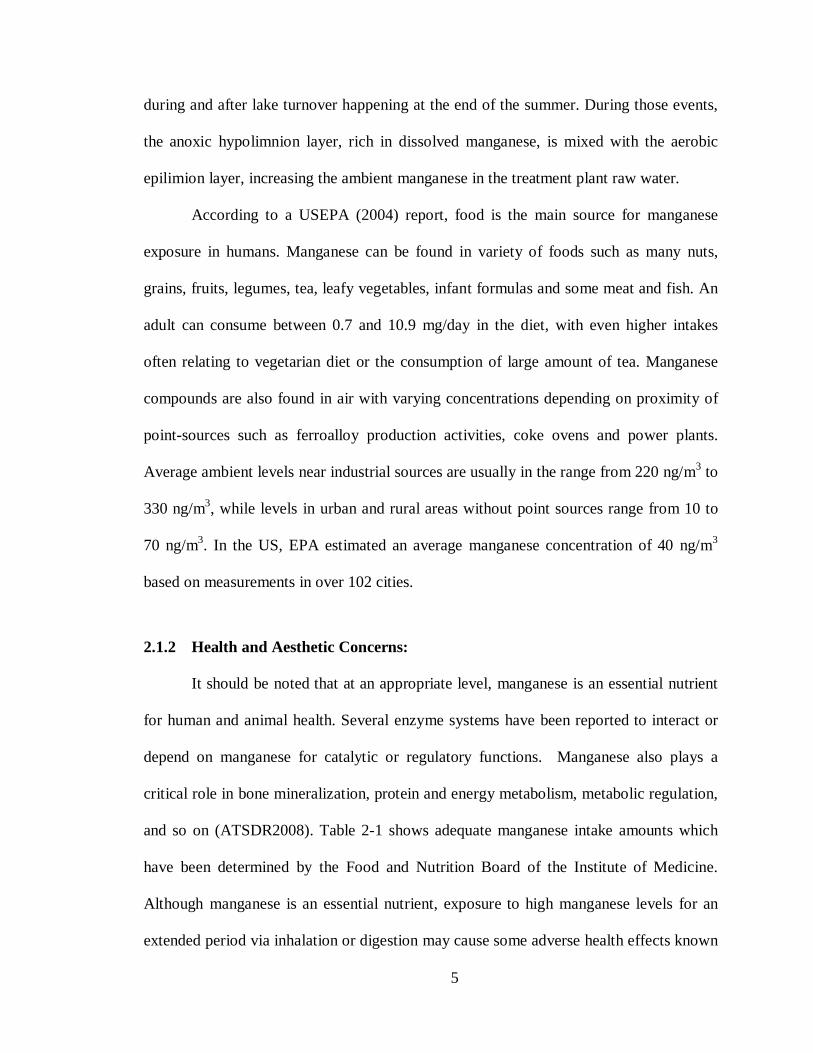
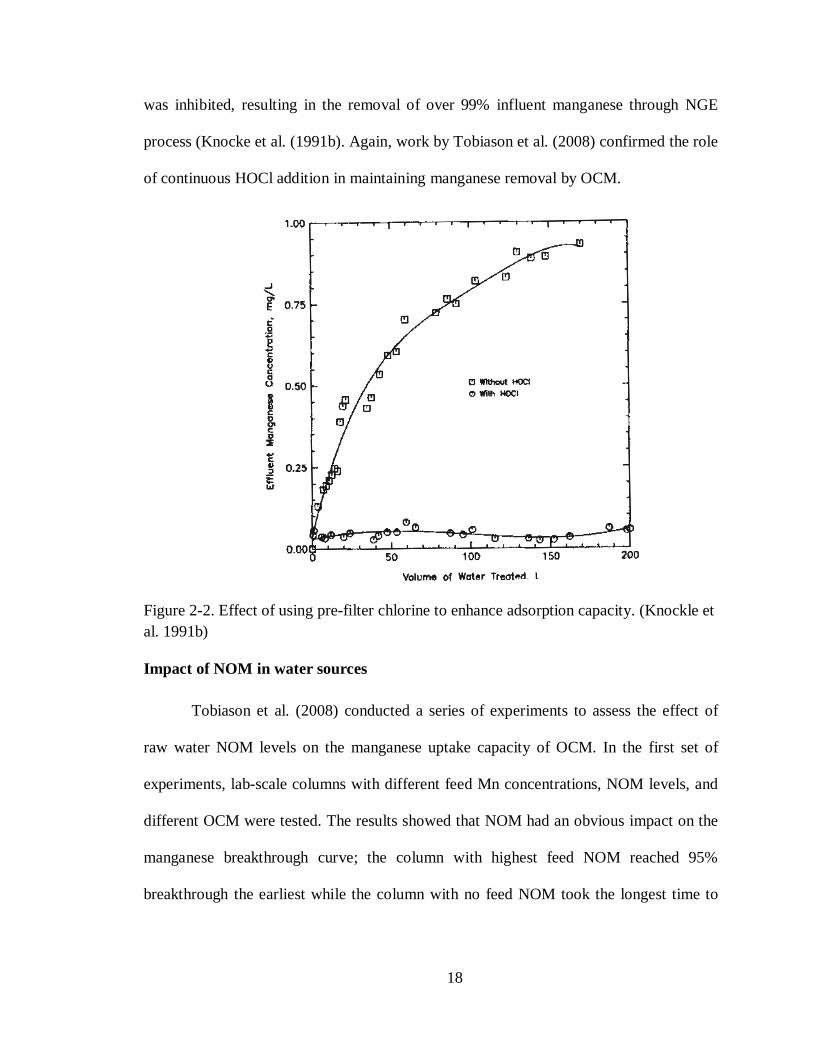
In contrast, when a pre-filter chlorine dose of 2 mg/L was used, manganese
adsorption was significant under pH values of 6-6.2 (Knocke et al. (1991b). Figure 2-2
shows experimental breakthrough curves obtained from experiments. The results proved
the effectiveness of pre-filter chlorine in enhancing and maintaining the manganese
adsorption capacity of oxide-coated media with no breakthrough observed during
experimental periods. When pH was adjusted to 7 or greater, a small portion (~5-7%) of
dissolved manganese was oxidized by pre-filter chlorine and was present in colloidal
form. If not being destabilized via coagulation/flocculation, colloidal manganese
contributed to the total manganese in the effluent (Hargette and Knocke 2001). When pH
was decreased to 6.0, the oxidation reaction between chlorine and dissolved manganese
18
was inhibited, resulting in the removal of over 99% influent manganese through NGE
process (Knocke et al. (1991b). Again, work by Tobiason et al. (2008) confirmed the role
of continuous HOCl addition in maintaining manganese removal by OCM.
Figure 2-2. Effect of using pre-filter chlorine to enhance adsorption capacity. (Knockle et al. 1991b)
Impact of NOM in water sources
Tobiason et al. (2008) conducted a series of experiments to assess the effect of
raw water NOM levels on the manganese uptake capacity of OCM. In the first set of
experiments, lab-scale columns with different feed Mn concentrations, NOM levels, and
different OCM were tested. The results showed that NOM had an obvious impact on the
manganese breakthrough curve; the column with highest feed NOM reached 95%
breakthrough the earliest while the column with no feed NOM took the longest time to
19
breakthrough. However, when pre-filter free-chlorine was dosed, NOM in feed water had
no impact on the NGE process with similar effluent manganese levels.
Type of oxidants
Pre-filter application of other strong oxidants such as KMnO4, O3, and ClO2 was
also tested to assess their impact on manganese uptake by OCM. Knocke et al. (1988)
showed that a substantial amount of dissolved manganese was oxidized before reaching
the OCM. Therefore, manganese removal was achieved mostly via particle filtration
rather than via the NGE process. More importantly, as mentioned above, using strong
oxidants can result in stable colloidal manganese oxide which is hard to remove through
media filtration unless it is destabilized. In such cases, coagulation is required for better
filtration removal performance. Free chlorine is thus the most suitable oxidant for the
NGE process. This is because while the solution phase oxidation reaction between free
chlorine and dissolved manganese is rather slow at typical pH levels, the reaction
between free chlorine and adsorbed manganese is rapid under various testing conditions.
Adsorptive sites and Coating levels:
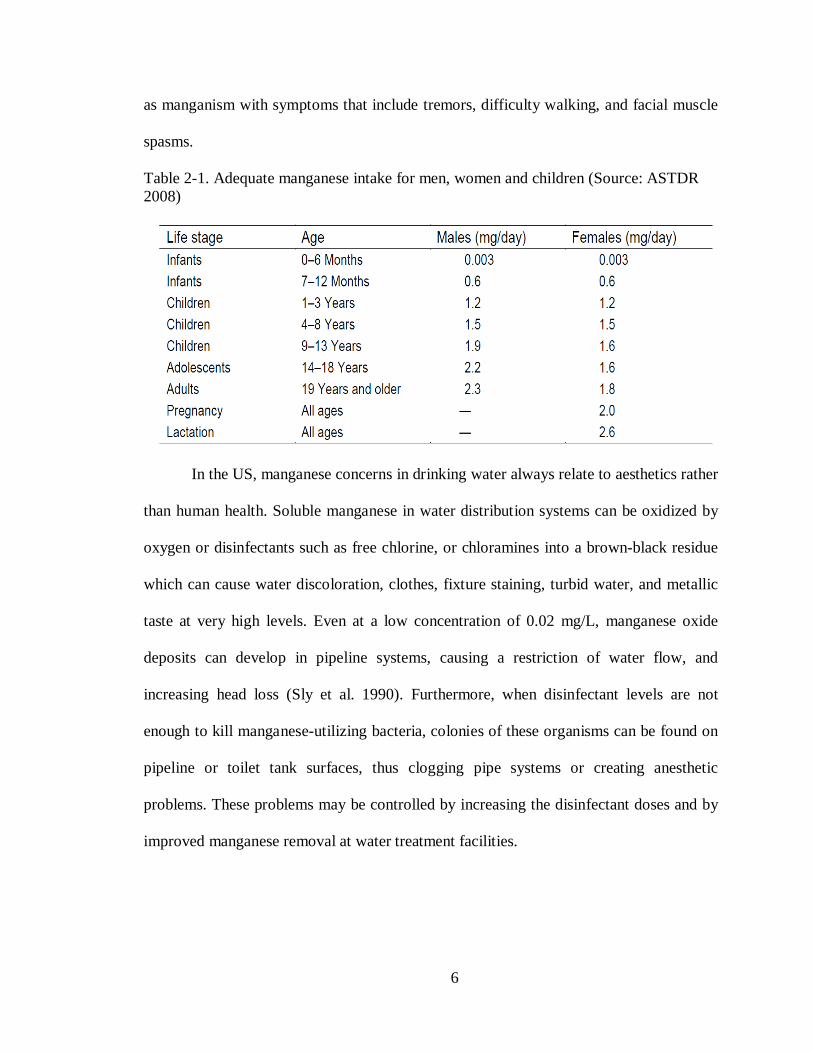
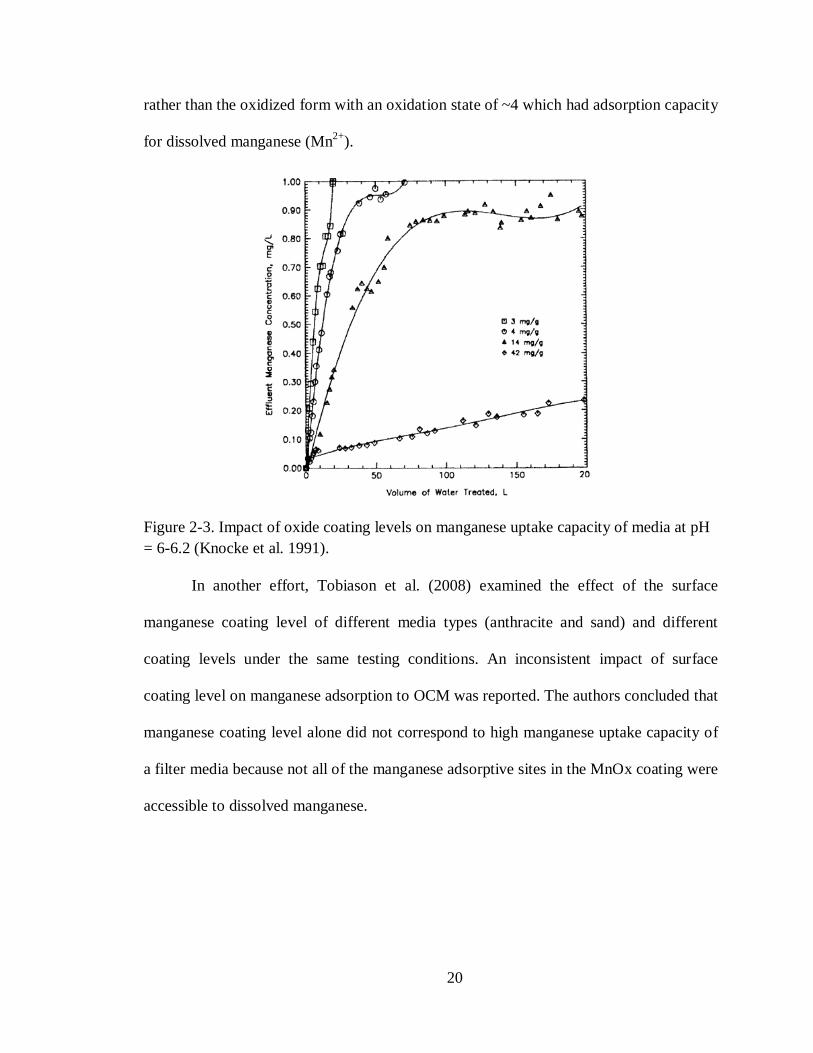
In general, Knocke et al. (1988,1991) concluded that more manganese adsorption
was associated with higher manganese coating levels. Figure 2-3 presents manganese
uptake results for different coating levels without continuous addition of free chlorine.
However, Knocke et al. (1988) also noticed less-than-expected adsorption capacities of
some media which had a large amount of coating. The authors attributed this poor
performance to the low oxidation state (2.8 to 3) of the manganese oxide on the media
surface. This means that most manganese on the surface was present in reduced form
20
rather than the oxidized form with an oxidation state of ~4 which had adsorption capacity
for dissolved manganese (Mn2+).
Figure 2-3. Impact of oxide coating levels on manganese uptake capacity of media at pH = 6-6.2 (Knocke et al. 1991).
In another effort, Tobiason et al. (2008) examined the effect of the surface
manganese coating level of different media types (anthracite and sand) and different
coating levels under the same testing conditions. An inconsistent impact of surface
coating level on manganese adsorption to OCM was reported. The authors concluded that
manganese coating level alone did not correspond to high manganese uptake capacity of
a filter media because not all of the manganese adsorptive sites in the MnOx coating were
accessible to dissolved manganese.
21
2.1.5.2.3 Process Concerns:
Impact of manganese deposits on filter performance:
As use of pre-filter chlorine to regenerate oxide-coated media adds manganese
oxide deposits to media grains, research was conducted to investigate effects on the
hydraulics of filter operations. Knocke (1990) noted no significant changes in the
physical size or density of the oxide-coated media over time with the continuous
application of pre-filter chlorine. Also, the oxide coating doesn’t have any noticeable
impact on filter turbidity removal performance with a slight increase in size (Griffin
1960).
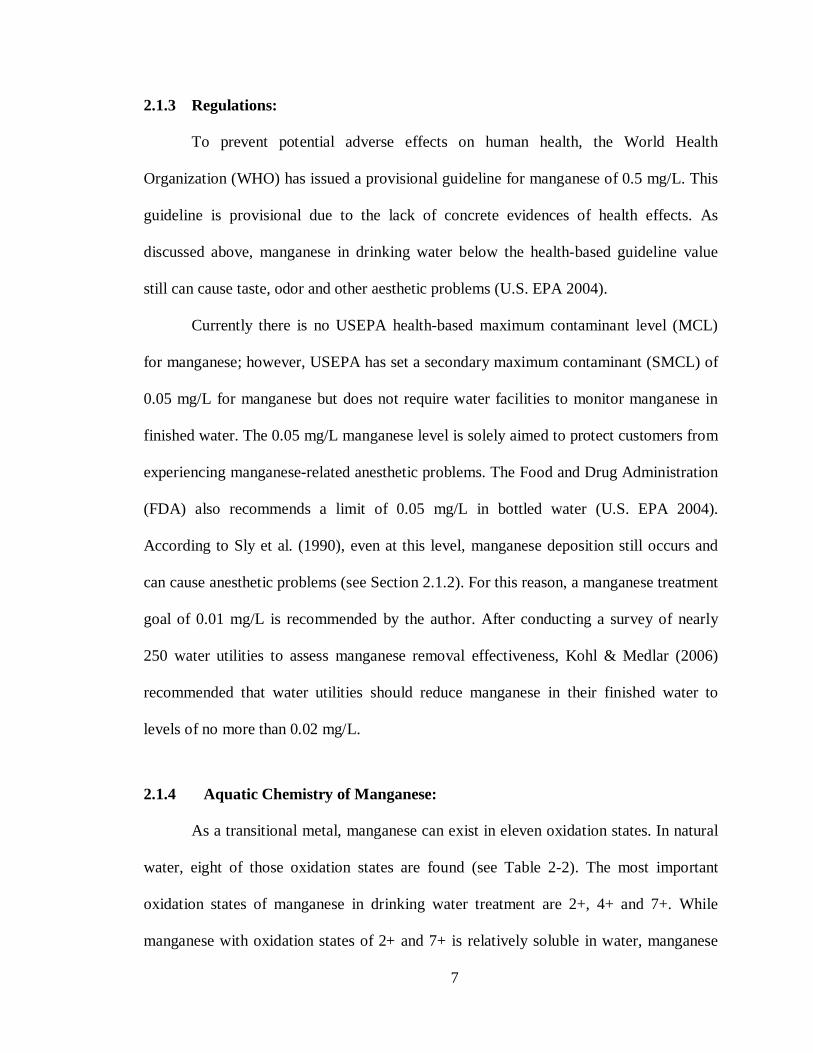
More recent research by Hargette and Knocke (2001) on the effects of
backwashing and the long-term fate of manganese on filter media was conducted. The
authors concluded that backwashing didn’t remove all of the manganese deposits on the
media surface and that the remaining coating layer was always enough to ensure a high
manganese removal effectiveness after filtration resumed. The results also showed
minimal physical changes in effective size or uniformity due to the development of
manganese coatings. Consistent with previous experiments conducted by Knocke et al.
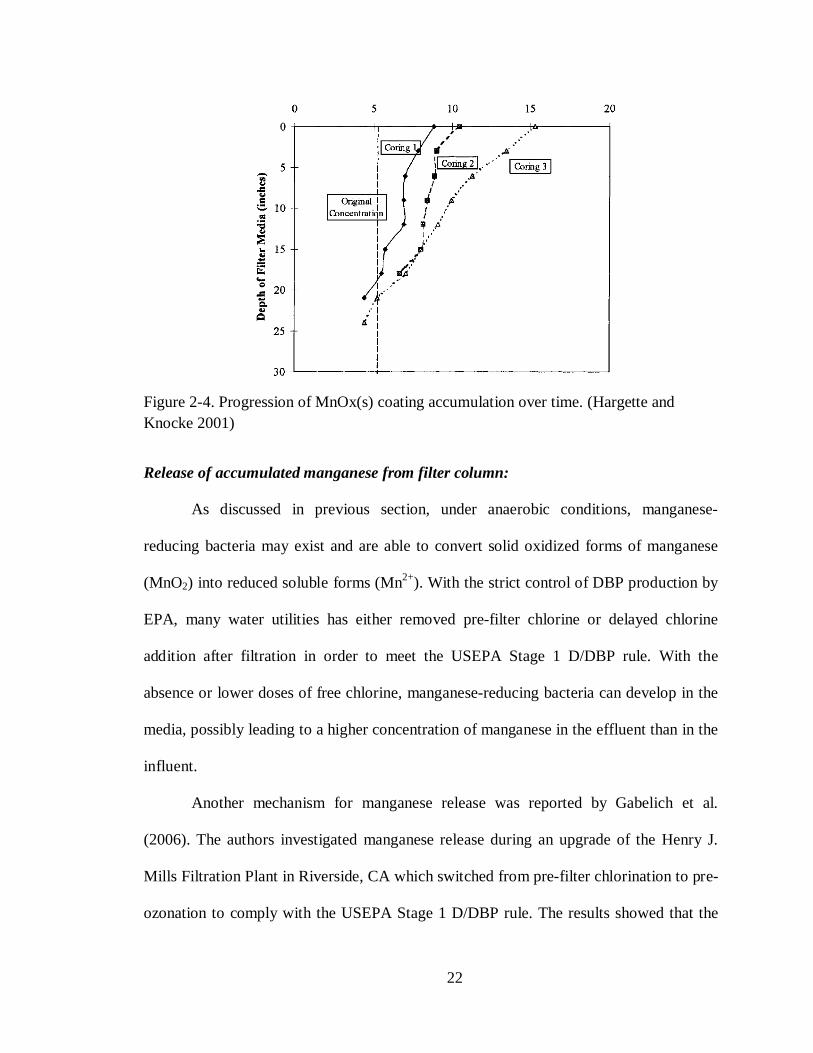
(1988), manganese profiles across the depth of filter media show that most of the
manganese (II) was removed in the upper 6 inches of filter media under loading rates up
to 5 gpm/ft2 (see Figure 2-4).
22
Figure 2-4. Progression of MnOx(s) coating accumulation over time. (Hargette and Knocke 2001)
Release of accumulated manganese from filter column:
As discussed in previous section, under anaerobic conditions, manganese-
reducing bacteria may exist and are able to convert solid oxidized forms of manganese
(MnO2) into reduced soluble forms (Mn2+). With the strict control of DBP production by
EPA, many water utilities has either removed pre-filter chlorine or delayed chlorine
addition after filtration in order to meet the USEPA Stage 1 D/DBP rule. With the
absence or lower doses of free chlorine, manganese-reducing bacteria can develop in the
media, possibly leading to a higher concentration of manganese in the effluent than in the
influent.
Another mechanism for manganese release was reported by Gabelich et al.
(2006). The authors investigated manganese release during an upgrade of the Henry J.
Mills Filtration Plant in Riverside, CA which switched from pre-filter chlorination to pre-
ozonation to comply with the USEPA Stage 1 D/DBP rule. The results showed that the
23
long-term use of a manganese contaminated ferric chloride coagulant (FeCl3) and pre-
filter chlorination had led to manganese deposits on media surfaces. According to the
authors, in the absences of free chlorine, Fe(III) or Al(III) displaced Mn(IV)/Mn(III)
bound to the anthracite surface through ion exchange. The displaced Mn(III) was then
catalytically oxidized to Mn(IV) by the downstream sand layer, producing MnO2 crystals.
This process doesn’t result in Mn-surface media coating of the sand, and MnO2 crystals
migrated through the filter via gravity.
DBP concerns
The use of free chlorine as a pre-filter oxidant may cause higher DBP
concentrations in finished water compared to post-filter chlorination; especially for water
utilities having high NOM in the raw water and the coagulation process downstream of
free chlorine inject point. A detailed discussion about this problem is presented in Section
2.3.
2.2 DISINFECTION BYPRODUCTS
After being reported in 1971 by Rook, DBPs have been the focus of extensive
research devoted to better understanding their formation in drinking water. The following
section briefly reviews some important information about DBPs.
2.2.1 Formation of Disinfection Byproducts
DBPs are groups of organic and inorganic compounds formed during water
disinfection. In drinking water, these compounds are created from the reaction between
disinfectant and NOM or certain inorganic species. Due to potential health risks,
24
currently four types of DBPs are regulated under the USEPA Stage 1 D/DBP rules. These
four types include trihalomethanes (THMs), haloacetic acids (HAAs), chlorite (ClO2-)
and bromate (BrO3-). Equation 2-1 shows a simplified version of the formation of organic
DBPs.
NOM + HOCl + Br- organic DBPs Equation 2-1
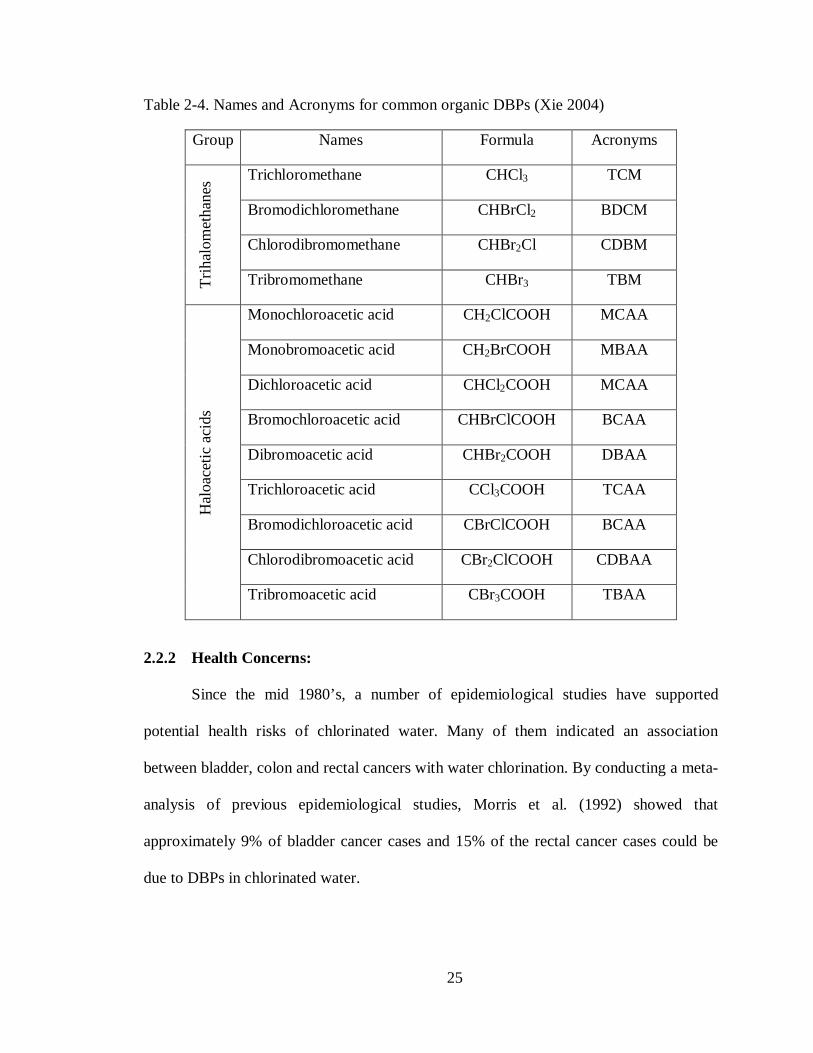
Names and acronyms for the THM and HAA organic DBPs are presented in
Table 2-4. Research data related to regulated and other unregulated DBPs were collected
and monitored by the US EPA under the Information Collection Rule (ICR). The
collected data were used to evaluate the potential health risks of pathogens, disinfectants,
and disinfection byproducts, and guide regulatory and public health decisions (US EPA
2006).
The use of chlorine dioxide as pre-oxidant and disinfectant in drinking water
treatment often leads to the existence of chlorite in treated water. In the presence of NOM
or other reducing agents in water, chlorine dioxide is reduced to chlorite as shown in
Equation 2-2.
ClO2 ClO2- Equation 2-2
Bromate is often found in ozonated water containing inorganic bromide. Ozone
can oxide bromide and convert it to bromate as shown in Equation 2-3.
O3 + Br- BrO3- Equation 2-3
It should be noted that the formation of DBPs is rather complicated, involving
many complex reactions and intermediate products rather than the simplified versions
presented in Equations 2-1, 2-2, and 2-3.
25
Table 2-4. Names and Acronyms for common organic DBPs (Xie 2004)
Group Names Formula Acronyms
Trih
alom
etha
nes Trichloromethane CHCl3 TCM
Bromodichloromethane CHBrCl2 BDCM
Chlorodibromomethane CHBr2Cl CDBM
Tribromomethane CHBr3 TBM
Hal
oace
tic a
cids
Monochloroacetic acid CH2ClCOOH MCAA
Monobromoacetic acid CH2BrCOOH MBAA
Dichloroacetic acid CHCl2COOH MCAA
Bromochloroacetic acid CHBrClCOOH BCAA
Dibromoacetic acid CHBr2COOH DBAA
Trichloroacetic acid CCl3COOH TCAA
Bromodichloroacetic acid CBrClCOOH BCAA
Chlorodibromoacetic acid CBr2ClCOOH CDBAA
Tribromoacetic acid CBr3COOH TBAA
2.2.2 Health Concerns:
Since the mid 1980’s, a number of epidemiological studies have supported
potential health risks of chlorinated water. Many of them indicated an association
between bladder, colon and rectal cancers with water chlorination. By conducting a meta-
analysis of previous epidemiological studies, Morris et al. (1992) showed that
approximately 9% of bladder cancer cases and 15% of the rectal cancer cases could be
due to DBPs in chlorinated water.
26
In addition, more recent research on the health impacts of DBPs has suggested
potential links between DBPs and reproductive and developmental health effects.
Although data at this time do not show concrete proof of these effects on humans, the
potential impacts cannot be eliminated (US EPA 2006).
2.2.3 Regulations:
In November, 1979, US EPA promulgated the first DBP regulation, the Total
Trihalomethanes rule. Community water systems using surface water and/or ground
water that served at least 10,000 people and injected a disinfectant to their drinking water
treatment system were required to achieve a MCL of 0.10 mg/L for total Trihalomethanes
(TTHM). Compliance data were based on running annual averages of quarterly samples
(RAAs).
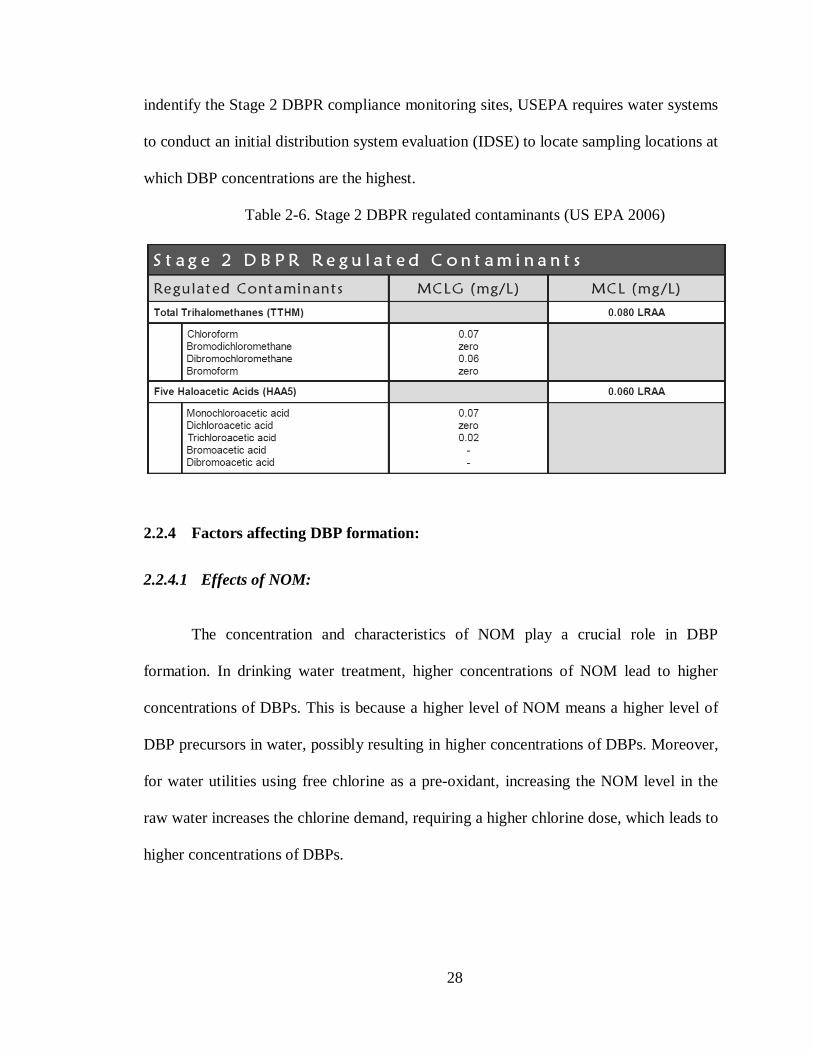
With increasing health concerns related to HAAs and THMs, the Stage 1
Disinfectants and Disinfection Byproducts Rule (Stage 1 D/DBPR) was issued in 1998
and became effective in January 2002. This rule established enforceable maximum
residual disinfection levels (MRDL) and maximum residual disinfection level goals
(MRDLGs) for three chemical disinfectants –chlorine, chloramines and chlorine dioxide;
maximum contaminant level goals for three THMs, two HAAs, bromate, and chlorite,
and enforceable maximum contaminant levels (MCLs) for TTHM, five haloacetic acids
(HAA5), bromate and chlorite (see Table 2-5). While THM, HAA5 and bromate
compliance is based on RAAs, chlorite is based on daily sampling. Furthermore, under
the Stage 1 D/DBPR, water facilities that use surface water or groundwater under the
direct influence of surface water and the use conventional treatment are also required to
remove specified percentages of organic matter depending on the level of NOM and
27
alkalinity in their source water. At the same time, to address the tradeoff of decreasing
disinfectant as well as DBP eliminating approaches, US EPA finalized the Interim
Enhanced Surface Water Treatment Rule (IESWTR) at the same time as the Stage 1
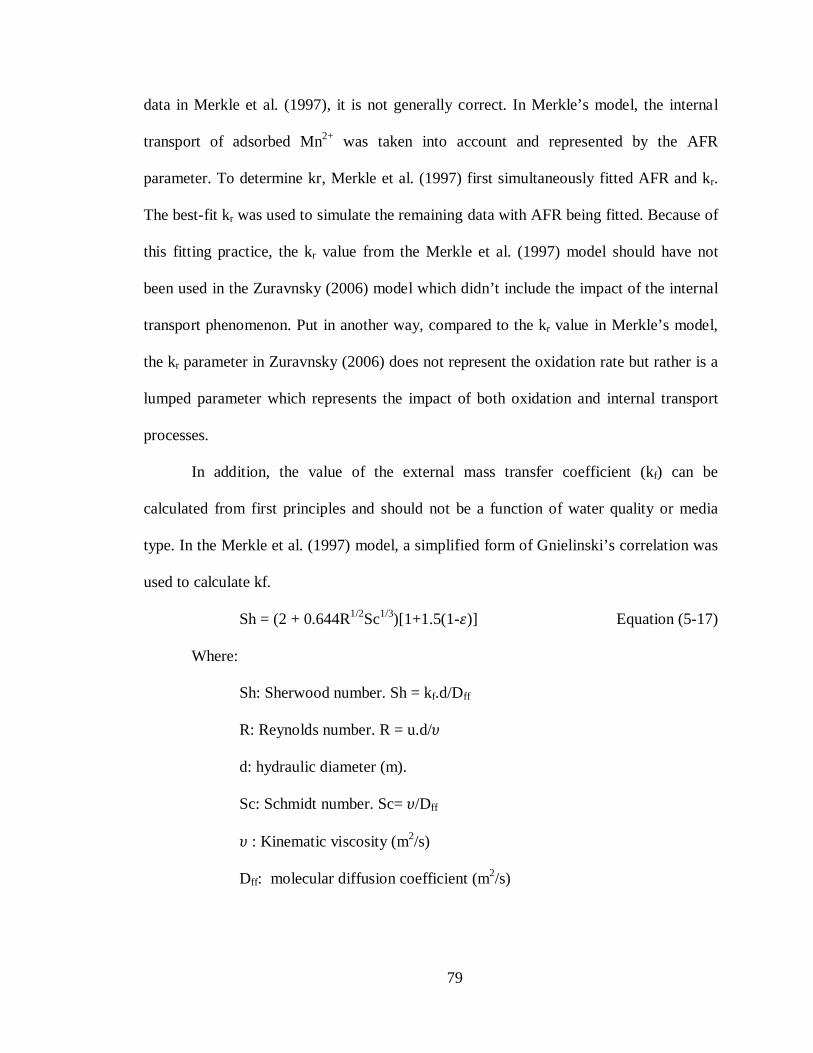
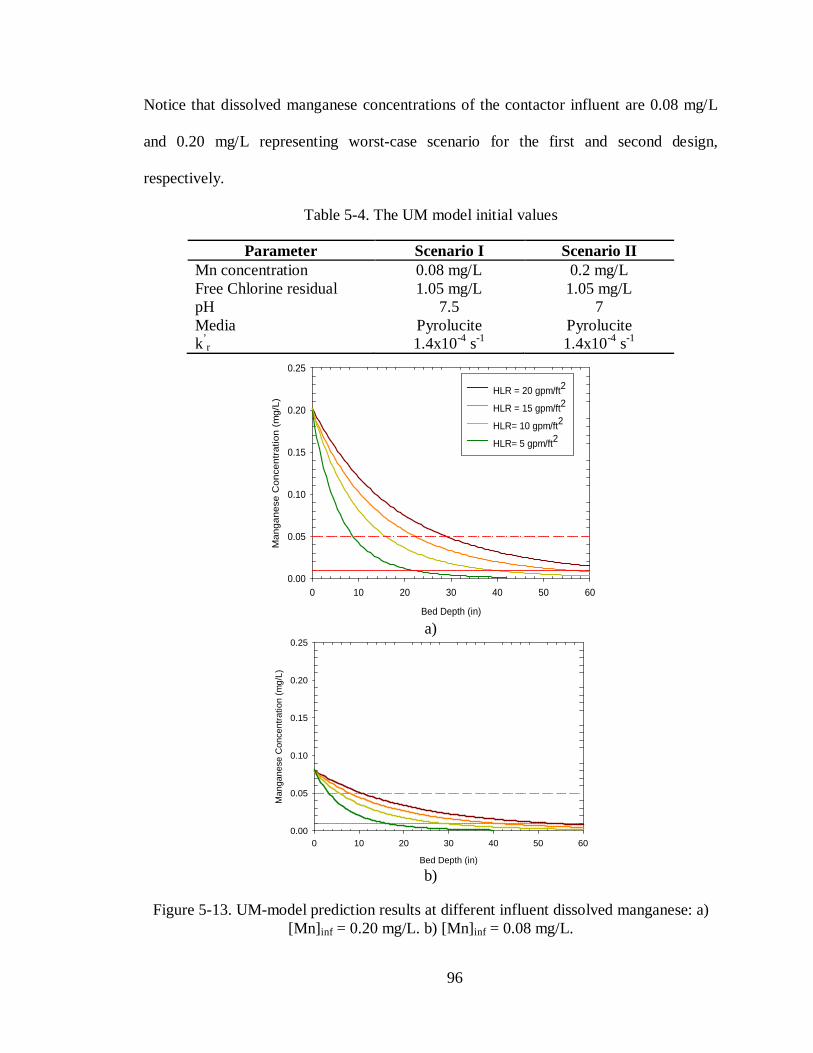
With a design capacity of 1.0 MGD, the LHWTP is currently utilizing pre-filter
oxidation, coagulation and filtration, and the OCM process to simultaneously remove
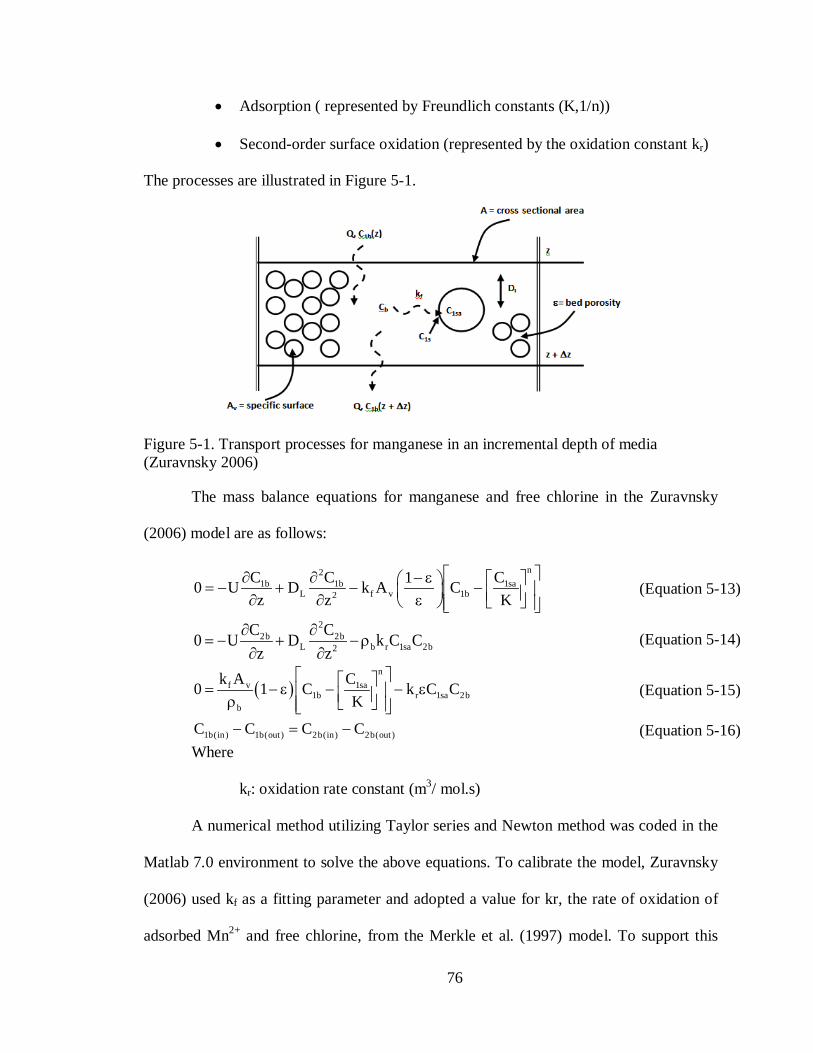
manganese, iron and NOM from the raw water. Figure 2-6 presents a process flow
diagram for the LHWTP before and after April 09, 2007. Raw water was dosed with
HOCl, KOH, KMnO4 and cationic polymer (Superfloc C572). Within seconds, the water
enters the three parallel pressurized filters. Each consists of 21 inches of anthracite over
24 inches of greensand. Filter effluent is then dosed with fluoride and PO4-3 before
entering the distribution system. In the original design, only pre-filter chlorine was added
to oxidize reduced metals, to reactive the manganese adsorption capacity of the filter
media, and to generate adequate chlorine residual entering the distribution system.
Dissolved manganese and iron in the raw water was converted to solids via oxidation
reactions with HOCl and KMnO4; the particulate forms were removed via media
filtration. Manganese removal was completed by adsorption and surface oxidation
process on the anthracite and greensand media. Also, C572 was added ahead of the filter
to facilitate the removal of particulates.
34
Figure 2-6. The Lantern Hill Water Treatment Plant Flow Diagram: a) Prior 4/9/2007, b) After 4/9/2007 (Russell 2008).
2.3.3 Summaries of Previous Research
With relatively high concentrations of NOM in the raw water throughout the year
(~3 mg/L), and high doses of pre-filter HOCl (~8 mg/L), the AWC was having
difficulties to meet the Stage 1 D/DBPR and future Stage 2 D/DBPR for the Mystic
Water System. To solve the problem, UMass researchers recommended that AWC
change the LH treatment process from only pre-chlorination to having both pre-filter
chlorination and post-filter chlorination. The idea was that by installing a post-
chlorination point and using it to provide the desired chlorine residual entering the
35
distribution system, the dose of pre-filter free chlorine could be significantly decreased,
resulting in lower concentrations of DBPs. On April 09, 2007, LH began to be operated
under this new configuration (see Figure 2-6b). The pre-filter chlorine dose was adjusted
from 8 mg/L to 2 mg/L and a post-filter chlorination dose of 1.5 mg/L was added to
supply the desired chlorine residual concentration.
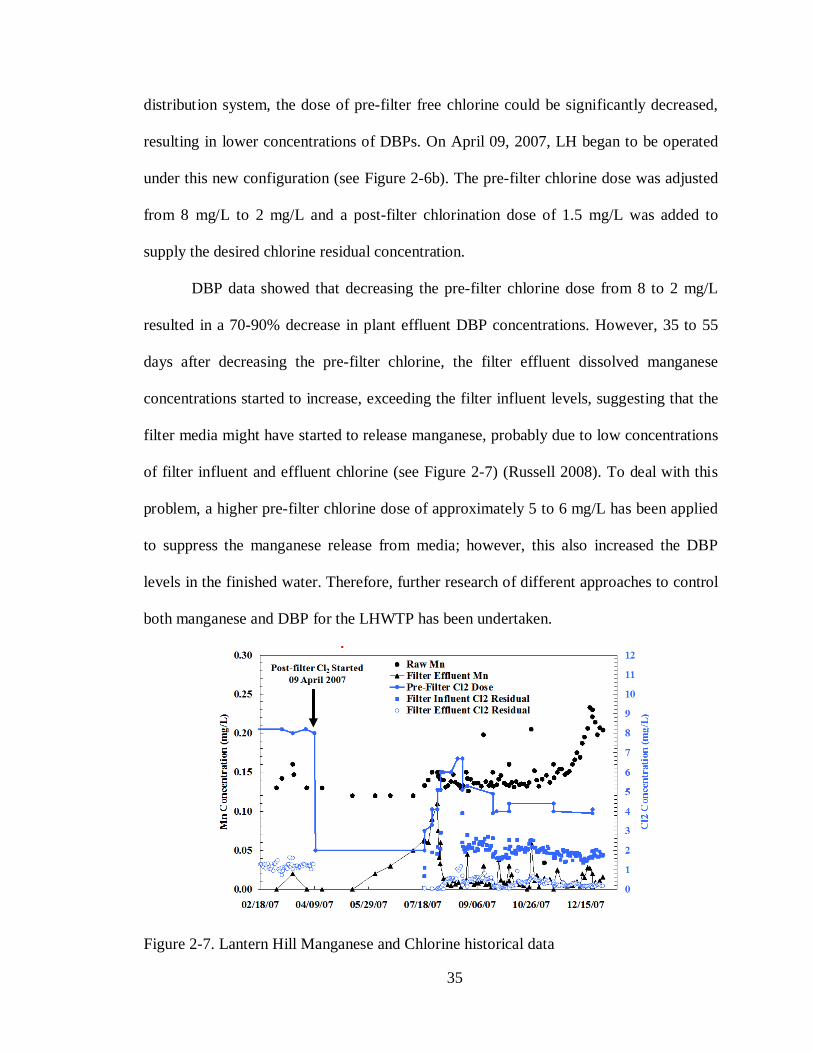
DBP data showed that decreasing the pre-filter chlorine dose from 8 to 2 mg/L
resulted in a 70-90% decrease in plant effluent DBP concentrations. However, 35 to 55
days after decreasing the pre-filter chlorine, the filter effluent dissolved manganese
concentrations started to increase, exceeding the filter influent levels, suggesting that the
filter media might have started to release manganese, probably due to low concentrations
of filter influent and effluent chlorine (see Figure 2-7) (Russell 2008). To deal with this
problem, a higher pre-filter chlorine dose of approximately 5 to 6 mg/L has been applied
to suppress the manganese release from media; however, this also increased the DBP
levels in the finished water. Therefore, further research of different approaches to control
both manganese and DBP for the LHWTP has been undertaken.
Figure 2-7. Lantern Hill Manganese and Chlorine historical data
36
CHAPTER 3: MATERIALS &METHODS This chapter provides detailed information about the Lantern Hill pilot-scale
system for treatment process assessment. The analytical methods used to measure water
quality are also discussed.
3.1 THE LANTERN HILL PILOT-SYSTEM
The pilot-scale system constructed on-site at the LHWTP was the main focus of
this research.
3.1.1 Pilot-Scale System Description:
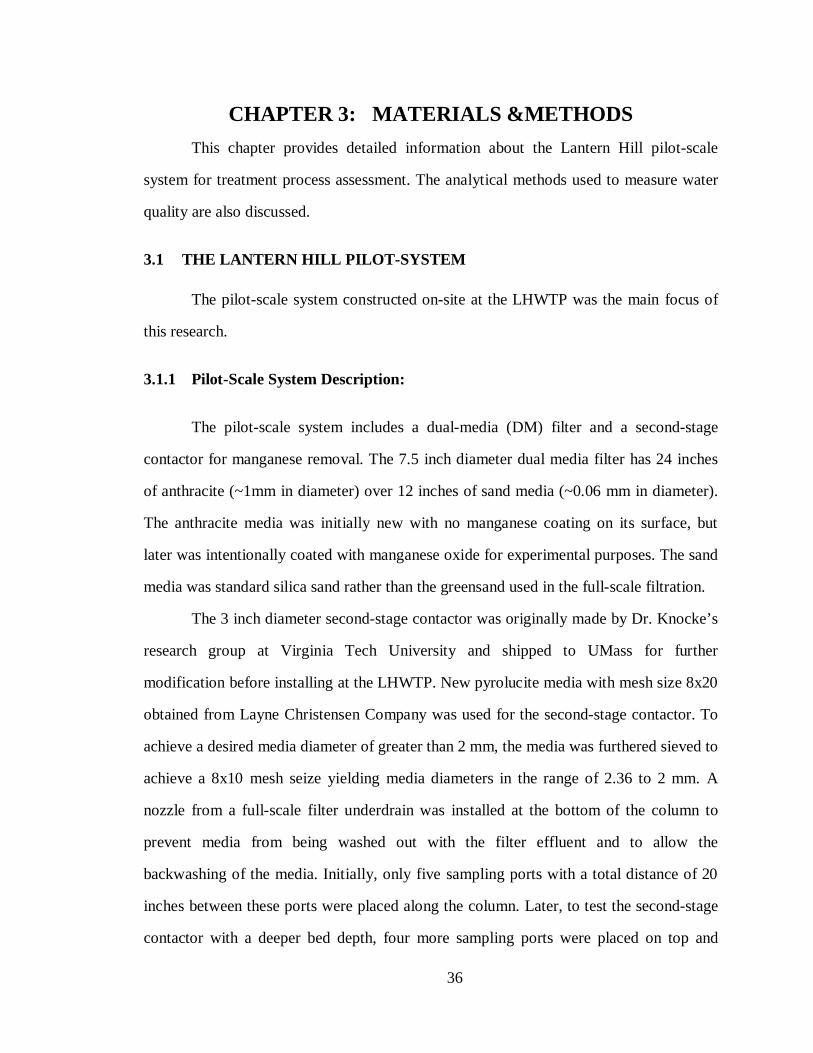
The pilot-scale system includes a dual-media (DM) filter and a second-stage
contactor for manganese removal. The 7.5 inch diameter dual media filter has 24 inches
of anthracite (~1mm in diameter) over 12 inches of sand media (~0.06 mm in diameter).
The anthracite media was initially new with no manganese coating on its surface, but
later was intentionally coated with manganese oxide for experimental purposes. The sand
media was standard silica sand rather than the greensand used in the full-scale filtration.
The 3 inch diameter second-stage contactor was originally made by Dr. Knocke’s
research group at Virginia Tech University and shipped to UMass for further
modification before installing at the LHWTP. New pyrolucite media with mesh size 8x20
obtained from Layne Christensen Company was used for the second-stage contactor. To
achieve a desired media diameter of greater than 2 mm, the media was furthered sieved to
achieve a 8x10 mesh seize yielding media diameters in the range of 2.36 to 2 mm. A
nozzle from a full-scale filter underdrain was installed at the bottom of the column to
prevent media from being washed out with the filter effluent and to allow the
backwashing of the media. Initially, only five sampling ports with a total distance of 20
inches between these ports were placed along the column. Later, to test the second-stage
contactor with a deeper bed depth, four more sampling ports were placed on top and
37
increasing the total distance between these ports to 39 inches (total media depth of
approximately 42 inch). The distances between these ports from top to bottom were as
follows: 6, 6, 6, 4, 3, 3, 6, and 5 inches.
3.1.2 Pilot System Operation and Maintenance
Raw water for the pilot system was supplied at a flow rate of 1 gallon per minute
(gpm) by either diverting from the main supply for the full-scale plant when it was
operated or by a submersible pump when the LHWTP was taken out of service. The
pilot-plant flow rate was measured using a flow meter installed ahead of the DM filter.
At a flow rate of 1 gpm, the hydraulic loading rates were 3 gpm/ft2 and 20 gpm/ft2 for the
DM filter and the second-stage contactor column, respectively. Chemical stock solutions
were prepared fresh at the beginning of each experiment and delivered to the main stream
by using manually controlled chemical-feed pumps in which flow rate can be controlled
by either adjusting stroke rate or stroke length.
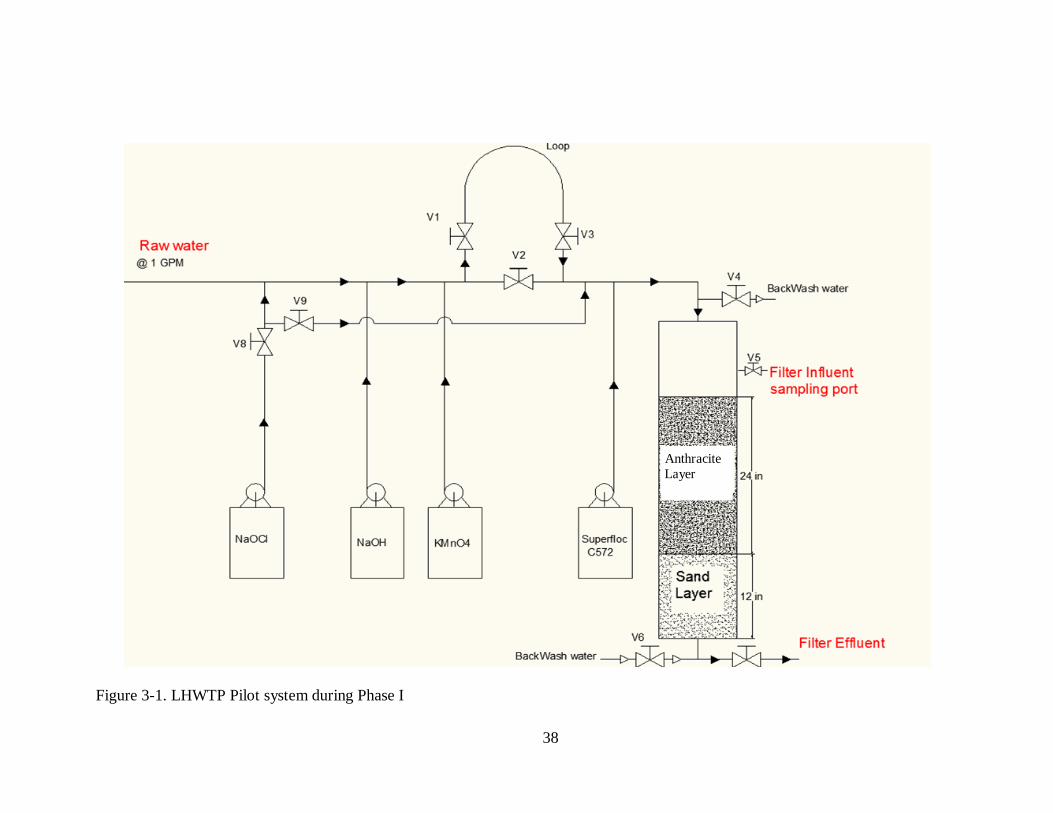
The pilot experiments can be divided into two phases. In Phase I, only the DM filter was
used (see Figure 3-1). The valve and piping system was installed to allow for different
orders of chemical addition. Sodium hypochlorite (NaOCl) could be added either ahead
of NaOH, KMnO4, and Superfloc C572 to mimic the full-scale plant or added in between
KMnO4 and Superfloc C572. The impact of increasing contact time between KMnO4 and
raw water was tested by inserting a 25-foot long, 1-inch diameter, pipe loop after the
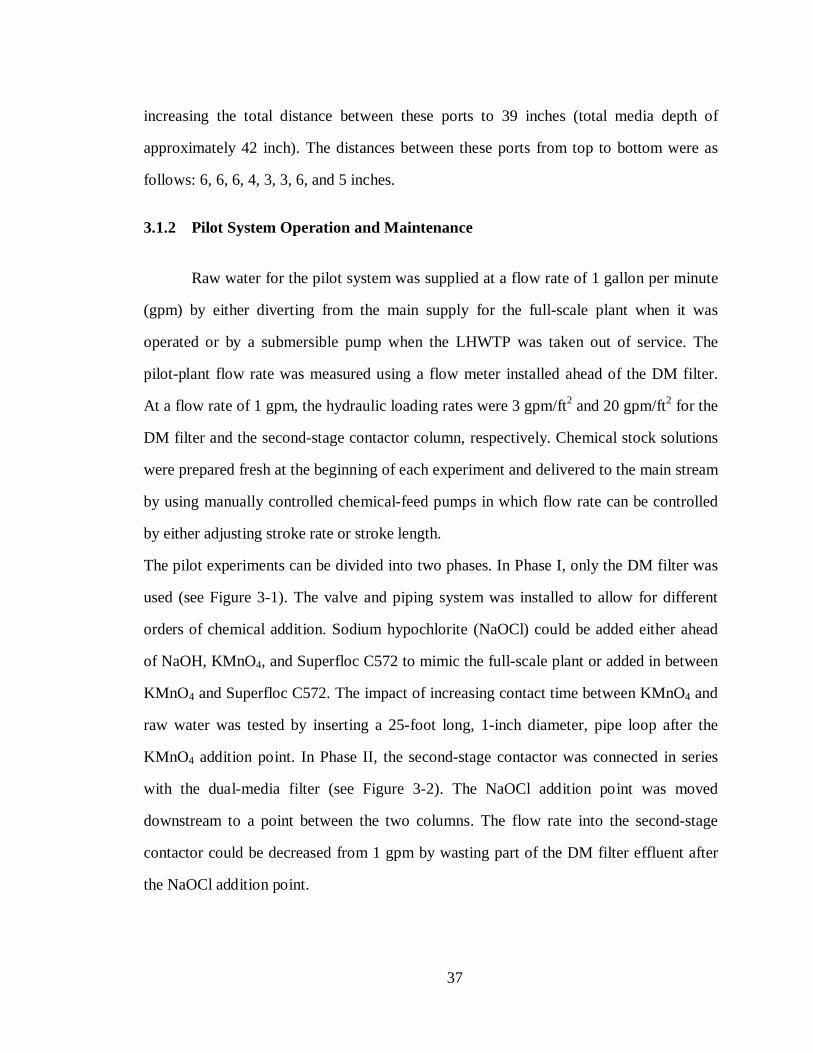
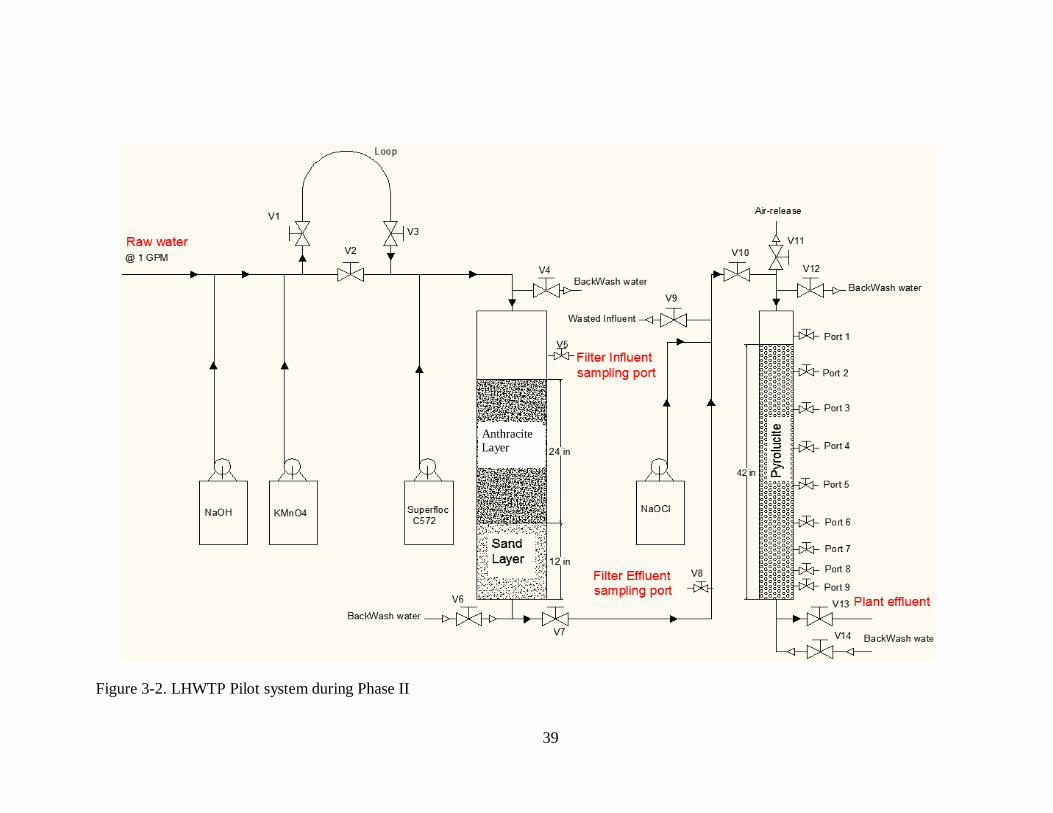
KMnO4 addition point. In Phase II, the second-stage contactor was connected in series
with the dual-media filter (see Figure 3-2). The NaOCl addition point was moved
downstream to a point between the two columns. The flow rate into the second-stage
contactor could be decreased from 1 gpm by wasting part of the DM filter effluent after
the NaOCl addition point.
38
Figure 3-1. LHWTP Pilot system during Phase I
Anthracite Layer
39
Figure 3-2. LHWTP Pilot system during Phase II
Anthracite Layer
40
Water quality was monitored at various sampling locations to assess performance
of the pilot-system.
Table 3-1 presents monitored water quality parameters at different sampling
points. The pilot system was kept running continuously for approximately 24 hours
before backwashing; this operating cycle is similar to that of the full-scale filters.
Periodically, samples were also collected for analysis of TOC and DBPs. Profiles of
manganese concentration along the contactor depth were also measured occasionally.
Table 3-1 Monitored water quality at different sampling locations during pilot experiments.
Sample types Total & dissolved Mn
Total & dissolved Fe
UV254 Turbidity Chlorine residual
pH
Raw water X X X X
DM influent X X X1 X
DM effluent X X X X
Contactor effluent X X X X 1 Dual media influent chlorine residual was only measured during the Phase I while dual media effluent chlorine residual was only measured during the Phase II.
3.2 Experimental Methods
3.2.1 Fractionation Procedure for Iron, Manganese and TOC
Water quality analysis for this project was used to determine chemical doses as
well as the effectiveness of the treatment processes. Manganese, iron and TOC were
usually classified into particulate, colloidal and dissolved fractions through two different
filtration processes. Colloidal plus dissolved fractions were determined by filtering water
samples through 0.2 µm pore size Millipore membrane filter to remove particulate metal
41
and organic carbon. The metal and organic carbon in the filtrate was considered the
colloidal and dissolved fractions for the water samples. To indentify the dissolved
fractions, water samples were filtered through a Millipore YM30 ultrafilter using nitrogen
gas and an Amicon 8200 200 mL ultrafilter cell to remove particle and colloidal
fractions. Nitrogen gas was used to for pressure, and also to prevent oxidation of Mn2+
and Fe2+ during the filtration process. For most of the LH water samples, no considerable
difference in manganese, iron and TOC concentrations in filtrates from these two
filtration processes was observed (i.e. no significant colloidal fractions were formed).
Due to its simple procedure, filtration through the 0.2 µm membrane was considered to
separate particulate and dissolved fractions of manganese, iron and TOC in this research.
3.2.2 Measurement of Manganese Oxide Coatings on Filter Media Surface
Anthracite media samples in the dual media were collected after backwash and
placed in plastic containers and filled with chlorinated filter effluent. The samples were
then transported to the University of Massachusetts Amherst Environmental Engineering
Laboratory to store in a 4oC constant temperature room.
A hydroxylamine sulfate (HAS) extraction procedure was employed to quantify
the manganese coating level on filter media surfaces. To reduce the manganese oxide to
dissolved form Mn2+, the media was soaked in a 0.5% nitric acid, hydroxylamine sulfate
solution. The concentration of manganese in filtered extraction solution was measured
using inductively coupled plasma mass spectroscopy (ICP-MS).
The detailed extraction procedure is described as follows (Russel 2008):
42
1. The media samples were first gently rinsed with DI water to remove
manganese oxide particles which were not physically attached to the
surface of the media.
2. A wet media sub-sample was weighed and then dried in an oven at 105oC.
The amount of wet media dried was selected to yield a desired dry media
mass of approximately one gram for extraction.
3. After 24 hours, the dried media was removed from the oven and placed in
a desiccator to cool to room temperature. Once cooled, the sample was
reweighed and placed in an Erlenmeyer flask containing 250 mL of 0.5%
nitric acid.
4. Approximately one gram of HAS was added to the solution to increase
the rate of dissolution of the metal oxide coating.
5. After at least two hours of reaction time, the liquid phase of the solution
was filtered through a 0.7 µm Whatman fine, glass-fiber filter (GF/F) and
analyzed for manganese, iron, aluminum and calcium content using an
ICP-MS.
6. Once the concentrations of the various metals in solutions were measured,
the media surface manganese contents were calculated using the
following expression:
Media Surface Metal Content, mg-Mn/g-media = [𝑀𝑛].𝑉𝑀𝑒𝑑𝑖𝑎 𝑀𝑎𝑠𝑠
Equation 3.1
Where:
[Mn]: concentration of manganese in the extraction solution, mg/L
V: volume of extraction solution utilized (e.g., 0.25 L ), L
43
Media Mass: dried weight of media extracted in the procedure, g
3.3 DBP Sampling Procedure
DBP data were an important factor in this research; therefore, a precise and
consistent sampling technique was required. Two types of DBP data were used to assess
DBP levels in the pilot-scale and full-scale effluents. The first type, called instantaneous
DBP, was used to assess the amount of DBPs in the filter or plant effluent. Pilot-scale and
full-scale effluent samples were quenched immediately with sodium sulfite (Na2SO3) to
prevent further reaction between free-chlorine and NOM. The second type of DBP data,
called 24hour DBPs, simulated the distribution system levels of DBPs. In this method,
pilot-scale and full-scale effluent samples were collected in 300 mL biochemical oxygen
demand (BOD) bottles, headspace free, and held for a period of 24 hours, in a dark room,
at a constant temperature of 20oC. For both types of DBP samples, in order to compare
full-scale and pilot-scale effluent DBP levels, it was crucial to have similar chlorine
residuals of approximately 1.00-1.05 mg/L at the time of DBP sampling.
3.4 Analytical Methods
3.4.1 Plastic and Glassware Preparation
Following the University of Massachusetts Amherst, Environmental Engineering
Research Laboratory Procedures, all plastic and glassware were properly prepared before
experiments. Depending on their intended use, the plastic and glassware were cleaned
following various protocols. First, they were soaked for 10-15 minutes in a warm
detergent solution. They were then rinse three times with tap water, followed by three
44
rinses with distilled water. After that, they were placed overnight in 10-15% sulfuric acid
bath before final rinse with DI water. The plastics vials used for ICP-MS measurement
were placed in 2% nitric acid overnight instead of sulfuric acid bath. All BOD bottles
used for DBP test were then placed in a 100 mg/L chlorine bath until use. The chlorine
bath was prepared fresh weekly. Non-volumetric glassware was later dried in a 110oC
oven, while plastic and volumetric glassware were placed in a lower temperature (~
50oC) convection drying oven.
3.4.2 Metal Concentration Measurements
Since most of experiments were conducted on-site at the LHWTP, iron and
manganese concentrations were measured using HACH pocket colorimeter test kits. The
ICP-MS measurement was mostly utilized to measure samples for assessing manganese
profiles along the second-stage contactor and extracted manganese from filter media
sampling.
3.4.2.1 HACH Low Range Total Manganese Pocket Colorimeter Test Kit Method
On-site total manganese concentrations were measured using a HACH low range
manganese pocket colorimeter test kit with measurement range from 0.01 to 0.7 mg/L
(Method 8149). First, 10 mL of sample was transferred into a HACH sample cell using
an Eppendorf pipette. Then, one Ascorbic Acid Powder Pillow, 12 drops of alkaline-
cyanide reagent, and 12 drops of Pan Indicator were added to the sample cell. After
waiting for 2 minutes, the sample vial was inserted in a colorimeter to measure
concentration. Prior to measuring the manganese concentration of the sample, the
45
instrument was zeroed using a blank sample. The blank sample preparation was similar to
sample preparation described above except that 10 mL of DI water was used instead of
10 mL of sample. In order to measure dissolved manganese, the samples was first filtered
through a 0.2 µm membrane filter; then the concentration of dissolved manganese in
filtrate was measured.
3.4.2.2 HACH Total Iron (FerroVer) Pocket Colorimeter Test Kit Method
Total iron concentrations were also measured on-site using a HACH total iron
(FerroVer) pocket colorimeter test kit with the measurement range from 0.02 mg/L to
5.00 mg/L (Method 8008). First, 10 mL of sample was transferred into a HACH sample
cell by using an Eppendorf pipette. Then, one FerroVer Iron Reagent Powder Pillow was
added to the sample cell. After waiting for 3 minutes, the sample was inserted in the
colorimeter to measure concentration. Prior to measuring the iron concentration of the
sample, the instrument was zeroed using a blank sample. The blank sample preparation
was similar to sample preparation described above except that 10 mL of DI water was
used instead of 10 mL of sample. In order to measure dissolved iron, the samples was
first filtered through a 0.2 µm membrane filter; then the concentration of dissolved iron in
filtrate was measured.
3.4.2.3 Inductively Coupled Plasma Mass Spectroscopy (ICP-MS)
ICP-MS was periodically used to measure manganese in samples collected to
determine profiles of manganese along the second-stage contactor as the manganese
concentration can be below the detection limit of the colorimeter method (described in
46
Section 3.4.2.1 above). Samples were stored in a 4oC constant temperature room and
acidified with 2% HNO3 before being analyzed. A set of five calibration manganese
standard solutions with concentrations of 0.001, 0.05, 0.1, 0.15, and 0.25 mg/L as Mn2+
were prepared from MnSO4. A daily performance solution including analytes at different
masses across the periodic table was measured to check the instrument performance at
different masses and intensities of interferences (oxides, double-charged negative ions).
The estimated detection limit for manganese is approximately 0.1-1 part per trillion (ppt).
For quality control (QC), the instrument also recorded relative standard deviation (RSD)
data for each example. An RSD value greater than 10 was the signal of the instrument
performance degradation. In these cases, a specific optimization and cleaning procedures
described in instrument’s manuals was followed to recover instrument sensitivity.
3.4.3 pH
A Thermo Electron Corp. Orion 520A or 410 A+ bench-top pH meter in
conjunction with a Thermo Orion pH probe was used for pH measurement. The
instrument was periodically calibrated using certified buffer solutions of pH 4, 7, 10.
3.4.4 Turbidity
Filter effluent turbidity was determined using a HACH 2100N turbidimeter. A
primary Formazin standard was used to calibrate the instrument and before each use the
calibration was checked using secondary standards.
47
3.4.5 Ultraviolet Absorbance (UV)
UV absorbance was measured using a HACH DR/4000 laboratory
spectrophotometer set at a wavelength of 254 nm. Before each measurement, samples
were filtered through either a GF/F or 0.2 µm Millipore membrane filter into 1 cm-path
length quartz glass cuvette. The instrument was zeroed with DI water before each use.
3.4.6 Total Organic Carbon (TOC)
The Shimadzu TOC/V at the UMass Amherst laboratory was used for this
measurement. Samples were collected, acidified to pH of 2 by adding 50µL of HCl 6N,
and stored in a 4oC constant temperature room. The instrument was calibrated
periodically using four calibration standards which have concentrations as follows: 0, 2,
5, and 10 mg/L. To prepare the standard solutions, a 1000 mg/L carbon stock solution
was made by dissolving 2.125 g of reagent grade potassium hydrogen phthalate,
previously dried at 105-120oC for 1 hour and cooled in a desiccators, in 1 L of DI water.
The stock solution was then diluted with DI water to achieve desired concentrations.
3.4.7 HACH Free Chlorine Pocket Colorimeter Test Kit Method
An on-site test kit method was used to measure chlorine residual during
experiments at the LHWTP. The measurement range from 0.02 mg/L to 2 mg/L. 10 mL
of water sample was first transferred to each of two HACH sample cells. The colorimeter
was then zeroed with one of the sample cells. A DPD Free Chlorine Powder pillow was
added to the other sample cell, and within one minute the sample was measured.
48
3.4.8 DBP Measurements
DBP measurements, including THM and HAA5, measurement were conducted at
the University of Massachusetts Amherst Laboratory according to Standard Operating
Procedures: Analysis of Haloacetic Acids and Trihalomethanes (Reckhow 2006). These
methods are closely aligned with US EPA Method 551.1 and 552.2.
3.4.8.1 Trihalomethane Extraction
Water samples were filled headspace-free into 40 ml amber vials containing 1 mL
of 1g/L sodium sulfide (Na2SO3) and approximately 1 gram of phosphate buffer.
Phosphate buffer was used to adjust pH to 4.5-5.5 while sodium sulfide was used as a
quench to reduce free chlorine residual to chloride. After the above procedure, samples
can be stored in a 4oC constant temperature room for no more than 14 days before being
extracted.
When performing the extraction, it was necessary to bring the analytical samples
to room temperature. In the mean time, calibration standards and QC samples were
prepared. For the LH effluent water, standards of 0, 5, 10, 20, 30, 50, 80, 100 and 150
µg/L were prepared. Using an Eppendorf pipette, 20 mL of Mili-Q water was added to 40
mL amber vial. Next, a THM standard stock II solution of 20 mg/L was added using
suitable glass syringes to yield desired standard concentration.
The extraction procedure for THMs in analytical samples and standard solutions
is described as follows:
1. Using Eppendorf pipette, place 20 mL of sample to be analyzed into vial
49
2. Using repeater pipet, add 4 mL of the pre-mixed Pentane plus internal
standard.
3. 15 g of anhydrous NasSO4 was added to each vial using a handmade glass
dispenser.
4. Samples were capped and shaken for 15 minutes in a modified sieve
shaker.
5. Using Pasteur pipet, transfer top organic layer to 2 mL autosampler vials.
This step must be done under the hood.
6. Autosampler vials were stored in a freezer for at least 3 hours. Each
sample was then inspected for ice. Any sample containing obvious ice
particles was transferred into a new autosampler vial.
7. Samples were analyzed using a Hewlett-Packard 5890 Series II Gas
Chromatograph (GC) within 14 days from extraction. The output data was
processed in conjunction with the calibration curve obtained from the
calibration standards.
3.4.8.2 HAA Extraction:
Using Eppendorf pipette, 30 mL of water sample was placed into 40 mL clear vial
containing 1mL of 1g/L Na2SO3. The vials were placed in a 4oC constant temperature
room for less than 14 days until extraction.
When performing an extraction, it was necessary to bring the analytical samples
to room temperature. In the mean time, calibration standards and QC samples were
prepared. For the LH effluent water, standards of 0, 5, 10, 20, 30, 50, 80, 100 and 150
50
µg/L were prepared. Using an Eppendorf pipette, 30 mL of Mili-Q water was added to 40
mL clear vials. Next, the THM standard stock II solution of 20 mg/L was added using
suitable glass syringes to yield desired standard concentration.
The extraction procedure for HAA in analytical samples and standard solutions is
described as follows:
1. Using a 10 mL glass pipette, 1.5 mL of concentrated sulfuric acid (H2SO4)
was added to each vial.
2. Using 25 µL glass syringe, 20 µL of surrogate (2,3-dibromopropionic
acid) stock solution was added to each vial.
3. Using a repeater pipette, 3 mL of pre-mixed methyl tertiary-butyl ether
(MTBE) plus internal standard (1,2,3-trichloropropane) was added to each
vial.
4. Using the glass dispenser, 15 g of anhydrous Na2SO4 was added to each
vial.
5. Samples were capped and shaken for 15 minutes in a sieve shaker.
6. While the samples were being shaken, 2 mL of acidic methanol + 5%
H2SO4 was placed into labeled, 20 mL, clear vials using a repeater pipette.
7. The vials were then placed in a 50oC water bath for 2 hours.
8. After removing from the water bath, 5 mL of NaHCO3 solution was added
to each vial using a repeater pipette.
9. 1 mL of pure MTBE was then added to each vial using a repeater pipette.
10. Samples were then capped and shaken for 2 minutes at 400 rpm using a
rotary table shaker.
11. The top organic layer of each sample was placed into a 2 mL autosampler
vial using Pasteur pipettes.
51
12. Similar to THM extraction procedure, autosampler vials were stored in a
freezer for at least 3 hours to inspect for ice. Liquid portion of any sample
containing observable ice was transferred to a new autosampler vial.
13. Samples were analyzed using a Hewlett-Packard 5890 Series II Gas
Chromatograph (GC) within 14 days from extraction. The output data was
processed in conjunction with the calibration curve obtained from the
calibration standards.
3.4.8.3 Quality Assurance/Quality Control Procedures
The following QA/QC procedure was completed for each set of samples to ensure
the quality of DBP measurement:
1. To ensure no interference in solvent as well as internal standard solutions,
two solvent blanks and two solvent blank plus internal standards were
inserted at the beginning positions of each run and between standard and
analytical samples.
2. One out of every 12 analytical samples was spiked with 50 µL of HAA
stock II solution. The spiked samples were always a duplicate of an
analytical sample and was extracted, analyzed concurrently with the
samples. The analyte recovery percentages were then evaluated.
3. When new stock solution was made, an old standard solution of 50 µL
was extracted, analyzed concurrently with new standard solution to
verify/compare the accuracy between old and new stock solutions.
4. Slopes of standard curves were also recorded to check the accuracy of the
experimental procedure and accuracy of the instruments.
52
CHAPTER 4: FIELD EXPERIMENT RESULTS
This chapter provides results of different field experiments for different pilot
designs to determine a suitable method to simultaneously control manganese and DBPs at
the LHWTP. These experiments can be classified into two phases. In Phase I,
experiments involved optimizing the first-stage filter operation to maximize the removal
of iron, manganese, and NOM while minimizing DBP formation with or without pre-
filter chlorine. In Phase II, experiments were conducted to verify the effectiveness of
separating NOM and manganese removal into two different steps with intermediate free-
chlorine dosing. The experiments were conducted on the two-stage pilot system built on-
site at the LHWTP.
4.1 Phase I: Optimization of the First-stage Dual-Media Filter
Previous research conducted in 2008 at the LHWTP suggested that soluble
manganese entering the filter was more likely adsorbed by the top anthracite media rather
than the bottom greensand media, and that a higher dose of free chlorine (~5-8mg/L) was
required to suppress manganese release which was the result of manganese-reducing
bacteria activity (Russel (2008), Islam (2010)). To evaluate the feasibility of changing the
full-scale plant filter media to standard anthracite and sand to allow for lower pre-filter
chlorine dose without manganese release from the media, new anthracite media with no
manganese oxide coating over a layer of silica sand were placed in the first-stage filter
pilot column.
53
4.1.1 Without pre-filter chlorine:
The objective of this experiment was to achieve desired manganese removal
through oxidation by permanganate only followed by coagulation and filtration.
Permanganate dose and influent pH were optimized based on manganese removal
criteria. These experiments were conducted over five days between 12/4/08 and 1/06/09.
By adjusting flow rate of the NaOH and KMnO4 pumps, pH was adjusted to vary
from 7.0 and 8.0 while permanganate dosing ranged from about 0.75 to 1.5 times the
calculated stoichiometric dose to oxidize iron and manganese in the raw water. The
polymer dose was kept at ~4.5 mg/L similar to that at full-scale. At each combination of
pH and permanganate dose, the concentration of dissolved manganese along with
turbidity and UV were measured. It should be noted that the stoichiometric dose in these
experiments was calculated based on dissolved manganese and total iron in raw water
rather than dissolved iron. This might have led to an overdose of KMnO4 when the
LHWTP was shut down. Under normal operation, the raw water was supplied from a tap
on the main feed, and a low concentration of dissolved oxygen (~1 mg/L) was present in
the raw water, causing a minimal difference between total and dissolved iron. However,
this situation changed when the LHWTP was shut down and a submersible pump was
placed in the well and utilized to supply the raw water for pilot work, causing higher
concentrations of oxygen (~3-4 mg/L) and increases in the particulate fraction of iron in
the raw water.
Figure 4-1 summarizes the concentration of influent/effluent manganese at
different combinations of pH and KMnO4. As expected, essentially, all effluent iron and
manganese was in the dissolved form. The effluent data show that for all tested
54
conditions, iron was easily removed through oxidation followed by filtration; the effluent
concentrations were mostly below the detection level. In contrast, only 83% manganese
removal was achieved at the optimized testing condition with the lowest concentration
recorded at 0.05 mg/L which barely meets the SMCL and is higher than the
recommended level of 0.01 mg/L. Table 4-1 summarizes manganese and iron results for
three different runs. The raw water quality was rather consistent during the experiments
with the concentration of total manganese ranging from 0.15 to 0.19 mg/L while the
concentration of total iron varied from 1.5 to 1.8 mg/L.
a)
b)
Figure 4-1. The LHWTP pilot system: Impact of KMnO4 dosing and pH on: a) Filter Influent. b) Filter Effluent.
In theory, increasing pH will help to increase the rate of manganese oxidation to
particulate MnO2, and thus lead to better manganese removal during the filtration step.
But in fact, the benefit of increasing pH in these experiments is more noticeable at a pH
of 7.5 rather than a pH of 8.0. Also, changing the KMnO4 dosing had a different effect at
each pH value. At a pH of 7, the dissolved manganese concentrations in the effluent were
maintained in the range of 0.09 mg/L to 0.12 mg/L with no clear trend following the
increase of KMnO4 dosing from 0.75 to 1.75 times the stoichiometric dose. At a pH of
7.5, however, the effect of increase dosing was more noticeable with the concentration of
dissolved manganese decreasing from 0.06 to 0.03 mg/L. At a pH of 8.0, the dissolved
manganese started to increase at the permanganate dose of 1.25 times the stoichiometric
dose (from 0.05 to 0.08 mg/L) and eventually a pink color on the membrane filter was
observed at the highest dose (1.75 times the stoichiometric dose), which was an
indication of KMnO4 overdosing. Based on these results, a pH of 7.5 and a KMnO4 dose
of 1.25 times the stoichiometric dose were chosen for the next experiments.
The new data, along with previous data collected in 2007, suggested that pre-filter
permanganate addition followed by coagulation and filtration cannot achieve the 0.01
mg/L targeted level of dissolved manganese in the dual-media filter effluent. The low
concentration of dissolved manganese (<0.02 mg/L) in the full-scale finished water at the
LHWTP was due to adsorption of manganese by manganese oxide coated media with
continuous addition of pre-filter chlorine to regenerate adsorptive sites. The next logical
step was to coat only the anthracite media with manganese oxide and apply a low pre-
filter chlorine dose to enhance manganese removal in the pilot filter.
57
4.1.2 With pre-filter chlorine:
In these experiments, the anthracite media was pre-coated with manganese oxide
and the pre-filter chlorine dose was maintained at a low level of 2 mg/L resulting in a
filter influent chlorine residual of 0.3-0.6 mg/L and a filter effluent chlorine residual of
0.2 mg/L. The goal was to avoid a manganese coating from developing in the sand layer,
minimizing the possibility of manganese release from the dual media column. Samples of
media were taken back to UMass for coating level analysis. Due to constraints from both
the LHWTP and UMass teams, these experiments were not conducted continuously and
stretched over the summer of 2009. The full-scale LHWTP was shut down from January
15, 2009 to July, 2009; thus, some experiments were conducted with raw water supplied
by a submersible pump inserted into the well casing that fed a small diameter pipe to the
pilot column during the LH shut-down period. Due to low flow of the pilot pump, the
concentration of dissolved oxygen in the raw water was higher than normal (~3 mg/L
compared to ~1 mg/L). As a result of oxidation by dissolved oxygen, only about 25% of
total iron existed as the dissolved form in the raw water prior to treatment.
Another change in this experiment was the increase of contact time between
KMnO4 and raw water by inserting a 25-foot long, 1-inch diameter, pipe loop ahead of
the DM filter which provided an additional 1 minute of contact time at a flow rate of 1
gpm. The design originated from the possibility of moving the KMnO4 and NaOH
addition points from the main building to the well house which would create an
additional one minute contact time prior to chlorine and polymer addition. This also
represented a reversed order of oxidant addition compared to the full-scale which for the
last few years has been free chlorine prior to KMnO4. It was hoped that by providing
58
additional contact time, reactions between KMnO4 and dissolved manganese and iron
will be more complete, possibly reducing the pre-filter chlorine demand, and allowing for
a lower pre-filter chlorine dose to establish desired chlorine residual entering the column.
To assess this idea, the chemical addition order of the pilot work was first set up
in reverse order to that of the full-scale plant with the pipe loop inserted between oxidant
addition points. After collecting DBP and TOC samples, the pilot plant was then
switched back to mimic the chemical order of the full-scale plant (the loop was removed
in this case) and another set of TOC and DBP samples were collected for comparison
purposes. TOC and DBPs were measured at UMass. Timing of the work was crucial for
this experiment. These two pilot conditions were tested using the same water quality, so
either the raw water supply was diverted from the full-scale supply as occurred prior to
January 6, 2009 or from the submersible pump to the pilot plant, but not a mixture of
these two conditions.
4.1.2.1 Manganese removal:
Anthracite media were coated by soaking in a 100 mg/L permanganate solution.
The media was then backwashed and allowed to soak in free-chlorine solution until use
for experiments. An initial coating effort was conducted at the end of January 2009,
resulting in a rather low coating level of 0.07 mg Mn/mg media. On February 10, 2009,
the concentration of manganese across the filter was assessed to test the adsorption
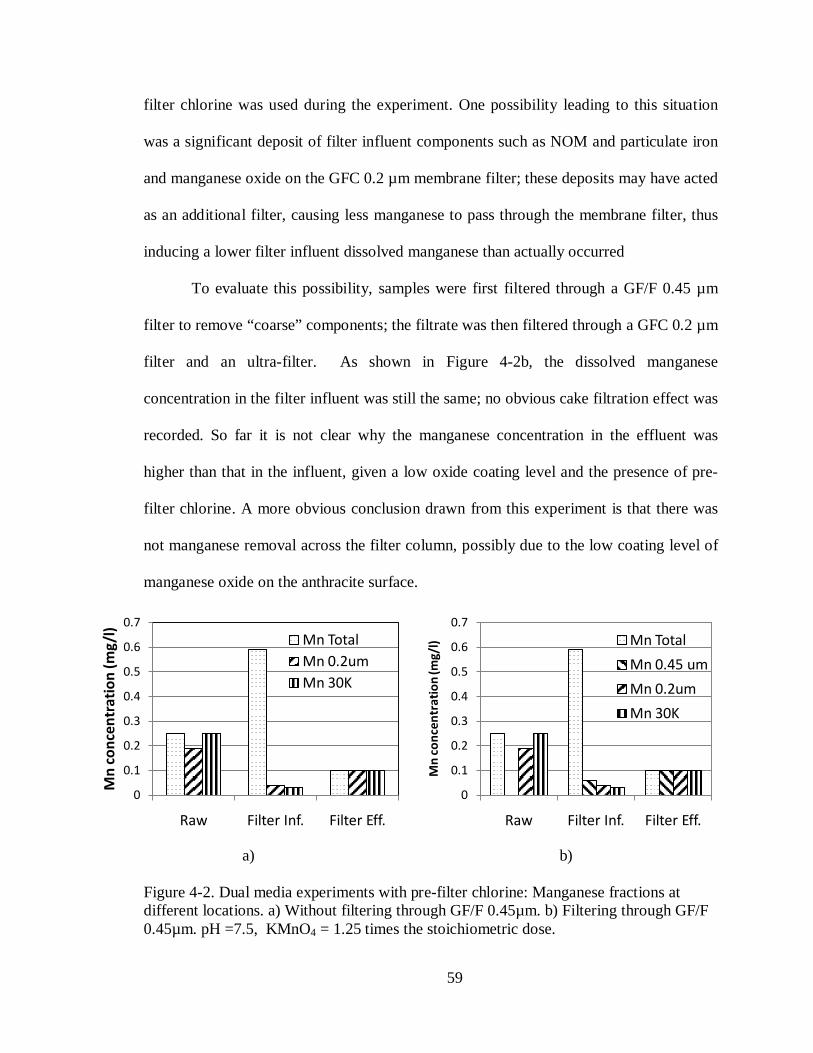
capacity of the newly-coated media. The results in Figure 4-2a show that the effluent
dissolved manganese was higher than the influent (0.1 mg/L compared to 0.03 mg/L);
this was unexpected as the media had a low coating level of manganese oxide and pre-
59
filter chlorine was used during the experiment. One possibility leading to this situation
was a significant deposit of filter influent components such as NOM and particulate iron
and manganese oxide on the GFC 0.2 µm membrane filter; these deposits may have acted
as an additional filter, causing less manganese to pass through the membrane filter, thus
inducing a lower filter influent dissolved manganese than actually occurred
To evaluate this possibility, samples were first filtered through a GF/F 0.45 µm
filter to remove “coarse” components; the filtrate was then filtered through a GFC 0.2 µm
filter and an ultra-filter. As shown in Figure 4-2b, the dissolved manganese
concentration in the filter influent was still the same; no obvious cake filtration effect was
recorded. So far it is not clear why the manganese concentration in the effluent was
higher than that in the influent, given a low oxide coating level and the presence of pre-
filter chlorine. A more obvious conclusion drawn from this experiment is that there was
not manganese removal across the filter column, possibly due to the low coating level of
manganese oxide on the anthracite surface.
a)
b)
Figure 4-2. Dual media experiments with pre-filter chlorine: Manganese fractions at different locations. a) Without filtering through GF/F 0.45µm. b) Filtering through GF/F 0.45µm. pH =7.5, KMnO4 = 1.25 times the stoichiometric dose.
0
0.1
0.2
0.3
0.4
0.5
0.6
0.7
Raw Filter Inf. Filter Eff.
Mn
conc
entr
atio
n (m
g/l) Mn Total
Mn 0.2umMn 30K
0
0.1
0.2
0.3
0.4
0.5
0.6
0.7
Raw Filter Inf. Filter Eff.
Mn
conc
entr
atio
n (m
g/l) Mn Total
Mn 0.45 umMn 0.2umMn 30K
60
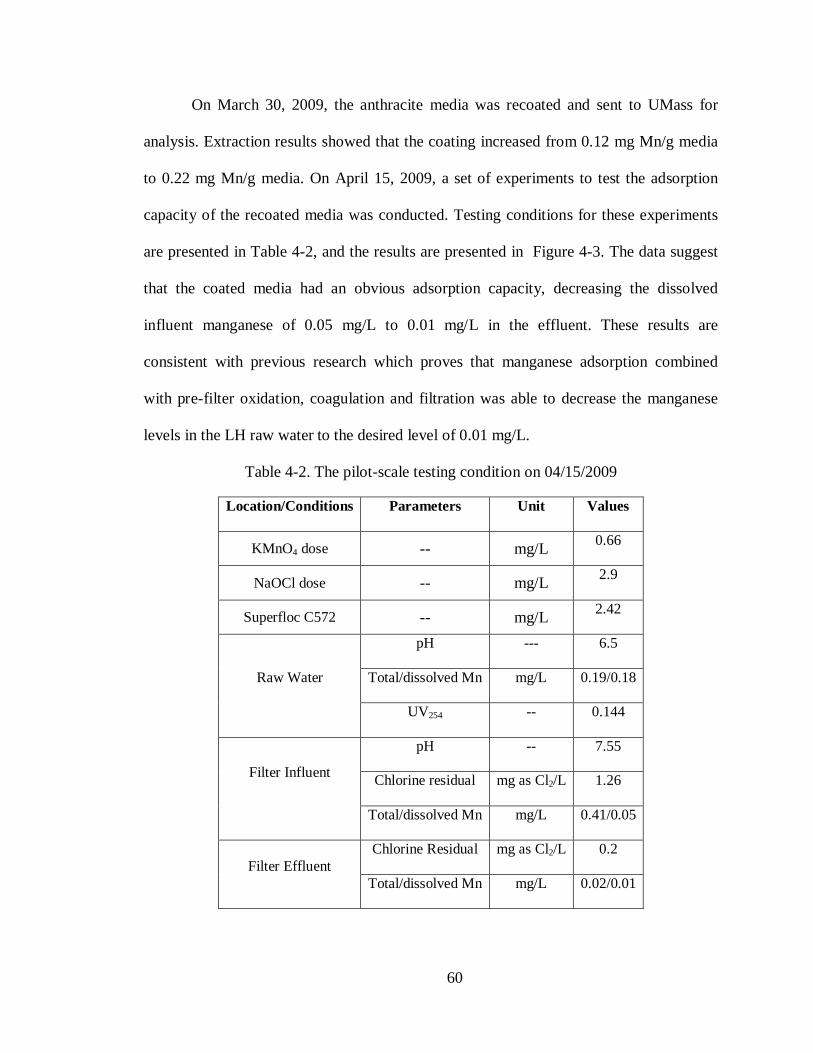
On March 30, 2009, the anthracite media was recoated and sent to UMass for
analysis. Extraction results showed that the coating increased from 0.12 mg Mn/g media
to 0.22 mg Mn/g media. On April 15, 2009, a set of experiments to test the adsorption
capacity of the recoated media was conducted. Testing conditions for these experiments
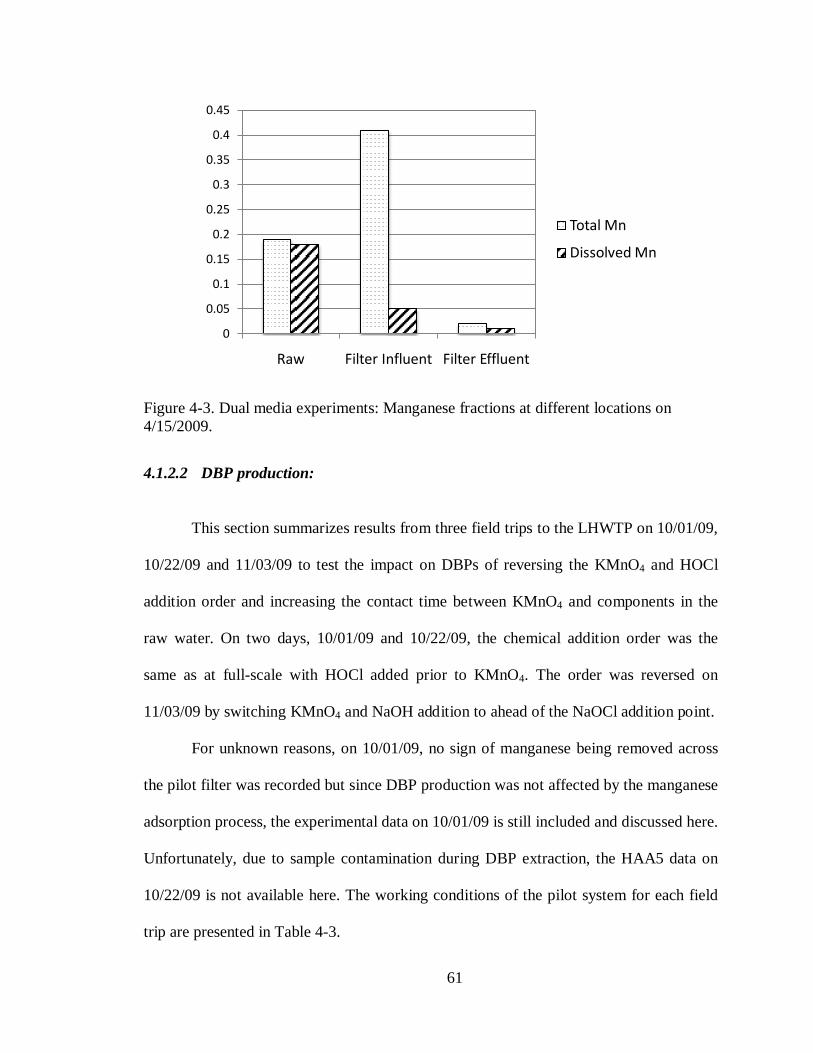
are presented in Table 4-2, and the results are presented in Figure 4-3. The data suggest
that the coated media had an obvious adsorption capacity, decreasing the dissolved
influent manganese of 0.05 mg/L to 0.01 mg/L in the effluent. These results are
consistent with previous research which proves that manganese adsorption combined
with pre-filter oxidation, coagulation and filtration was able to decrease the manganese
levels in the LH raw water to the desired level of 0.01 mg/L.
Table 4-2. The pilot-scale testing condition on 04/15/2009
Location/Conditions Parameters Unit Values
KMnO4 dose -- mg/L 0.66
NaOCl dose -- mg/L 2.9
Superfloc C572 -- mg/L 2.42
Raw Water
pH --- 6.5
Total/dissolved Mn mg/L 0.19/0.18
UV254 -- 0.144
Filter Influent
pH -- 7.55
Chlorine residual mg as Cl2/L 1.26
Total/dissolved Mn mg/L 0.41/0.05
Filter Effluent Chlorine Residual mg as Cl2/L 0.2
Total/dissolved Mn mg/L 0.02/0.01
61
Figure 4-3. Dual media experiments: Manganese fractions at different locations on 4/15/2009.
4.1.2.2 DBP production:
This section summarizes results from three field trips to the LHWTP on 10/01/09,
10/22/09 and 11/03/09 to test the impact on DBPs of reversing the KMnO4 and HOCl
addition order and increasing the contact time between KMnO4 and components in the
raw water. On two days, 10/01/09 and 10/22/09, the chemical addition order was the
same as at full-scale with HOCl added prior to KMnO4. The order was reversed on
11/03/09 by switching KMnO4 and NaOH addition to ahead of the NaOCl addition point.
For unknown reasons, on 10/01/09, no sign of manganese being removed across
the pilot filter was recorded but since DBP production was not affected by the manganese
adsorption process, the experimental data on 10/01/09 is still included and discussed here.
Unfortunately, due to sample contamination during DBP extraction, the HAA5 data on
10/22/09 is not available here. The working conditions of the pilot system for each field
trip are presented in Table 4-3.
0
0.05
0.1
0.15
0.2
0.25
0.3
0.35
0.4
0.45
Raw Filter Influent Filter Effluent
Total Mn
Dissolved Mn
62
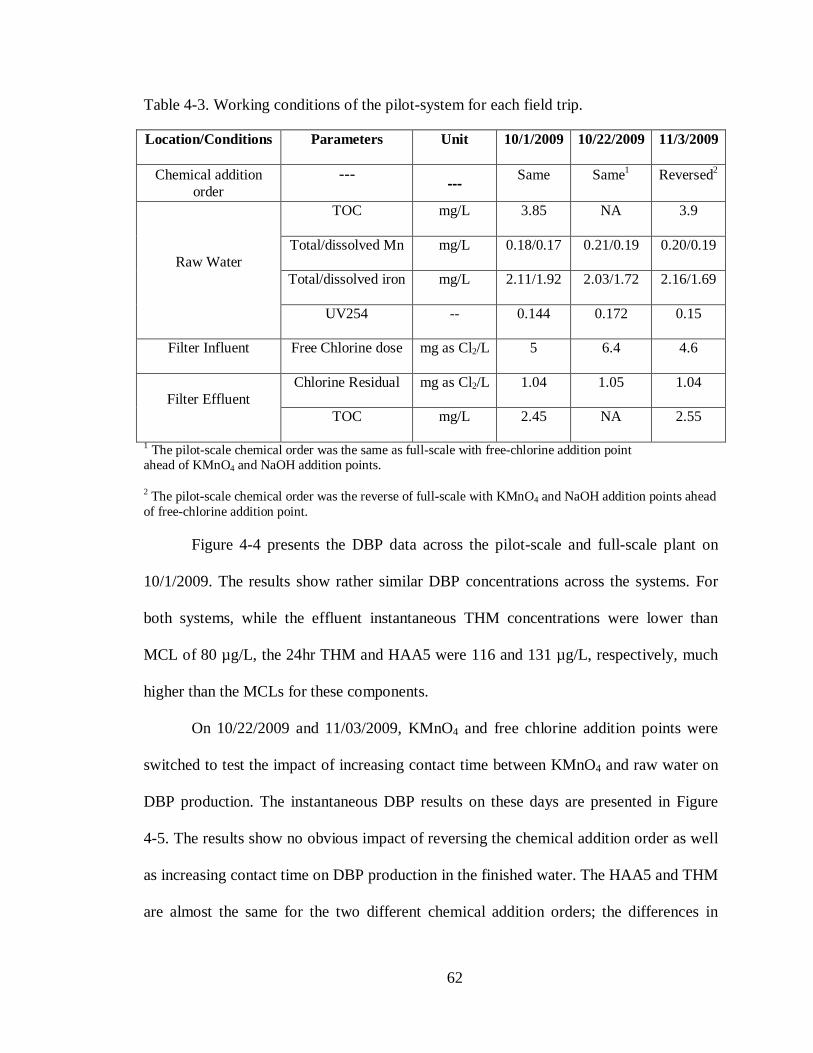
Table 4-3. Working conditions of the pilot-system for each field trip.
Location/Conditions Parameters Unit 10/1/2009 10/22/2009 11/3/2009
Filter Effluent Chlorine Residual mg as Cl2/L 1.04 1.05 1.04
TOC mg/L 2.45 NA 2.55
1 The pilot-scale chemical order was the same as full-scale with free-chlorine addition point ahead of KMnO4 and NaOH addition points.
2 The pilot-scale chemical order was the reverse of full-scale with KMnO4 and NaOH addition points ahead of free-chlorine addition point.
Figure 4-4 presents the DBP data across the pilot-scale and full-scale plant on
10/1/2009. The results show rather similar DBP concentrations across the systems. For
both systems, while the effluent instantaneous THM concentrations were lower than
MCL of 80 µg/L, the 24hr THM and HAA5 were 116 and 131 µg/L, respectively, much
higher than the MCLs for these components.
On 10/22/2009 and 11/03/2009, KMnO4 and free chlorine addition points were
switched to test the impact of increasing contact time between KMnO4 and raw water on
DBP production. The instantaneous DBP results on these days are presented in Figure
4-5. The results show no obvious impact of reversing the chemical addition order as well
as increasing contact time on DBP production in the finished water. The HAA5 and THM
are almost the same for the two different chemical addition orders; the differences in
63
DBPs for each test can be attributed to changes in chlorine dose or more likely sample
extraction and data analysis. Based on these results, a different treatment technology is
needed to control manganese and DBP at the LHWTP.
Figure 4-4.DBP concentrations across the pilot-scale and full-scale on 10/01/2009.
Figure 4-5. LH pilot-scale filter effluent instantaneous DBP data from different configurations. Same: the chemical order is the same as full-scale. Reversed: the chemical order is the reverse of full-scale with KMnO4, NaOH ahead of free chlorine addition.
1929
116
14
46
116
50
75
131
37
82
139
0
20
40
60
80
100
120
140
160
PSI Inst PSE Inst PSE 24 FSI Inst FSE Inst FSE 24
Conc
entr
atio
n (µ
g/L)
THM HAA5
29
3833
75 74
0
10
20
30
40
50
60
70
80
90
10/01/09 Same 10/22/09 Same 11/03/09 Reverse
Conc
entr
atio
n (µ
g/L)
THM Inst HAA5 Inst
64
4.2 Phase II: Second-stage contactor
This section presents experimental data from the two-stage pilot-scale filter
system with emphasis on decreasing DBP production. These experiments were conducted
during three different field trips (12/21-12/22/09, 01/05-01/07/10, 01/12-01/13/10). Data
for an experiment on 7/15/2010 which evaluated the impact of HLR variation on
manganese removal are also included.
The pilot system ran continuously and was backwashed after an approximately
24-hour run consistent with the full-scale filter running cycle. A free chlorine dose of 2
mg/L which generated ~1mg/L chlorine residual was added in front of the second-stage
contactor. The flow rate to the second-stage contactor was adjusted by wasting part of the
first-stage effluent. The chemical addition order for the two-stage pilot-scale system
followed the reversed order of the full-scale in which KMnO4 and NaOH were added to
the raw water in front of the pipe loop followed by cationic polymer (Superfloc C572).
DBP and TOC samples were collected when the pilot system achieved desired
performance based on UV and turbidity data. Manganese samples for concentrations at
different second-stage bed depths were also collected and used for manganese removal
model calibration. The objectives of these experiments were to (1) assess DBP formation
when removing some NOM prior to free chlorine addition (2) assess the impact of
second-stage contactor hydraulic loading rate (HLR) and bed depth on manganese
removal.
4.2.1 Impact of NOM removal on DBP production
The KMnO4 dose was initially set at 1.25 times the stoichiometric dose for the
experiment on 12/21-12/22/09. Figure 4-6 summarizes manganese concentrations across
65
the two-stage pilot system during these experiments. At the beginning of the experiment
when the KMnO4 dose was set at 1.25 times the stoichiometric doses (equal to 0.70 mg as
Mn/L), low concentrations of dissolved filter influent manganese (~0.02 mg/L) were
recorded, leading to almost no manganese coming out of the first-stage filter (<0.01
mg/L). This was expected since the dual media must have had a some manganese coating
developed from previous experiments.
Figure 4-6. Manganese results across pilot-scale filter system on 12/22/09
In order to generate more dissolved manganese from the first-stage filter, the
KMnO4 dose was decreased to 1.0, 0.75 and then 0.5 times the stoichiometric dose. The
results show that only at 0.5 times the stoichiometric dose (0.33 mg as Mn/L), about 0.18
mg/L of dissolved manganese entered the DM filter; since this value was equal to the
dissolved manganese in the raw water, it was believed that the KMnO4 was consumed
only through reactions with dissolved iron and NOM. However, even with the high
concentration of dissolved manganese entering the column, very low concentrations of
DM filter effluent dissolved manganese were recorded.
12/22/09 12/22/09 12/22/09 12/22/09 12/22/09
Mn
Con
cent
ratio
n (m
g/l)
0.0
0.2
0.4
0.6
0.8
1.0
Filter Influent Total Filter Effluent Total Filter Influent Dissolved
66
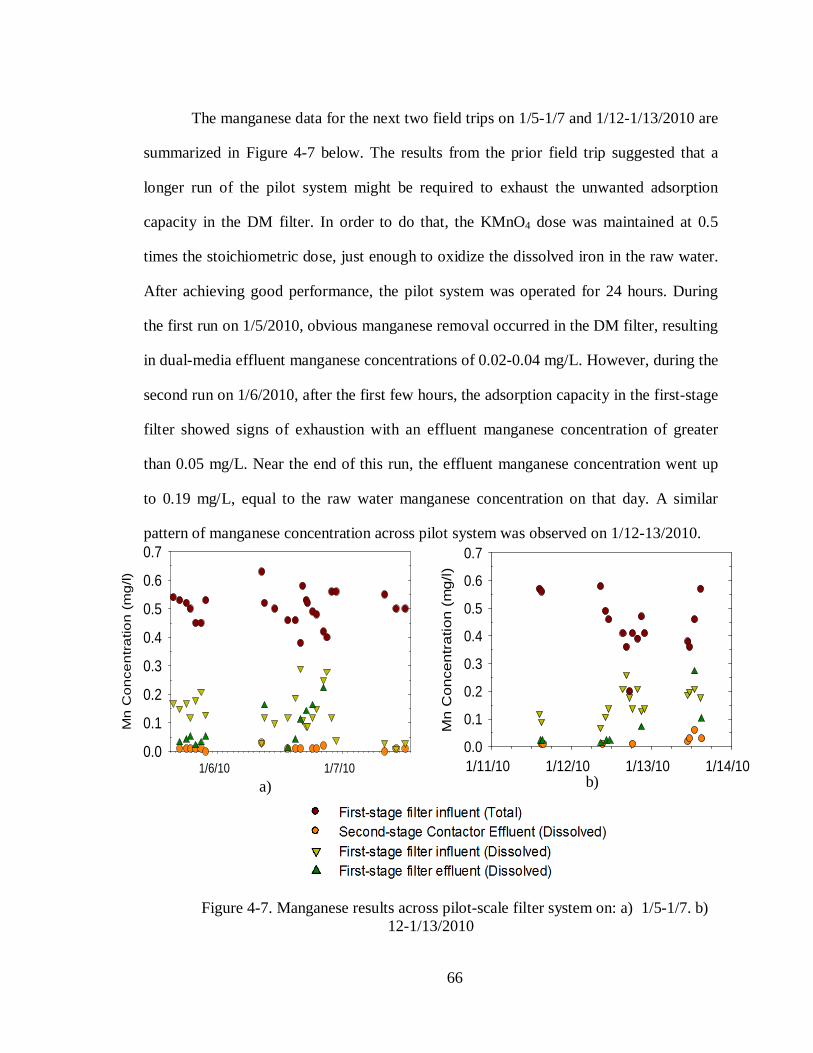
The manganese data for the next two field trips on 1/5-1/7 and 1/12-1/13/2010 are
summarized in Figure 4-7 below. The results from the prior field trip suggested that a
longer run of the pilot system might be required to exhaust the unwanted adsorption
capacity in the DM filter. In order to do that, the KMnO4 dose was maintained at 0.5
times the stoichiometric dose, just enough to oxidize the dissolved iron in the raw water.
After achieving good performance, the pilot system was operated for 24 hours. During
the first run on 1/5/2010, obvious manganese removal occurred in the DM filter, resulting
in dual-media effluent manganese concentrations of 0.02-0.04 mg/L. However, during the
second run on 1/6/2010, after the first few hours, the adsorption capacity in the first-stage
filter showed signs of exhaustion with an effluent manganese concentration of greater
than 0.05 mg/L. Near the end of this run, the effluent manganese concentration went up
to 0.19 mg/L, equal to the raw water manganese concentration on that day. A similar
pattern of manganese concentration across pilot system was observed on 1/12-13/2010.
a)
b)
Figure 4-7. Manganese results across pilot-scale filter system on: a) 1/5-1/7. b) 12-1/13/2010
1/6/10 1/7/10
Mn
Co
nce
ntr
atio
n (
mg
/l)
0.0
0.1
0.2
0.3
0.4
0.5
0.6
0.7
1/11/10 1/12/10 1/13/10 1/14/10
Mn
Con
cent
ratio
n (m
g/l)
0.0
0.1
0.2
0.3
0.4
0.5
0.6
0.7
67
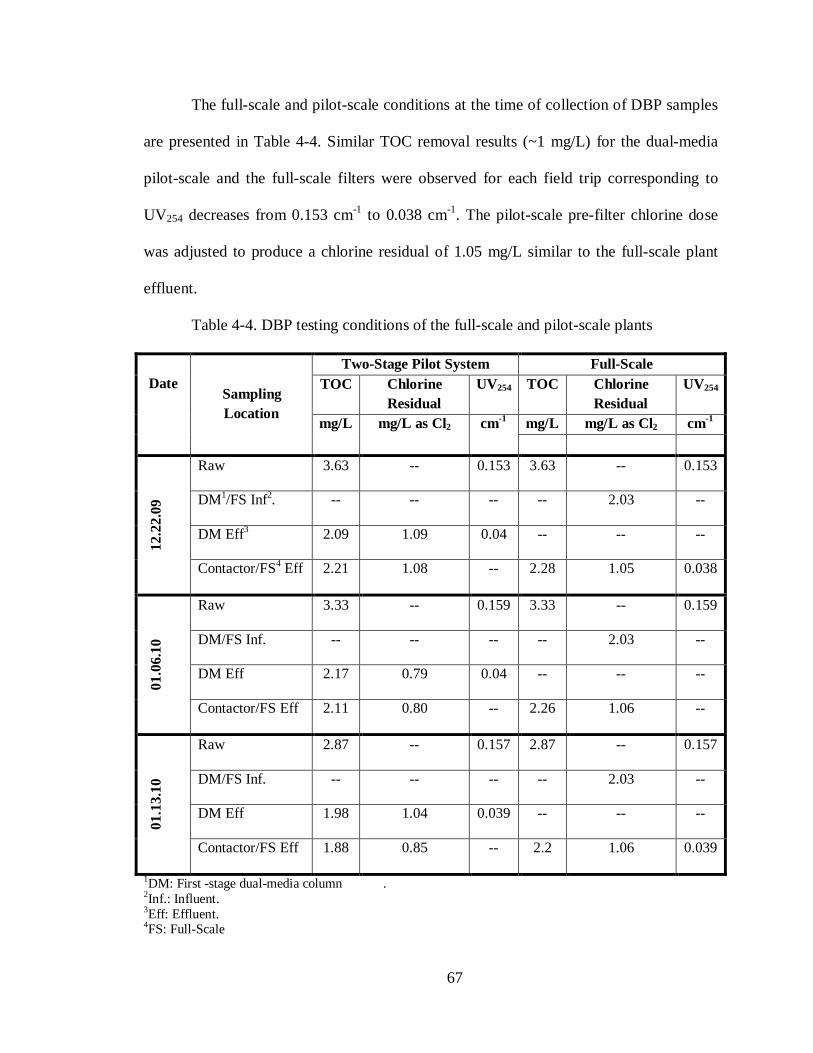
The full-scale and pilot-scale conditions at the time of collection of DBP samples
are presented in Table 4-4. Similar TOC removal results (~1 mg/L) for the dual-media
pilot-scale and the full-scale filters were observed for each field trip corresponding to
UV254 decreases from 0.153 cm-1 to 0.038 cm-1. The pilot-scale pre-filter chlorine dose
was adjusted to produce a chlorine residual of 1.05 mg/L similar to the full-scale plant
effluent.
Table 4-4. DBP testing conditions of the full-scale and pilot-scale plants
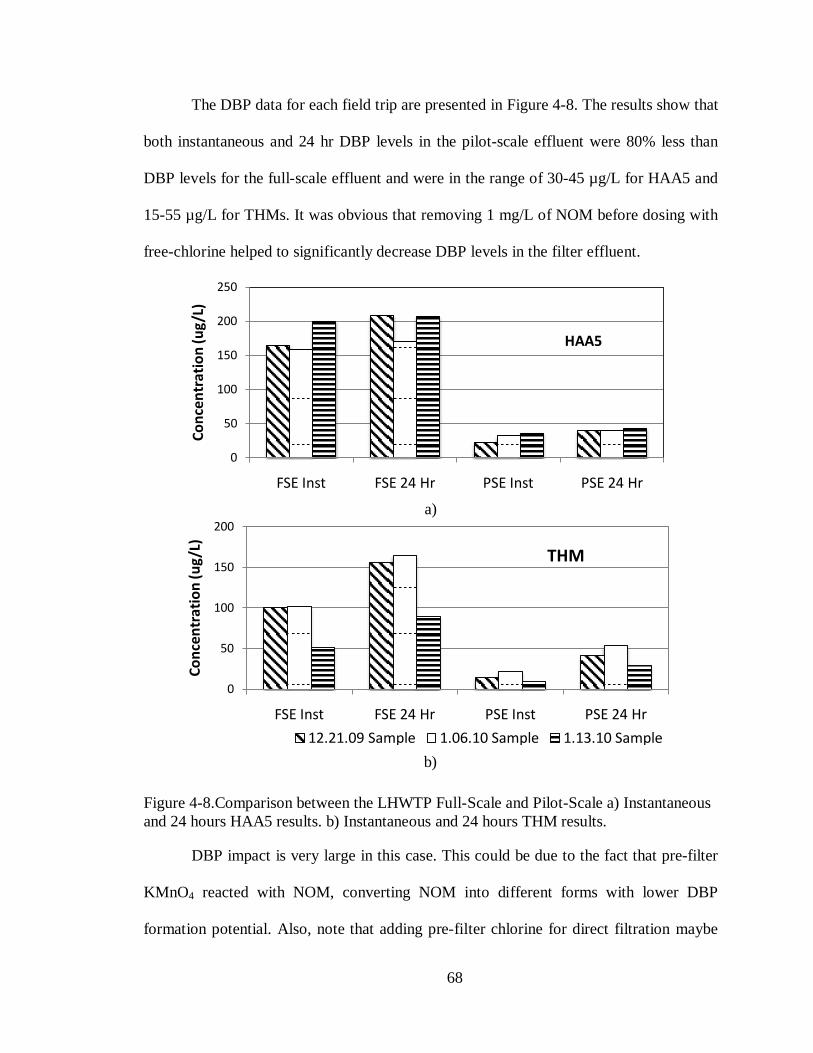
The DBP data for each field trip are presented in Figure 4-8. The results show that
both instantaneous and 24 hr DBP levels in the pilot-scale effluent were 80% less than
DBP levels for the full-scale effluent and were in the range of 30-45 µg/L for HAA5 and
15-55 µg/L for THMs. It was obvious that removing 1 mg/L of NOM before dosing with
free-chlorine helped to significantly decrease DBP levels in the filter effluent.
a)
b)
Figure 4-8.Comparison between the LHWTP Full-Scale and Pilot-Scale a) Instantaneous and 24 hours HAA5 results. b) Instantaneous and 24 hours THM results.
DBP impact is very large in this case. This could be due to the fact that pre-filter
KMnO4 reacted with NOM, converting NOM into different forms with lower DBP
formation potential. Also, note that adding pre-filter chlorine for direct filtration maybe
0
50
100
150
200
250
FSE Inst FSE 24 Hr PSE Inst PSE 24 Hr
Conc
entr
atio
n (u
g/L)
HAA5
0
50
100
150
200
FSE Inst FSE 24 Hr PSE Inst PSE 24 Hr
Conc
entr
atio
n (u
g/L) THM
12.21.09 Sample 1.06.10 Sample 1.13.10 Sample
69
the worst case for DBP impact, since beside NOM in the raw water, pre-filter chlorine
can also react with deposited NOM in the full-scale filters. In conclusion, the two-stage
filtration system is a suitable technology for the LHWTP to simultaneously control
manganese and DBPs in the finished water.
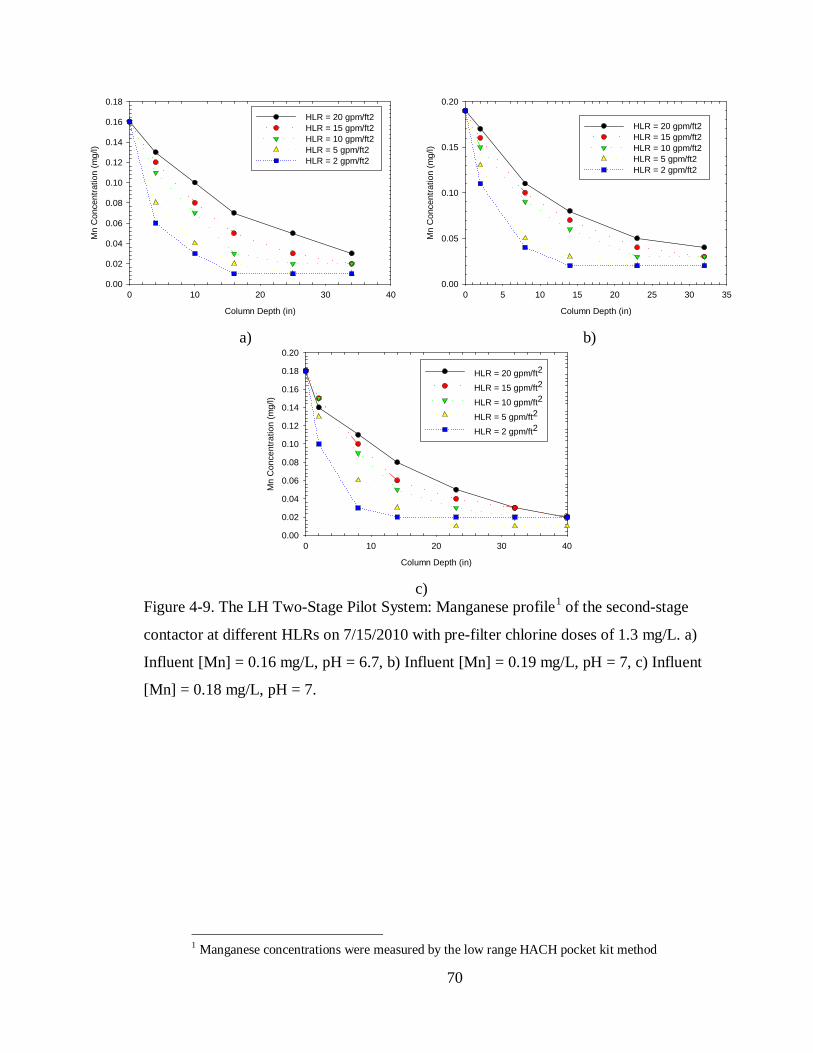
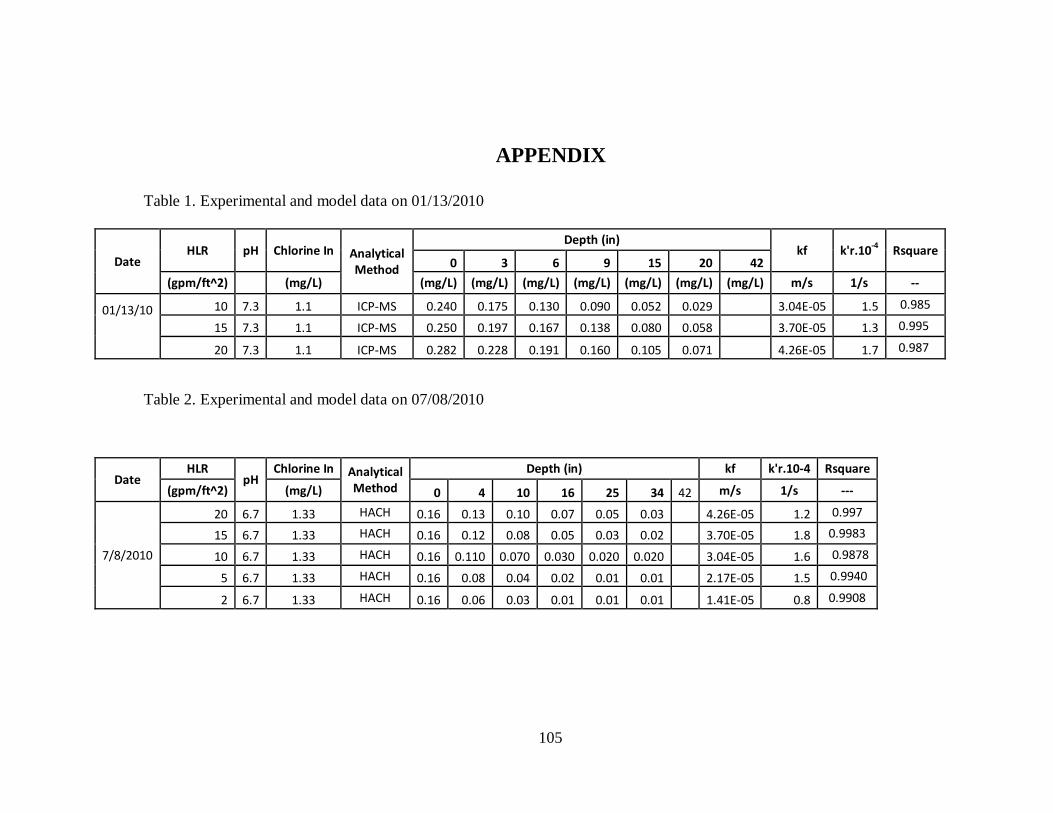
4.2.2 Impact of HLR on manganese removal
To test the manganese removal capacity of the second-stage contactor,
combinations of different HLR and influent manganese concentrations for the second-
stage contactor were tested; the results are summarized in Figure 4-9. The manganese
concentration in the second-stage contactor influent was adjusted by varying the KMnO4
dose ahead of the DM filter.
The pre-filter chlorine of 1.33 mg/L was essentially unchanged for each testing
condition. Decreasing the HLR leads to a decrease of dissolved manganese concentration
along the bed depth. At an HLR of 20 gpm/ft2, for all testing conditions, the dissolved
manganese concentration in the filter effluent reached the SMCL of 0.05 mg/L at a bed
depth of 30 inches, and decreased to as low as 0.02 at a bed depth of 40 inches. A
manganese treatment goal of 0.01 mg/L could not be achieved until the HLR was
decreased to 5 or 2 gpm/ft2 at bed depth of 25 inch and 16 inch, respectively.
In conclusion, the DBP and manganese results prove that the two-stage filtration
approach in which NOM and manganese were removed separately by different filters
with intermediate chlorine addition is an effective technology for simultaneous control of
manganese and DBPs at the LHWTP.
70
a)
b)
c)
Figure 4-9. The LH Two-Stage Pilot System: Manganese profile1
of the second-stage
contactor at different HLRs on 7/15/2010 with pre-filter chlorine doses of 1.3 mg/L. a)
Influent [Mn] = 0.16 mg/L, pH = 6.7, b) Influent [Mn] = 0.19 mg/L, pH = 7, c) Influent
[Mn] = 0.18 mg/L, pH = 7.
1 Manganese concentrations were measured by the low range HACH pocket kit method
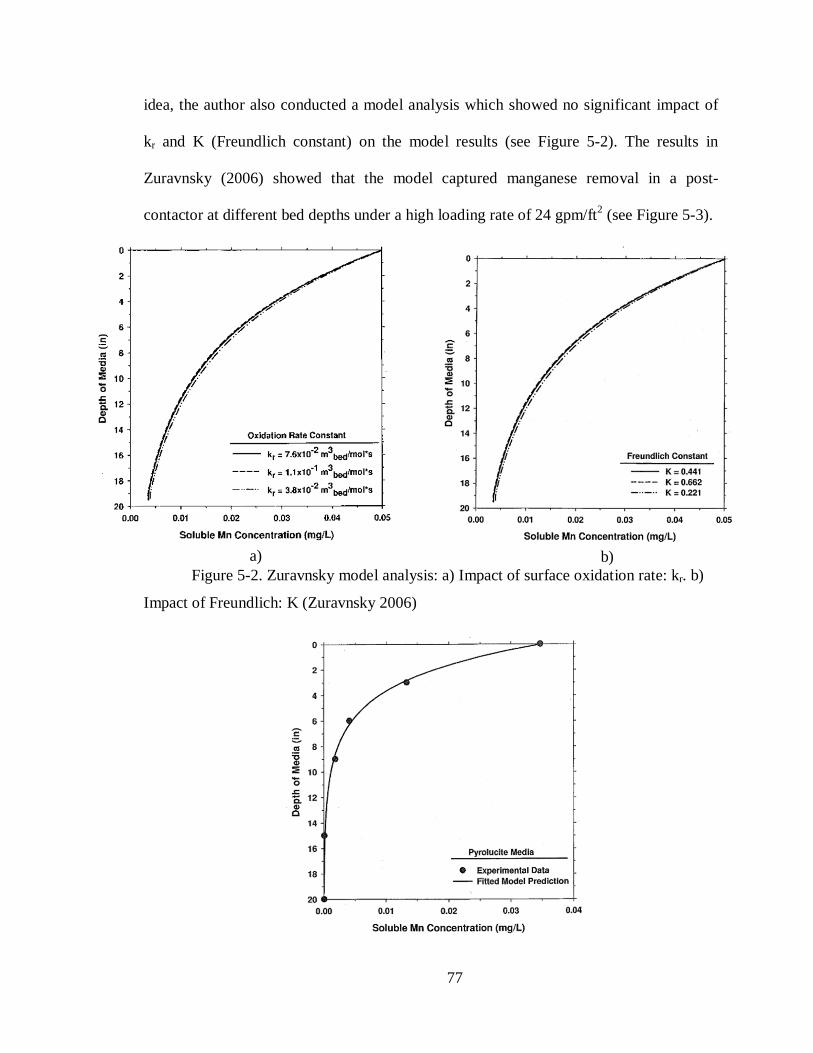
Because of its simplicity and effectiveness under high flow rates, the model
developed by Zuravnsky (2006) was chosen to simulate manganese adsorption and
oxidation for the second-stage contactor at the LHWTP as part of the contactor design for
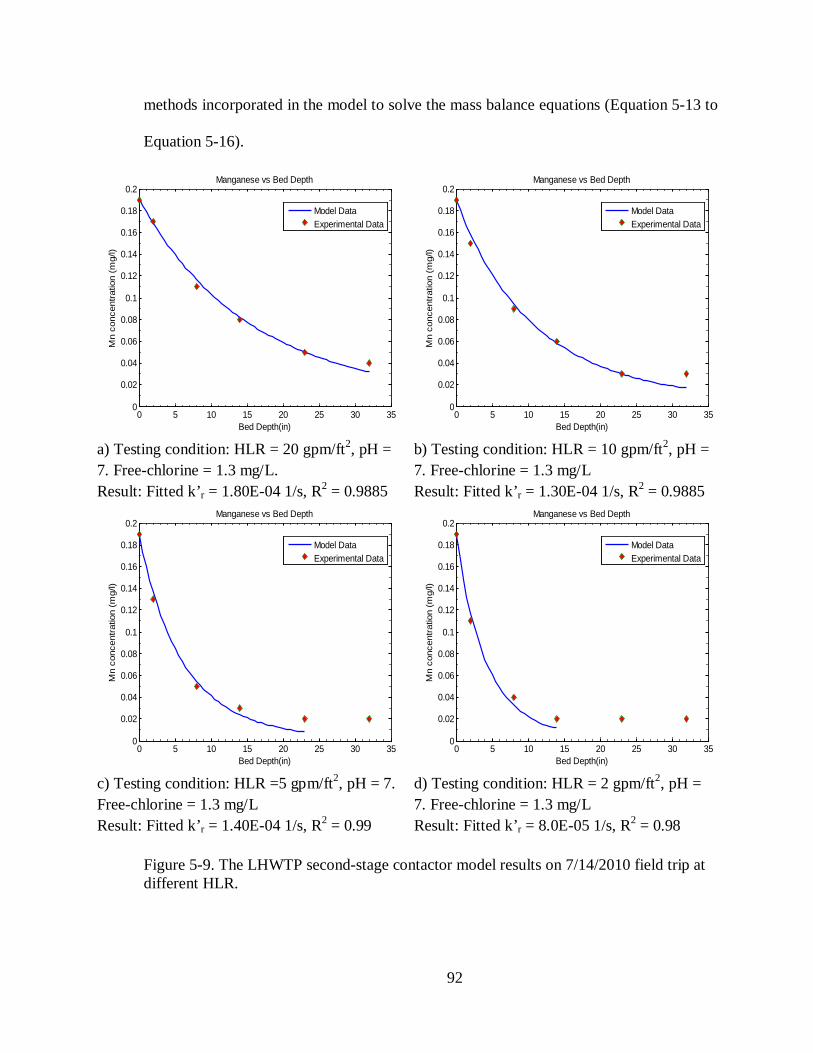
the AWC. Upon analyzing the Matlab code for the model received from Virginia Tech,
errors in the Zuravnsky (2006) model were found. Modifications from the Zuravnsky
(2006) model to fix these errors as well as a sensitivity analysis are presented in this
section.
5.2.1 Modifications from Zuravnsky Model
5.2.1.1 Model Fitting
A complete analysis of the Zuravnsky model was conducted. The results are
consistent with the Zuravnsky (2006) analysis except for impacts of the oxidation rate
(kr) and Freundlich constant (K) (see Figure 5-4). Compared to the Zuravnsky (2006)
results (Figure 5-2), Figure 5-4 shows that kr and K do have significant impacts on model
output.
According to Zuravnsky (2006), one of the reasons for using kf as a fitting
parameter rather than kr was that the kr value, taken from Merkle et al. (1997), should be
constant and unchanged under all testing conditions. While this notion is correct for the
79
data in Merkle et al. (1997), it is not generally correct. In Merkle’s model, the internal
transport of adsorbed Mn2+ was taken into account and represented by the AFR
parameter. To determine kr, Merkle et al. (1997) first simultaneously fitted AFR and kr.
The best-fit kr was used to simulate the remaining data with AFR being fitted. Because of
this fitting practice, the kr value from the Merkle et al. (1997) model should have not
been used in the Zuravnsky (2006) model which didn’t include the impact of the internal
transport phenomenon. Put in another way, compared to the kr value in Merkle’s model,
the kr parameter in Zuravnsky (2006) does not represent the oxidation rate but rather is a
lumped parameter which represents the impact of both oxidation and internal transport
processes.
In addition, the value of the external mass transfer coefficient (kf) can be
calculated from first principles and should not be a function of water quality or media
type. In the Merkle et al. (1997) model, a simplified form of Gnielinski’s correlation was
used to calculate kf.
Sh = (2 + 0.644R1/2Sc1/3)[1+1.5(1-𝜀)] Equation (5-17)
Where:
Sh: Sherwood number. Sh = kf.d/Dff
R: Reynolds number. R = u.d/𝜐
d: hydraulic diameter (m).
Sc: Schmidt number. Sc= 𝜐/Dff
𝜐 : Kinematic viscosity (m2/s)
Dff: molecular diffusion coefficient (m2/s)
80
Based on this discussion, kr should be used as a fitting parameter in the model
rather than kf which can be calculated by a generalized correlation such as Gnielinski. A
calibration algorithm, using the least-squares method and kr as a fitting parameter, was
integrated into the Zuravnsky (2006) code.
a)
b)
Figure 5-4. Zuravnsky model sensitivity analysis: a) Impact of Freundlich constant (K)
on model output. b) Impact of oxidation rate constant (kr) on model output. (Other model
parameters were kept the same as in the Zuravnsky (2006) sensitivity analysis)
81
5.2.1.2 Role of Free Chlorine in the Model
In the Zuravnsky (2006) model, the oxidation of adsorbed manganese by free
chlorine was assumed to be a second-order reaction as follows:
𝑟 = −𝑘𝑟𝜀𝐶1𝑠𝑎𝐶2𝑏 Equation (5-18)
Pilot-scale post-contactor data collected at the NNWTP by Virginia Tech
researchers was used to test the simulating ability of the modified model which used kr as
the fitting parameter. Testing conditions at the NNWTP are presented in Table 5-1.
Table 5-1. The NNWTP post-contactor testing conditions (Subramaniam 2010)
HLR pH Total Cl2 HOCl
gpm/ft2 -- (mol/m3) (mol/m3)
16 6.5 0.0210 0.0188
16 7.5 0.0248 0.0115
20 6.5 0.0229 0.0205
20 7.5 0.0229 0.0106
24 6.5 0.0248 0.0222
24 7.5 0.0248 0.0115
24 6.5 0.0972 0.0871
24 7.5 0.0991 0.0459
Figure 5-5 shows fitted kr values as a function of HOCl concentration based on
manganese data collected at the NNWTP. It should be noted that the model also
accounted for changes in manganese adsorption capacity at different pH by selecting
appropriate Freundlich constants obtained from manganese uptake experiments (see
Section 5.2.3). Overall, the fitted kr decreases with the increasing HOCl concentration
and varies in a relatively wide range from 0.05x10⁻⁴ m3bed/mol.s to 4.5x10⁻⁴ m3bed/mol.s.
82
For example, at pH = 7.5, a four-fold increase of influent HOCl concentration results in a
decrease of fitted kr by factor of five. These results suggest that the model does not
capture all of the manganese transport processes or their dependence on water quality and
testing conditions, or both, leading to different fitted kr values which in theory should be
constant.
Figure 5-5. Model results for the NNWTP pilot-scale data: fitted kr vs. influent HOCl at
different pH.
Figure 5-6. Chlorine residual concentrations in the pilot-scale contactor influent and
effluent at the LHWTP and NNWTP pilot plant.
0.00
1.00
2.00
3.00
4.00
5.00
6.00
NNWTP NNWTP NNWTP NNWTP LHWTP LHWTP LHWTP LHWTP
Chlo
rine
Resi
dual
(mg/
L)
Influent Effluent
83
Moreover, during experiments at both LHWTP and NNWTP, chlorine residuals
were relatively constant along the post-contactors (see Figure 5-6). The results suggest
that free-chlorine concentrations were much higher than free chlorine demand for surface
oxidation on the pyrolucite media; thus, the surface oxidation rate possibly did not
depend on free chlorine concentration in these cases or only require that a minimum level
of chlorine be present. Based on this discussion, free chlorine concentration was removed
from Equation 5-18, making the surface oxidation a “pseudo” first-order reaction as
described below:
𝑟 = −𝑘𝑟′ 𝜀𝐶1𝑠𝑎 Equation (5-18) Where: k’
r: surface oxidation rate constant, s-1.
a)
b)
Figure 5-7. Model results for the NNWTP pilot-scale data: a) Fitted k’r vs. influent HOCl
at different pH (Subramaniam 2010); b) Fitted k’r vs. HLR.
As shown in Figure 5-7a, by removing the HOCl concentration from the surface
reaction, for all testing conditions, the fitted values of kr’ vary in a relatively narrow
range of 2.9x10⁻⁴ s-1 to 5.5x10⁻⁴ s-1 compared to the kr range of 0.05x10⁻⁴ m3bed/mol.s to
4.5x10⁻⁴ m3bed/mol.s. Figure 5-7b shows a plot of k’r vs HLR. The results suggest a
possible dependence of k’r on HLR; an increase in HLR leads to an increase in k’
r. In
principle, k’r should not depend on HLR, the impact of HLR on k’
r is likely due to a
0
1
2
3
4
5
6
0 0.05 0.1 0.15
k'rx
10-4
(1/s
)
[HOCl] (mol/m3)
pH = 6.5 pH=7.50
1
2
3
4
5
6
0 10 20 30
k'rx
10-4
(1/s
)
HLR (gpm/ft2)
pH = 6.5 pH=7.5
84
relationship between kf, which depends highly on HLR, and k’r. To avoid confusion later,
the modified Zuravnsky (2006)model is called UM-model and used to simulate the
performance of the second-stage contactor at the LHWTP
In conclusion, modifications in the UM-model compared to the Zuravnsky (2006)
model are listed below:
1. The modified oxidation rate (k’r) is used as a fitting parameter instead of the mass
transfer coefficient (kf).
2. An algorithm to calibrate the model based on least-square method was
incorporated.
3. The free chlorine concentration was removed from the surface reaction equation.
5.2.2 UM-model Values:
As in Zuravnsky model, parameters used in UM-model can be classified into
three groups: (1) initial values, (2) test conditions, and (3) calculated values. Most of data
presented in Table 5-2 was taken from the Zuravnsky (2006) model since the LH second-
stage contactor has the same design and pyrolucite media (8x10 mesh size).
In the UM-model, kf was calculated using the Ohashi correlation which was
claimed to be valid for Reynolds (Re) in the ranges of 5.8 to 500 (Roberts et al. 1985).
+≈≈ 3
12
121.12 ScR
Ddk
Shff
pf (Equation 5-19)
Where: Sh = Sherwood number kf = liquid to solid mass transfer coefficient (m/s) dp = particle diameter (m) Dff= bulk liquid diffusivity (m2/s) = 1x10⁻⁹ m2/s @ 10°C Re = Reynolds number. Re = udp/υ) Sc = Schmidt number. Sc = υ/Dff υ = kinematic viscosity = 1.0006x10⁻⁶ m2/s @ 10°C
85
Table 5-2. Summary of model parameters used in the sensitivity analysis of UM-model.
Type Model Parameter Symbol used in model Value Unit Source/Comment
Initi
al v
alue
s Porosity 𝜀 0.52 m3 water/ m3 bed Zuravnsky (2006) Bulk density Ro 1992 kg media/ m3 bed Zuravnsky (2006) Media diameter dp 2.20E-03 m Zuravnsky (2006) Kinematic viscosity kvisc 1.00E-06 m2/s Value at 10oC HOCl acidity constant kconst 2.51E-08 -- Benjamin (2010) Diffusion coefficient Dff 1.00E-09 m2/s Zuravnsky (2006)
Freundlich isotherm constants K 0.88 [(mol/kg)/(mol/m3)] (1/n) Value at pH =7.5 –(Subramaniam 2010) nn 1/1.19 --
Tes
ting
Con
ditio
n Total bed depth L 20 inch Hyraulic loading rate HLR 10 gpm/ft
Initial manganese concentration C10 0.28 mg/L pH pH 7.5 --- Contactor column diameter dia 0.075 m
Free chlorine in C2 1.33 mg/L as Cl2
Cal
cula
ted
valu
es Specific surface area Av 7260 m2 media /m3 media Av = 6x(dp)-1.16 - Zuravnsky (2006)
Mass transfer coefficient kf 3.08E-5 m/s Ohashi relationship Axial dispersion coeffcient DL 2.17E-04 m2/s DL= u(m/s)/1.2/100 - Merkel et.al, 1997 Pore Velocity U 0.0131 m/s u= Q/A/𝜀
86
Subramaniam (2010) estimated the Freundlich constants based on manganese
uptake capacity experiments for pyrolucite media used in the NN pilot-plant. The full-
scale combined influent from the NN water treatment plant was used in these
experiments. The NN pyrolucite media had been used for several months and one might
expect a considerable amount of MnOx deposits on media surface. To model the LHWTP
pilot-plant data, the Freundlich constants were interpolated from the NN results, as shown
in Table 5-3.
Table 5-3. Freundlich isotherm constants for “used” pyrolucite media from NN pilot-
plant (Subramaniam (2010))
pH
Temperature
ranges K (mg Mn/g media)
1/n
oC [(mol/kg)/(mol/m3)] (1/n
6.5 20-25 0.72 1.20
7.5 20-25 0.88 1.19
5.3 Sensitivity Analysis Using the UM-Model:
A sensitivity analysis was conducted to investigate the impacts of each model
parameter on the model results. Each model parameter chosen in this analysis was
increased and decreased from the baseline value presented in Table 5-2. A column depth
of 20 inches was used.
Figure 5-8a show the dependence of the model results on specific surface area
(Av) of filter media. Doubling the value of Av can result in a 0.015 mg/L decrease in the
model effluent manganese. The independence of model output on DL, presented in Figure
87
5-8b is expected since at the high HLR, the flow pattern in the second-stage media
contactor is similar to plug-flow with relatively low amount of dispersion.
The impact of adsorption capacity on the NGE process is characterized through
the Freundlich constants (K, n) (see Figure 5-8c and Figure 5-8d). For the Freundlich
constant K, by doubling its baseline value (K = 0.88), the model effluent manganese
concentration decreases from 0.03 mg/L to 0.015 mg/L. The impact of the Freundlich
constant n is even more significant. At the value of 1/2.28, the model results show no
manganese removal across the bed depth, i.e., the influent manganese concentration is
equal to effluent manganese in this case due to very slow adsorption rate. The impact of
the advection process on manganese removal is shown through the HLR in Figure 5-8e.
An increase of HLR from 10 gpm/ft2 to 20 gpm/ft2 leads to an increase in the model
effluent manganese from 0.03 mg/L to 0.08 mg/L.
a)
Figure 5-8a. Impact of specific area: Av
88
Figure 5-8b.Impact of DL on model output.
Figure 5-8c.Impact of Freundlich constants: n.
89
Figure 5-8d.Impact of Freundlich constants: K.
Figure 5-8e. Impact of HLR
90
Figure 5-8f. . f) Impact of mass transfer coefficient: kf.
Figure 5-8g. Impact of surface oxidation rate: kr.
Figure 5-8. UM- model sensitivity analysis
The dependence of model results on k’r and kf show the important roles of the
surface oxidation and mass transfer through film diffusion on manganese removal,
Column Depth (in)
0 5 10 15 20
Mn
Con
cent
ratio
n (m
g/l)
0.00
0.05
0.10
0.15
0.20
0.25
0.30
kr = 1.7 E-04kr = 3.4 E-04kr = 0.85 E-04
91
respectively ( see Figure 5-8f and Figure 5-8g). These two processes have an interrelated
relationship in which the slower process controls the rate of manganese removal. This
notion is proven in Figure 5-8f where the value of kf was increased. The results show that
the model manganese profiles at kf of 1.21x10⁻⁴ m/s and 7.29x10⁻⁴ m/s approximately
overlap each other. It is understood that at kf values of 1.00x10⁻⁴ or greater, surface
oxidation controls the rate of the NGE process.
5.4 MODEL RESULTS FOR THE LHWTP SECOND-STAGE PILOT SYSTEM
Profiles of manganese concentration across the depth of the second-stage
contactor were collected during LHWTP pilot experiments on 1/13/2010, 7/8/2010,
7/14/2010 and 7/15/2010. The HLR of the second-stage contactor was varied between 2,
5, 10, 15 and 20 gpm/ft2, and pH of the second-stage contactor was in the range of 6.7-
7.3. The objectives of these experiments were to: (1) assess the accuracy of the UM-
model at different testing conditions, and (2) determine the best k’r value to use for the
LHWTP field conditions.
Field data and the UM-model results for the LH second-stage contactor
manganese profiles at four different HLRs on 7/14/2010 are shown in Figure 5-9. A
summary of model results for the 7/14/2010 pilot experiments is shown in Figure 5-10.
Overall, the UM-model simulated the manganese versus depth profile well at different
HLR with R2 values in the range of 0.98-0.99. However, the model could not produce
best fit k’r values at HLR of 5 and 2 gpm/ft2 when the manganese concentration at bed
depth of 23 inch and 32 inch was included. This could be due to the mathematical
92
methods incorporated in the model to solve the mass balance equations (Equation 5-13 to
Removal by Oxide-Coated Filter Media. Journal of Environmental Engineering, 119(4), 679-694.
David Reckhow, 2006. Analysis of Haloacetic Acids. Lab Manual. University of
Massachusetts, Amherst. Gabelich, C.J. et al., 2006. Sequential manganese desorption and sequestration in
anthracite coal and silica sand filter media. Journal of American Water Works Association, 98(5), 116-127+12.
Griffin, A., 1960. Significance and Removal of Manganese in Water Supplies. Journal of
American Water Works Association, (52), 1326-1334. Hargette, A.C. & Knocke, W.R., 2001. Assessment of Fate of Manganese in Oxide-
Coated Filtration Systems. Journal of Environmental Engineering, 127(12), 1132-1138.
Islam, A.A., 2010. Manganese Removal By Media Filtration: Release and Complexation.
Unpublished PhD Dissertation. University of Massachusetts, Amherst. Jodellah, A. & Weber Jr., W., 1985. Controlling trihalomethane formation potential by
chemical treatment and adsorption. Journal / American Water Works Association, 77(10), 95-100.
Knocke, W. et al., 2010. Adsorptive contactors for removal of soluble manganese during
drinking water treatment. Journal American Water Works Association, 64. Knocke, W.R., 1990. Alternative Oxidants for the Removal of Soluble Iron and
Manganese, American Water Works Association. Knocke, W.R., Hamon, J.R. & Thompson, C.P., 1988. Soluble manganese removal on
oxide-coated filter media. Journal American Water Works Association, 80(12), 65-70.
Knocke, W.R., Occiano, S.C. & Hungate, R., 1991. Removal of soluble manganese by
oxide-coated filter media. Sorption rate and removal mechanism issues. Journal / American Water Works Association, 83(8), 64-69.
103
Kohl, P.M. & Medlar, S.J., 2006. Occurrence of Manganese in Drinking Water and Manganese Control, AWWA Reasearch Foundation.
and ozone for drinking water treatment. Ozone: Science and Engineering, 21(5), 465-476.
Merkle, P.B. et al., 1997. Dynamic Model for Soluble Mn[2+] Removal by Oxide-Coated
Filter Media. Journal of Environmental Engineering, 123(7), 650-658. Morgan, J.J. & Stumm, W., 1964. Colloid-chemical properties of manganese dioxide.
Journal of Colloid Science, 19(4), 347-359. Morris, R.D. et al., 1992. Chlorination, chlorination by-products, and cancer: a meta-
analysis. American Journal of Public Health, 82(7), 955-963. Reckhow, D.A. & Singer, P.C., 1986. Mechanisms Of Organic Halide Formation During
Fulvic Acid Chlorination And Implications With Respect To Preozonation. In Water Chlorination: Chemistry, Environmental Impact and Health Effects, Proceedings of the Fifth Conference. Water Chlorination: Environmental Impact and Health Effects. Williamsburg, VA, USA: Lewis Publ Inc, pp. 1229-1257.
Roberts, P.V., Cornel, P. & Summers, R.S., 1985. External Mass-Transfer Rate in Fixed-
Bed Adsorption. Journal of Environmental Engineering, 111(6), 891-905. Russell, J., 2008. Control of Manganese, Iron, and Disinfection By-Products for the
Mystic Connecticut Water System. Unpublished MS report. University of Massachusetts ,Amherst.
Sly, L.I., Hodgkinson, M.C. & Arunpairojana, V., 1990. Deposition of manganese in a
drinking water distribution system. Applied and Environmental Microbiology, 56(3), 628-639.
Subramaniam, A., 2010. A Pilot-scale Evaluation of Soluble Manganese Removal Using
Pyrolucite Media in a High-Rate Adsorptive Contactor. Unpublished MS report. Virginia Tech University.
Tobiason, J. et al., 2008. Characterization and Performance of Filter Media for
Manganese Control. American Water Works Association Research Foundation. U.S. Environmental Protection Agency, 2004. Drinking Water Health Advisory for
Manganese, US EPA, 2006. Federal Register. US EPA, 2001. Stage 1 Disinfectants and Disinfection Byproducts Rule: A Quick
104
Reference Guide. Xie, Y.F., 2004. Disinfection byproducts in drinking water: formation, analysis, and
control, CRC Press. Zuravnsky, L., 2006. Development of Soluble Manganese Sorptive Contactors for
Enhancing Potable Water Treatment Practices. Unpublished MS report. Virginia Tech University.
105
APPENDIX
Table 1. Experimental and model data on 01/13/2010