Two-Stage Models: Identifying Non-Compensatory Heuristics for the Consideration Set then Adaptive Polyhedral Methods Within the Consideration Set Steven Gaskin, Theodoros Evgeniou, Daniel Bailiff, John Hauser Applied Marketing Science, Inc. (AMS), INSEAD, AMS, MIT 1. Introduction In most product categories, consumers simplify their choices by forming a “consideration set” of products (or services) that they will seriously evaluate before making a final choice (Hauser and Wernerfelt 1990, Roberts and Lattin 1991). There is evidence that simply knowing which products are in the consideration set can explain 80% of the uncertainty that could be ex- plained with a logit-based model (Hauser 1978). This two-stage process is well-established in the academic literature as a realistic description of the process by which consumers make decisions (Payne 1976). Indeed there has been recent interest in analytic models in which the consideration stage is unobserved, but inferred from final choices (Gilbride and Allenby 2004, Jedidi and Kohli 2005). The consideration set is often motivated by recognizing that it is optimal for consumers to balance search costs (evaluating all products) with opportunity costs (evaluating only those products most likely to be chosen). Because the products identified in the first stage (considera- tion) will be evaluated again in the second stage (choice), it is not unreasonable that consumers use heuristic processes in the consideration stage (possibly in the choice stage, too) that focus on a relatively few important features and do so in a simple (“first cut”) non-compensatory manner (Payne, Bettman and Johnson 1988, Gigerenzer and Goldstein 1996). This is particularly true when there are a large number of alternatives in the first-stage consideration decision (Payne, Bettman and Johnson 1993). There is evidence that such heuristics might be more efficient and lead to better selections than more-complex heuristics, particularly in situations that similar to those that consumers face in real markets (Gigerenzer, Hoffrage and Kleinbölting 1991). In this paper, we explore a two-stage consider-then-choose model that is grounded in this theoretical and empirical literature and attempts to mirror the purchasing process more naturally than the one-stage compensatory choice-only models typically used. In particular, rather than going straight to a choice-based conjoint (CBC) design we first ask respondents to indicate which profiles they would consider. We use these data to infer the heuristics that best explain
Transcript
Two-Stage Models: Identifying Non-Compensatory Heuristics for the Consideration Set then Adaptive Polyhedral Methods Within the Consideration Set
Steven Gaskin, Theodoros Evgeniou, Daniel Bailiff, John Hauser Applied Marketing Science, Inc. (AMS), INSEAD, AMS, MIT
1. Introduction
In most product categories, consumers simplify their choices by forming a “consideration
set” of products (or services) that they will seriously evaluate before making a final choice
(Hauser and Wernerfelt 1990, Roberts and Lattin 1991). There is evidence that simply knowing
which products are in the consideration set can explain 80% of the uncertainty that could be ex-
plained with a logit-based model (Hauser 1978). This two-stage process is well-established in the
academic literature as a realistic description of the process by which consumers make decisions
(Payne 1976). Indeed there has been recent interest in analytic models in which the consideration
stage is unobserved, but inferred from final choices (Gilbride and Allenby 2004, Jedidi and Kohli
2005).
The consideration set is often motivated by recognizing that it is optimal for consumers to
balance search costs (evaluating all products) with opportunity costs (evaluating only those
products most likely to be chosen). Because the products identified in the first stage (considera-
tion) will be evaluated again in the second stage (choice), it is not unreasonable that consumers
use heuristic processes in the consideration stage (possibly in the choice stage, too) that focus on
a relatively few important features and do so in a simple (“first cut”) non-compensatory manner
(Payne, Bettman and Johnson 1988, Gigerenzer and Goldstein 1996). This is particularly true
when there are a large number of alternatives in the first-stage consideration decision (Payne,
Bettman and Johnson 1993). There is evidence that such heuristics might be more efficient and
lead to better selections than more-complex heuristics, particularly in situations that similar to
those that consumers face in real markets (Gigerenzer, Hoffrage and Kleinbölting 1991).
In this paper, we explore a two-stage consider-then-choose model that is grounded in this
theoretical and empirical literature and attempts to mirror the purchasing process more naturally
than the one-stage compensatory choice-only models typically used. In particular, rather than
going straight to a choice-based conjoint (CBC) design we first ask respondents to indicate
which profiles they would consider. We use these data to infer the heuristics that best explain
Two-Stage Models of Consideration then Choice Gaskin, Evgeniou, Bailiff and Hauser
each respondent’s consideration decision. Based on these heuristics, we identify the set of fea-
tures that each respondent is likely to use for choosing from within the consideration set in the
second stage. We then generate an adaptive choice-based design to estimate the second-stage
(compensatory) decision process.
We test the proposed two-stage model with new data on consumer consideration and
choices of Global Positioning Systems (GPS), testing the proposed model against a traditional
CBC design in which we use hierarchal Bayes methods to estimate partworths (HB/CBC).
We posit that the two-stage model will more accurately reflect consumer decision making
and, hence, be more accurate. Moreover, because the first-stage consideration task is quick and
easy for the respondent, we hope to be able to collect data more efficiently. We seek to make that
data collection even more efficient with a display tool that enables us to present a large number
of potential features from which the respondent can choose to use in the first stage of his or her
consider-then-choose decision process.
2. Illustrative Examples of Managerial Relevance Automobiles. Separating the steps of consideration and choice can provide important in-
sights. Take, for example, automobiles. A consumer shopping for a new vehicle has a choice of
hundreds of makes and models from which to choose. Because it is time-consuming and expen-
sive to seriously evaluate every make-model combination (not to mention combinations of fea-
tures within a make-model offering), the average consumer evaluates in detail far fewer
make-models than the 300+ on the market – well under ten make-model combinations for the
typical consumer. From a manufacturer’s standpoint, an automobile cannot be sold unless it is
considered. The value to the manufacturer of getting its make-model considered is tremendous,
not unlike reducing its odds of selling from worse than 1-in-300 to better than 1-in-10. If we can
identify the features by which the consumers screen automobiles for their consideration sets, the
manufacturer can assure that those features are available and prominent in any marketing com-
munications.
Global Position Systems (GPSs). GPSs have long been used in navigation, but in the
last five years they have become popular for the use in automobiles and, when handheld, in out-
door activities. However, they can be complex with many features such as accuracy, reception,
weight, display resolution, etc. Furthermore, because of their relative novelty consumers are still
becoming familiar with the meaning of these features for their own use of GPSs. For example,
2
Two-Stage Models of Consideration then Choice Gaskin, Evgeniou, Bailiff and Hauser
the REI web site provides a virtual advisor to help consumers select a GPS (Figure 1,
http://www.rei.com/rei/gearshop/advisor/gps.html). It allows the user to shop by price, or by
projected use (in an automobile, for fitness training, in the outdoors). By the use of filtering
questions, such as, “Do you want a GPS Unit with a Quadrifilar Helix Antenna which may pro-
vide better reception in densely covered areas?,” the virtual advisor narrows down the choices to
a small set of acceptable options which the consumer can examine in more detail.
Figure 1 GPS Finder Web Page at REI.com
Table 1 summarizes sixteen important features of GPSs that were determined from quali-
tative research and pretests. The features can be represented by images and icons to provide vis-
ual cues which enable respondents to quickly evaluate profiles within a choice set (illustrated in
subsequent figures in the paper).
To illustrate the difficulty of the consumer’s decision process, consider Figure 2 which
shows 32 such profiles – fewer than are available on the market. It would be unlikely that a con-
sumer would use a compensatory process to choose a profile from the set of 32 profiles. More
likely the consumer will simplify the decision process.
Two-Stage Models of Consideration then Choice Gaskin, Evgeniou, Bailiff and Hauser
Table 1 Important Features for Handheld GPSs
Features 1 – 8* Features 9 – 16*
Level 1 Level 2 Level 1 Level 2
Color screen Monochrome screen Average reception Reception under trees
Large screen Small screen Accuracy to within 50 ft. Accuracy to a few feet
Garmin brand Magellan brand Track log No track log
4 oz. weight 7 oz. weight Mini-USB port No port
normal display Extra bright display Floats on water Does not float
High display resolution Low display resolution Large size GPS Small size GPS
2 sec. acquisition time 10 sec. acquisition time Backlit keyboard Normal keyboard
30 hr. battery life 12 hr. battery life Price increment ($150)** No price increment
*For many of these features, either level can be preferred by the respondent.
**The price that is shown to respondent is based on price increment and the cost of features rounded to one of four levels ($249 to $399). The rounding rule is chosen to approximate level balance.
Figure 2 Illustrative Choice From Among 32 Profiles
4
Two-Stage Models of Consideration then Choice Gaskin, Evgeniou, Bailiff and Hauser
Moreover, a one-stage compensatory model may lead to choices than may never have
happened under a two-stage decision process with a non-compensatory consideration (first) stage.
For example consider the two profiles in Figure 3 and suppose that the six features listed are the
only features that matter to the respondent. (This alone is a simplifying heuristic.) But even with
six features a partworth-based compensatory choice process might not capture a screening rule.
For example, if the partworths are as shown, the respondent would choose the right-hand profile
– its “utility” equals 30 “utils” compared to 26 “utils” for the left-hand profile. However, if,
when faced with a large choice set, the respondent screens for a small handheld GPS with a color
display, he or she will consider the left-hand profile and never even consider the right-hand pro-
file. With such a screening rule, the respondent will never even evaluate the other features. If this
were the true process that the respondent used when screening a GPS for final evaluation, the
one-stage compensatory model would predict the wrong profile as chosen. When this is the case,
we expect that knowing the process and the screening features is important to managerial deci-
sions. If we were to assume a compensatory process or if we were to simply give the respondent
a choice-based task in which there were never a large number of profiles, we would estimate the
wrong model and make the wrong managerial decisions.
Figure 3 Comparing Two GPS Products – Compensatory Partworths
5
Two-Stage Models of Consideration then Choice Gaskin, Evgeniou, Bailiff and Hauser
3. Measurement Challenges Figures 2 and 3 illustrate that if we are to identify the true underlying process we must
design our measurement carefully. If the task does not have high fidelity with the environment
faced by the consumer, then we may not capture the true process. In this paper we illustrate one
attempt to mimic the environment faced by the consumer. We believe it is innovative and worth
testing, but we do not claim that it is yet the best task we can develop. Our more-modest goals
are to improve upon the standard choice-based task. If the task and analysis we test outperforms
the current “gold standard,” hierarchical Bayes (one-stage) choice-based conjoint analysis
(HB/CBC), then we will know we are on the right path, or at least on one of the right paths.
Consideration task. Our first goal is to represent the consideration task. One potential
display format is to have a large number of profiles on the screen, as in Figure 2, but this is likely
too difficult for the web-based respondent. Thirty-two profiles with sixteen features leads to im-
ages and icons that are too small for the computer displays we expect for most web-based re-
spondents. As a compromise, we used eight profiles per screen and presented the thirty-two pro-
files in four sets. Figure 4 illustrates the consideration task. Respondents found this task natural
and felt that it reflected the way they would select GPSs in a real market environment.
Figure 4 Consideration Task with Eight Profiles per Screen
6
Two-Stage Models of Consideration then Choice Gaskin, Evgeniou, Bailiff and Hauser
Even with this display we were concerned that the respondents might use the more-visual
features, such as the size of the GPS, more often than those features that were represented simply
by icons. (This would not affect internal validity testing, such as holdout tests or even validation
tasks, because the same images would be used in both the estimation and validation tasks. How-
ever, a focus on visual features might affect external validity. At present this is an hypothesis to
be tested.)
We also wanted a task that would scale well to a large number of features. For example,
there could be fifty or more features in automobile choice. So that we might scale to a large
number of features, we developed a means by which the respondents could highlight which pro-
files had which features. We felt that this process mimicked well the environments consumers
face on the web (such as Figure 1) or in the store where the store manager chooses how to dis-
play items and the salespeople choose which features to highlight. We also felt that the tool
should be entirely optional. The respondents could choose to use it or not and, if they choose to
use it, use it at whatever depth (number of features) that they wanted.
The method we test in this paper is the Show-MeTM Tool (Figure 5). It is based on the
“Christmas Tree” status board on U.S. submarines. The “Christmas Tree” status board has an ar-
ray of colored lights. If they are all green, that means that all the doors and valves are closed be-
fore submerging. It has proven to convey information quickly, easily, and dependably. The
Show-MeTM Tool allows respondents to use a pick list to specify some of the features they think
they must have in order to consider a product. The chosen features are outlined in green. Those
with some but not all of the “must have” features are outlined in yellow. Those with none of the
“must have” attributes are not outlined at all.
There are other methods to display a consideration task.1 For example, in a parallel study,
also with GPSs, researchers at MIT are experimenting with five other tasks.2 These tasks vary
on whether the respondent can select the next profile to evaluate for consideration (from a “bull-
pen”) or whether the next profile is presented randomly. The tasks also vary on whether the re-
spondent must evaluate every profile for consideration, just indicate consideration, or just indi-
cate rejection. A final format tests text vs. icons.
1Future research can test whether the Show-MeTM tool encourages more or less heuristic processing or whether it just mimics the respondent’s natural purchasing environment. For example, when the MIT research is complete, we will have a baseline of non-compensatory processing against which to compare any effects of the Show-MeTM tool.
7
Two-Stage Models of Consideration then Choice Gaskin, Evgeniou, Bailiff and Hauser
Figure 5 The Show-MeTM Tool
Second-stage Choice task. After respondents complete the consideration task, we au-
tomatically infer the features that they used in the consideration task. Details are given below.
Basically, if a feature is in every considered profile but no not-considered profile, then it is likely
to be a non-compensatory feature and important to the respondent. We do not need further in-
formation on its partworth. Similarly, if a feature has no effect on which profiles are considered
then it is likely unimportant and we do not need further information. The other features (not
“must have,” not unimportant) identify a set of features for which we need to estimate partworths
from the second stage of the decision process. We collect data with which to estimate partworths
by using a standard choice task as illustrated in Figure 6. The profiles in the second-stage are
chosen dynamically to gather as much information as feasible (details below). Figure 6 illustrates
a choice task with three profiles; some choice tasks have more profiles and some have fewer pro-
files as dictated by the adaptive algorithm. (In the second stage the non-compensatory features
do not change across the profiles since we do not need further information on them.)
2The team includes Rene Befurt, Theodoros Evgeniou (INSEAD), John Hauser, Clarence Lee, Daria Silinskaia, Olivier Toubia (Columbia University), and Glen Urban.
8
Two-Stage Models of Consideration then Choice Gaskin, Evgeniou, Bailiff and Hauser
One-stage Choice-based conjoint task (the benchmark). We compare the two-stage
data collection and analysis to a standard HB/CBC analysis. To make the comparison as fair as
possible, we use the same basic choice-task format as in Figure 6, except that the profiles are
chosen from a standard experimental design where, unlike the second stage of the two-stage
model, all features vary across profiles. In the CBC task, there were always three profiles per
choice task.
4. Analysis of the Consideration Stage to Identify Process Heuristics To analyze the first-stage of the consider-then-choice two-stage decision process we use
the greedoid dynamic program (GDP) developed by Yee, Dahan, Hauser, and Orlin (2007) and
summarized in a previous volume of the Sawtooth Software Conference Proceedings (Hauser,
Dahan, Yee, and Orlin 2006).
The GDP is an efficient way to identify an heuristic that best fits the data. Although Yee,
et. al. (2007) tested it for full-rank and consider-then-rank data, it can be used for considera-
tion-only data. The GDP searches efficiently over the set of all possible lexicographic heuristics
to find the specific ordering of features that best groups profiles into those that are considered
and those that are not. In a full-rank lexicographic rule, a respondent first selects one feature, say
color display, and ranks all profiles with color displays before those with B&W displays. He or
she next selects another feature, say brand (Garmin vs. Magellan in GPSs) and ranks profiles
9
Two-Stage Models of Consideration then Choice Gaskin, Evgeniou, Bailiff and Hauser
according to color-Garmin, color-Magellan, B&W-Garmin, and B&W-Magellan. The respondent
continues choosing features until all profiles are ranked. While the theory is easy to understand
for full-rank, it can also be applied to considered-vs.-not-considered data.
For such data the GDP considers all pairs of profiles and treats the data as if all consid-
ered profiles are ranked ahead of not-considered profiles. Any given lexicographic ordering
ranks all profiles, but we can evaluate an heuristic on only those pairs for which we know the
rank (consider vs. not-consider). We pick the heuristic for which the predicted ranks violate as
few of the actual observed pairs of ranks as possible.
In theory, the GDP can ultimately evaluate all features and place them into a lexico-
graphic ordering. However, from the perspective of a two-stage model, we are only interested in
the first few features. Furthermore, for consider-only data, there is a non-uniqueness issue. For
example, if a respondent will only consider color-Garmin GPSs, then two lexicographic orders,
(1) color then Garmin and (2) Garmin then color, will explain the data. This is not an issue for a
two-stage analysis because we are only interested in the set of features used in the first stage, we
need not (and cannot from the data) identify the ordering within such “must have” features.
We apply the GDP to the consideration data. The GDP provides a ranking of features
based on the lexicographic hierarchy that is most consistent with the profiles the respondent con-
siders. It is a bit more complex for multi-level features. The GDP actually works with aspects
rather than features. An aspect is a binary description: color vs. B&W. For multi-level features,
we code the feature as multiple aspects. (For more details see Yee, Dahan, Hauser, and Orlin
2007.)
The highest ranked aspects identified by the GDP are set aside as “non-compensatory” if
they appear in 90% of the considered profiles. Our reasoning is that a “must have” aspect should
show up in nearly every considered profile, subject to respondent error. Similarly, a “must-not
have” aspect should show up in very few, if any, of the considered profiles. We selected the 90%
cut-off rule based on judgment. Others rules might apply to different data.
We isolate these non-compensatory aspects and save them for later use in the prediction
of consideration in the holdout sample. It would have been feasible to include price levels (e.g.,
$199) as non-compensatory aspects and the GDP sometimes identifies a price level as such.
However, we decided it would be more realistic to the respondent if we included price levels in
the second-stage adaptive CBC exercise. Thus, we move price to the second stage whether or not
10
Two-Stage Models of Consideration then Choice Gaskin, Evgeniou, Bailiff and Hauser
it is a “must have” feature.
After setting aside the non-compensatory “must have” (and “must-not-have”) aspects, we
select the top remaining features (based on the GDP rankings of aspects) for the second-stage
CBC analysis. Because we sought a parsimonious description of the respondent and because we
wanted a relatively simple CBC design in the second stage, we selected at most six features on
which to collect tradeoffs in the second stage. This judgment was based on our experience in the
category. It was also informed by the parallel MIT research on alternative data collection and
analysis methods. The selection of six features is, naturally, subject to future research as is the
possibility of including the lowest-rank “must have” features in the second-stage CBC exercise.3
There were some exceptions. If there were more than six obviously “must have” aspects,
we included them all. If there were six or more non-compensatory aspects, we used the next two
aspects in the lexicographic order (plus price) in the second-stage CBC exercise.
Summary of the consideration-stage analysis. Based on the consideration task in
which the respondent identifies which of 32 profiles he or she would consider, the GDP identi-
fies two sets of important aspects (features). The first set are the “must have” aspects that are set
aside to determine which validation profiles are considered. The second set is the clearly unim-
portant features that are removed. The third set are the next highest in the lexicographic ordering
of aspects. These aspects are likely compensatory and likely to be used by the respondent in the
second stage of the consider-then-choice process. Only these last aspects (levels of features) plus
price are moved forward to the second-stage data collection – the adaptive CBC exercise.
5. The Second-Stage: Adaptive Choice-Based Conjoint Analysis An important feature of the two-stage analysis is that the features in the second-stage
CBC task are chosen specifically for each respondent based on that respondent’s answers to the
first-stage consideration task. Indeed, even the number of features in the second-stage CBC task
is tailored to the respondent. Such customization requires that the CBC choice sets be generated
“on the fly” for each respondent.
In addition, our overall goal is to develop questioning tasks that are perceived as realistic
and put as little burden on the respondent as feasible. Having already asked the respondent to
complete a first-stage consideration task, we wanted the second-stage CBC task to be as efficient
3 We are grateful to Prof. Ely Dahan of UCLA for this suggestion.
11
Two-Stage Models of Consideration then Choice Gaskin, Evgeniou, Bailiff and Hauser
as feasible – asking only as many questions as are needed.
We draw on the fast polyhedral adaptive conjoint estimation (FastPace) techniques de-
veloped at MIT, in particular, the adaptive CBC version (Toubia, Hauser and Simester 2004).
The FastPace CBC technique (FPCBC) recognizes that each choice made by a respondent im-
poses constraints on the set of feasible partworths as illustrated in Figure 7. The green polygon
represents the set of feasible partworths as determined by previous questions. (We have shown
only two of the partworths – the actual set of feasible partworths forms a high-dimensional po-
lyhedron.) If we ask a respondent to choose among two profiles, and if the profiles are chosen
judiciously, the choice reduces the set of feasible partworths by approximately 50%. For exam-
ple, if the respondent chooses profile 1, then the set of feasible partworths becomes the dark
green region; if the respondent chooses profile 2 it becomes the light green region. More profiles
in a choice set mean more cuts. For example, four profiles in a choice set divide the region into
four sub-regions, each corresponding to the choice of one of the four profiles (Figure 8).
Figure 7 Choices in CBC Tasks Shrink the Set of Feasible Partworths
(Adapted from Toubia, Hauser and Simester 2004)
Choose profile 1
Choose profile 2
separating hyperplane
Hexagon represents current feasible set
Partworth of color vs. B&W
Partworth of small vs. large GPS
12
Two-Stage Models of Consideration then Choice Gaskin, Evgeniou, Bailiff and Hauser
Figure 8 Illustration of the FPCBC Algorithm for Four Profiles
(Adapted from Toubia, Hauser and Simester 2004)
AnalyticCenter
Cut: Profile 1 vs. Profile 3
Cut: Profile 1 vs. Profile 2
Cut: Profile 1 vs. Profile 4
Partworth of color vs. B&W
Partworth of small vs. large GPS
Partworthsof Profile 4
Partworthsof Profile 1
Partworthsof Profile 2
Partworthsof Profile 3
FPCBC chooses the profiles for the choice set to reduce the region of feasible partworths
as rapidly as possible. This usually means that the regions are of roughly equal size and as close
to symmetrical as feasible. The mathematical details of the algorithm are beyond the scope of
this paper and are described in Toubia, Hauser and Simester (2004). Basically, the algorithm first
finds an ellipsoid that approximates the set of feasible partworths, then finds the longest axes of
the ellipsoid and selects cuts that are perpendicular to the longest axes. Finally, it chooses pro-
files for the choice set by solving the consumer’s budget problems (for target partworths) such
that the choices among the profiles imply the selected cuts. The algorithm has proven to recover
partworths (synthetic data) accurately and, in most cases, more accurately than alternative ques-
tion-generation methods. Empirically, it performs as expected, reducing the choice set rapidly
and achieving maximal-information choice balance. Recently, it has been improved to incorpo-
rate measurement error and managerial priors (Toubia, Hauser and Garcia 2007). In this paper
we test the basic version recognizing that the performance of a two-stage model will improve
when we move to the probabilistic version.
In our application, FPCBC generated choice sets that the respondents perceived as realis-
tic and the set of feasible partworths converged rapidly to partworth estimates. One managerial
13
Two-Stage Models of Consideration then Choice Gaskin, Evgeniou, Bailiff and Hauser
advantage of FPCBC is that the partworths are estimated automatically during the questioning
process and are immediately available for either managerial analysis or for further adaptive ques-
tioning. For example, although we did not test such adaptive branching in our surveys, one can
imagine a series of adaptive open-ended questions to query a respondent on why some features
are “must have” features (consideration stage) and why other features are important in choice
(second, choice stage).
In this paper, we use the automatically generated estimates that are based on the “analytic
center” of the region of feasible partworths that remain after the CBC questions are answered.
However, one can also use these questions as input to a standard HB/CBC estimation. For com-
parative testing see Toubia, Hauser and Simester (2004) and Toubia, Hauser and Garcia (2007).
Summary of the two-stage analysis. After the respondent has completed both the con-
sideration task and the FPCBC task, we have identified three sets of features: (1) “must have”
features that the respondent used to make consideration decisions, (2) compensatory features that
are important in the second-stage choice decision, and (3) unimportant features. For the com-
pensatory features we have also estimated FPCBC partworths to describe the second-stage
choice decision.
To make forecasts, we use the “must have” features to predict consideration sets. We then
use the compensatory partworths to predict choice within the consideration set. Any profile or
product that is not predicted as considered, we assume will not be chosen.
6. Empirical Test of the Two-stage Consider-then-Choose Tasks
To test and refine our methodology, we developed two web-based surveys. The first sur-
vey used both the consideration task in Figures 5 and the choice task in Figure 6. The second
(control) survey was a traditional choice-based conjoint survey that used standard CBC tasks
similar to those in Figure 6.
Both surveys used the same images (jpegs) and icons to represent the 16 features (in-
cluding price). Five features (brand, size, display size, display color, and backlit keyboard) were
represented in the images themselves and eleven features (weight, display brightness, display
ability, and price) were represented by icons. We felt that the price should be realistic to the re-
spondent, yet we wanted to manipulate price in the experimental design. We achieved both goals
by defining a “base price manipulation ($0 or $150)” that was added to feature-based prices to
14
Two-Stage Models of Consideration then Choice Gaskin, Evgeniou, Bailiff and Hauser
get a total price. The total price was then “rounded” to one of four levels with the rounding rules
chosen for level balance. For the consideration task we chose 32 profiles from an orthogonal ar-
ray.4 The FPCBC profiles were chosen by the polyhedral method described above. The CBC
profiles and choice sets (second survey) were chosen by a randomized design using all features
which we created using Sawtooth Software.
The surveys were programmed in ASP. Both the GDP and FPCBC were coded in Matlab,
and then compiled into DLLs using Microsoft ASP.NET. The database for the survey was coded
in SQL. The HB/CBC estimation (CBC control) was programmed in Matlab using code devel-
oped by Toubia, Hauser and Simester (2004). This code was checked by those authors to give the
same estimates as the Sawtooth Software HB/CBC module.
The surveys included an introduction, a description of handheld GPSs and their features,
and either the consider-then-choose tasks (two-stage survey) or the standard CBC tasks (control).
Following some questions about GPS usage we used “puzzler” questions to cleanse the mental
palette (Frederick 2005). After the cleansing task, respondents completed a holdout task in which
they where given eight GPS profiles (chosen from a master experimental design, different from
the design used in the calibration consideration task). Respondents indicated which profiles they
would consider and then ranked all eight profiles. (Although we do not need the consideration
data to test the CBC analysis in the control survey, we included the task to make the holdout
tasks the same in both the test and control surveys. Finally, respondents completed a battery of
self-explicated importance questions and questions about the survey itself.
The sample frame was current or prospective users of handheld GPSs. Sample was pro-
vided from the Internet panel maintained and operated by Survey Sampling, Inc. We used the
standard incentives provided by Survey Sampling, Inc. The number of completed interviews was
291 in the two-stage survey and 265 in the CBC control survey.
7. Results: Comparison of Two-Stage Tasks to Traditional CBC A minimum requirement for the estimating a two-stage model is that the two-stage task
be seen as interesting and enjoyable by respondents. Table 2 summarizes the results that we ob-
4 The features were based on qualitative interviews and surveys to identify the features that were likely to be per-ceived as important by the target sample. The images and icons were developed jointly by Applied Marketing Sci-ence, Inc. and MIT and generated by Limor Weisberg (LimorDesign at www.limor.com). MIT is using the same images and similar icons with five alternative data collection formats and to evaluate improved algorithms based on disjunctions of conjunctions. Rene Befurt of MIT was instrumental in managing the production of images.
15
Two-Stage Models of Consideration then Choice Gaskin, Evgeniou, Bailiff and Hauser
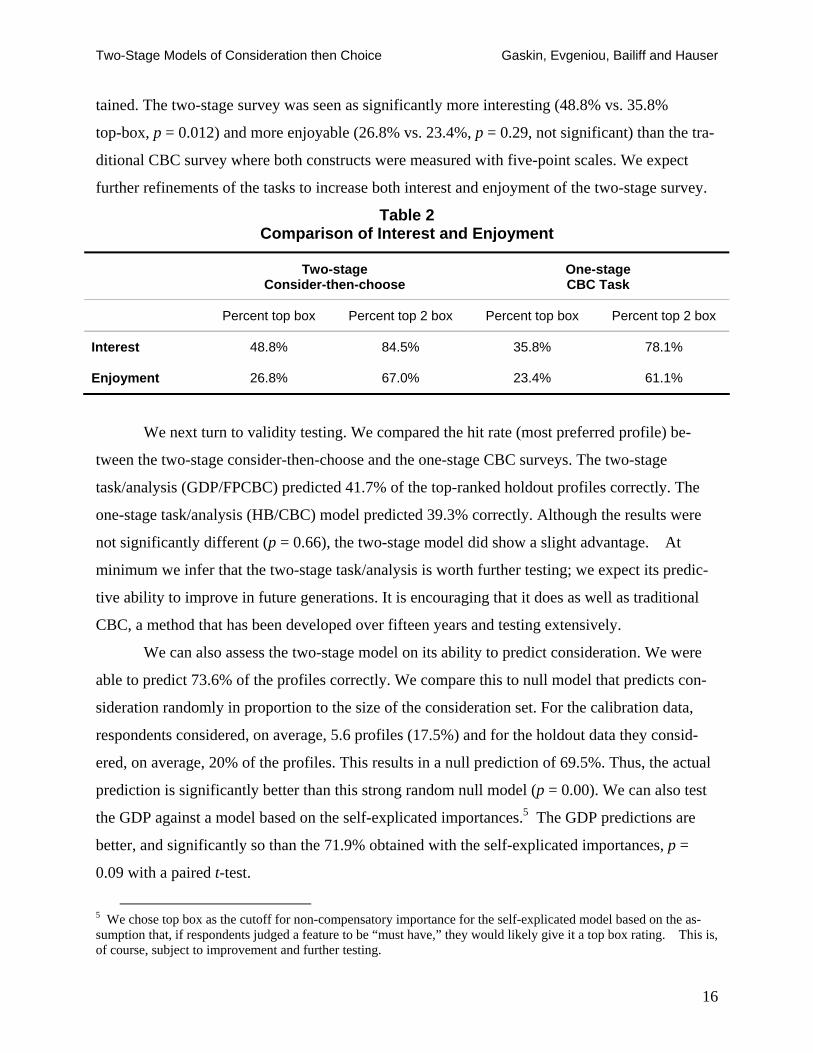
tained. The two-stage survey was seen as significantly more interesting (48.8% vs. 35.8%
top-box, p = 0.012) and more enjoyable (26.8% vs. 23.4%, p = 0.29, not significant) than the tra-
ditional CBC survey where both constructs were measured with five-point scales. We expect
further refinements of the tasks to increase both interest and enjoyment of the two-stage survey.
Table 2 Comparison of Interest and Enjoyment
Two-stage Consider-then-choose
One-stage CBC Task
Percent top box Percent top 2 box Percent top box Percent top 2 box
Interest 48.8% 84.5% 35.8% 78.1%
Enjoyment 26.8% 67.0% 23.4% 61.1%
We next turn to validity testing. We compared the hit rate (most preferred profile) be-
tween the two-stage consider-then-choose and the one-stage CBC surveys. The two-stage
task/analysis (GDP/FPCBC) predicted 41.7% of the top-ranked holdout profiles correctly. The
one-stage task/analysis (HB/CBC) model predicted 39.3% correctly. Although the results were
not significantly different (p = 0.66), the two-stage model did show a slight advantage. At
minimum we infer that the two-stage task/analysis is worth further testing; we expect its predic-
tive ability to improve in future generations. It is encouraging that it does as well as traditional
CBC, a method that has been developed over fifteen years and testing extensively.
We can also assess the two-stage model on its ability to predict consideration. We were
able to predict 73.6% of the profiles correctly. We compare this to null model that predicts con-
sideration randomly in proportion to the size of the consideration set. For the calibration data,
respondents considered, on average, 5.6 profiles (17.5%) and for the holdout data they consid-
ered, on average, 20% of the profiles. This results in a null prediction of 69.5%. Thus, the actual
prediction is significantly better than this strong random null model (p = 0.00). We can also test
the GDP against a model based on the self-explicated importances.5 The GDP predictions are
better, and significantly so than the 71.9% obtained with the self-explicated importances, p =
0.09 with a paired t-test.
5 We chose top box as the cutoff for non-compensatory importance for the self-explicated model based on the as-sumption that, if respondents judged a feature to be “must have,” they would likely give it a top box rating. This is, of course, subject to improvement and further testing.
16
Two-Stage Models of Consideration then Choice Gaskin, Evgeniou, Bailiff and Hauser
8. Summary and Future Directions Analyses to date suggest that two-stage consider-then-choose data collection and analysis
have potential advantages:
• Two-stage data collection is based on respondent tasks that mimic those used by con-
sumers to form consideration sets and make choices in market environments.
• Respondents find the tasks significantly more interesting and more enjoyable than the
traditional choice-based conjoint task.
• The natural format and the increased interest and enjoyment are likely to enable us to
handle a much larger set of features than traditional formats.
• Holdout hit rates are improved slightly with the two-stage analysis relative to one-stage
(CBC) analysis. At minimum the two-stage process is at least as accurate as the tradi-
tional one-stage process – the next generation shows even more promise.
• The first-stage GDP predicts consideration sets significantly better than a strong null
model and better than analyses based self-explicated importances.
We view the survey tasks and analyses in this paper as a “proof of concept.” With further
development we expect to improve choice hit rates, consideration hit rates, respondent interest
and enjoyment, and realism. To the best of our knowledge, this was the first application of the
Show-MeTM tool. We are working to improve its look and feel. This was also the first application
of a combined GDP and customized FPCBC. We made a number of heuristic choices such as the
90% cut-off, the number of features advanced to the second stage, and the inclusion or not of
“must have” features in the second stage. All of these assumptions are subject to test and im-
provement. Finally, we used the deterministic FPCBC as a first test. In future analyses we hope
to experiment with HB/CBC to estimate partworths from the FPCBC-selected questions and we
hope to experiment with the probabilistic versions of FPCBC.
Finally, we note that the MIT team is working on improved first-stage tasks and on anal-
ysis methods for predicting consideration. Early indications suggest that improved analysis of
our first-stage data can increase holdout hit rates. We are optimistic for further improvements
and for the future of two-stage consider-then-choose analysis.
17
Two-Stage Models of Consideration then Choice Gaskin, Evgeniou, Bailiff and Hauser
References
Frederick, Shane (2005), “Cognitive Reflection and Decision Making.” Journal of Economic
Perspectives. 19(4). 25-42. Gigerenzer, Gerd and Daniel G. Goldstein (1996), “Reasoning the Fast and Frugal Way: Models
of Bounded Rationality,” Psychological Review, Vol. 1003, No. 4, 650-669. ______, Ulrich Hoffrage, and H. Kleinbölting (1991), “Probabilistic Mental Models: A Bruns-
wikian Theory of Confidence,” Psychological Review, 98, 506-528. Gilbride, T. and G. M. Allenby (2004), “A choice model with conjunctive, disjunctive and com-
pensatory screening rules,” Marketing Science, Vol. 23, No. 3 (Summer), 391-406. Hauser, John R. (1978), "Testing the Accuracy, Usefulness and Significance of Probabilistic
Models: An Information Theoretic Approach," Operations Research, Vol. 26, No. 3, (May-June), 406-421
______, Ely Dahan, Michael Yee, and James Orlin (2006), ““Must Have” Aspects vs. Tradeoff
Aspects in Models of Customer Decisions,” Proceedings of the Sawtooth Software Conference in Del Ray Beach, FL, March 29-31, 2006
______ and Birger Wernerfelt (1990), "An Evaluation Cost Model of Consideration Sets,"
Journal of Consumer Research, Vol. 16, (March), 393-408. Jedidi, K. and R. Kohli (2005), “Probabilistic subset-conjunctive models for heterogeneous con-
sumers,” Journal of Marketing Research, Vol. 42, No. 3, 483-494. Payne, John W. (1976), “Task Complexity and Contingent Processing in Decision Making: An
Information Search,” Organizational Behavior and Human Performance, 16, 366-387. ______, James R. Bettman, and Eric J. Johnson (1988), “Adaptive Strategy Selection in Decision
Making,” Journal of Experimental Psychology: Learning, Memory, and Cognition, 14, 534-552.
______, ______ and ______ (1993), The Adaptive Decision Maker, (Cambridge, UK: Cam-
bridge University Press). Roberts, John H. and James M. Lattin (1991), “Development and Testing of a Model of Consid-
eration Set Composition,” Journal of Marketing Research, 28, (November), 429-440. Toubia, Olivier, John R. Hauser and Rosanna Garcia (2007), “Probabilistic Polyhedral Methods for
Adaptive Choice-Based Conjoint Analysis: Theory and Application,” Marketing Science, 26, 5, (September-October), 596-610.
18
Two-Stage Models of Consideration then Choice Gaskin, Evgeniou, Bailiff and Hauser
______, ______, and Duncan Simester (2004), “Polyhedral Methods for Adaptive Choice-based Conjoint Analysis,” Journal of Marketing Research, 41, 1, (February), 116-131.
Yee, Michael, Ely Dahan, John R. Hauser and James Orlin (2007), “Greedoid-Based Noncom-