Tyco_International_SHOW_FILE_FINAL.pp t December 5, 2007 1 Tyco International Investor Day June 19, 2007 Tyco International Investor Day Ed Arditte Senior Vice President, Strategy and Investor Relations
Transcript
Tyco_International_SHOW_FILE_FINAL.ppt
December 5, 2007
1
Tyco International Investor Day
June 19, 2007
Tyco International Investor Day
Ed ArditteSenior Vice President, Strategy and Investor Relations
Tyco_International_SHOW_FILE_FINAL.ppt
December 5, 2007
2
Forward-Looking Statement/Non-GAAP Measures
This presentation contains certain “forward-looking statements” within the meaning of the United States Private Securities Litigation Reform Act of 1995. These statements are based on management’s current expectations and are subject to risks, uncertainty and changes in circumstances, which may cause actual results, performance or achievements to differ materially from anticipated results, performance or achievements. All statements contained herein that are not clearly historical in nature are forward-looking and the words “anticipate,” “believe,” “expect,” “estimate,” “plan” and similar expressions are generally intended to identify forward-looking statements.
The forward-looking statements in this presentation may include statements addressing the following subjects: futurefinancial condition and operating results, economic, business, competitive and/or regulatory factors affecting Tyco’s business. Any of the following factors may affect Tyco’s future results:
• cyclical industry and economic conditions;• higher rates of customer attrition;• Tyco’s ability to develop new technologies that achieve market acceptance with acceptable margins;• changes in legislation or governmental regulations or policies;• product liability claims relating to products Tyco manufactures or installs;• violations of the U.S. Foreign Corrupt Practices Act and similar worldwide anti-bribery laws;• divestitures of some of Tyco’s businesses or product lines;• additional impairment charges;• material weakness in Tyco’s internal control over financial reporting;• volatility in non-U.S. currency exchange rates; or• insufficient quantities of materials, components and equipment required for Tyco’s manufacturing activities.
These are examples of factors, among others, that could cause actual results to differ materially from those described in the forward-looking statements. In addition, Tyco’s pro forma financial information is not necessarily representative of the results it would have achieved absent its healthcare and electronics businesses and may not be a reliable indicator of its future results. Tyco is under no obligation to (and expressly disclaims any such obligation to) update or alter its forward-looking statements whether as a result of new information, future events or otherwise. More detailed information about these and other factors is set forth in Tyco’s Annual Report on Form 10-K as amended for the fiscal year ended September 29, 2006.
Free Cash Flow, EBITDA, organic revenue growth and Return On Invested Capital are non-GAAP financial measures and are described in the Appendix.
Today’s Agenda
Tyco International 8:00 am – 10:30 am
Break 10:30 am – 11:00 am
Tyco Electronics 11:00 am – 1:00 pm
Lunch 1:00 pm – 2:00 pm
Covidien 2:00 pm – 5:00 pm
Tyco_International_SHOW_FILE_FINAL.ppt
December 5, 2007
3
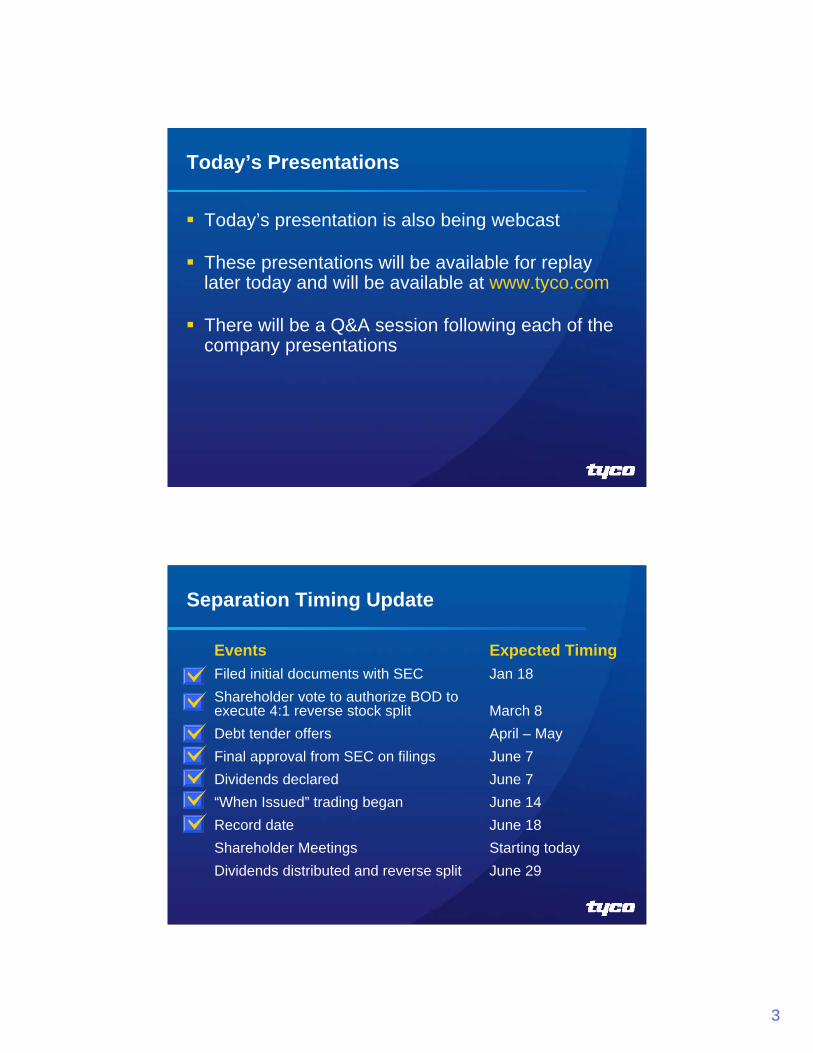
Today’s Presentations
Today’s presentation is also being webcast
These presentations will be available for replay later today and will be available at www.tyco.com
There will be a Q&A session following each of the company presentations
Separation Timing Update
Events Expected TimingFiled initial documents with SEC Jan 18Shareholder vote to authorize BOD to execute 4:1 reverse stock split March 8Debt tender offers April – MayFinal approval from SEC on filings June 7Dividends declared June 7“When Issued” trading began June 14Record date June 18Shareholder Meetings Starting todayDividends distributed and reverse split June 29
Tyco_International_SHOW_FILE_FINAL.ppt
December 5, 2007
4
Tyco International Agenda
Chris CoughlinFinancial Review
AllQ&A
Naren Gursahaney
Dean Seavers
George Oliver
George Oliver
Patrick Decker
Business Segment Reviews
– ADT Worldwide
– Fire Protection Services
– Safety Products
– Electrical & Metal Products
– Flow Control
Ed BreenTyco International Overview
Tyco International Investor Day
Ed BreenChairman and Chief Executive Officer
Tyco_International_SHOW_FILE_FINAL.ppt
December 5, 2007
5
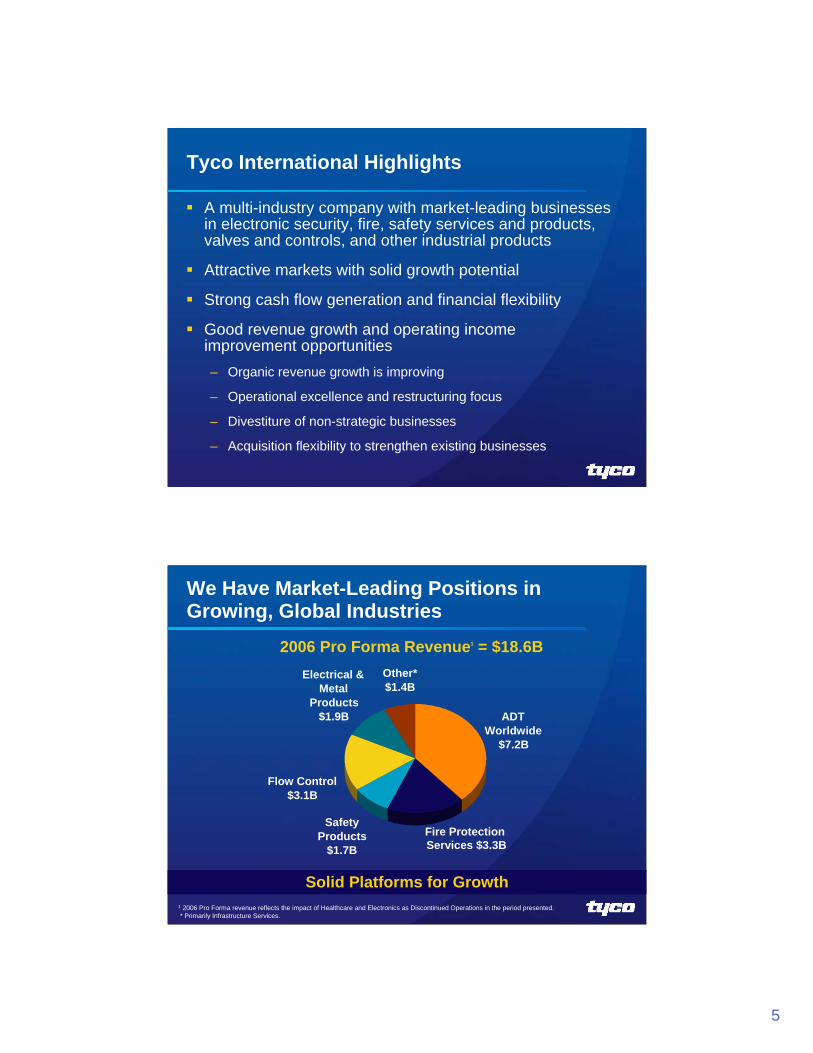
A multi-industry company with market-leading businesses in electronic security, fire, safety services and products, valves and controls, and other industrial products
Attractive markets with solid growth potential
Strong cash flow generation and financial flexibility
Good revenue growth and operating income improvement opportunities– Organic revenue growth is improving
– Operational excellence and restructuring focus
– Divestiture of non-strategic businesses
– Acquisition flexibility to strengthen existing businesses
Tyco International Highlights
Solid Platforms for Growth
2006 Pro Forma Revenue1 = $18.6B
We Have Market-Leading Positions in Growing, Global Industries
1 2006 Pro Forma revenue reflects the impact of Healthcare and Electronics as Discontinued Operations in the period presented.* Primarily Infrastructure Services.
Other*$1.4B
Electrical & Metal
Products$1.9B
Flow Control$3.1B
Safety Products
$1.7B Fire Protection Services $3.3B
ADT Worldwide
$7.2B
Tyco_International_SHOW_FILE_FINAL.ppt
December 5, 2007
6
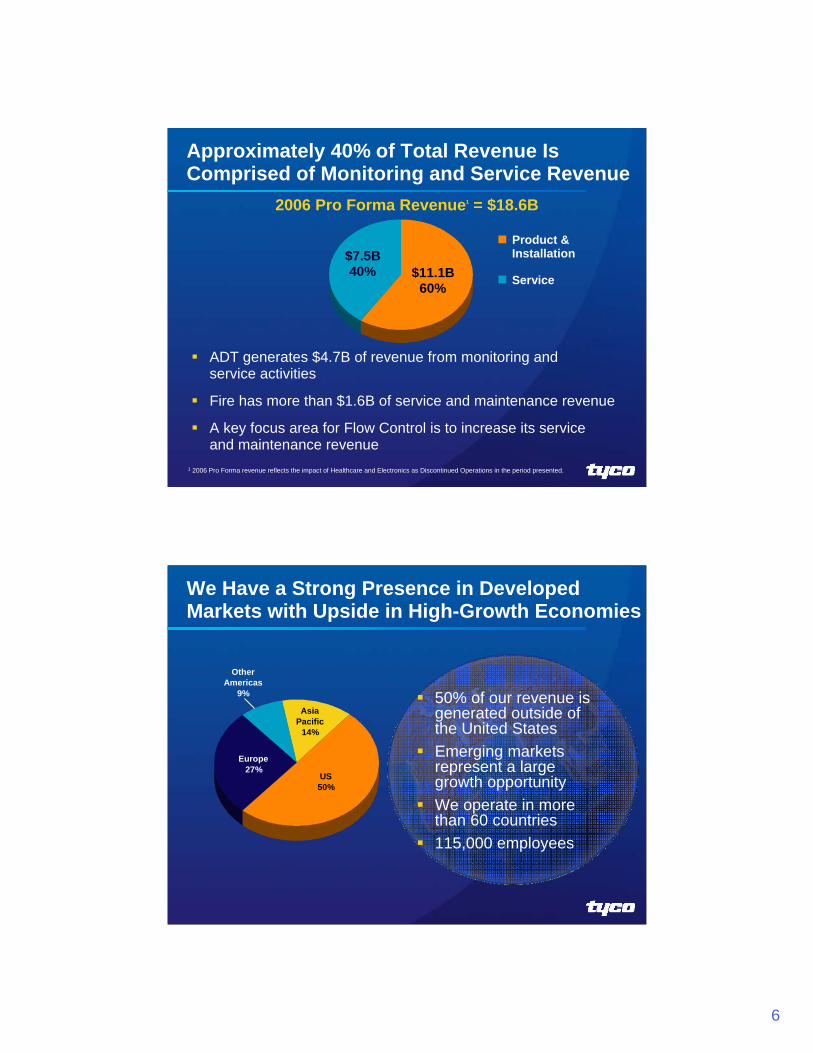
Approximately 40% of Total Revenue Is Comprised of Monitoring and Service Revenue
ADT generates $4.7B of revenue from monitoring andservice activities
Fire has more than $1.6B of service and maintenance revenue
A key focus area for Flow Control is to increase its service and maintenance revenue
2006 Pro Forma Revenue1 = $18.6B
1 2006 Pro Forma revenue reflects the impact of Healthcare and Electronics as Discontinued Operations in the period presented.
$11.1B 60%
$7.5B 40%
Product &Installation
Service
We Have a Strong Presence in Developed Markets with Upside in High-Growth Economies
50% of our revenue is generated outside of the United StatesEmerging markets represent a large growth opportunityWe operate in more than 60 countries115,000 employees
Europe27%
Asia Pacific
14%
Other Americas
9%
US50%
Tyco_International_SHOW_FILE_FINAL.ppt
December 5, 2007
7
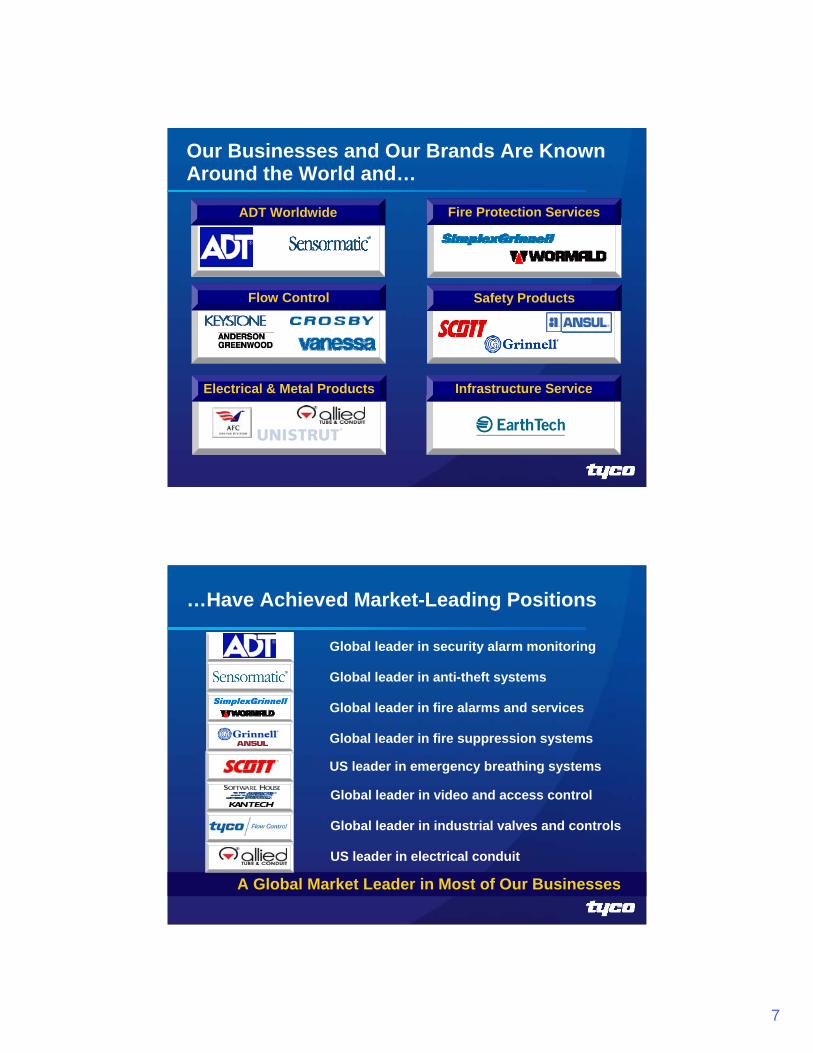
Our Businesses and Our Brands Are Known Around the World and…
Fire Protection Services
Safety Products
ADT Worldwide
Flow Control
Electrical & Metal Products Infrastructure Service
…Have Achieved Market-Leading Positions
Global leader in security alarm monitoring
Global leader in fire suppression systems
US leader in emergency breathing systems
Global leader in anti-theft systems
Global leader in fire alarms and services
Global leader in video and access control
Global leader in industrial valves and controls
US leader in electrical conduit
A Global Market Leader in Most of Our Businesses
Tyco_International_SHOW_FILE_FINAL.ppt
December 5, 2007
8
Industry Growth + Market Share Growth Opportunities
We Have Strong Positions in Large, Global and Fragmented Industries
Tyco 12%
GEHoneywell
Siemens
UTC
Thousands of Others~75%
$30+B MarketExpected Market Growth = 3-4%
$38+B MarketExpected Market Growth = 4-5%
Thousands of others
~85%
Tyco 5%EmersonCameronFlowserve
Global Fire Industry
$65+B MarketExpected Market Growth = 5-7%
Siemens
Tyco 11%
UTCThousands of Others
~75%
Secom
Global Electronic Security Industry
Global Industrial Valves & Controls Industry
Source: Freedonia, McIlvaine, Industry and Management Estimates
We Have Demonstrated Consistently Strong EBITDA and Cash Flow
More Than $1.0 Billion of Free Cash Flow
$2.6B $2.4B $2.2B
0.0
0.5
1.0
1.5
2.0
2.5
3.0
PF 2004* PF 2005* PF 2006*0.0%
3.0%
6.0%
9.0%
12.0%
15.0%
EBITDA EBITDA Margin$B %
* 2004-2006 Pro Forma financials reflect the impact of Healthcare and Electronics as Discontinued Operations in the periods presented.Free Cash Flow and EBITDA are non-GAAP measures. Please see Appendix for a reconciliation.
ADT Has More Locations and Monitoring Centers for Superior Security Service…
Over 20,000Service
Technicians
40+ Monitoring Centers
Worldwide
Countries with ADT coverageCountries without ADT coverage
Tyco_International_SHOW_FILE_FINAL.ppt
December 5, 2007
17
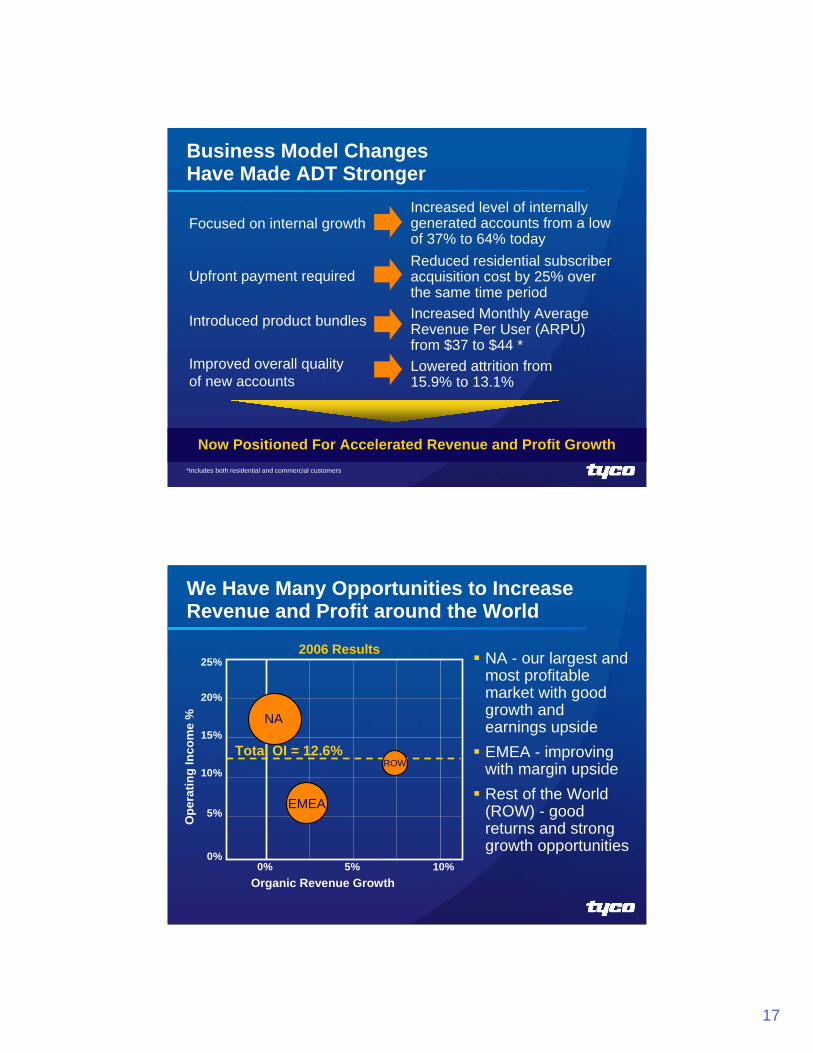
Focused on internal growth
Upfront payment required
Introduced product bundles
Improved overall quality of new accounts
Now Positioned For Accelerated Revenue and Profit Growth
Business Model Changes Have Made ADT Stronger
Increased level of internally generated accounts from a low of 37% to 64% todayReduced residential subscriber acquisition cost by 25% over the same time period Increased Monthly Average Revenue Per User (ARPU) from $37 to $44 *Lowered attrition from 15.9% to 13.1%
*Includes both residential and commercial customers
5% 10%
5%
10%
15%
20%
Organic Revenue Growth
Ope
ratin
g In
com
e %
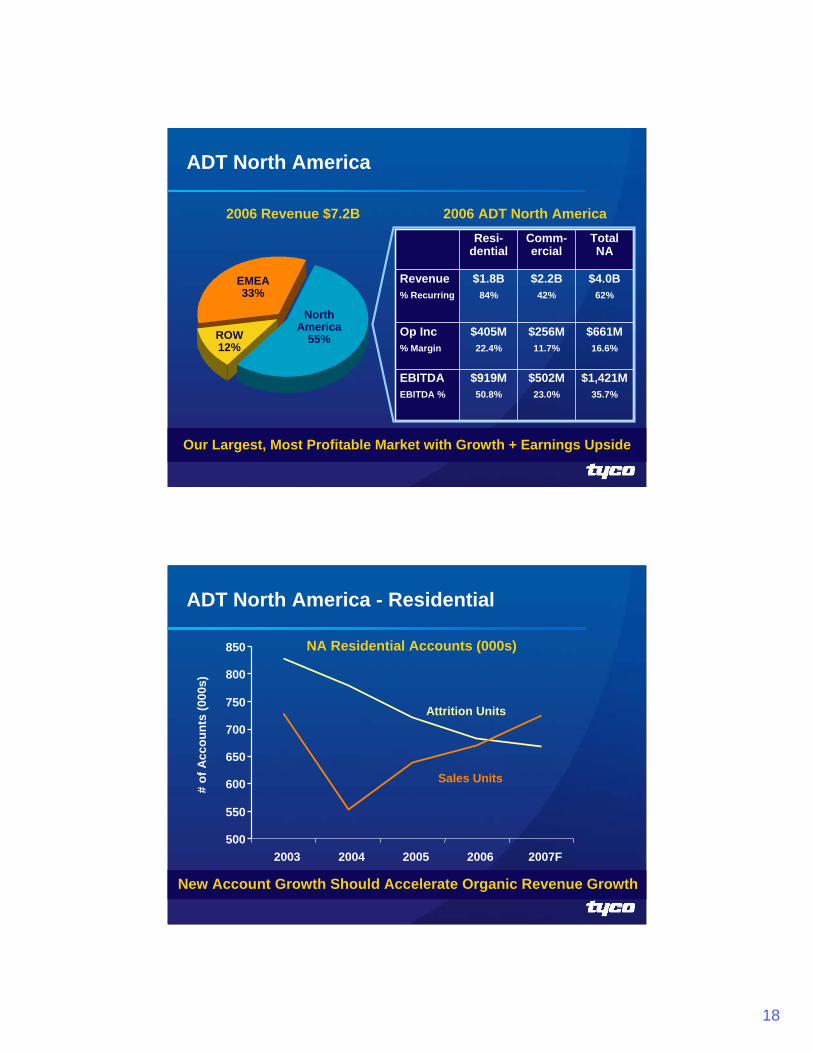
0%0%
NA - our largest and most profitable market with good growth and earnings upside EMEA - improving with margin upsideRest of the World (ROW) - good returns and strong growth opportunities
We Have Many Opportunities to Increase Revenue and Profit around the World
NA
EMEA
ROWTotal OI = 12.6%
25%2006 Results
Tyco_International_SHOW_FILE_FINAL.ppt
December 5, 2007
18
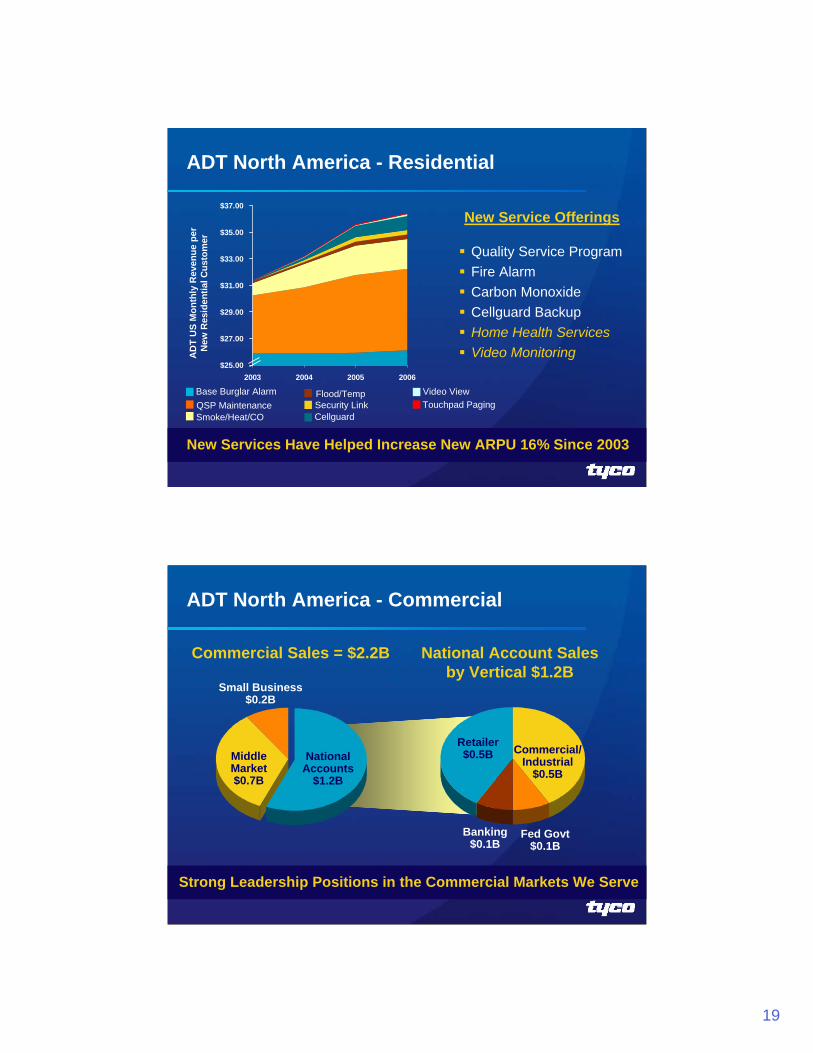
$502M23.0%
$256M11.7%
$2.2B42%
$1,421M35.7%
$661M16.6%
$4.0B62%
$919M50.8%
$405M22.4%
$1.8B84%
Comm-ercial
Total NA
Resi-dential
EBITDA EBITDA %
Op Inc% Margin
Revenue% Recurring
2006 Revenue $7.2B 2006 ADT North America
ADT North America
EMEA33%
NorthAmerica
55%ROW12%
Our Largest, Most Profitable Market with Growth + Earnings Upside
ADT North America - Residential
# of
Acc
ount
s (0
00s)
Attrition Units
Sales Units
New Account Growth Should Accelerate Organic Revenue Growth
500
550
600
650
700
750
800
850
2003 2004 2005 2006 2007F
NA Residential Accounts (000s)
Tyco_International_SHOW_FILE_FINAL.ppt
December 5, 2007
19
New Services Have Helped Increase New ARPU 16% Since 2003
$25.00
$27.00
$29.00
$31.00
$33.00
$35.00
$37.00
2003 2004 2005 2006
AD
T U
S M
onth
ly R
even
ue p
er
New
Res
iden
tial C
usto
mer
New Service Offerings
Quality Service ProgramFire AlarmCarbon MonoxideCellguard BackupHome Health ServicesVideo Monitoring
ADT North America - Residential
Base Burglar AlarmQSP MaintenanceSmoke/Heat/CO
Flood/TempSecurity LinkCellguard
Video ViewTouchpad Paging
ADT North America - Commercial
Fed Govt$0.1B
Retailer$0.5B Commercial/
Industrial$0.5B
Commercial Sales = $2.2B National Account Sales by Vertical $1.2B
National Accounts
$1.2B
Small Business$0.2B
Middle Market$0.7B
Banking$0.1B
Strong Leadership Positions in the Commercial Markets We Serve
Tyco_International_SHOW_FILE_FINAL.ppt
December 5, 2007
20
ADT North America – CommercialTypical Retailer Account
We Have One of the Most Robust Security Solutions for Retailers
Loss Prevention
ElectronicArticle
Surveillance Customer &Employee Safety
Burglar Alarm& Monitoring
Intrusion Detection
Operations Management
People Counting &Data Mining
VideoSurveillance
ADT North America – CommercialTypical Banking Account
Offering a Comprehensive Security Package for Banks
Event Detection & Support
Infrastructure Protection
VideoSurveillance
AccessControl
Burglar & FireAlarm Monitoring
Intrusion DetectionAnd Control
Operational Efficiencies
Remote Guard Tours
Tyco_International_SHOW_FILE_FINAL.ppt
December 5, 2007
21
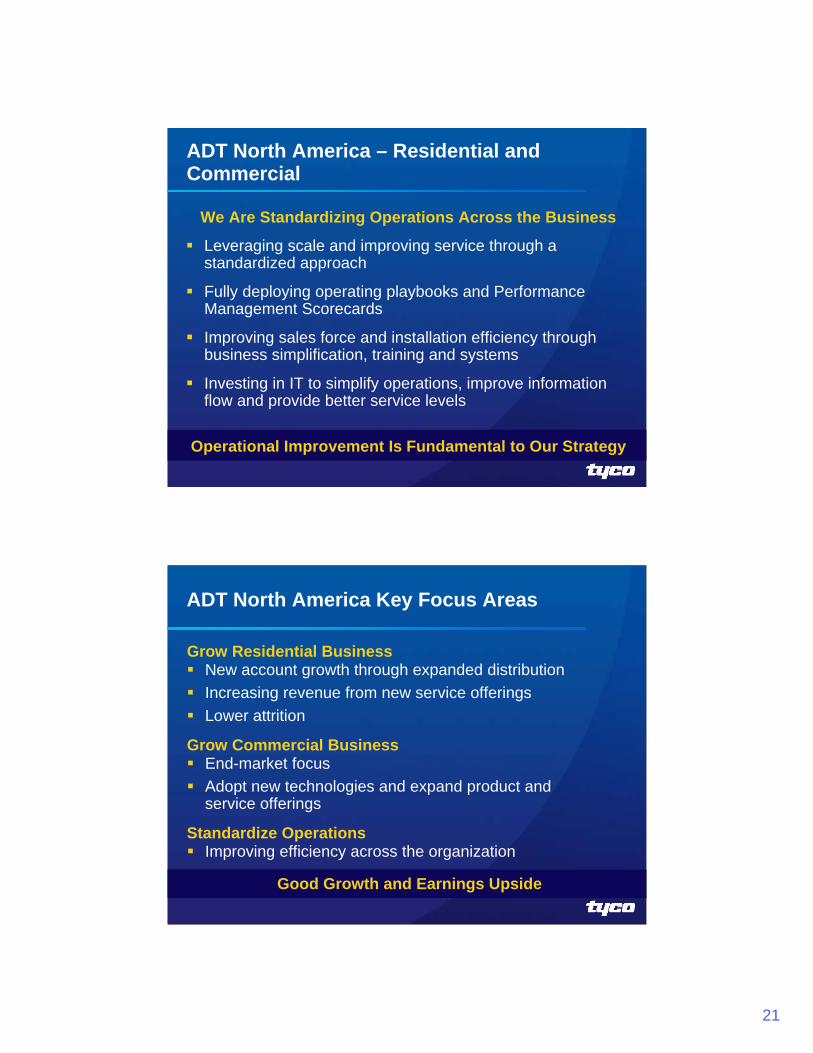
Operational Improvement Is Fundamental to Our Strategy
ADT North America – Residential and Commercial
Leveraging scale and improving service through a standardized approach
Fully deploying operating playbooks and Performance Management Scorecards
Improving sales force and installation efficiency through business simplification, training and systems
Investing in IT to simplify operations, improve information flow and provide better service levels
We Are Standardizing Operations Across the Business
ADT North America Key Focus Areas
Grow Residential BusinessNew account growth through expanded distributionIncreasing revenue from new service offeringsLower attrition
Grow Commercial BusinessEnd-market focusAdopt new technologies and expand product and service offerings
Standardize OperationsImproving efficiency across the organization
Good Growth and Earnings Upside
Tyco_International_SHOW_FILE_FINAL.ppt
December 5, 2007
22
$270M11.4%
$148M6.3%
$2.4B15%/85%
31%
$1,421M35.7%
$661M16.6%
$4.0B46%/54%
62%
ADT NA
ADT EMEA
EBITDAEBITDA %
Op Inc% Margin
RevenueResi/Comm Split% RMR
ADT Europe, Middle East & Africa
Continental Europe$1.3B
UK$0.9B
Middle East & Africa$0.2B
2006 EMEA Revenue $2.4B33% of Total
Significant Performance Upside Exists
ADT Europe, Middle East & Africa –Continental Europe
0
100
200
300
400
2003 2004 2005 2006 2007F
$M
Recurring Revenue
Account Growth ChallengesStructural Issues
High Continental Europe attrition rates
Less favorable revenue mix (e.g., recurring and residential revenue)
Low sales productivity
Improving but Continues to Face Headwinds
020
4060
80100
2003 2004 2005 2006 2007F
Uni
ts (K
)
Attrition New Accounts
Tyco_International_SHOW_FILE_FINAL.ppt
December 5, 2007
23
Improvement ActionsRestructuring projects underway in 13 countries– Right-sizing operations– Consolidating back office functions– Rationalizing footprint
Enhancing revenue mix and quality of business through reduced attrition and a specific focus on residential program
Improving contracting margins via better pricing discipline and adoption of global execution best practices
Upgrading talent at all levels of the organization
ADT Europe, Middle East & Africa –Continental Europe
Focused on Restructuring and Improved Mix/Execution
ADT Rest of the World
$184M21.4%
$98M11.4%
$0.9B24%/76%
49%
$1,421M35.7%
$661M16.6%
$4.0B46%/54%
62%
ADT NA
ADT ROW
EBITDA EBITDA %
Op Inc% Margin
RevenueResi/Comm Split% RMR
Asia$456M LatAm
$234M
Aus/NZ$167M
2006 ROW Revenue $857M12% of Total
Solid Growth Opportunities
Tyco_International_SHOW_FILE_FINAL.ppt
December 5, 2007
24
ADT Worldwide - Summary
The global security market is very attractive and ADT is well positioned to win in this market
The business model changes we have made in recent years position us well for future top and bottom line growth
We have a very strong North America business that will continue to improve with the changes we have made
Restructuring and operational improvements which are under way in Europe will allow us to optimize our results … driving us to double-digit operating margin in this region over time
Focused on Improving Top and Bottom Line Performance
Fire Protection ServicesImproved Performance & Growth
Dean SeaversPresident, SimplexGrinnell
Tyco_International_SHOW_FILE_FINAL.ppt
December 5, 2007
25
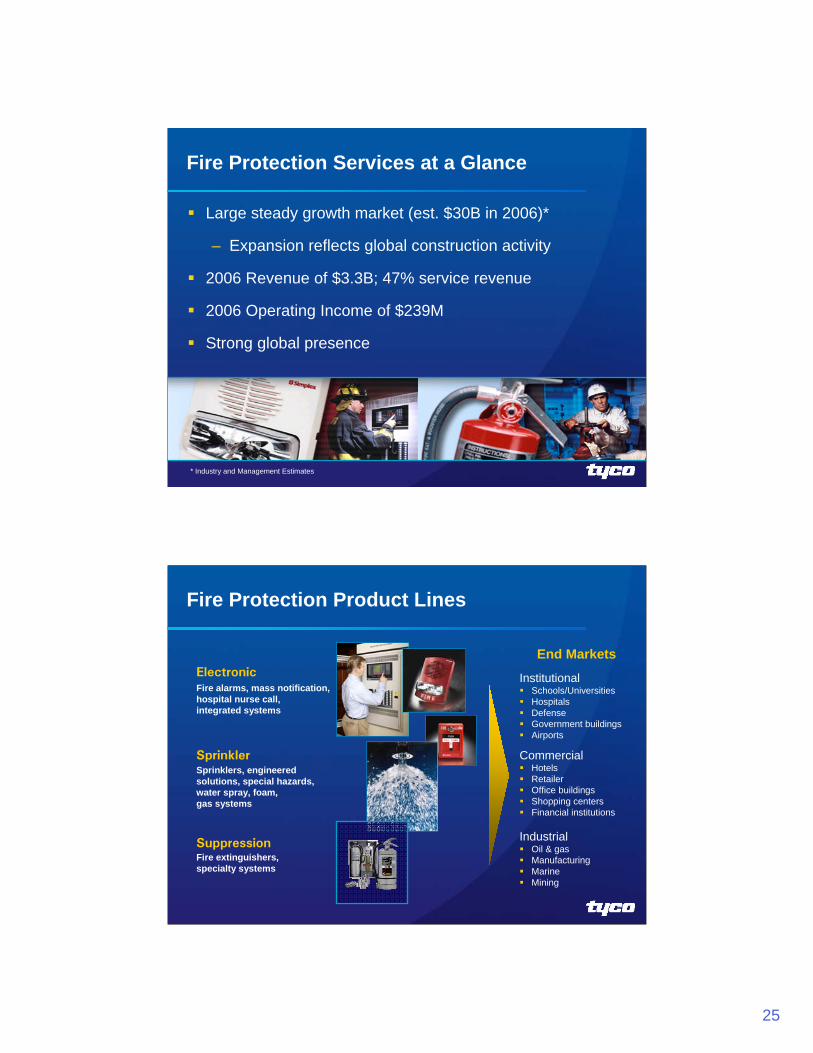
Fire Protection Services at a Glance
Large steady growth market (est. $30B in 2006)*
– Expansion reflects global construction activity
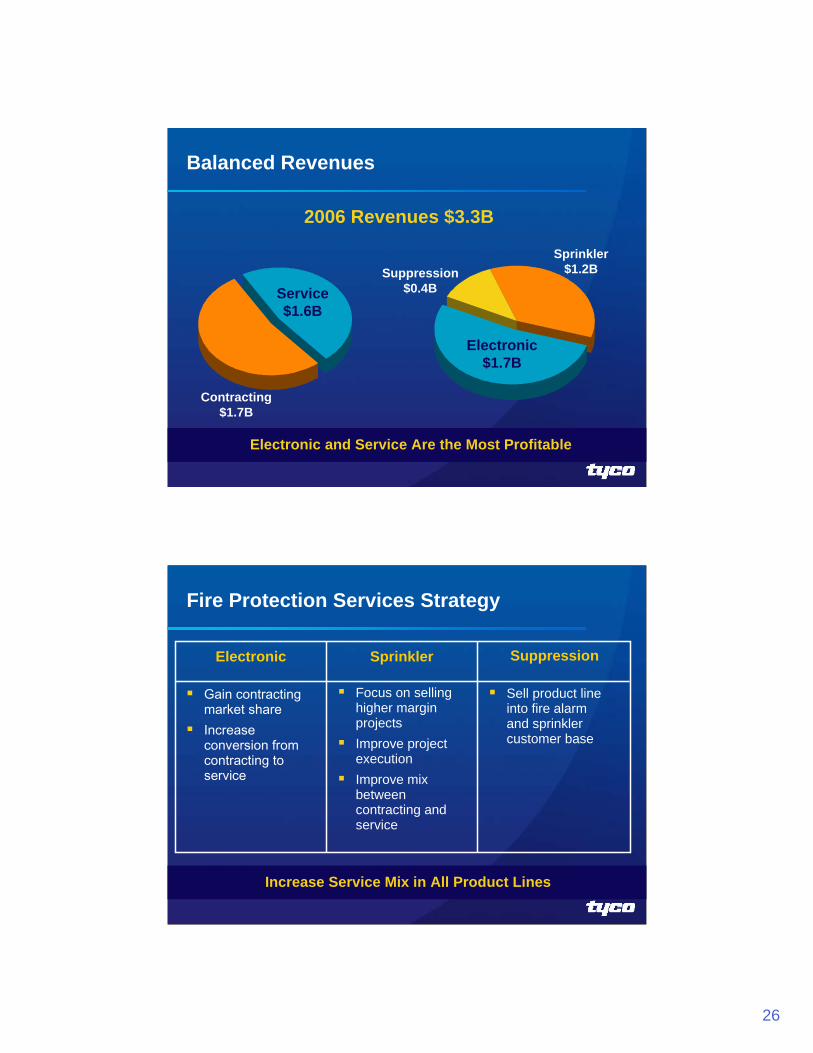
2006 Revenue of $3.3B; 47% service revenue
2006 Operating Income of $239M
Strong global presence
* Industry and Management Estimates
Fire Protection Product Lines
Sprinkler
Electronic
Suppression
Fire alarms, mass notification, hospital nurse call, integrated systems
Sprinklers, engineered solutions, special hazards, water spray, foam, gas systems
Gain contracting market share Increase conversion from contracting to service
Electronic Sprinkler Suppression
Focus on selling higher margin projectsImprove project executionImprove mix between contracting and service
Sell product line into fire alarm and sprinkler customer base
Increase Service Mix in All Product Lines
Tyco_International_SHOW_FILE_FINAL.ppt
December 5, 2007
27
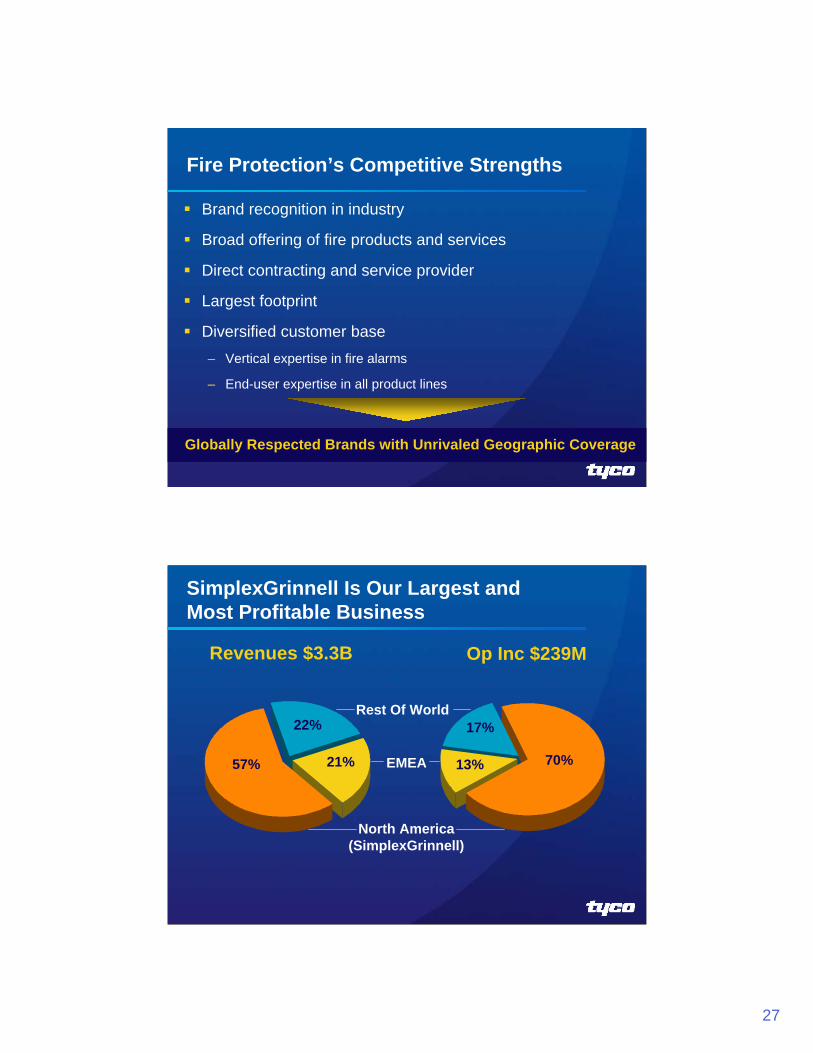
Brand recognition in industry
Broad offering of fire products and services
Direct contracting and service provider
Largest footprint
Diversified customer base– Vertical expertise in fire alarms
– End-user expertise in all product lines
Fire Protection’s Competitive Strengths
Globally Respected Brands with Unrivaled Geographic Coverage
Revenues $3.3B Op Inc $239M
North America(SimplexGrinnell)
Rest Of World
EMEA
22%
21%57% 13%
17%
70%
SimplexGrinnell Is Our Largest and Most Profitable Business
Tyco_International_SHOW_FILE_FINAL.ppt
December 5, 2007
28
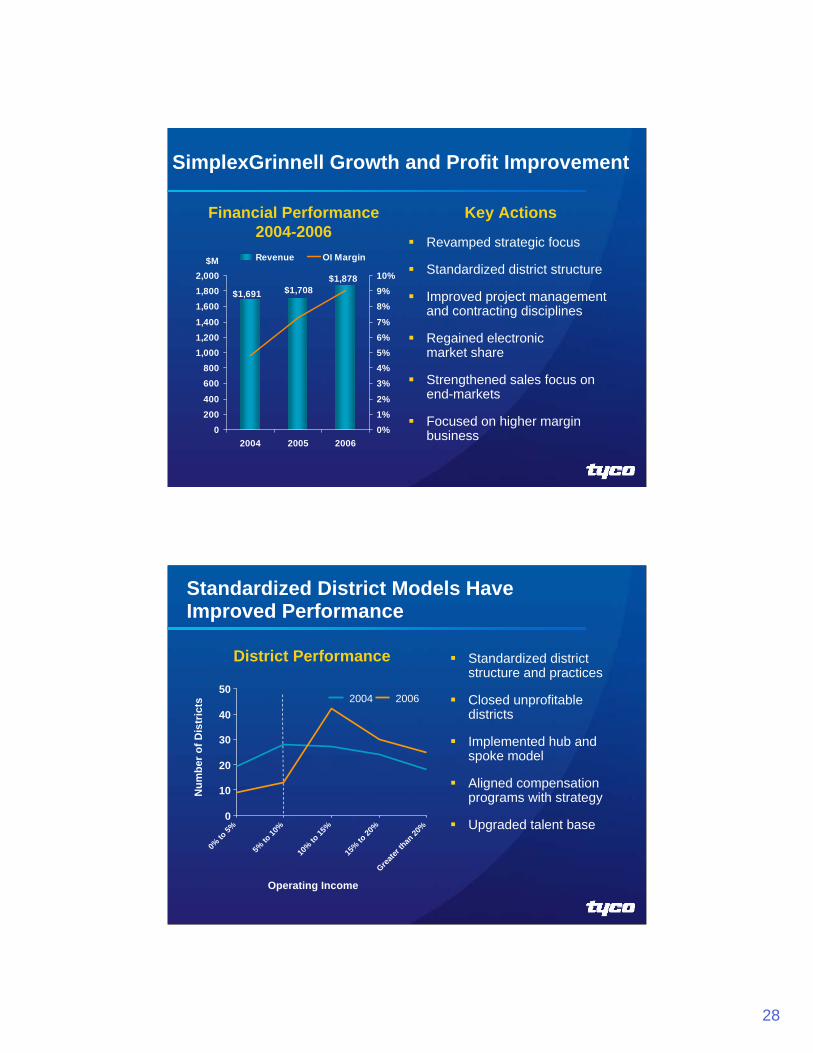
SimplexGrinnell Growth and Profit Improvement
Revamped strategic focus
Standardized district structure
Improved project management and contracting disciplines
Regained electronic market share
Strengthened sales focus on end-markets
Focused on higher margin business
$1,691$1,878
$1,708
0200400
600800
1,0001,2001,400
1,6001,8002,000
2004 2005 20060%1%2%
3%4%5%6%7%
8%9%10%
Revenue OI Margin$M
Key ActionsFinancial Performance2004-2006
Standardized District Models Have Improved Performance
Standardized district structure and practices
Closed unprofitable districts
Implemented hub and spoke model
Aligned compensation programs with strategy
Upgraded talent base0
0% to
5%
District Performance
10
20
30
40
50
5% to
10%
10% to
15%
15% to
20%
Greater
than
20%
Operating Income
Num
ber o
f Dis
tric
ts 2004 2006
Tyco_International_SHOW_FILE_FINAL.ppt
December 5, 2007
29
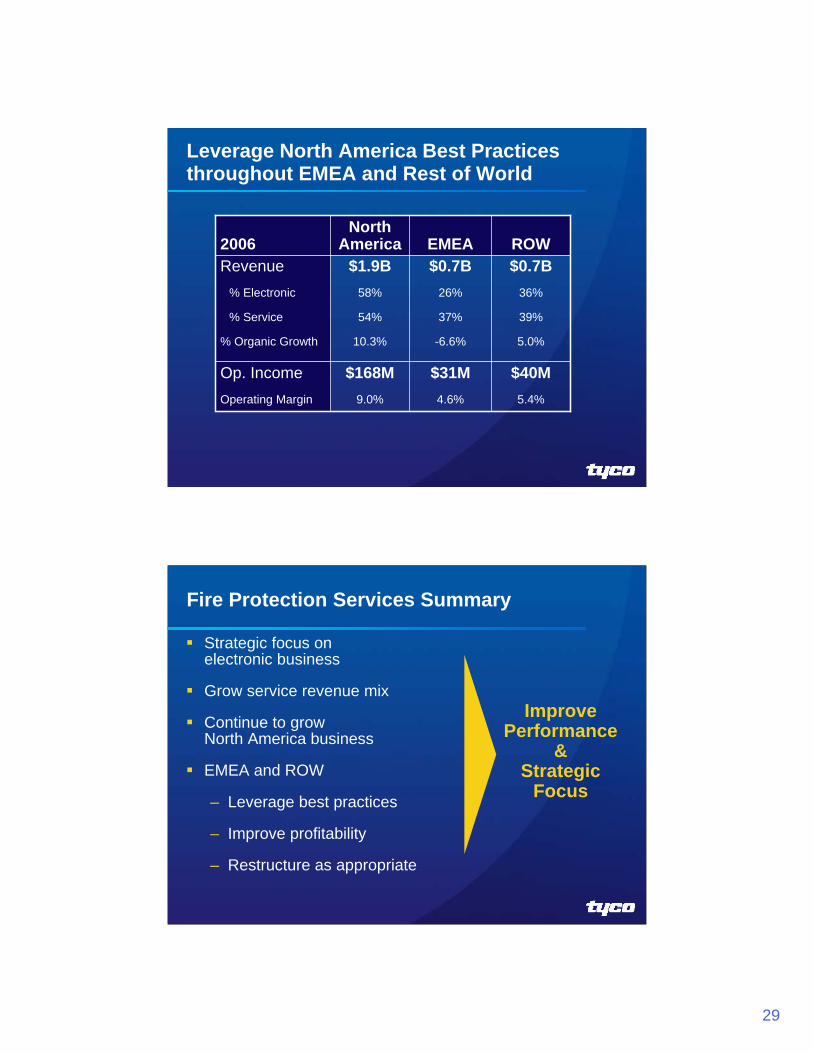
Leverage North America Best Practices throughout EMEA and Rest of World
$40M5.4%
$0.7B36%
39%
5.0%
ROW
$31M4.6%
$168M9.0%
Op. IncomeOperating Margin
$0.7B26%
37%
-6.6%
$1.9B58%
54%
10.3%
Revenue% Electronic
% Service
% Organic Growth
EMEANorth
America2006
Improve Performance
& Strategic
Focus
Fire Protection Services Summary
Strategic focus on electronic business
Grow service revenue mix
Continue to grow North America business
EMEA and ROW
– Leverage best practices
– Improve profitability
– Restructure as appropriate
Tyco_International_SHOW_FILE_FINAL.ppt
December 5, 2007
30
Tyco Safety ProductsAttractive Growth and Margin Outlook
George OliverPresident, Tyco Safety Products
Tyco Safety Products at a Glance
2006 Revenue of $1.7B
2006 Operating Income* of $202M
38 manufacturing facilities
– 14 in North America
– 19 in Europe
– 5 in Asia Pacific
10,000 employees worldwide
Customers in over 100 countriesAmericas
66%
Asia Pacific
9%
Europe25%
Sales by Geography
Strong Market Position with Leading Technologies*FY 06 operating income includes a $100M charge for a voluntary replacement program for sprinkler heads in the Fire Suppression business
Tyco_International_SHOW_FILE_FINAL.ppt
December 5, 2007
31
Tyco Safety Products Consists of Three Platforms
Electronic Security
Fire Suppression
Life Safety
Protecting people and valuable assets from the threat of fires
Securing homes and businesses from unauthorized intrusions
Protecting our firefighters so they can protect you
Revenue: $361MOrganic Growth: -11.0%
Revenue: $903MOrganic Growth: 8.3%
Safety Products Participates in Attractive Markets with Strong Financial Returns
Life Safety
Fire Suppression
Market: ~2.9BExpected Market
Growth 3-5%
Market: ~3.1BExpected Market
Growth 3%
Electronic Security
Revenue: $411MOrganic Growth: 8.4%
Market: ~9.3BExpected MarketGrowth 8-10%
Safety Products Market Share
Operating Margin in the Mid to High TeensSource: Frost & Sullivan, JP Freeman, Freedonia and Management Estimates
Tyco_International_SHOW_FILE_FINAL.ppt
December 5, 2007
32
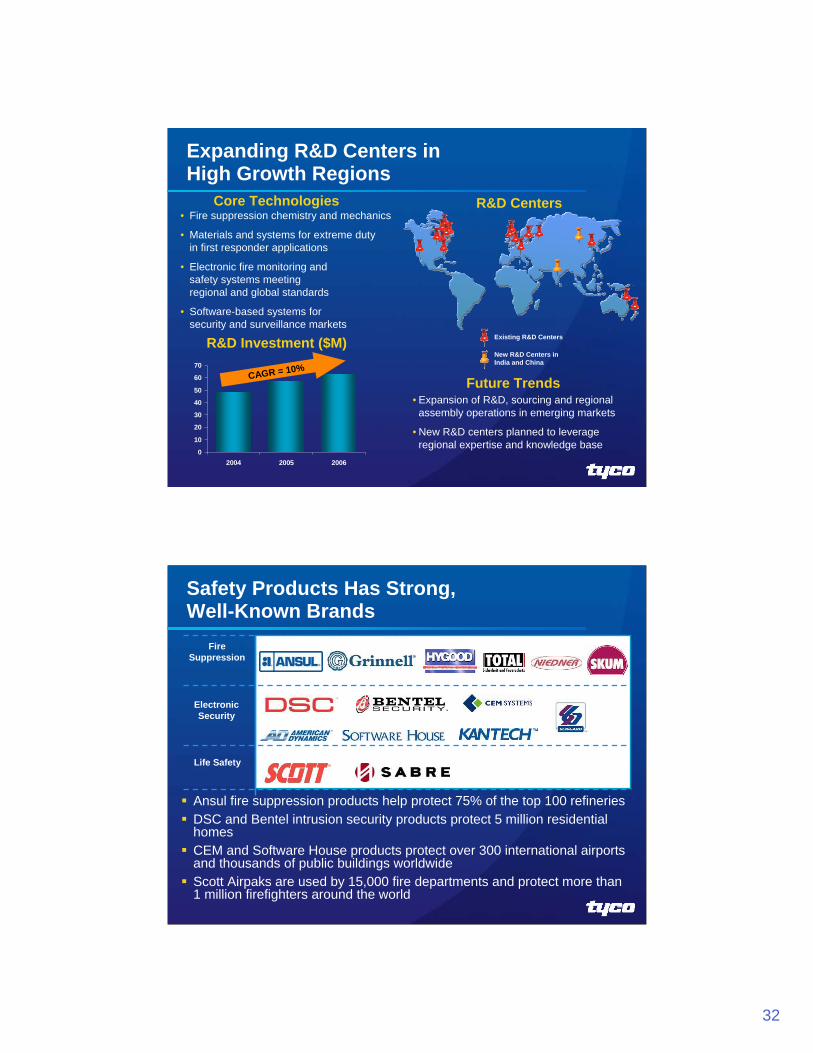
Expanding R&D Centers in High Growth Regions
Core Technologies R&D Centers
Future Trends
• Fire suppression chemistry and mechanics
• Materials and systems for extreme duty in first responder applications
• Electronic fire monitoring and safety systems meeting regional and global standards
• Software-based systems for security and surveillance markets
• Expansion of R&D, sourcing and regional assembly operations in emerging markets
• New R&D centers planned to leverage regional expertise and knowledge base
0
10
20
30
40
50
60
70
2004 2005 2006
R&D Investment ($M) Existing R&D Centers
New R&D Centers inIndia and China
CAGR = 10%
Ansul fire suppression products help protect 75% of the top 100 refineriesDSC and Bentel intrusion security products protect 5 million residential homesCEM and Software House products protect over 300 international airports and thousands of public buildings worldwideScott Airpaks are used by 15,000 fire departments and protect more than 1 million firefighters around the world
Fire Suppression
Life Safety
Electronic Security
Safety Products Has Strong, Well-Known Brands
Tyco_International_SHOW_FILE_FINAL.ppt
December 5, 2007
33
Fire Suppression Products: A Broad Product Capability
High Expansion Foam
Sprinklers PortableExtinguishers
Clean Agent Suppression SystemsEngineered Systems
e.g., Restaurant
Number 1 in Fire Suppression SystemsSource: IMS Research, Frost & Sullivan, Preston Pipe Reports, MFMA, SFA, CPTI 2006 Annual Report and Management Estimates
Fire Suppression
~$2.9B Market3-5% market growth rate
Water56%
Portable17%
Pre-Engineered
Systems8%
Eng. Systems
8%
Foam6%
Other5%
Strategic OpportunitiesHigh growth in niche markets; e.g., petrochemical and militaryResidential sprinklers driven by codeHomeland security spendAsia, Eastern Europe and Latin America growth
Market Share 2006 Revenue $903M
Source: Frost & Sullivan, JP Freeman and Management Estimates
Tyco_International_SHOW_FILE_FINAL.ppt
December 5, 2007
34
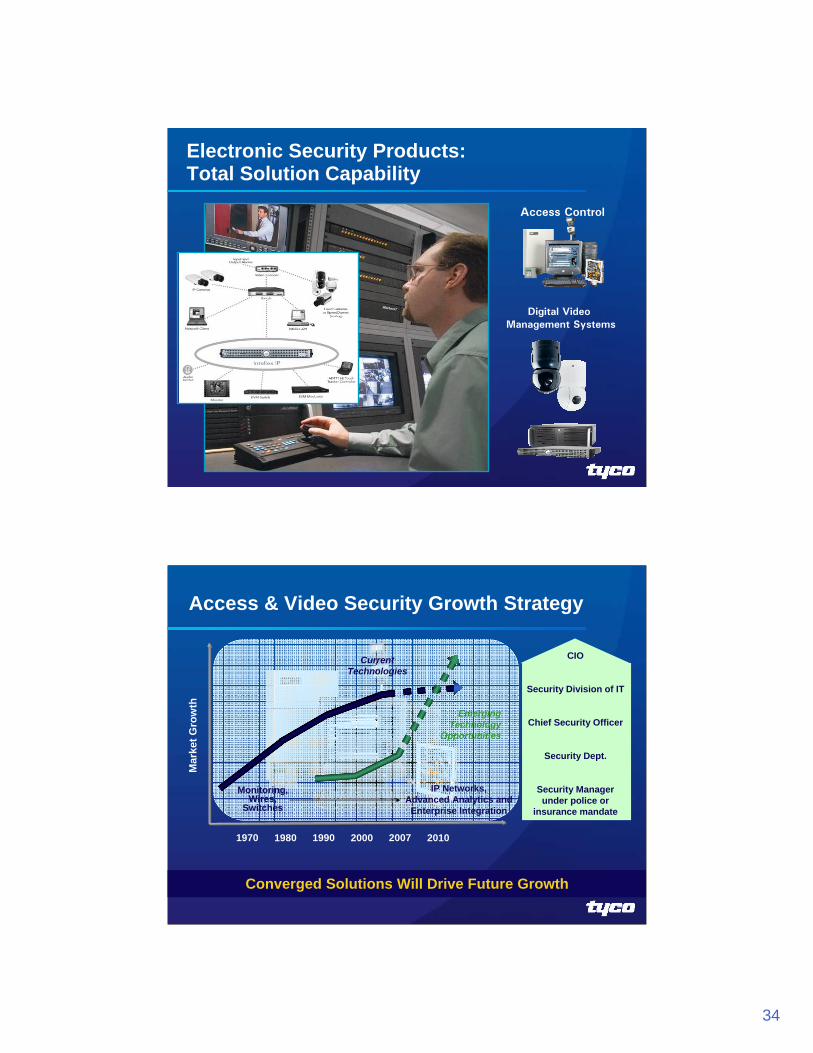
Electronic Security Products: Total Solution Capability
Access Control
Digital Video Management Systems
Converged Solutions Will Drive Future Growth
Current Technologies
Emerging Technology
Opportunities
1970 1980 1990 2000 2007 2010
Monitoring, Wires,
Switches
IP Networks, Advanced Analytics and
Enterprise Integration
Mar
ket G
row
th
CIO
Security Division of IT
Chief Security Officer
Security Dept.
Security Manager under police or
insurance mandate
Access & Video Security Growth Strategy
Tyco_International_SHOW_FILE_FINAL.ppt
December 5, 2007
35
Other18%
Access Control
19%Intrusion Security
39%
Video24%
Electronic Security
~$9.3B Market
8-10% market growth rate
Strategic OpportunitiesInternet-based building management systems – Enterprise integrationVideo analyticsConvergence of physical and logical securityProcess control applications
Market Share 2006 Revenue $411M
Source: Freedonia and Management Estimates
Life Safety Products:Highly Respected Products and Brands
Self-Contained Breathing Apparatus (SCBA)
Gas Detection
Thermal Imaging
A Leader in Self-Contained Breathing Apparatus and Personal Protective Equipment
Tyco_International_SHOW_FILE_FINAL.ppt
December 5, 2007
36
Compressors 3%Instruments
3%Personal
Protection9%
Air Purification20%
Self -Contained Breathing Apparatus
65%
Life Safety Products
~$3.1B Market
3% market growth rate
Strategic OpportunitiesHigh growth in military, petrochemical and mining markets
Emerging markets focus on worker safety
Growth market in the Middle East
Market Share 2006 Revenue $361M
Source: Frost & Sullivan and Management Estimates
3 Key Initiatives to Accelerate Growthand Profitability
Vertical marketsGlobal customersEmerging marketsUpgrading and expanding global sales force
Integrated technology platformsGlobal centers of excellenceValue re-engineering/Six SigmaInnovation/strategic acquisitions
Lean/Six SigmaRestructuring…20 projectsManufacturing and back-office consolidationCustomer satisfaction/on-time delivery
Commercial Excellence
Technology Leadership
Operational Excellence
Tyco_International_SHOW_FILE_FINAL.ppt
December 5, 2007
37
Safety Products Summary
Positioned well in attractive growth markets
Strong market position with industry leading brands
Proven technology leadership in fire suppression, life safety and electronic security
Deep technology pipeline
Expanding manufacturing, distribution and sales coverage
Positioning for strong growth in the emerging markets
Tyco Electrical & Metal ProductsLeveraging a Strong Market Position
George OliverPresident, Tyco Safety Products
Tyco_International_SHOW_FILE_FINAL.ppt
December 5, 2007
38
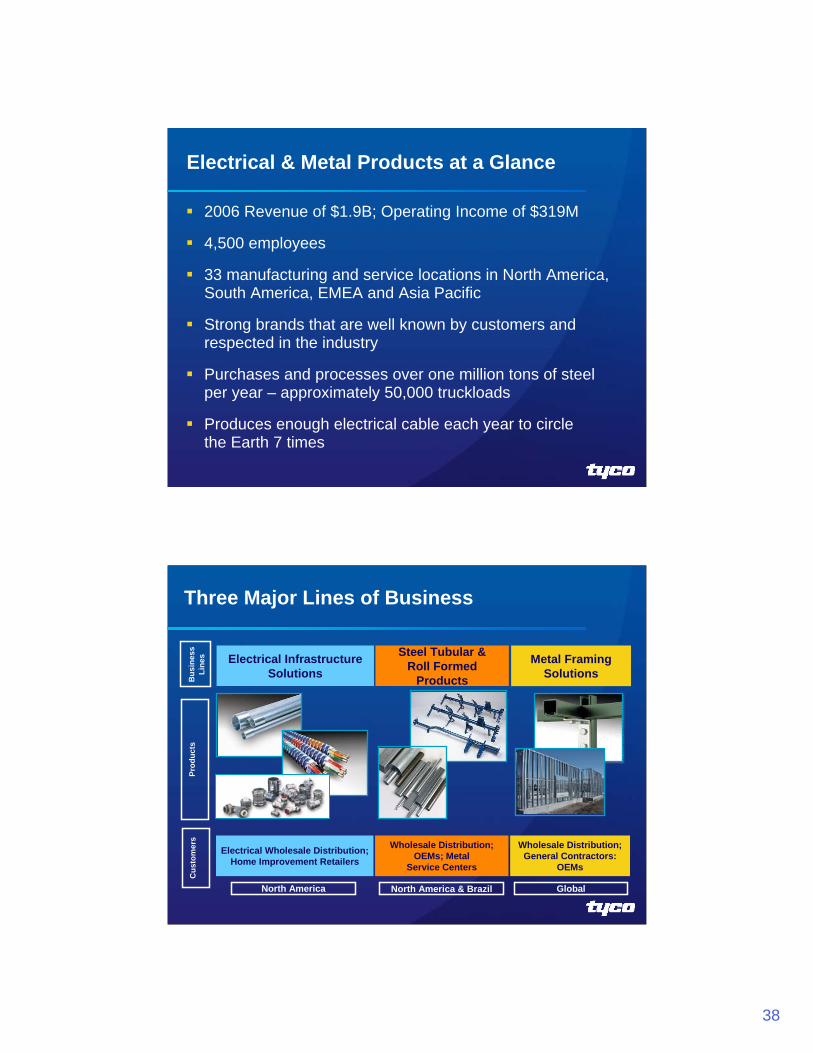
Electrical & Metal Products at a Glance
2006 Revenue of $1.9B; Operating Income of $319M
4,500 employees
33 manufacturing and service locations in North America, South America, EMEA and Asia Pacific
Strong brands that are well known by customers and respected in the industry
Purchases and processes over one million tons of steel per year – approximately 50,000 truckloads
Produces enough electrical cable each year to circle the Earth 7 times
Three Major Lines of Business
Electrical Infrastructure Solutions
Steel Tubular & Roll Formed
Products
Metal Framing Solutions
North America
Bus
ines
sLi
nes
Prod
ucts
Cus
tom
ers
Electrical Wholesale Distribution; Home Improvement Retailers
Wholesale Distribution; OEMs; Metal
Service Centers
Wholesale Distribution; General Contractors:
OEMs
North America & Brazil Global
Tyco_International_SHOW_FILE_FINAL.ppt
December 5, 2007
39
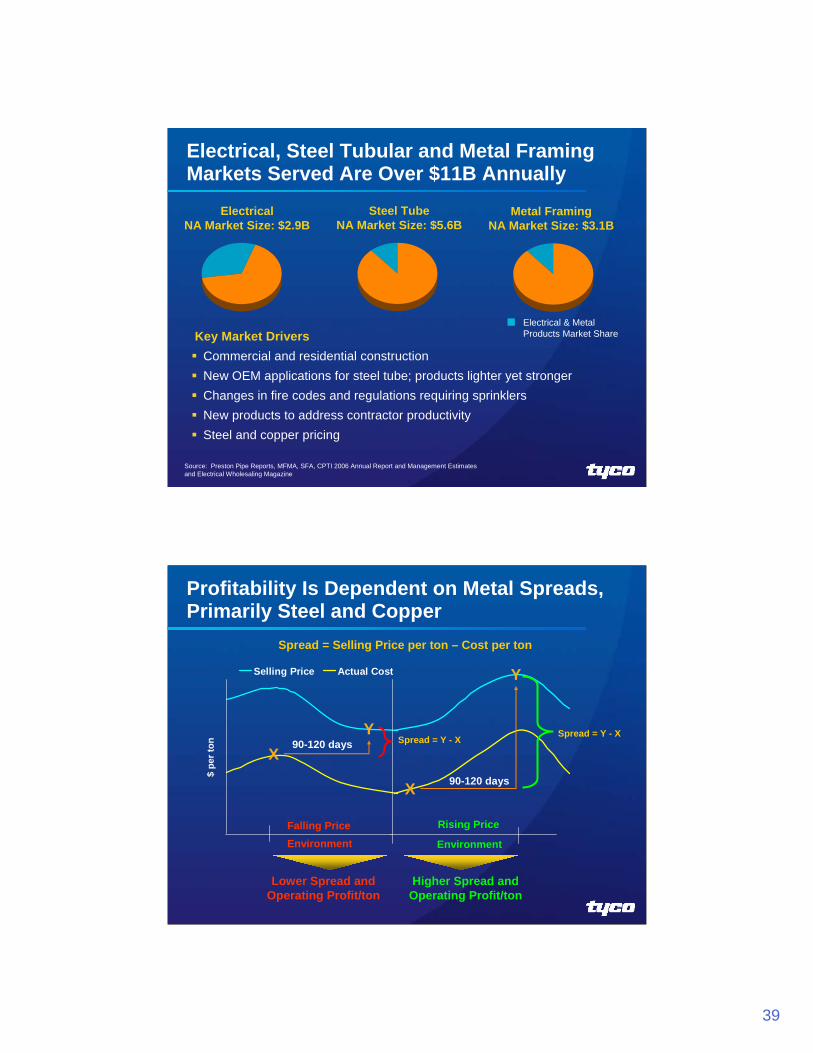
Electrical, Steel Tubular and Metal Framing Markets Served Are Over $11B Annually
Key Market DriversCommercial and residential constructionNew OEM applications for steel tube; products lighter yet strongerChanges in fire codes and regulations requiring sprinklersNew products to address contractor productivitySteel and copper pricing
Steel TubeNA Market Size: $5.6B
Metal FramingNA Market Size: $3.1B
Electrical & Metal Products Market Share
Source: Preston Pipe Reports, MFMA, SFA, CPTI 2006 Annual Report and Management Estimates and Electrical Wholesaling Magazine
ElectricalNA Market Size: $2.9B
Profitability Is Dependent on Metal Spreads, Primarily Steel and Copper
Spread = Selling Price per ton – Cost per ton
Selling Price Actual Cost
Falling PriceEnvironment
Lower Spread and Operating Profit/ton
90-120 daysX
Y
$ pe
r ton
Rising Price
Environment
Higher Spread and Operating Profit/ton
90-120 daysX
Y
Spread = Y - X Spread = Y - X
Tyco_International_SHOW_FILE_FINAL.ppt
December 5, 2007
40
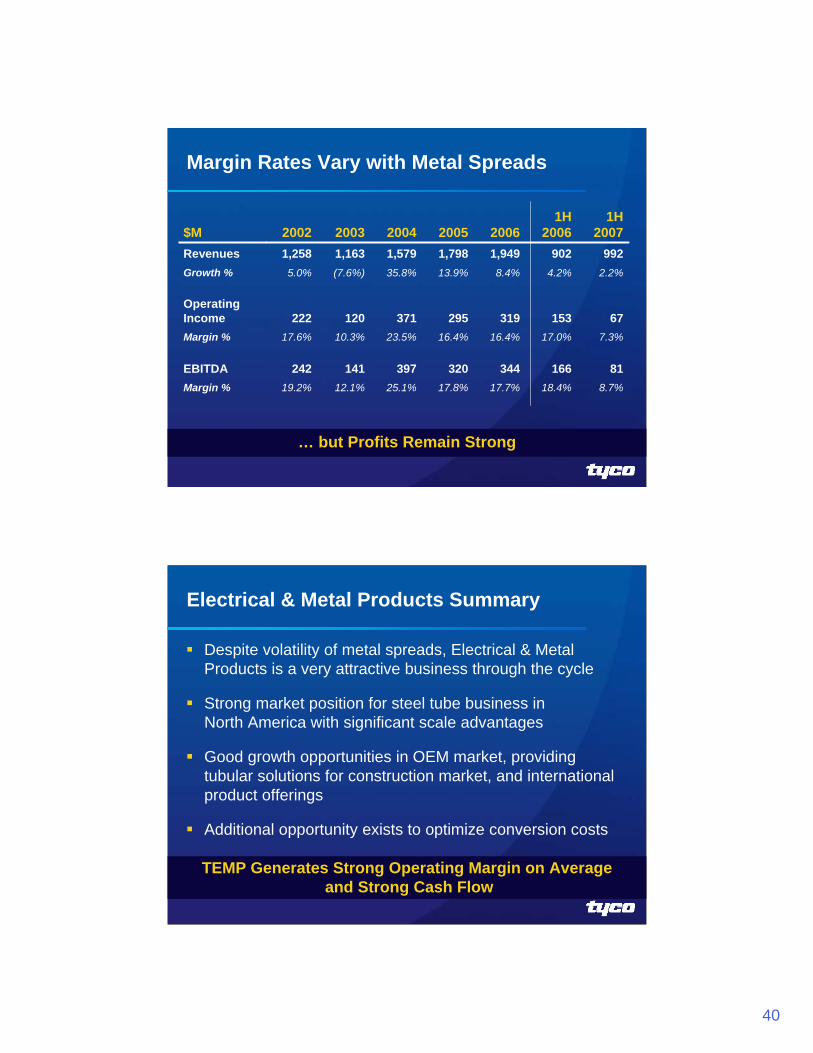
Margin Rates Vary with Metal Spreads
… but Profits Remain Strong
18.4%
166
17.0%
153
4.2%
902
1H 2006
17.7%
344
16.4%
319
8.4%
1,9492006
17.8%
320
16.4%
295
13.9%
1,7982005
12.1%
141
10.3%
120
(7.6%)
1,1632003
19.2%
242
17.6%
222
5.0%
1,2582002
25.1%
397
23.5%
371
35.8%
1,5792004
8.7%
81
7.3%
67
2.2%
992
1H 2007
Margin %
EBITDA
Margin %
Operating Income
Growth %
Revenues$M
TEMP Generates Strong Operating Margin on Averageand Strong Cash Flow
Electrical & Metal Products Summary
Despite volatility of metal spreads, Electrical & Metal Products is a very attractive business through the cycle
Strong market position for steel tube business in North America with significant scale advantages
Good growth opportunities in OEM market, providing tubular solutions for construction market, and international product offerings
Additional opportunity exists to optimize conversion costs
Tyco_International_SHOW_FILE_FINAL.ppt
December 5, 2007
41
Tyco Flow Control Expanding On Our Market Leadership
Patrick DeckerPresident, Tyco Flow Control
Tyco Flow Control at a Glance
2006 Revenue of $3.1B– Organic revenue growth of 13.2%
2006 Operating Income of $356M; Operating Margin of 11.4%
14,700 employees
100+ manufacturing and service locations in 24 countries
Well-known brands with strong positions
Our valves work:– At minus 320oF to plus 932oF
– In a vacuum and at 15,000 psi pressure
– In skyscrapers to gold mines to airplanes to submarines
Tyco_International_SHOW_FILE_FINAL.ppt
December 5, 2007
42
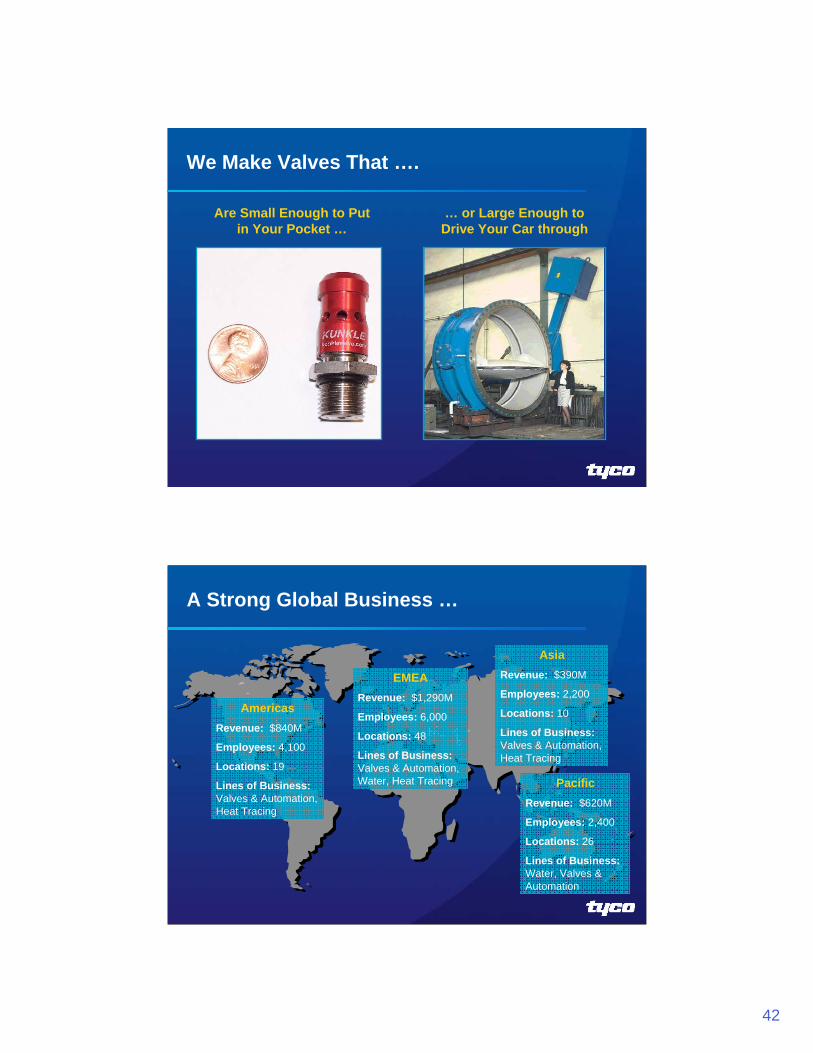
We Make Valves That ….
… or Large Enough to Drive Your Car through
Are Small Enough to Put in Your Pocket …
A Strong Global Business …
AmericasRevenue: $840M
Employees: 4,100
Locations: 19
Lines of Business:Valves & Automation, Heat Tracing
EMEARevenue: $1,290M
Employees: 6,000
Locations: 48
Lines of Business:Valves & Automation, Water, Heat Tracing
AsiaRevenue: $390M
Employees: 2,200
Locations: 10
Lines of Business:Valves & Automation, Heat Tracing
PacificRevenue: $620M
Employees: 2,400
Locations: 26
Lines of Business:Water, Valves & Automation
Tyco_International_SHOW_FILE_FINAL.ppt
December 5, 2007
43
… Serving a Broad Range of Customers
Oil & GasRefiningPower Generation
Chemical & PharmaceuticalMarineFood & BeverageMining & Mineral Processing
StorageTreatmentDistribution
Kellogg Brown & Root
Ener
gyEn
ergy
Proc
ess
Proc
ess
Wat
erW
ater
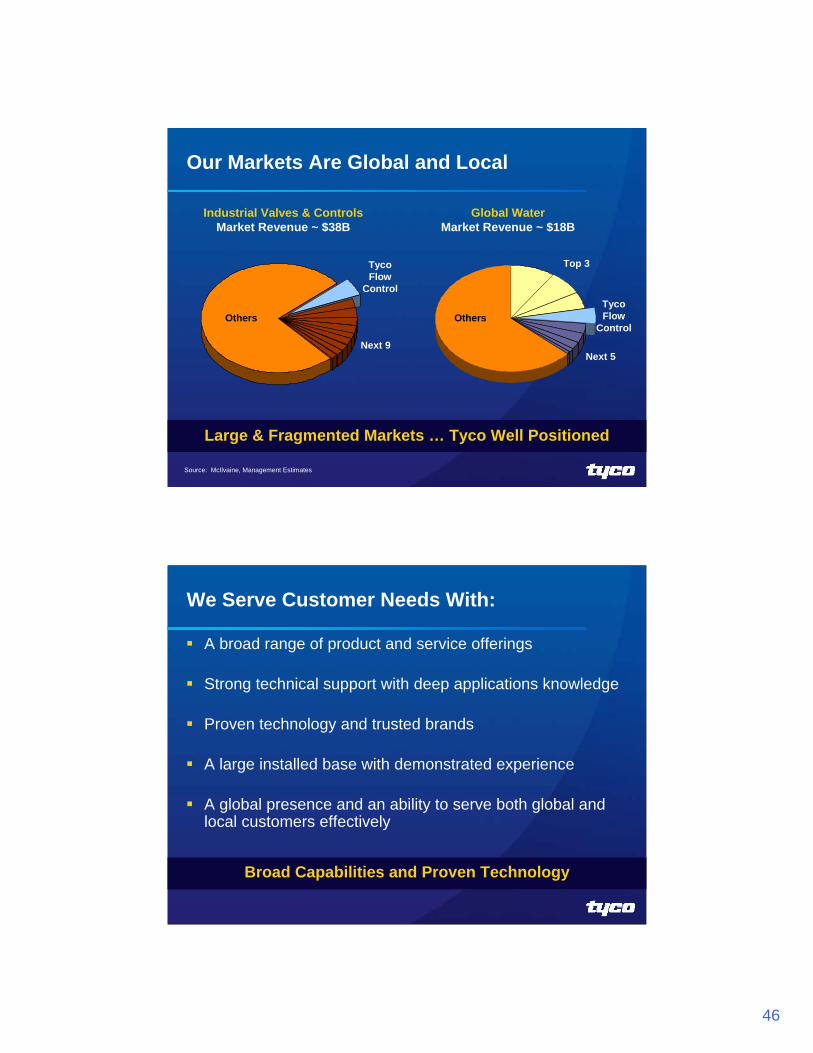
The Global Energy Market Is Over $18 Billion
Market Size = $18.2B Key Market DriversOil & Gas
Strong project growth over next 3-5 years (exploration and production)Capacity additions and upgrades to existing installed base
RefiningSignificant refining project activity in emerging marketsContinued expansion of existing infrastructure in traditional markets
PowerNew fossil plants in emerging markets like China and IndiaReplacement of nuclear power plants with fossil capacity in Europe
Source: McIlvaine
Tyco 2006 Revenue = $1.2B
Power $5.4B
Refining $5.7B
Oil & Gas
$7.1B
Tyco_International_SHOW_FILE_FINAL.ppt
December 5, 2007
44
An Average* Refinery Represents Market Opportunity Greater Than $140M
Heat TracingGlobe Valves
Rotary Valves Valve Automation
* Management estimate for 150,000 barrels per day operation
Market Size = $19.3B
The Process Industry Market Is Over $19 Billion
Key Market Drivers
ChemicalsSignificant capacity additions in AsiaContinued MRO opportunities in EMEA and North America
MarineLiquefied Natural Gas (LNG) and Floating Production, Storage and Offloading (FPSO) tankers fueling market growth
Mining & Mineral ProcessingScarcity of basic materials leading to heavy investment in mining
Food & BeverageSignificant opportunity in dairy, sugar, and beverage markets
$19.3B
$22.2B
5% CAGR
2006 2009Source: McIlvaine*Other includes Pulp & Paper, Iron & Steel, Semiconductors, Other Electronics, and Other Industries
Tyco 2006 Revenue = $1.0B
Other* $8.5B
Chem & Pharma$6.4B Mining &
Metals $1.6B
Food & Bev. $1.1B
Marine $1.7B
Tyco_International_SHOW_FILE_FINAL.ppt
December 5, 2007
45
The Water Market We Serve Is Over $18 Billion
Market Size = $18.3B Key Market Drivers
$18.3B
$22.1B
6% CAGR
2006 2009
Emerging economies build out basic water and wastewater systems
Developed countries are investing to maintain aging water infrastructure
Expanding regulation driving growth (e.g., EU Directives, EPA) in water and wastewater treatment
Uneven distribution of water resources requires significant Transmission & Distribution investment (e.g., Australia)
Source: McIlvaine, Freedonia, Global Industry Analysts, Inc.
Tyco 2006 Revenue = $0.9B
Pipes $12.4B
Valves$5.9B
Ductile Iron Pipe forDistribution Lines
Hydrants
Control Valves for Storage Management
Irrigation Systems
A Typical Water System Has Numerous Applications for Our Products
Strong technical support with deep applications knowledge
Proven technology and trusted brands
A large installed base with demonstrated experience
A global presence and an ability to serve both global and local customers effectively
Broad Capabilities and Proven Technology
Tyco_International_SHOW_FILE_FINAL.ppt
December 5, 2007
47
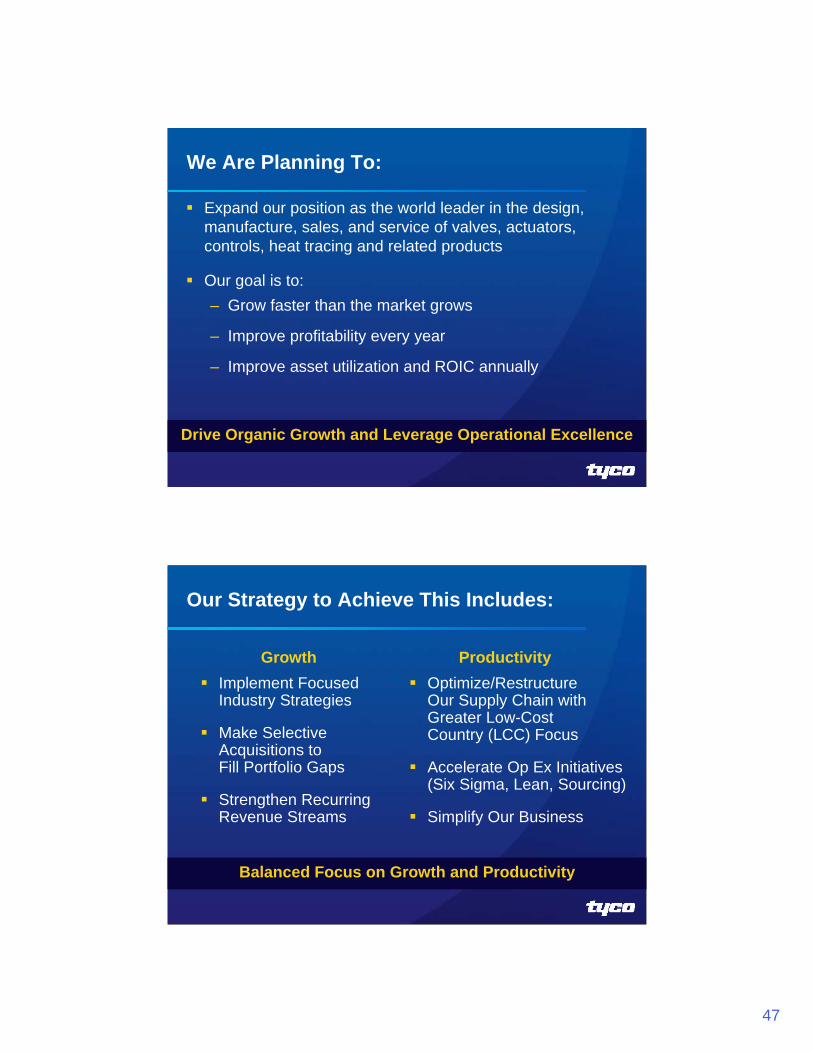
We Are Planning To:
Expand our position as the world leader in the design, manufacture, sales, and service of valves, actuators, controls, heat tracing and related products
Our goal is to:– Grow faster than the market grows
– Improve profitability every year
– Improve asset utilization and ROIC annually
Drive Organic Growth and Leverage Operational Excellence
Our Strategy to Achieve This Includes:
Implement Focused Industry Strategies
Make Selective Acquisitions to Fill Portfolio Gaps
Strengthen Recurring Revenue Streams
Optimize/Restructure Our Supply Chain with Greater Low-Cost Country (LCC) Focus
Accelerate Op Ex Initiatives (Six Sigma, Lean, Sourcing)
Simplify Our Business
Balanced Focus on Growth and Productivity
Growth Productivity
Tyco_International_SHOW_FILE_FINAL.ppt
December 5, 2007
48
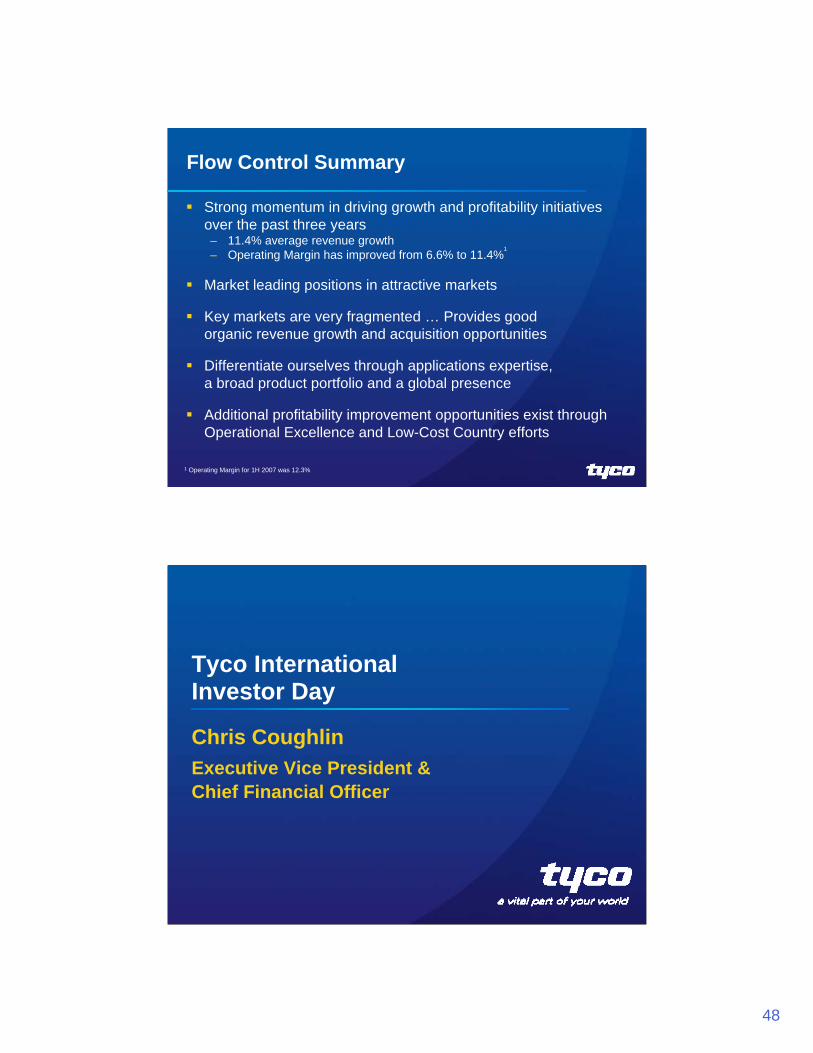
Flow Control Summary
Strong momentum in driving growth and profitability initiatives over the past three years– 11.4% average revenue growth– Operating Margin has improved from 6.6% to 11.4%
1
Market leading positions in attractive markets
Key markets are very fragmented … Provides good organic revenue growth and acquisition opportunities
Differentiate ourselves through applications expertise, a broad product portfolio and a global presence
Additional profitability improvement opportunities exist throughOperational Excellence and Low-Cost Country efforts
1 Operating Margin for 1H 2007 was 12.3%
Tyco International Investor Day
Chris CoughlinExecutive Vice President &Chief Financial Officer
Tyco_International_SHOW_FILE_FINAL.ppt
December 5, 2007
49
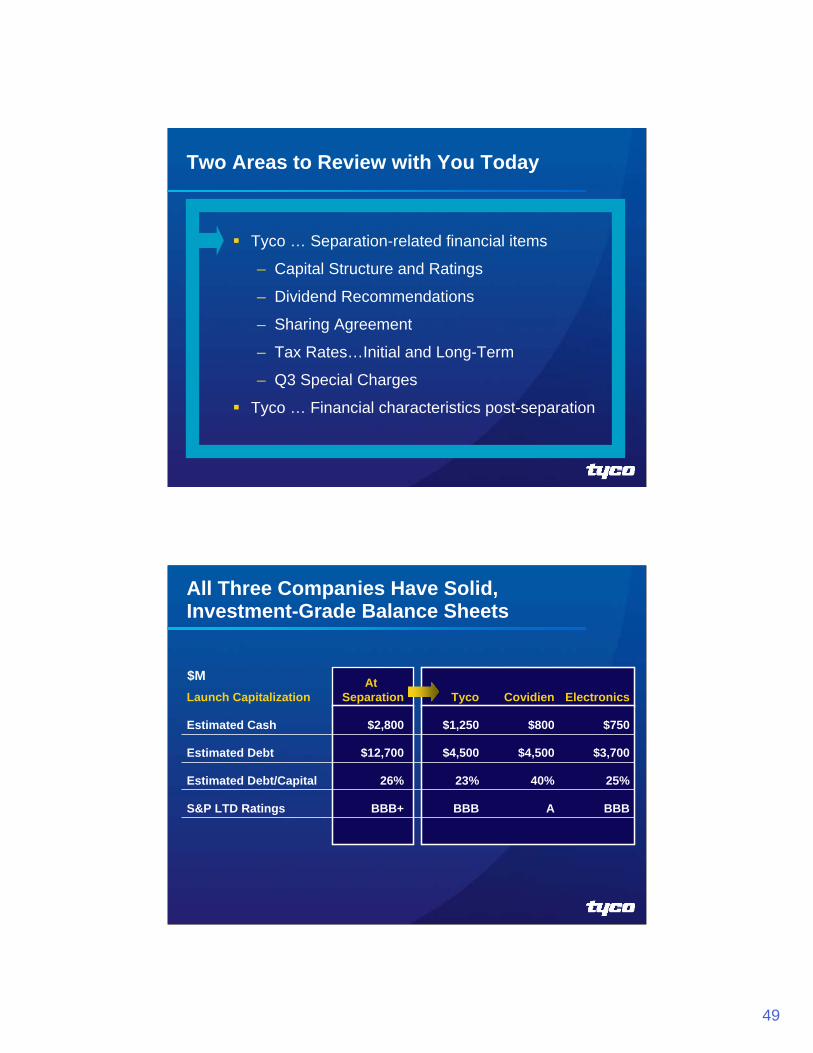
Two Areas to Review with You Today
Tyco … Separation-related financial items
– Capital Structure and Ratings
– Dividend Recommendations
– Sharing Agreement
– Tax Rates…Initial and Long-Term
– Q3 Special Charges
Tyco … Financial characteristics post-separation
25%40%23%26%Estimated Debt/Capital
BBBABBBBBB+S&P LTD Ratings
$3,700 $4,500 $4,500 $12,700 Estimated Debt
$750 $800 $1,250 $2,800 Estimated Cash
ElectronicsCovidienTycoAt
SeparationLaunch Capitalization
All Three Companies Have Solid, Investment-Grade Balance Sheets
$M
Tyco_International_SHOW_FILE_FINAL.ppt
December 5, 2007
50
Estimated Cash at Separation
($0.8)Legal Settlement
$2.8BEstimated Cash at Separation
($1.0)Separation Costs
($0.4)Dividend Payments
$1.0Estimated Cash Flow in Q3
$4.0BCash Balance at end of Q2 2007
Tyco$1.2B
Covidien$0.8B
Electronics$0.75B
The Current Dividend Will Initially Be Split Among All Three Companies
Currently, Tyco pays approximately $800M of dividends on a combined basis
Following the separation, we initially expect
– Covidien to pay ~$300M
– Tyco Electronics to pay ~$280M
– Tyco to pay ~$230M
Dividend policies to be determined by the Board of Directors for each company after the separation
Post-separation, we (TYC) anticipate paying a quarterly dividend of $0.11/share on new Tyco shares
Tyco_International_SHOW_FILE_FINAL.ppt
December 5, 2007
51
Certain Tax and Legal legacy items will be shared to facilitate resolution
Sharing Agreements cover Tyco contingent liabilities for tax liabilities and class action shareholder lawsuits existing prior to separation
Sharing percentage:
– Covidien – 42%
– Tyco Electronics – 31%
– Tyco – 27%
There Will Be Sharing Agreements for Tax & Legal Liabilities Among the Three Companies
An Example: Sharing Agreement on Historical Tax Liabilities
100%
27%
31%
42%
% as Per Agreement
$2,071M
$559M
$642M
$870M
Economic Impact
Total
Tyco
Electronics
Covidien
$0$2,071M
$289M$270M
($673M)$1,315M
$384M$486M
Payable/ (Receivable)
Legal Tax Liability
Tyco_International_SHOW_FILE_FINAL.ppt
December 5, 2007
52
31-34%Electronics
30-32%Covidien
22-25%Tyco
EstimatedPost-Separation
Estimated Effective Tax Ratesfor Each Company Post-Separation
Each Company Should Be Able to Reduce Their Tax Rates with Company-Specific Tax Planning
Due to the class action settlement, initial tax rates are expected to be at the higher end of the range
Longer-Term Goals
During Q3, We Expect to Incur Significant Special Charges
Class Action Settlement $2,975M
Separation Costs $900M
Restructuring Charges $200M and Impairments
Tyco_International_SHOW_FILE_FINAL.ppt
December 5, 2007
53
Two Areas to Review with You Today
Tyco … Separation-related financial items
– Capital Structure and Ratings
– Dividend Recommendations
– Sharing Agreement
– Tax Rates …Initial and Long-Term
– Q3 Special Charges
Tyco … Financial characteristics post-separation
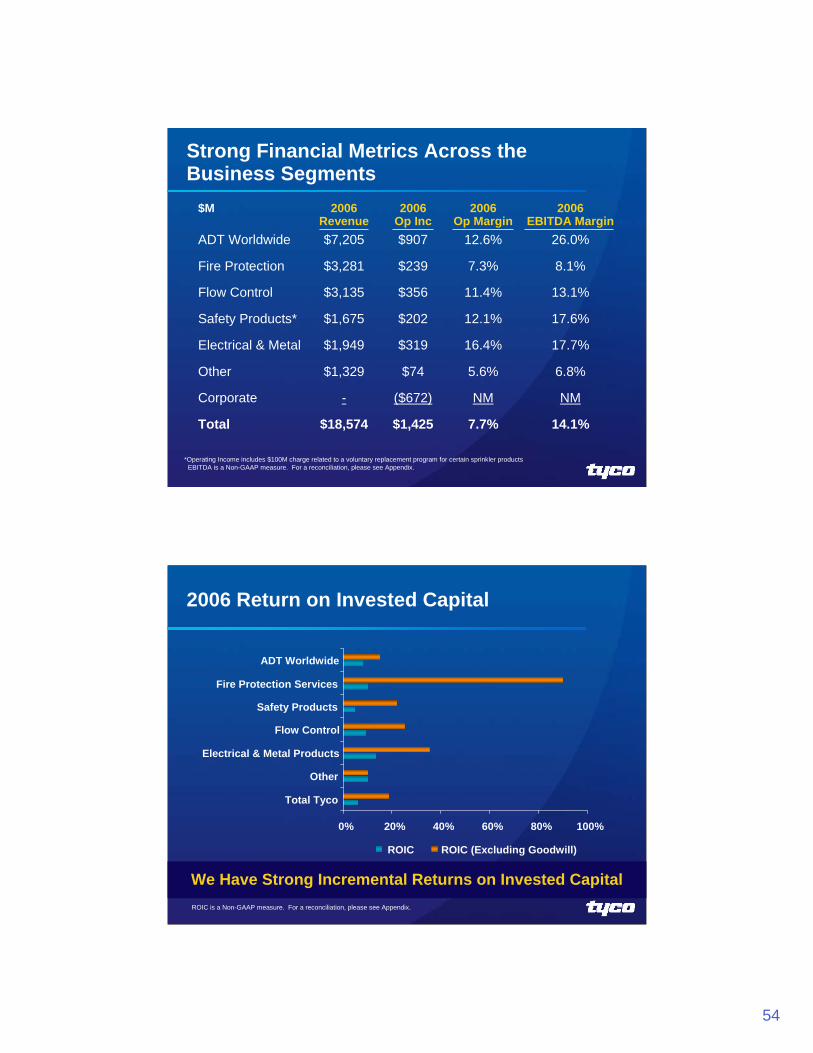
Tyco Is a $19 Billion Multi-Industry Company with $1.4 Billion in Operating Income and…
PF Revenue1 PF Operating Income1
$17.5
$18.6$18.0
10.011.012.013.014.015.016.017.018.019.020.0
2004 2005 2006
$952
$1,425$1,222
0
400
800
1,200
1,600
2004 2005 20060%
1%
2%
3%
4%
5%
6%
7%
8%OIMargin
$B $M Margin
CAGR = 3.2%
Revenue and Operating Income Have Improved Each Year1 2004-2006 Pro Forma revenue, operating income, and operating margin reflects the impact of Healthcare and Electronics as
Discontinued Operations in the periods presented.
Tyco_International_SHOW_FILE_FINAL.ppt
December 5, 2007
54
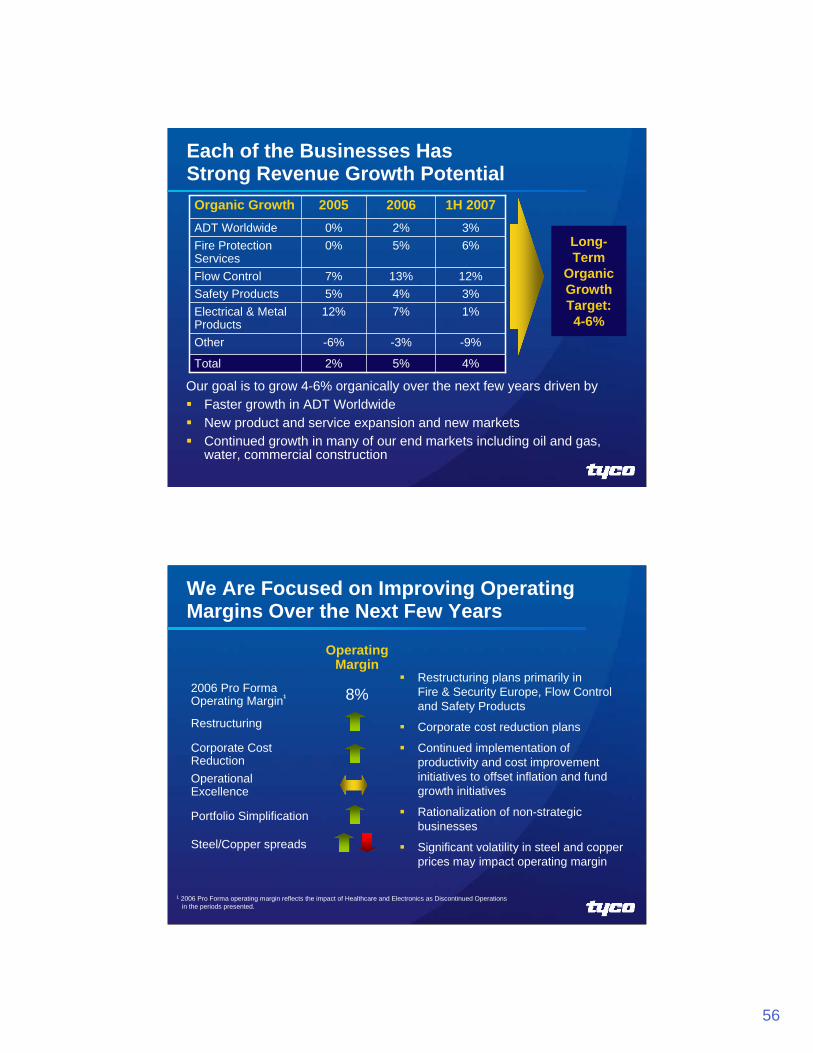
7.7%
NM
5.6%
16.4%
12.1%
11.4%
7.3%
12.6%
2006 Op Margin
$18,574
-
$1,329
$1,949
$1,675
$3,135
$3,281
$7,205
2006 Revenue
NM($672)Corporate
14.1%$1,425Total
6.8%$74Other
17.7%$319Electrical & Metal
17.6%$202Safety Products*
13.1%$356Flow Control
8.1%$239Fire Protection
26.0%$907ADT Worldwide
2006EBITDA Margin
2006 Op Inc
$M
Strong Financial Metrics Across the Business Segments
*Operating Income includes $100M charge related to a voluntary replacement program for certain sprinkler productsEBITDA is a Non-GAAP measure. For a reconciliation, please see Appendix.
2006 Return on Invested Capital
We Have Strong Incremental Returns on Invested CapitalROIC is a Non-GAAP measure. For a reconciliation, please see Appendix.
0% 20% 40% 60% 80% 100%
Total Tyco
Other
Electrical & Metal Products
Flow Control
Safety Products
Fire Protection Services
ADT Worldwide
ROIC ROIC (Excluding Goodwill)
Tyco_International_SHOW_FILE_FINAL.ppt
December 5, 2007
55
Interest Expense and Interest Income
Interest Expense
~$4.5B of Debt ~7.0%
Interest Income
~$1.25B Beginning Cash Balance ~4.0%
Interest on Shared Tax Liability
~$289M Liability to TEL and COV ~8.5%
EstimatedInterest Rate
Volatility from Electrical & Metal Products Can Have a Significant Impact on Earnings
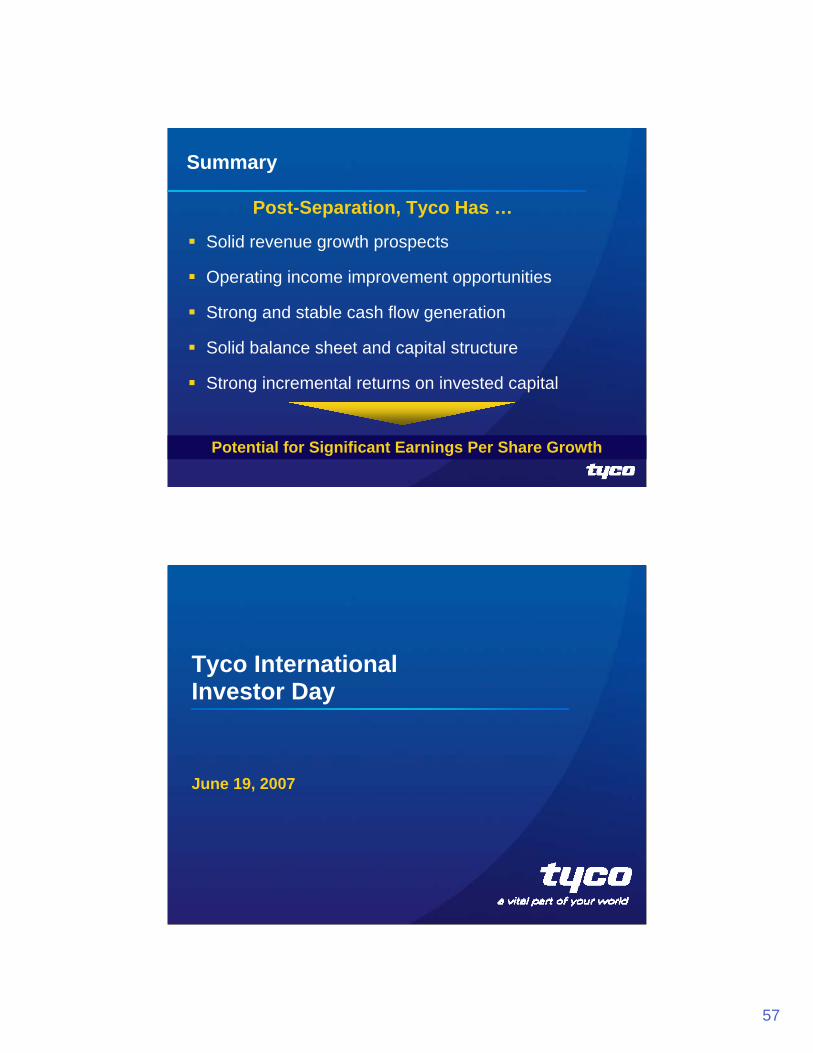
Each of the Businesses Has Strong Revenue Growth Potential
1%7%12%Electrical & Metal Products
5%
-3%
4%13%
5%2%
2006
-9%-6%Other
2%
5%7%
0%0%
2005
4%Total
3%Safety Products12%Flow Control
6%Fire Protection Services
3%ADT Worldwide
1H 2007Organic Growth
Our goal is to grow 4-6% organically over the next few years driven byFaster growth in ADT Worldwide New product and service expansion and new marketsContinued growth in many of our end markets including oil and gas, water, commercial construction
Long-Term
Organic Growth Target:4-6%
Operational Excellence
Portfolio Simplification
Steel/Copper spreads
Restructuring
Corporate Cost Reduction
8%2006 Pro Forma Operating Margin1
Operating Margin
We Are Focused on Improving Operating Margins Over the Next Few Years
Restructuring plans primarily in Fire & Security Europe, Flow Control and Safety Products
Corporate cost reduction plans
Continued implementation of productivity and cost improvement initiatives to offset inflation and fund growth initiatives
Rationalization of non-strategic businesses
Significant volatility in steel and copper prices may impact operating margin
1 2006 Pro Forma operating margin reflects the impact of Healthcare and Electronics as Discontinued Operations in the periods presented.
Tyco_International_SHOW_FILE_FINAL.ppt
December 5, 2007
57
Summary
Solid revenue growth prospects
Operating income improvement opportunities
Strong and stable cash flow generation
Solid balance sheet and capital structure
Strong incremental returns on invested capital
Post-Separation, Tyco Has …
Potential for Significant Earnings Per Share Growth


![PM 2014 investor day 2014-06-26-CEO Investor Day Slides [FINAL]](https://static.documents.pub/doc/80x56/577cbc651a28aba7118da313/pm-2014-investor-day-2014-06-26-ceo-investor-day-slides-final.jpg)


![PM 2014 investor day 2014-06-26-Operations Investor Day Slides [FINAL]](https://static.documents.pub/doc/80x56/577cbc651a28aba7118da314/pm-2014-investor-day-2014-06-26-operations-investor-day-slides-final.jpg)


